 filings.tools
Item 1. BUSINESS
83K characters. Original on sec.gov ·
Item 1. BUSINESS
Definitions of Abbreviations
| Xcel Energy Inc.’s Subsidiaries and Affiliates (current and former) | |||||
| Capital Services | Capital Services, LLC | ||||
| Eloigne | Eloigne Company | ||||
| e prime | e prime inc. | ||||
| NSP-Minnesota | Northern States Power Company, a Minnesota corporation | ||||
| NSP System | The electric production and transmission system of NSP-Minnesota and NSP-Wisconsin operated on an integrated basis and managed by NSP-Minnesota | ||||
| NSP-Wisconsin | Northern States Power Company, a Wisconsin corporation | ||||
| Operating companies | NSP-Minnesota, NSP-Wisconsin, PSCo and SPS | ||||
| PSCo | Public Service Company of Colorado | ||||
| SPS | Southwestern Public Service Co. | ||||
| Utility subsidiaries | NSP-Minnesota, NSP-Wisconsin, PSCo and SPS | ||||
| WGI | WestGas InterState, Inc. | ||||
| WYCO | WYCO Development, LLC | ||||
| Xcel Energy | Xcel Energy Inc. and its subsidiaries |
| Federal and State Regulatory Agencies | |||||
| CPUC | Colorado Public Utilities Commission | ||||
| DOC | Minnesota Department of Commerce | ||||
| DOE | United States Department of Energy | ||||
| DOT | United States Department of Transportation | ||||
| EPA | United States Environmental Protection Agency | ||||
| FERC | Federal Energy Regulatory Commission | ||||
| IRS | Internal Revenue Service | ||||
| MPSC | Michigan Public Service Commission | ||||
| MPUC | Minnesota Public Utilities Commission | ||||
| NDPSC | North Dakota Public Service Commission | ||||
| NERC | North American Electric Reliability Corporation | ||||
| NMPRC | New Mexico Public Regulation Commission | ||||
| NRC | Nuclear Regulatory Commission | ||||
| PHMSA | Pipeline and Hazardous Materials Safety Administration | ||||
| PSCW | Public Service Commission of Wisconsin | ||||
| PUCT | Public Utility Commission of Texas | ||||
| SEC | Securities and Exchange Commission | ||||
| TCEQ | Texas Commission on Environmental Quality |
| Electric, Purchased Gas and Resource Adjustment Clauses | |||||
| CIP | Conservation improvement program | ||||
| DSM | Demand side management | ||||
| ECA | Retail electric commodity adjustment | ||||
| FCA | Fuel clause adjustment | ||||
| GCA | Gas cost adjustment | ||||
| GUIC | Gas utility infrastructure cost rider | ||||
| PSIA | Pipeline system integrity adjustment | ||||
| RES | Renewable energy standard | ||||
| TCR | Transmission cost recovery |
| Other | |||||
| AFUDC | Allowance for funds used during construction | ||||
| ALJ | Administrative Law Judge | ||||
| ARO | Asset retirement obligation | ||||
| ASC | FASB Accounting Standards Codification | ||||
| ATM | At-the-market | ||||
| BART | Best available retrofit technology | ||||
| C&I | Commercial and Industrial | ||||
| CAGR | Corporate annual growth rate | ||||
| CapX2020 | Alliance of electric cooperatives, municipals and investor-owned utilities in the upper Midwest involved in a joint transmission line planning and construction effort | ||||
| CCR | Coal combustion residuals |
| CCR Rule | Final rule (40 CFR 257.50 - 257.107) published by the EPA regulating the management, storage and disposal of CCRs as a nonhazardous waste | ||||
| CDD | Cooling degree-days | ||||
| CEO | Chief executive officer | ||||
| CFO | Chief financial officer | ||||
| CIG | Colorado Interstate Gas Company, LLC | ||||
| COEO | Colorado Energy Office | ||||
| CON | Certificate of Need | ||||
| COVID-19 | Novel coronavirus | ||||
| CUB | Citizens Utility Board | ||||
| CWA | Clean Water Act | ||||
| CWIP | Construction work in progress | ||||
| D.C. Circuit | United States Court of Appeals for the District of Columbia Circuit | ||||
| DECON | Decommissioning method where radioactive contamination is removed and safely disposed of at a requisite facility or decontaminated to a permitted level | ||||
| DRIP | Dividend Reinvestment Program | ||||
| EEI | Edison Electric Institute | ||||
| EIP | Energy Impact Partners | ||||
| ELG | Effluent limitations guidelines | ||||
| EMANI | European Mutual Association for Nuclear Insurance | ||||
| EPS | Earnings per share | ||||
| ESG | Environmental, Social and Governance | ||||
| ETR | Effective tax rate | ||||
| EVs | Electric Vehicles | ||||
| FASB | Financial Accounting Standards Board | ||||
| Fifth Circuit | United States Court of Appeals for the Fifth Circuit | ||||
| FTR | Financial transmission right | ||||
| GAAP | Generally accepted accounting principles | ||||
| GE | General Electric | ||||
| GHG | Greenhouse gas | ||||
| HDD | Heating degree-days | ||||
| INPO | Institute of Nuclear Power Operations | ||||
| IPCC | Intergovernmental Panel on Climate Change | ||||
| IPP | Independent power producing entity | ||||
| ISO | Independent System Operator | ||||
| ITC | Investment Tax Credit | ||||
| LP&L | Lubbock Power & Light | ||||
| MEC | Mankato Energy Center | ||||
| MGP | Manufactured gas plant | ||||
| MISO | Midcontinent Independent System Operator, Inc. | ||||
| NAAQS | National Ambient Air Quality Standard | ||||
| Native load | Demand of retail and wholesale customers that a utility has an obligation to serve under statute or contract | ||||
| NAV | Net asset value | ||||
| NEIL | Nuclear Electric Insurance Ltd. | ||||
| NOL | Net operating loss | ||||
| NOPR | Notice of proposed rulemaking | ||||
| O&M | Operating and maintenance | ||||
| OAG | Minnesota Office of the Attorney General | ||||
| OATT | Open Access Transmission Tariff | ||||
| PFAS | Per- and PolyFluoroAlkyl Substances | ||||
| PI | Prairie Island nuclear generating plant | ||||
| Post-65 | Post-Medicare | ||||
| PPA | Purchased power agreement | ||||
| Pre-65 | Pre-Medicare | ||||
| PTC | Production tax credit | ||||
| REC | Renewable energy credit |
| ROE | Return on equity | ||||
| ROU | Right-of-use | ||||
| RTO | Regional Transmission Organization | ||||
| S&P | Standard & Poor’s Global Ratings | ||||
| SERP | Supplemental executive retirement plan | ||||
| SMMPA | Southern Minnesota Municipal Power Agency | ||||
| SO2 | Sulfur dioxide | ||||
| SPP | Southwest Power Pool, Inc. | ||||
| TCJA | 2017 federal tax reform enacted as Public Law No: 115-97, commonly referred to as the Tax Cuts and Jobs Act | ||||
| THI | Temperature-humidity index | ||||
| TO | Transmission owner | ||||
| TSR | Total shareholder return | ||||
| VaR | Value at Risk | ||||
| VIE | Variable interest entity |
| Measurements | |||||
| Bcf | Billion cubic feet | ||||
| KV | Kilovolts | ||||
| KWh | Kilowatt hours | ||||
| MMBtu | Million British thermal units | ||||
| MW | Megawatts | ||||
| MWh | Megawatt hours |
| Where to Find More Information |
Xcel Energy’s website address is www.xcelenergy.com. Xcel Energy makes available, free of charge through its website, its annual report on Form 10-K, quarterly reports on Form 10-Q, current reports on Form 8-K and all amendments to those reports filed or furnished pursuant to Section 13(a) or 15(d) of the Securities Exchange Act of 1934 as soon as reasonably practicable after the reports are electronically filed with or furnished to the SEC.
The SEC maintains an internet site that contains reports, proxy and information statements, and other information regarding issuers that file electronically at http://www.sec.gov. The information on Xcel Energy’s website is not a part of, or incorporated by reference in, this annual report on Form 10-K. Xcel Energy intends to make future announcements regarding Company developments and financial performance through its website, www.xcelenergy.com, as well as through press releases, filings with the SEC, conference calls and webcasts.
| Forward-Looking Statements |
Except for the historical statements contained in this report, the matters discussed herein are forward-looking statements that are subject to certain risks, uncertainties and assumptions. Such forward-looking statements, including those relating to 2022 EPS guidance, long-term EPS and dividend growth rate objectives, future sales, future expenses, future tax rates, future operating performance, estimated base capital expenditures and financing plans, projected capital additions and forecasted annual revenue requirements with respect to rider filings, expected rate increases to customers, expectations and intentions regarding regulatory proceedings, and expected impact on our results of operations, financial condition and cash flows of resettlement calculations and credit losses relating to certain energy transactions, as well as assumptions and other statements are intended to be identified in this document by the words “anticipate,” “believe,” “could,” “estimate,” “expect,” “intend,” “may,” “objective,” “outlook,” “plan,” “project,” “possible,” “potential,” “should,” “will,” “would” and similar expressions. Actual results may vary materially. Forward-looking statements speak only as of the date they are made, and we expressly disclaim any obligation to update any forward-looking information. The following factors, in addition to those discussed elsewhere in this Annual Report on Form 10-K for the fiscal year ended Dec. 31, 2021 (including risk factors listed from time to time by Xcel Energy Inc. in reports filed with the SEC, including “Risk Factors” in Item 1A of this Annual Report on Form 10-K hereto), could cause actual results to differ materially from management expectations as suggested by such forward-looking information: uncertainty around the impacts and duration of the COVID-19 pandemic, including potential workforce impacts resulting from vaccination requirements, quarantine policies or government restrictions, and sales volatility; operational safety, including our nuclear generation facilities and other utility operations; successful long-term operational planning; commodity risks associated with energy markets and production; rising energy prices and fuel costs; qualified employee work force and third-party contractor factors; violations of our Codes of Conduct; ability to recover costs; changes in regulation and subsidiaries’ ability to recover costs from customers; reductions in our credit ratings and the cost of maintaining certain contractual relationships; general economic conditions, including inflation rates, monetary fluctuations, supply chain constraints and their impact on capital expenditures and/or the ability of Xcel Energy Inc. and its subsidiaries to obtain financing on favorable terms; availability or cost of capital; our customers’ and counterparties’ ability to pay their debts to us; assumptions and costs relating to funding our employee benefit plans and health care benefits; our subsidiaries’ ability to make dividend payments; tax laws; effects of geopolitical events, including war and acts of terrorism; cyber security threats and data security breaches; seasonal weather patterns; changes in environmental laws and regulations; climate change and other weather; natural disaster and resource depletion, including compliance with any accompanying legislative and regulatory changes; costs of potential regulatory penalties; and regulatory changes and/or limitations related to the use of natural gas as an energy source.
| Overview |
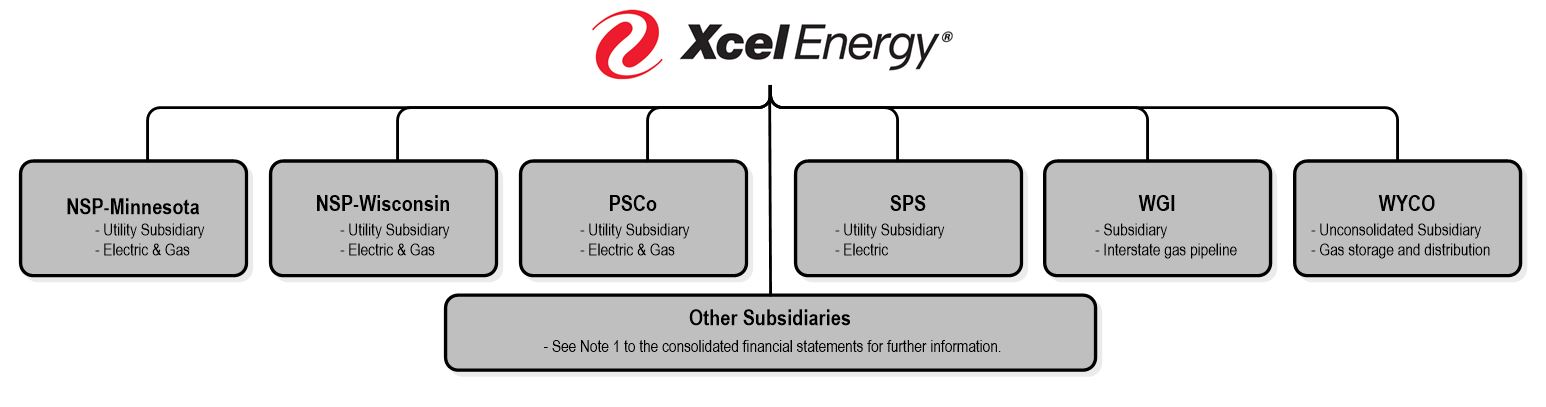
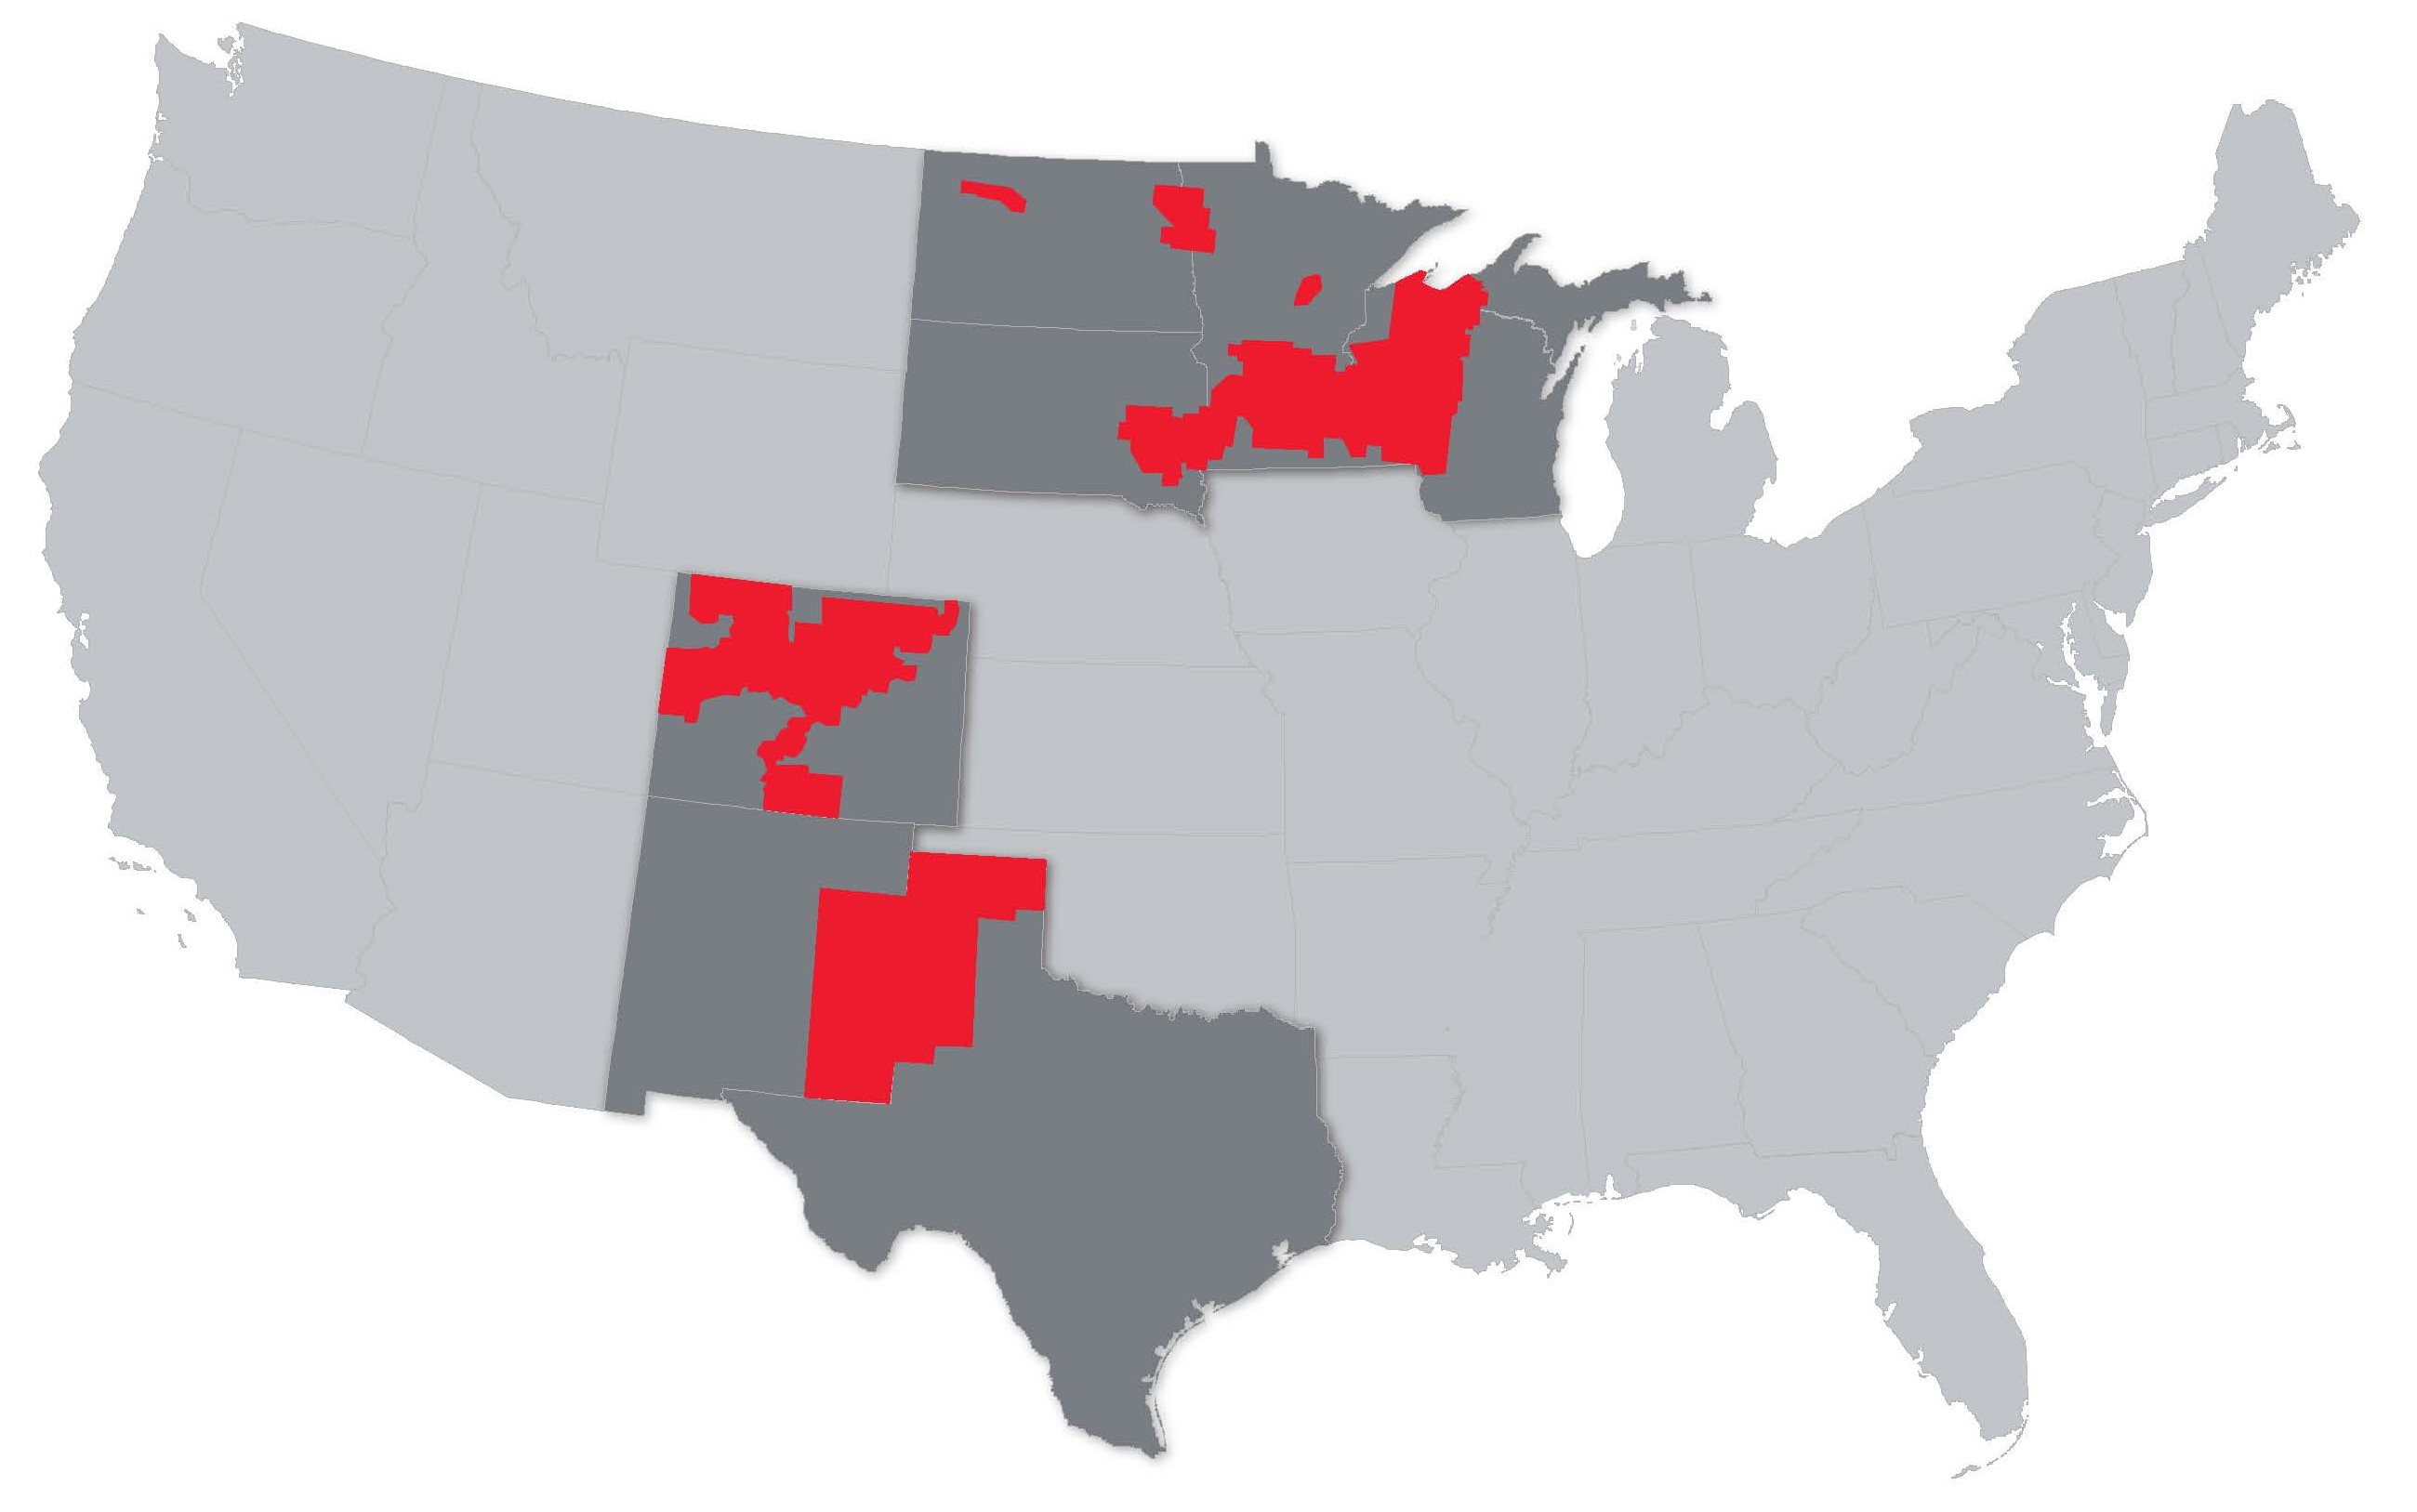
Xcel Energy (the “Company”) is a major U.S. regulated electric and natural gas delivery company headquartered in Minneapolis, Minnesota (incorporated in Minnesota in 1909). Xcel Energy serves customers in eight mid-western and western states, including portions of Colorado, Michigan, Minnesota, New Mexico, North Dakota, South Dakota, Texas and Wisconsin. Xcel Energy provides a comprehensive portfolio of energy-related products and services to approximately 3.7 million electric customers and 2.1 million natural gas customers through four utility subsidiaries (i.e., NSP-Minnesota, NSP-Wisconsin, PSCo and SPS). Along with the utility subsidiaries, the transmission-only subsidiaries, WYCO (a joint venture formed with CIG to develop and lease natural gas pipelines, storage and compression facilities) and WGI (an interstate natural gas pipeline company) comprise the regulated utility operations. Xcel Energy’s nonregulated subsidiaries include Eloigne, Capital Services, Venture Holdings and Nicollet Project Holdings.
| Utility Subsidiaries’ Service Territory | |||||||||||
 | |||||||||||
| Electric customers | 3.7 million | ||||||||||
| Natural gas customers | 2.1 million | ||||||||||
| Total assets | $57.9 billion | ||||||||||
| Electric generating capacity | 20,653 MW | ||||||||||
| Natural gas storage capacity | 53.4 Bcf | ||||||||||
| Electric transmission lines (conductor miles) | 111,434 miles | ||||||||||
| Electric distribution lines (conductor miles) | 210,470 miles | ||||||||||
| Natural gas transmission lines | 2,293 miles | ||||||||||
| Natural gas distribution lines | 36,510 miles | ||||||||||
| Strategy |
Xcel Energy strives to be the preferred and trusted provider of the energy our customers need, while offering a competitive total return to shareholders. We deliver on our vision through three strategic priorities:
| LEAD THE CLEAN ENERGY TRANSITION | ENHANCE THE CUSTOMER EXPERIENCE | KEEP BILLS LOW |
Sustainability is embedded in our strategy. We are retiring coal plants, adding renewables, exploring new technologies and helping to electrify other sectors, while maintaining customer affordability and supporting our employees and communities.
We are the first U.S. energy provider to set aggressive goals for reducing GHG emissions across three large sectors of the economy: electricity, natural gas use in buildings and transportation.
Our sustainability commitments include:
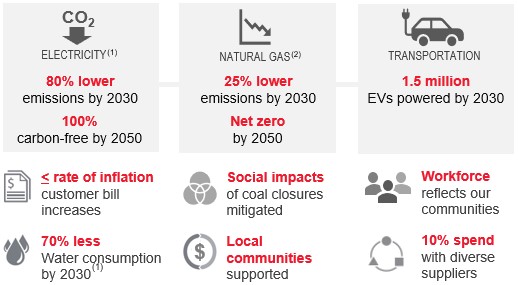
(1)Includes owned and purchased electricity provided to customers.
(2)Spans natural gas supply, distribution and customer use; includes net-zero methane emissions on our natural gas system by 2030.
We demonstrate environmental, social and governance leadership by engaging with stakeholders and mitigating risk, while staying committed to our customers, employees and communities.
Rooted in a culture of compliance and ethical conduct, our decisions and actions are guided by our Code of Conduct and our four values:
| Connected | Committed | Safe | Trustworthy |
These values are reinforced by policies that govern safety practices, ethical standards and conduct, environmental performance, diversity and inclusion, political contributions, and other aspects of our business.
Our values, culture and Code of Conduct serve as the foundation upon which Xcel Energy’s Board of Directors, employees, contractors and suppliers approach their work in delivering on our three strategic priorities.
Lead the Clean Energy Transition
For more than a decade, Xcel Energy has proactively managed the risk of climate change and worked to meet increasing demand for cleaner energy.
Xcel Energy was the first major U.S. utility to establish a carbon-free vision, targeting 100% carbon-free electricity by 2050 and an interim goal of 80% reduction in carbon emissions by 2030 (from 2005 levels), including owned and purchased power. A lead author for the IPCC confirmed that our vision aligns with science-based scenarios likely to limit global warming to 1.5 degrees Celsius from pre-industrial levels.
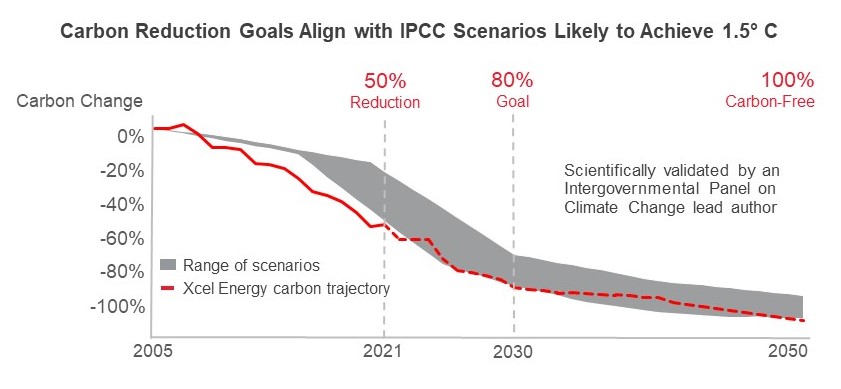
Goal includes owned and purchased power.
The pace of achieving a carbon-free vision is governed by reliability and customer affordability. Our filed resource plans outline a clear, transparent path to achieve an 80% carbon reduction using current technologies, while maintaining customer bill increases at or below the rate of inflation. Moving from 80% carbon reduction to 100% carbon-free electricity will require new dispatchable and scalable technologies that are economically viable, as well as supportive public policy. Resiliency and innovation also remain paramount to a successful transition, as does the economic vitality of our communities.
As we prepare for early coal plant retirements, we provide employees advanced notice and offer retraining and relocation opportunities, with no layoffs to date. We also help attract and make investments to offset community economic impacts. Xcel Energy has a long track record of working with our communities on energy, climate and environmental initiatives that impact them and has publicly committed to furthering environmental justice.
We consistently set aggressive goals and hold ourselves accountable to our customers, communities and investors, as well as, to our own values. Xcel Energy instituted oversight of environmental performance by the Board of Directors beginning in 2000 and was among the first U.S. utilities to tie carbon reduction to executive compensation over fifteen years ago.
Through 2021, we reduced carbon emissions from generation serving customers by an estimated 50% (from 2005 levels) and remain on track to achieve 80% carbon reduction by 2030.
Other notable environmental improvements include:
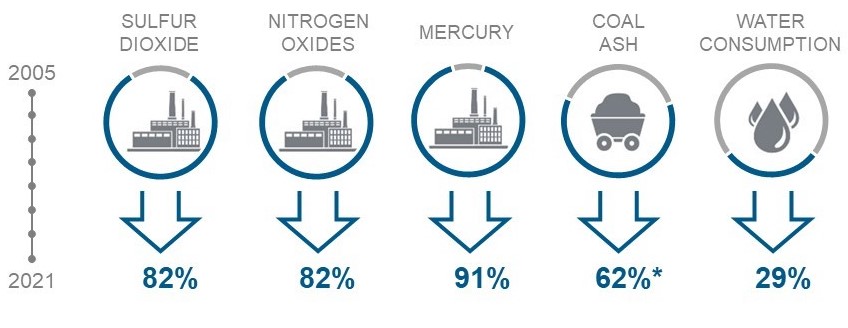
Results from owned generation except for water, which includes owned and purchased power.
*Coal ash reduction is as of 2020.
Xcel Energy has provided a voluntary, third-party verified annual GHG disclosure since 2005, longer than any other U.S. utility. We are a founding member of The Climate Registry and a supporter of the Task Force on Climate-Related Financial Disclosures. Our disclosures also align with the Global Reporting Initiative, Sustainability Accounting Standards Board and United Nations Sustainable Development Goals frameworks.
Since year-end 2020, we have completed four wind farms, adding ~800 MW (includes the Dakota Range project which went in service in January 2022) of owned wind to our system that provides significant environmental benefits and cost savings for our customers. Xcel Energy’s wind capacity is now over 11,000 MW, including nearly 4,500 MW of owned wind.
By 2030, we project that approximately 80% of our energy will come from carbon-free resources.
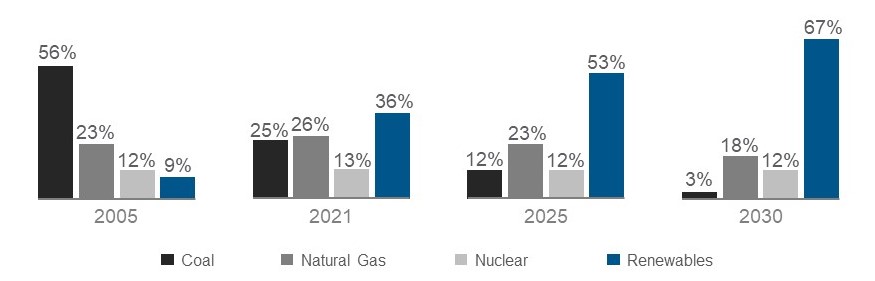
Based on resource plans filed in Minnesota and Colorado, Xcel Energy anticipates nearly 10,000 MW of additional renewables over the next decade, and expects to be coal-free by 2034.
Colorado resource plan — settlement pending CPUC approval
-
87% carbon reduction by 2030 and full coal exit by 2034.
-
~3,900 MW of wind and solar additions.
-
~1,700 MW of flexible resources and storage.
-
~1,200 MW of distributed solar generation.
Minnesota resource plan — approved by MPUC
-
85% carbon reduction and full coal exit by 2030.
-
4,650 MW of wind and solar additions by 2032; the plan includes an additional 1,100 MW of renewables beyond 2032.
-
Transmission infrastructure to connect new renewables to the grid.
-
Extension of the Monticello nuclear plant through 2040.
-
~3,800 MW of firm peaking capacity for reliability before 2030, including hydrogen-ready combustion turbines, the combustion turbines will need to go through a CON process.
-
Additional ~2,100 MW of firm capacity and storage post 2030, to be addressed in future proceedings.
Texas and New Mexico
-
Proposed full coal exit by 2034 upon early retirement of our Tolk plant.
-
Conversion of our Harrington coal plant to natural gas.
We plan to limit coal usage through dispatching units seasonally where possible. Natural gas and other dispatchable resources will be used as needed for reliability and resiliency as more renewables come on the system.
Significant transmission expansion will be required to enable future renewables. Our Pathway project (if approved) in Colorado will provide over 560 miles of transmission lines and enable nearly 5,500 MW of new renewables, including access to some of the region’s richest wind resources. We also anticipate expansion in the Upper Midwest over the next decade as part of MISO’s transmission expansion planning effort, creating investment opportunity.
Our clean energy leadership encompasses our natural gas business as well. In 2021, we committed to reduce GHG emissions by 25% by 2030 from 2020 levels and deliver net-zero natural gas service by 2050, including customer use.
Plans include:
-
Influencing suppliers - pursue certified low/no net emissions supply.
-
Operating the cleanest possible system – incorporate clean fuels.
-
Offering customer options – encourage electrification, where beneficial.
Xcel Energy’s leadership also extends beyond our electric and gas businesses to other parts of the economy. In addition to transitioning our own generation fleet, we are helping to decarbonize other sectors, starting with transportation. We aim to enable 1.5 million EVs across our states by 2030, representing a nearly $2 billion investment, 0.6% to 0.7% incremental annual retail sales growth and avoidance of roughly 5 million tons of CO2 emissions annually.
Enhance the Customer Experience
Xcel Energy has a comprehensive suite of renewable and conservation programs that provide customers with clean energy options and help keep their bills low. We are also transforming and expanding our electric grid to accommodate increased load growth, renewable energy and distributed energy resources.
In 2021, Xcel Energy installed over 300,000 smart meters and plans to install more than one million in 2022. Xcel Energy also launched 12 EV programs for residential and commercial customers, received approval of our New Mexico plan, and continued to prepare for increased levels of EV adoption across our states.
For our local communities, we initiated 20 economic development projects in 2021, which are projected to lead to over $1 billion in capital investments and 5,000 jobs. Additionally, over 60% of our supply chain spend was local.
Keep Bills Low
Customer affordability is critical to successful strategy execution and we are working to keep bill increases at or below the rate of inflation. Since 2013, we have managed average residential bill growth to below 1% annually, with electric and natural gas bill increases of 0.8% and 0.3%, respectively.
Xcel Energy has invested more than $2 billion over the past decade in a comprehensive suite of conservation programs. We have kept O&M expenses flat since 2014, while adding significant renewables and without compromising safety or reliability.
Xcel Energy continues to prudently invest in appropriate areas consistent with its continuing commitment to minimize costs through ongoing process and technology improvements.
Our geographic advantages in wind and solar also enable customer savings, which we call our “Steel for Fuel” strategy. High capacity factors, coupled with renewable tax credits and avoided fuel costs, enable Xcel Energy to add renewables while saving customers money. To date, we have delivered more than $1.8 billion in customer savings by adding owned wind to our system.
In addition to continued savings from economic renewables, disciplined cost control and future coal plant retirements, we anticipate sales growth from electric vehicles will help keep bills low for all customers in the long term, as well as provide customers with annual fuel savings (equivalent cost per gallon for fueling with electricity vs. gasoline) of approximately $1 billion by 2030.
Deliver a Competitive Total Return to Investors
Successful strategy execution, along with our disciplined approach to growth, operations and management of environmental, social and governance issues, positions us to continue delivering a competitive TSR.
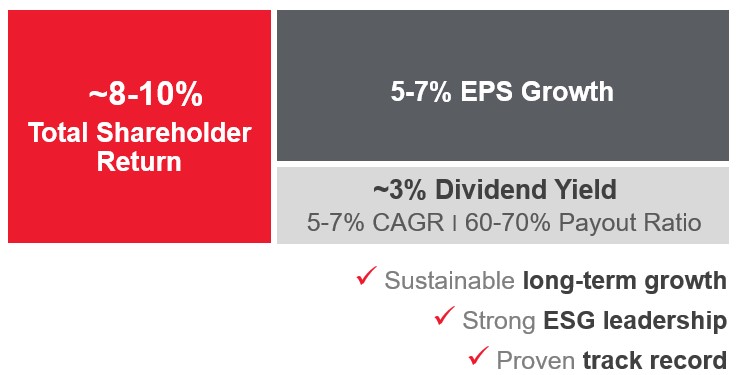
We have consistently achieved our financial objectives, meeting or exceeding our initial earnings guidance range for 17 consecutive years and delivering dividend growth for 18 consecutive years.
Over the past five years, GAAP earnings have grown by 6% annually and our annual dividend growth was 6.1%. Xcel Energy works to maintain senior secured debt credit ratings in the A range and senior unsecured debt credit ratings in the BBB+ to A range. Current ratings are consistent with this goal.
Human Capital
Xcel Energy employees are the driving force behind our Company’s success. Our strategic, data-driven approach to workforce planning helps ensure we will continue to have the skills and capabilities required to meet the evolving needs of our business, customers and communities. We are also deeply committed to diversity, equity, human rights and safety.
Safety
Continuously elevating the quality and safety of the workplace is a top priority. We are considered a benchmark company for our Safety Always approach, focused on eliminating life-altering injuries through a trusted, transparent culture and the use of critical controls. All employees have “stop work authority” and are expected to keep each other, our customers and the public safe. Employees are encouraged to speak up, share experiences and learn from events to help protect themselves, their coworkers and the public.
The Board of Directors has oversight for employee and public safety through the Operations, Nuclear, Environmental and Safety committee, both of which are also tied to annual incentive compensation.
Benefits
Xcel Energy offers a competitive benefits package, including: performance-based compensation, supported by a management system that emphasizes ongoing coaching conversations. Benefits also include floating holidays and recognition, retirement and holistic well-being programs.
Management continuously evaluates benefits to maintain a market competitive, performance-based, shareholder-aligned total rewards package that supports our ability to attract, engage and retain a talented and diverse workforce, while reinforcing and rewarding strong performance.
Diversity, Equity, Inclusion and Human Rights
We aim to create an inclusive culture where employees are treated equitably, and diversity is not only accepted but celebrated. This starts with our Board of Directors, of which eight members were elected in the past five years.
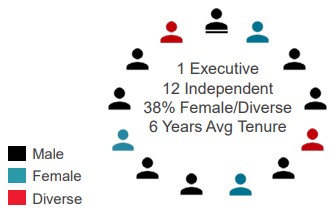
The Board of Directors oversees our workforce strategy, including diversity and inclusion initiatives. In 2021, Xcel Energy added an incentive-based metric focused on diverse interview panels, executive sponsorship and employee feedback on inclusion in the workplace. A total of 70% of annual incentive pay was tied to safety, system reliability and diversity, equity and inclusion metrics.
In 2021, nearly all offers made had diverse hiring panels and executive sponsors consistently met with their employee counterparts at least monthly. We have also disclosed our Equal Employment Opportunity Employer Information Report (EEO-1).
Our CEO and senior executives lead by example, fostering an open and inclusive work environment through their interactions, communications and personal sponsorship of diverse talent throughout the organization.
We partner with educational and community organizations to attract and hire diverse employees who reflect the communities we serve and live our values. Workforce demographics as of December 2021 (unless otherwise noted):
| Female | Ethnically Diverse | |||||||
| Board of Directors (a) | 23 | % | 15 | % | ||||
| CEO direct reports (a) | 36 | % | 18 | % | ||||
| Management | 22 | % | 11 | % | ||||
| Employees | 24 | % | 17 | % | ||||
| New hires | 39 | % | 26 | % | ||||
| Interns (hired throughout 2021) | 34 | % | 27 | % |
(a)Demographics as of Feb. 1, 2022.
Veteran hiring is also a focus, with roughly 10% of employees having served in the military.
To help foster a culture of inclusivity, leaders and employees receive training on microinequities and unconscious bias. The Company hosts 11 business resource groups to support employee interests and obtain diverse perspectives when solving challenges and achieving goals.
Xcel Energy also respects employees’ freedom of association and their right to collectively organize. As of Dec. 31, 2021, approximately 44% of our employees were covered by collective bargaining agreements.
| Employees Covered by Collective Bargaining Agreements | Total Full-Time Employees | |||||||
| NSP-Minnesota | 2,020 | 3,083 | ||||||
| NSP-Wisconsin | 382 | 518 | ||||||
| PSCo | 1,818 | 2,314 | ||||||
| SPS | 736 | 1,099 | ||||||
| XES | — | 4,307 | ||||||
| Total | 4,956 | 11,321 |
Employee turnover for 2021 and future projected retirement eligibility:
| Employee Turnover | Retirement Eligibility | |||||||||||||
| Bargaining | 7 | % | Within next 5 years | 26 | % | |||||||||
| Non-Bargaining | 15 | % | Within next 10 years | 40 | % | |||||||||
| Overall (a) | 12 | % |
(a)31% of turnover was due to retirements.
Xcel Energy has publicly confirmed our commitment to the advancement and protection of human rights, consistent with U.S. human rights laws and the general principles in the International Labour Organization Conventions. Code of Conduct training is required for all employees annually and the Board of Directors.
The Company does not tolerate Code violations or other unacceptable behaviors. We expect and offer employees multiple avenues to raise concerns or report wrong-doing and do not permit any retaliation.
Xcel Energy recently received the following recognitions:
 |  |  |  | ||||||||
| Fortune | Human Rights Campaign | GI Jobs | Military Times | ||||||||
| World’s Most Admired Companies | Best Places to Work for LGBTQ Equality | Military Friendly Employer | Best for Vets |
Utility Subsidiaries
| NSP-Minnesota | |||||||||||||||||
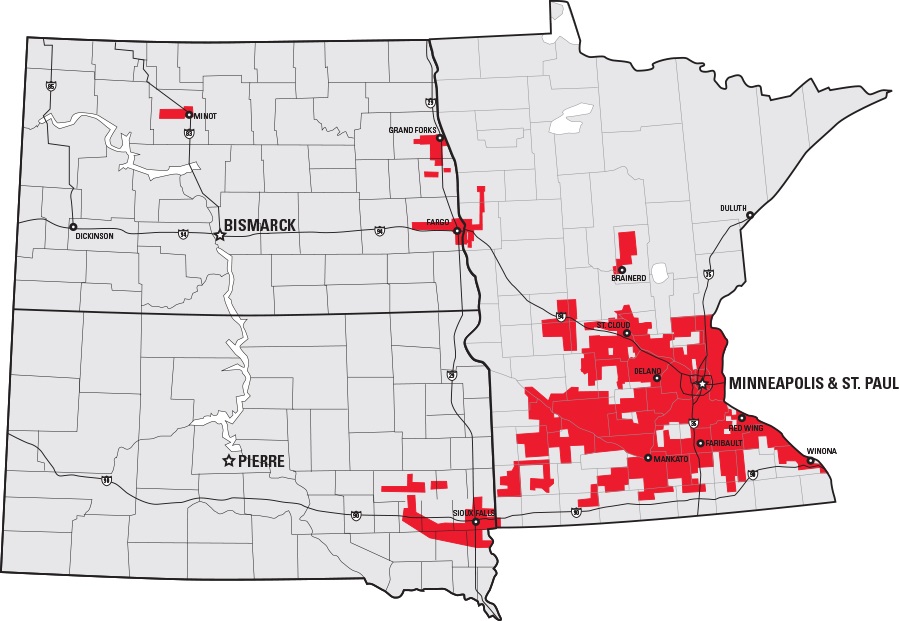 | |||||||||||||||||
| Electric customers | 1.5 million | NSP-Minnesota conducts business in Minnesota, North Dakota and South Dakota and has electric operations in all three states including the generation, purchase, transmission, distribution and sale of electricity. NSP-Minnesota and NSP-Wisconsin electric operations are managed on the NSP System. NSP-Minnesota also purchases, transports, distributes and sells natural gas to retail customers and transports customer-owned natural gas in Minnesota and North Dakota. | |||||||||||||||
| Natural gas customers | 0.5 million | ||||||||||||||||
| Total assets | $22.8 billion | ||||||||||||||||
| Rate Base (estimated) | $13.7 billion | ||||||||||||||||
| ROE (net income / average stockholder's equity) | 8.45% | ||||||||||||||||
| Electric generating capacity | 8,628 MW | ||||||||||||||||
| Gas storage capacity | 17.1 Bcf | ||||||||||||||||
| Electric transmission lines (conductor miles) | 34,155 miles | ||||||||||||||||
| Electric distribution lines (conductor miles) | 81,406 miles | ||||||||||||||||
| Natural gas transmission lines | 85 miles | ||||||||||||||||
| Natural gas distribution lines | 10,741 miles | ||||||||||||||||
| NSP-Wisconsin | |||||||||||||||||
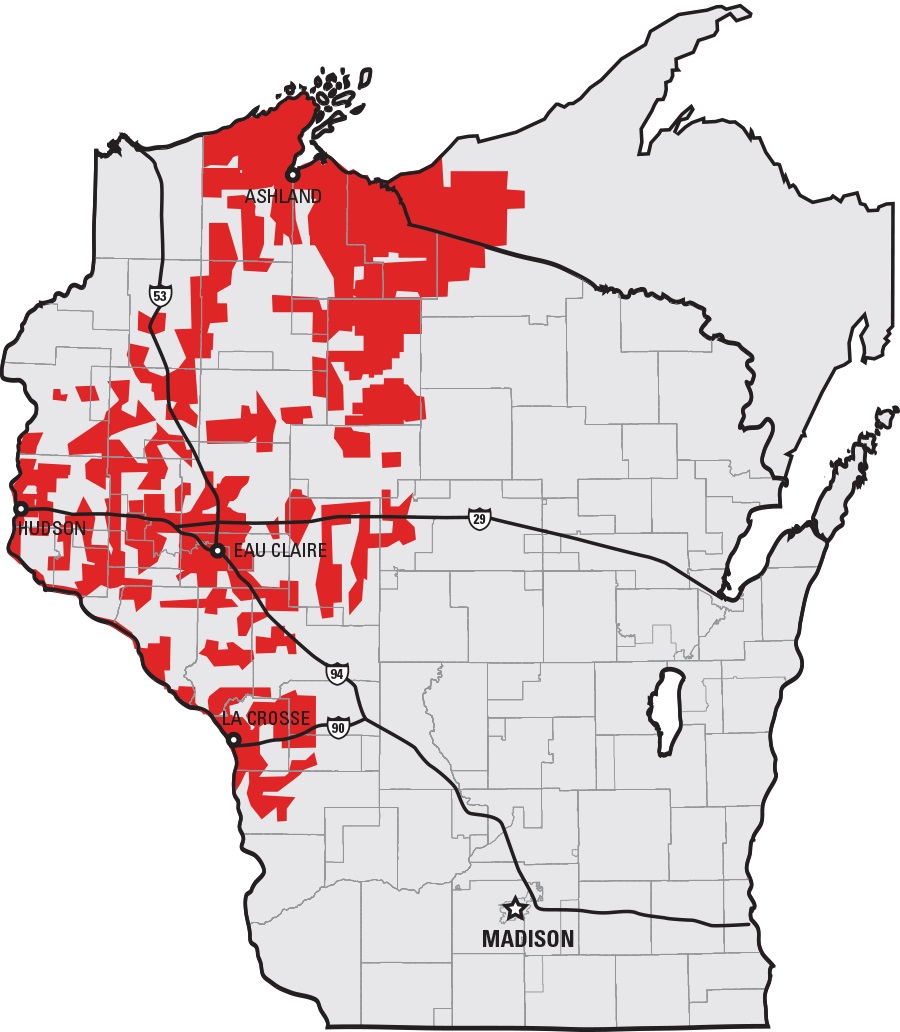 | |||||||||||||||||
| Electric customers | 0.3 million | NSP-Wisconsin conducts business in Wisconsin and Michigan and generates, transmits, distributes and sells electricity. NSP-Minnesota and NSP-Wisconsin electric operations are managed on the NSP System. NSP-Wisconsin also purchases, transports, distributes and sells natural gas to retail customers and transports customer-owned natural gas. | |||||||||||||||
| Natural gas customers | 0.1 million | ||||||||||||||||
| Total assets | $3.1 billion | ||||||||||||||||
| Rate Base (estimated) | $2.0 billion | ||||||||||||||||
| ROE (net income / average stockholder's equity) | 9.92% | ||||||||||||||||
| Electric generating capacity | 548 MW | ||||||||||||||||
| Gas storage capacity | 3.8 Bcf | ||||||||||||||||
| Electric transmission lines (conductor miles) | 12,409 miles | ||||||||||||||||
| Electric distribution lines (conductor miles) | 27,701 miles | ||||||||||||||||
| Natural gas transmission lines | 3 miles | ||||||||||||||||
| Natural gas distribution lines | 2,526 miles | ||||||||||||||||
| PSCo | |||||||||||||||||
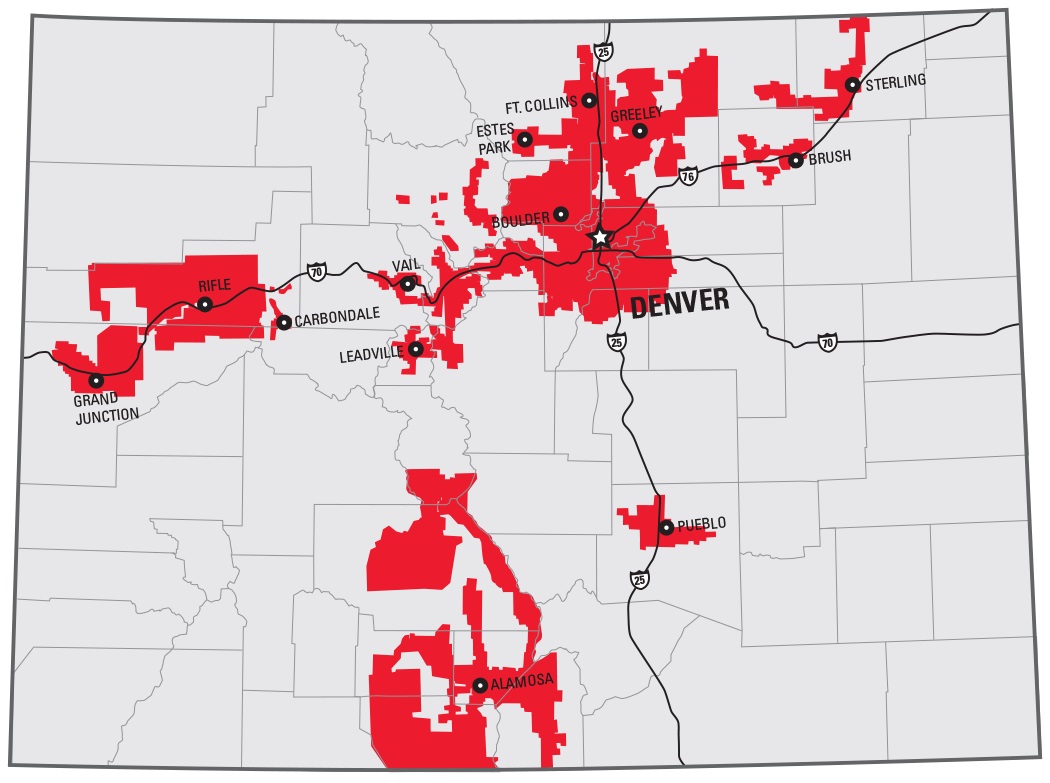 | |||||||||||||||||
| Electric customers | 1.5 million | PSCo conducts business in Colorado and generates, purchases, transmits, distributes and sells electricity. PSCo also purchases, transports, distributes and sells natural gas to retail customers and transports customer-owned natural gas. | |||||||||||||||
| Natural gas customers | 1.5 million | ||||||||||||||||
| Total assets | $22.0 billion | ||||||||||||||||
| Rate Base (estimated) | $14.0 billion | ||||||||||||||||
| ROE (net income / average stockholder's equity) | 8.23% | ||||||||||||||||
| Electric generating capacity | 6,228 MW | ||||||||||||||||
| Gas storage capacity | 32.5 Bcf | ||||||||||||||||
| Electric transmission lines (conductor miles) | 24,116 miles | ||||||||||||||||
| Electric distribution lines (conductor miles) | 78,712 miles | ||||||||||||||||
| Natural gas transmission lines | 2,174 miles | ||||||||||||||||
| Natural gas distribution lines | 23,243 miles | ||||||||||||||||
| SPS | |||||||||||||||||
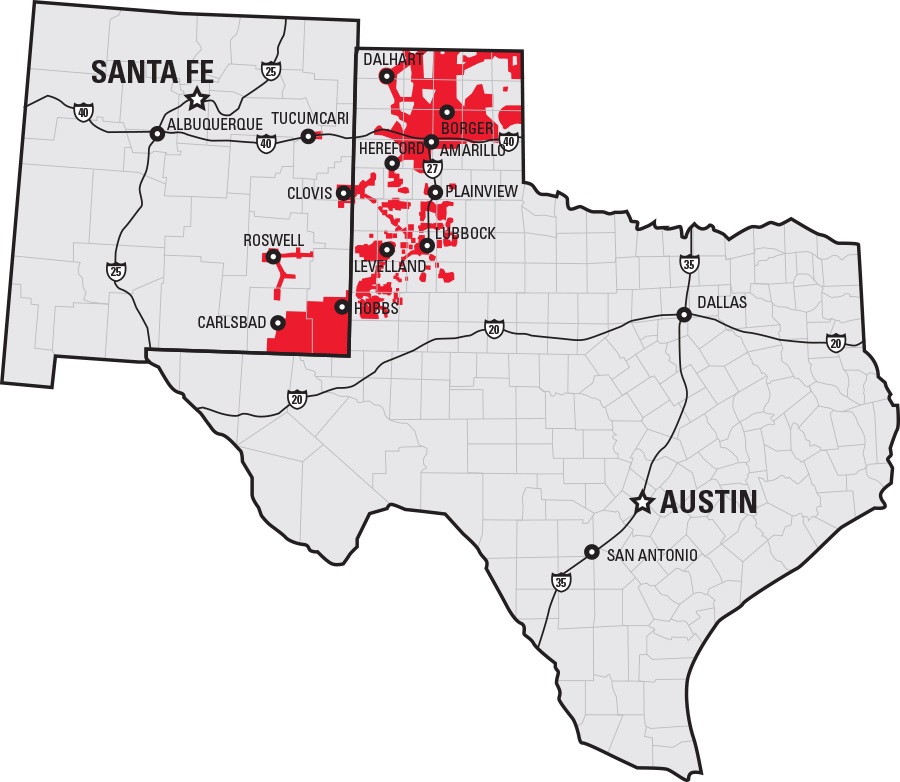 | |||||||||||||||||
| Electric customers | 0.4 million | SPS conducts business in Texas and New Mexico and generates, purchases, transmits, distributes and sells electricity. | |||||||||||||||
| Total assets | $9.3 billion | ||||||||||||||||
| Rate Base (estimated) | $6.4 billion | ||||||||||||||||
| ROE (net income / average stockholder's equity) | 9.22% | ||||||||||||||||
| Electric generating capacity | 5,249 MW | ||||||||||||||||
| Electric transmission lines (conductor miles) | 40,754 miles | ||||||||||||||||
| Electric distribution lines (conductor miles) | 22,651 miles | ||||||||||||||||
| Operations Overview |
Utility operations are generally conducted as either electric or gas utilities in our four utility subsidiaries.
| Electric Operations |
Electric operations consist of energy supply, generation, transmission and distribution activities across all four operating companies. Xcel Energy had electric sales volume of 115,474 (millions of KWh), 3.7 million customers and electric revenues of $11,205 (millions of dollars) for 2021.
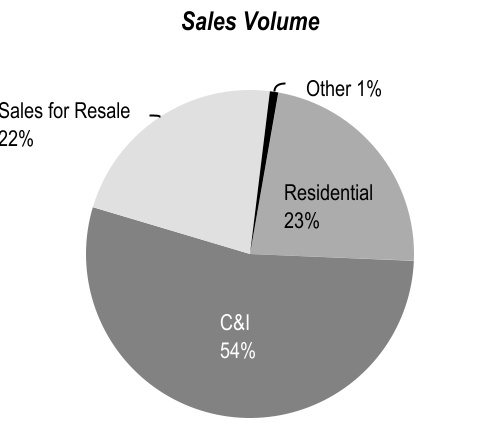
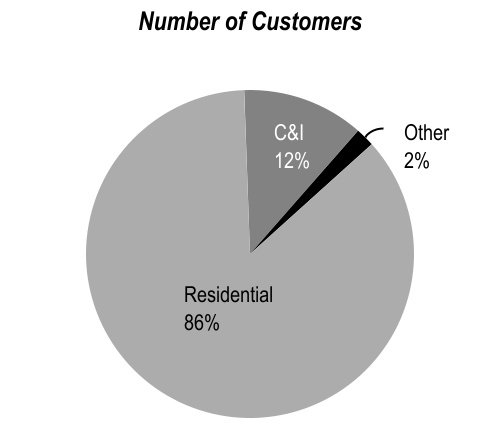
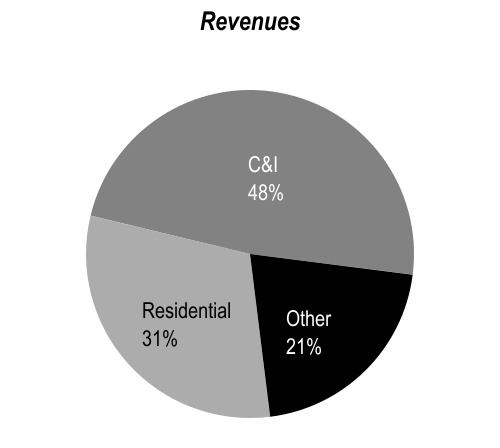
Retail Sales/Revenue Statistics (a)
| 2021 | 2020 | |||||||||||||
| KWh sales per retail customer | 23,968 | 23,910 | ||||||||||||
| Revenue per retail customer | $ | 2,405 | $ | 2,199 | ||||||||||
| Residential revenue per KWh | 12.94 | ¢ | 12.12 | ¢ | ||||||||||
| Large C&I revenue per KWh | 6.60 | ¢ | 5.78 | ¢ | ||||||||||
| Small C&I revenue per KWh | 10.47 | ¢ | 9.56 | ¢ | ||||||||||
| Total retail revenue per KWh | 10.03 | ¢ | 9.20 | ¢ |
(a) See Note 6 to the consolidated financial statements for further information.
Owned and Purchased Energy Generation — 2021
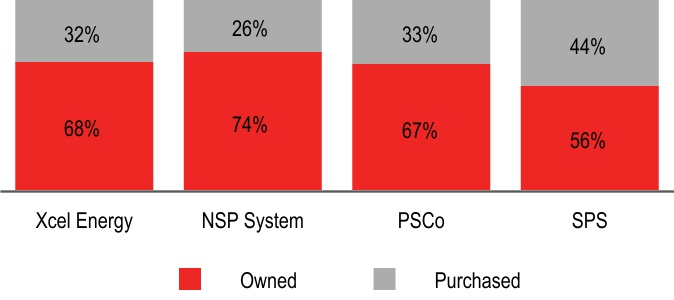
Electric Energy Sources
Total electric energy generation by source (including energy market purchases) for the year ended Dec. 31, 2021:
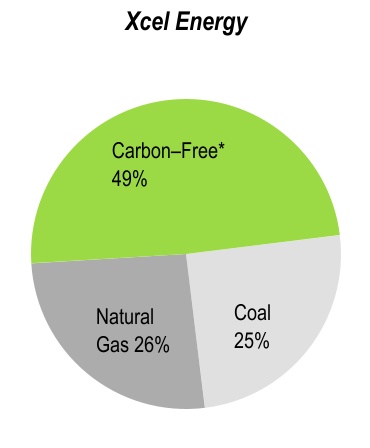
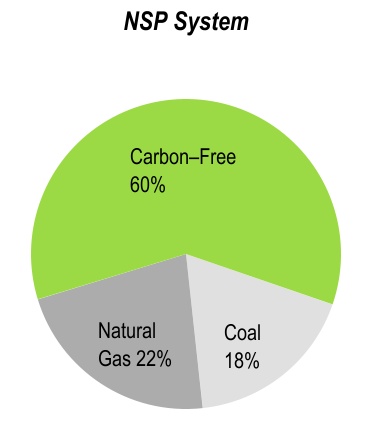

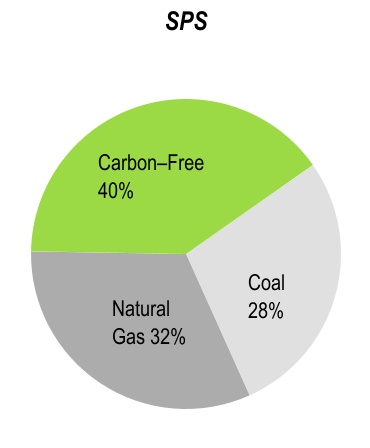
- Distributed generation from the Solar*Rewards® program is not included (approximately 666 million KWh for 2021).
Carbon-Free
Xcel Energy’s carbon-free energy portfolio includes wind, nuclear, hydroelectric, biomass and solar power from both owned generation facilities and PPAs. Carbon-free percentages will vary year-over-year based on system additions, commodity costs, weather, system demand and transmission constraints.
See Item 2 — Properties for further information.
Carbon-free energy as a percentage of total energy for 2021:
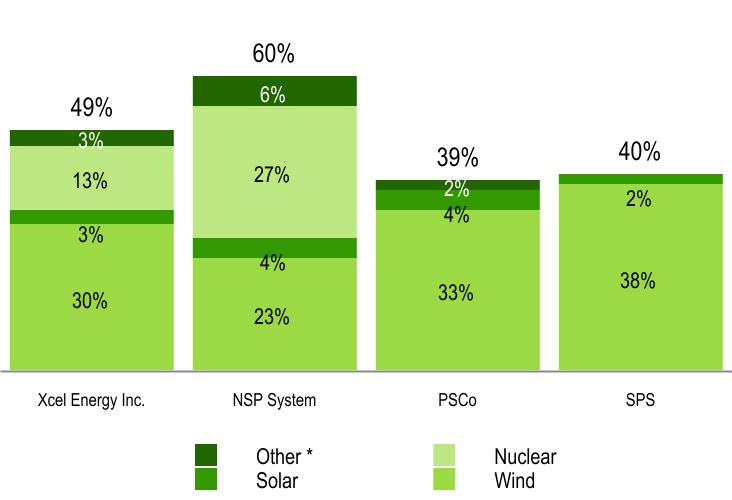
- Includes biomass and hydroelectric.
Wind
Owned — Owned and operated wind farms with corresponding capacity:
| Utility Subsidiary | 2021 | 2020 | ||||||||||||||||||||||||
| Wind Farms | Capacity (MW) (a) | Wind Farms | Capacity (MW) (b) | |||||||||||||||||||||||
| NSP System | 14 | 2,031 | 11 | 1,540 | ||||||||||||||||||||||
| PSCo | 2 | 1,059 | 2 | 1,059 | ||||||||||||||||||||||
| SPS | 2 | 984 | 2 | 967 | ||||||||||||||||||||||
| Total | 18 | 4,075 | 15 | 3,566 |
(a) Summer 2021 net dependable capacity.
(b) Summer 2020 net dependable capacity.
PPAs — Number of PPAs with capacity range:
| Utility Subsidiary | 2021 | 2020 | ||||||||||||||||||||||||
| PPAs | Range (MW) | PPAs | Range (MW) | |||||||||||||||||||||||
| NSP System | 128 | 1 — 206 | 129 | 1 — 206 | ||||||||||||||||||||||
| PSCo | 17 | 23 — 301 | 17 | 23 — 301 | ||||||||||||||||||||||
| SPS | 17 | 1 — 250 | 18 | 1 — 250 |
Capacity — Wind capacity (MW):
| Utility Subsidiary | 2021 | 2020 | ||||||||||||
| NSP System | 3,997 | 3,348 | ||||||||||||
| PSCo | 4,085 | 4,085 | ||||||||||||
| SPS | 2,548 | 2,535 |
Average Cost (Owned) — Average cost per MWh of wind energy from owned generation:
| Utility Subsidiary | 2021 | 2020 | ||||||||||||
| NSP System | $ | 25 | $ | 23 | ||||||||||
| PSCo | 17 | 35 | ||||||||||||
| SPS | 17 | 17 |
Average Cost (PPAs) — Average cost per MWh of wind energy under existing PPAs:
| Utility Subsidiary | 2021 | 2020 | ||||||||||||
| NSP System | $ | 37 | $ | 38 | ||||||||||
| PSCo | 35 | 40 | ||||||||||||
| SPS | 27 | 26 |
Wind Development
Xcel Energy placed approximately 500 MW of owned wind and approximately 255 MW of PPAs into service during 2021:
| Project | Utility Subsidiary | Capacity (MW) | ||||||||||||
| Blazing Star 2 | NSP-Minnesota | 200 (a)(b) | ||||||||||||
| Freeborn | NSP-Minnesota | 200 (a)(b) | ||||||||||||
| Mower | NSP-Minnesota | 91 (a)(b) | ||||||||||||
| Various PPAs | Various | ~255 (c) |
(a) Summer 2021 net dependable capacity.
(b) Values disclosed are the maximum generation levels. Capacity is attainable only when wind conditions are sufficiently available (on-demand net dependable capacity is zero).
(c) Based on contracted capacity.
Xcel Energy currently has approximately 1,050 MW of owned wind under development or being repowered. In addition, we expect to add approximately 200 MW of planned PPAs.
| Project | Utility Subsidiary | Capacity (MW) | Estimated Completion | |||||||||||||||||
| Northern Wind | NSP-Minnesota | 100 | 2022 | |||||||||||||||||
| Nobles | NSP-Minnesota | 200 | 2022 | |||||||||||||||||
| Dakota Range | NSP-Minnesota | 300 | 2022 (a) | |||||||||||||||||
| Grand Meadow | NSP-Minnesota | 100 | 2023 | |||||||||||||||||
| Border Winds | NSP-Minnesota | 150 | 2025 | |||||||||||||||||
| Pleasant Valley | NSP-Minnesota | 200 | 2025 | |||||||||||||||||
| Various PPAs | Various | ~200 | 2022 |
(a) Placed in service in January 2022.
Solar
Solar PPA(s):
| Type | Utility Subsidiary | Capacity (MW) | ||||||||||||
| Distributed Generation | NSP System | 994 | ||||||||||||
| Utility-Scale | NSP System | 268 | ||||||||||||
| Distributed Generation | PSCo | 736 | ||||||||||||
| Utility-Scale | PSCo | 562 | ||||||||||||
| Distributed Generation | SPS | 15 | ||||||||||||
| Utility-Scale | SPS | 192 | ||||||||||||
| Total | 2,767 |
Average Cost (PPAs) — Average cost per MWh of solar energy under existing PPAs:
| Utility Subsidiary | 2021 | 2020 | ||||||||||||
| NSP System | $ | 90 | $ | 90 | ||||||||||
| PSCo | 67 | 89 | ||||||||||||
| SPS | 61 | 59 |
Solar Development
In June 2021, the PSCW approved NSP-Wisconsin’s request to purchase the 74 MW Western Mustang build-own-transfer solar facility for approximately $100 million. Also, as part of the Minnesota Recovery and Relief Recovery docket, NSP-Minnesota proposed to add 460 MW of solar facilities at the Sherco site with an incremental investment of approximately $575 million. An MPUC decision is expected by the third quarter of 2022.
PSCo placed approximately 260 MW of PPAs into service during 2021.
Nuclear
Xcel Energy has two nuclear plants with approximately 1,700 MW of total 2021 net summer dependable capacity that serves the NSP System. Our nuclear fleet has become one of the best performing and dependable in the nation, as rated by both the NRC and INPO. Xcel Energy secures contracts for uranium concentrates, uranium conversion, uranium enrichment and fuel fabrication to operate its nuclear plants. We use varying contract lengths as well as multiple producers for uranium concentrates, conversion services and enrichment services to minimize potential impacts caused by supply interruptions due to geographical and world political issues.
Nuclear Fuel Cost
Delivered cost per MMBtu of nuclear fuel consumed for owned electric generation and the percentage of total fuel requirements:
| Utility Subsidiary | Nuclear | |||||||||||||
| NSP System | Cost | Percent | ||||||||||||
| 2021 | $ | 0.77 | 46 | % | ||||||||||
| 2020 | 0.80 | 51 |
Other
Xcel Energy’s other carbon-free energy portfolio includes hydro from owned generating facilities.
See Item 2 — Properties for further information.
Fossil Fuel
Xcel Energy’s fossil fuel energy portfolio includes coal and natural gas power from both owned generating facilities and PPAs.
Coal
Xcel Energy owns and operates coal units with approximately 6,500 MW of total 2021 net summer dependable capacity.
Approved early coal plant retirements:
| Year | Utility Subsidiary | Plant Unit | Capacity (MW) | |||||||||||||||||
| 2022 | PSCo | Comanche 1 | 325 | |||||||||||||||||
| 2023 | NSP-Minnesota | Sherco 2 | 682 | |||||||||||||||||
| 2024 | SPS | Harrington (a) | 1,018 | |||||||||||||||||
| 2025 | PSCo | Comanche 2 | 335 | |||||||||||||||||
| 2025 | PSCo | Craig 1 | 42 (b) | |||||||||||||||||
| 2026 | NSP-Minnesota | Sherco 1 | 680 | |||||||||||||||||
| 2028 | PSCo | Craig 2 | 40 (b) | |||||||||||||||||
| 2028 | NSP-Minnesota | A.S. King | 511 | |||||||||||||||||
| 2030 | NSP-Minnesota | Sherco 3 | 517 (b) |
(a)Reflects expected conversion from coal to natural gas following the TCEQ order that Harrington cease use of coal fuel by Jan. 1, 2025, pending PUCT and NMPRC review.
(b)Based on Xcel Energy’s ownership interest.
| Proposed | ||||||||||||||||||||
| Year | Utility Subsidiary | Plant Unit | Capacity (MW) | |||||||||||||||||
| 2025 | PSCo | Pawnee (a) | 505 | |||||||||||||||||
| 2027 | PSCo | Hayden 2 | 98 (b) | |||||||||||||||||
| 2028 | PSCo | Hayden 1 | 135 (c) | |||||||||||||||||
| 2034 | SPS | Tolk 1 | 532 | |||||||||||||||||
| 2034 | SPS | Tolk 2 | 535 | |||||||||||||||||
| 2034 | PSCo | Comanche 3 | 500 (d) |
(a)Reflects conversion from coal to natural gas.
(b)Based on PSCo’s ownership of 37% of Unit 2.
(c)Based on PSCo’s ownership of 76% of Unit 1.
(d)Based on PSCo’s ownership of 67%.
Coal Fuel Cost
Delivered cost per MMBtu of coal consumed for owned electric generation and the percentage of fuel requirements:
| Coal (a) | ||||||||||||||
| Utility Subsidiary | Cost | Percent | ||||||||||||
| NSP System | ||||||||||||||
| 2021 | $ | 1.60 | 39 | % | ||||||||||
| 2020 | 1.97 | 31 | ||||||||||||
| PSCo | ||||||||||||||
| 2021 | 1.43 | 62 | ||||||||||||
| 2020 | 1.41 | 51 | ||||||||||||
| SPS | ||||||||||||||
| 2021 | 2.07 | 66 | ||||||||||||
| 2020 | 2.28 | 40 |
(a) Includes refuse-derived fuel and wood for the NSP System.
Natural Gas
Xcel Energy has 22 natural gas plants with approximately 7,900 MW of total 2021 net summer dependable capacity.
Natural gas supplies, transportation and storage services for power plants are procured to provide an adequate supply of fuel. Remaining requirements are procured through a liquid spot market. Generally, natural gas supply contracts have variable pricing that is tied to natural gas indices. Natural gas supply and transportation agreements include obligations for the purchase and/or delivery of specified volumes or payments in lieu of delivery.
Natural Gas Cost
Delivered cost per MMBtu of natural gas consumed for owned electric generation and the percentage of total fuel requirements:
| Natural Gas | ||||||||||||||
| Utility Subsidiary | Cost | Percent | ||||||||||||
| NSP System | ||||||||||||||
| 2021 (a) | $ | 4.98 | 15 | % | ||||||||||
| 2020 | 2.67 | 17 | ||||||||||||
| PSCo | ||||||||||||||
| 2021 (a) | 8.38 | 38 | ||||||||||||
| 2020 | 3.01 | 49 | ||||||||||||
| SPS | ||||||||||||||
| 2021 (a) | 6.72 | 34 | ||||||||||||
| 2020 | 1.43 | 60 |
(a)Reflective of Winter Storm Uri.
Capacity and Demand
Uninterrupted system peak demand and occurrence date for the regulated utilities:
| System Peak Demand (MW) | ||||||||||||||||||||||||||
| 2021 | 2020 | |||||||||||||||||||||||||
| NSP System | 8,837 | June 9 | 8,571 | July 8 | ||||||||||||||||||||||
| PSCo | 6,958 | July 28 | 6,899 | Aug. 17 | ||||||||||||||||||||||
| SPS | 4,054 | Aug. 9 | 4,195 | July 14 |
Transmission
Transmission lines deliver electricity at high voltages and over long distances from power sources to transmission substations closer to customers. A strong transmission system ensures continued reliable and affordable service, ability to meet state and regional energy policy goals, and support for a diverse generation mix, including renewable energy. Xcel Energy owns more than 111,000 conductor miles of transmission lines, serving 22,000 MW of customer load, across its service territory.
Transmission projects completed in 2021 include:
| Project | Utility Subsidiary | Miles | Size (KV) | |||||||||||||||||
| Hibbing Taconite Relocation | NSP-Minnesota | 3 | 500 | |||||||||||||||||
| Huntley - Wilmarth | NSP-Minnesota | 50 | 345 | |||||||||||||||||
| Helena Scott County | NSP-Minnesota | 16 | 345 | |||||||||||||||||
| Centerville to Lincoln County | NSP-Minnesota | 14 | 69 | |||||||||||||||||
| Turtle Lake Almena | NSP-Wisconsin | 4 | 69 | |||||||||||||||||
| Roadrunner-China Draw | SPS | 41 | 345 |
Notable upcoming projects:
| Project | Utility Subsidiary | Miles | Size (KV) | Completion Date | ||||||||||||||||||||||
| Baytown to Long Lake | NSP-Minnesota | 9 | 115 | 2022 | ||||||||||||||||||||||
| Bird Island - Atwater - Big Swan | NSP-Minnesota | 68 | 69 | 2022 | ||||||||||||||||||||||
| Pipestone - Tracy | NSP-Minnesota | 46 | 69 | 2022 | ||||||||||||||||||||||
| Line Rebuild - Central | NSP-Minnesota | 24 | 69 | 2022 | ||||||||||||||||||||||
| West St. Cloud to Millwood Tap | NSP-Minnesota | 24 | 69 | 2022 | ||||||||||||||||||||||
| Bayfield Second Circuit | NSP-Wisconsin | 19 | 35 | 2022 | ||||||||||||||||||||||
| Colorado Energy Plan | PSCo | 15 | 345 | 2022 | ||||||||||||||||||||||
| Tolk Plant Substation | ||||||||||||||||||||||||||
| Bus Reconfiguration | SPS | n/a | 345, 230 | 2022 | ||||||||||||||||||||||
| Twist to Wilco Line | SPS | 4 | 115 | 2024 | ||||||||||||||||||||||
| Pathway | PSCo | 560 | 345 | 2027 |
See Item 2 - Properties for further information.
Distribution
Distribution lines allow electricity to travel at lower voltages from substations directly to customers. Xcel Energy has a vast distribution network, owning and operating approximately 210,000 conductor miles of distribution lines across our eight-state service territory.
To continue providing reliable, affordable electric service and enable more flexibility for customers, we are working to digitize the distribution grid, while at the same time keeping it secure. Over the multi-year project that started in 2016, Xcel Energy plans to invest approximately $1.7 billion implementing new network infrastructure, smart meters, advanced software, equipment sensors and related data analytics capabilities. To date, Xcel Energy has spent approximately $568 million on these investments.
Investments of this nature will further improve reliability and reduce outage restoration times for our customers, while at the same time enabling new options and opportunities for increased efficiency savings. The new capabilities will also enable integration of battery storage and other distributed energy resources into the grid, including electric vehicles.
See Item 2 - Properties for further information.
| Natural Gas Operations |
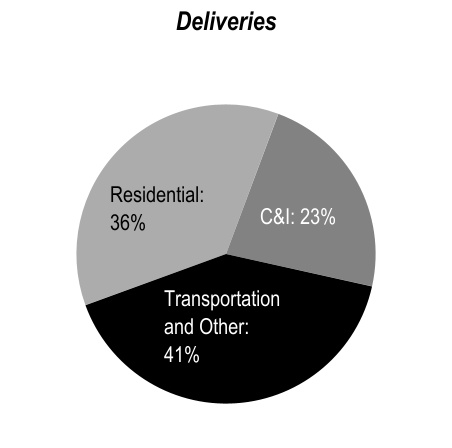
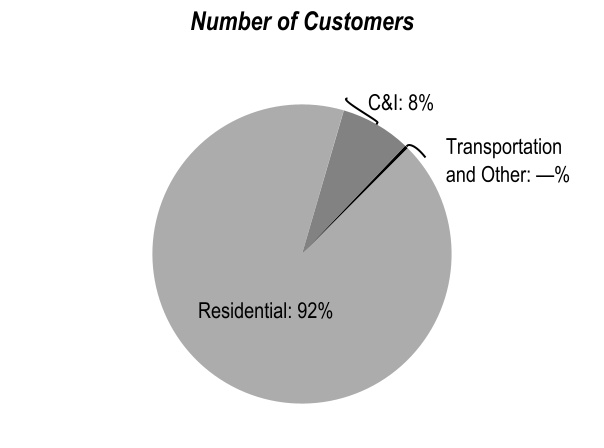
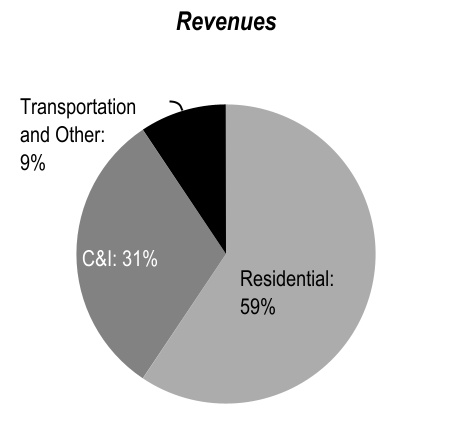
Natural gas operations consist of purchase, transportation and distribution of natural gas to end-use residential, C&I and transport customers in NSP-Minnesota, NSP-Wisconsin and PSCo. Xcel Energy had natural gas deliveries of 405,895 (thousands of MMBtu), 2.1 million customers and natural gas revenues of $2,132 (millions of dollars) for 2021.
Sales/Revenue Statistics (a)
| 2021 | 2020 | |||||||||||||
| MMBtu sales per retail customer | 114 | 118 | ||||||||||||
| Revenue per retail customer | $ | 917 | $ | 720 | ||||||||||
| Residential revenue per MMBtu | 8.61 | 6.64 | ||||||||||||
| C&I revenue per MMBtu | 7.20 | 5.22 | ||||||||||||
| Transportation and other revenue per MMBtu | 1.20 | 0.67 |
(a) See Note 6 to the consolidated financial statements for further information.
Capability and Demand
Natural gas supply requirements are categorized as firm or interruptible (customers with an alternate energy supply).
Maximum daily output (firm and interruptible) and occurrence date:
| 2021 | 2020 | |||||||||||||||||||||||||
| Utility Subsidiary | MMBtu | Date (a) | MMBtu | Date | ||||||||||||||||||||||
| NSP-Minnesota | 899,133 | Feb. 11 | 871,921 | Jan. 16 | ||||||||||||||||||||||
| NSP-Wisconsin | 167,656 | Feb. 11 | 150,320 | Dec. 24 | ||||||||||||||||||||||
| PSCo | 2,316,283 | Feb. 14 | 1,931,888 | Feb. 4 |
(a)Reflective of Winter Storm Uri.
Natural Gas Supply and Cost
Xcel Energy seeks natural gas supply, transportation and storage alternatives to yield a diversified portfolio, which increase flexibility, decrease interruption, financial risks and customer rates. In addition, the utility subsidiaries conduct natural gas price hedging activities approved by their states’ commissions.
Average delivered cost per MMBtu of natural gas for regulated retail distribution:
| Utility Subsidiary | 2021 (a) | 2020 | ||||||||||||
| NSP-Minnesota | $ | 7.48 | $ | 3.32 | ||||||||||
| NSP-Wisconsin | 7.11 | 3.08 | ||||||||||||
| PSCo | 6.06 | 2.52 |
(a)Reflective of Winter Storm Uri.
NSP-Minnesota, NSP-Wisconsin and PSCo have natural gas supply transportation and storage agreements that include obligations for purchase and/or delivery of specified volumes or to make payments in lieu of delivery.
| General |
General Economic Conditions
Economic conditions may have a material impact on Xcel Energy’s operating results. Management cannot predict the impact of fluctuating energy prices, pandemics, terrorist activity, war or the threat of war. We could experience a material impact to our results of operations, future growth or ability to raise capital resulting from a sustained general slowdown in economic growth or a significant increase in interest rates or inflation.
Seasonality
Demand for electric power and natural gas is affected by seasonal differences in the weather. In general, peak sales of electricity occur in the summer months and peak sales of natural gas occur in the winter months. As a result, the overall operating results may fluctuate substantially on a seasonal basis. Additionally, Xcel Energy’s operations have historically generated less revenues and income when weather conditions are milder in the winter and cooler in the summer.
Competition
Xcel Energy is subject to public policies that promote competition and development of energy markets. Xcel Energy’s industrial and large commercial customers have the ability to generate their own electricity. In addition, customers may have the option of substituting other fuels or relocating their facilities to a lower cost region.
Customers have the opportunity to supply their own power with distributed generation including solar generation and in most jurisdictions can currently avoid paying for most of the fixed production, transmission and distribution costs incurred to serve them.
Several states have incentives for the development of rooftop solar, community solar gardens and other distributed energy resources. Distributed generating resources are potential competitors to Xcel Energy’s electric service business with these incentives and federal tax subsidies.
The FERC has continued to promote competitive wholesale markets through open access transmission and other means. Xcel Energy’s wholesale customers can purchase their output from generation resources of competing suppliers or non-contracted quantities and use the transmission systems of the utility subsidiaries on a comparable basis to serve their native load.
FERC Order No. 1000 established competition for ownership of certain new electric transmission facilities under Federal regulations. Some states have state laws that allow the incumbent a Right of First Refusal to own these transmission facilities.
FERC Order 2222 requires that RTO and ISO markets allow participation of aggregations of distributed energy resources. This order is expected to incentivize distributed energy resource adoption, however implementation is expected to vary by RTO/ISO and the near, medium, and long-term impacts of Order 2222 remain unclear.
Xcel Energy Inc.’s utility subsidiaries have franchise agreements with cities subject to periodic renewal; however, a city could seek alternative means to access electric power or gas, such as municipalization.
While each utility subsidiary faces these challenges, Xcel Energy believes their rates and services are competitive with alternatives currently available.
| Governmental Regulations |
Public Utility Regulation
See Item 7 for discussion of public utility regulation.
Environmental Regulation
Our facilities are regulated by federal and state agencies that have jurisdiction over air emissions, water quality, wastewater discharges, solid and hazardous wastes or substances. Certain Xcel Energy activities require registrations, permits, licenses, inspections and approvals from these agencies.
Xcel Energy has received necessary authorizations for the construction and continued operation of its generation, transmission and distribution systems. Our facilities strive to operate in compliance with applicable environmental standards and related monitoring and reporting requirements.
However, it is not possible to determine what additional facilities or modifications of existing or planned facilities will be required as a result of changes to regulations, interpretations or enforcement policies or what effect future laws or regulations may have. We may be required to incur expenditures in the future for remediation of MGP and other sites.
Xcel Energy must comply with emission levels in Minnesota, Texas and Wisconsin that may require the purchase of emission allowances. The Denver North Front Range Non-attainment Area does not meet the ozone NAAQS. Colorado will continue to consider further reductions available in the non-attainment area as it develops plans to meet ozone standards. Natural gas plants which operate in PSCo’s non-attainment area may be required to improve or add controls, implement further work practices and/or enhanced emissions monitoring as part of future Colorado state plans.
There are significant environmental regulations to encourage use of clean energy technologies and regulate emissions of GHGs. We have undertaken numerous initiatives to meet current requirements and prepare for potential future regulations, reduce GHG emissions and respond to state renewable and energy efficiency goals. Future environmental regulations may result in substantial costs.
In July 2019, the EPA adopted the Affordable Clean Energy rule, which requires states to develop plans by 2022 for GHG reductions from coal-fired power plants. In January 2021, the U.S. Court of Appeals for the D.C. Circuit issued a decision vacating and remanding the Affordable Clean Energy rule. That decision would allow the EPA to proceed with alternate regulation of coal-fired power plants. However, the Court of Appeals decision is now before the U.S. Supreme Court, where the Court is expected to rule on the nature and extent of the EPA’s GHG regulatory authority. If any new rules require additional investment, Xcel Energy believes that the cost of these initiatives or replacement generation would be recoverable through rates based on prior state commission practices.
In October 2020, the TCEQ approved an agreement that SPS will convert the Harrington plant from coal to natural gas by Jan. 1, 2025. This conversion is necessary to attain Federal Clean Air Act standards for emissions of SO2.
Xcel Energy seeks to address climate change and potential climate change regulation through efforts to reduce its GHG emissions in a balanced, cost-effective manner.
Emerging Environmental Regulation
New regulations and legislation are being considered to regulate PFAS in drinking water, water discharges, commercial products, wastes, and other areas. PFAS are man-made chemicals found in many consumer products that can persist and accumulate in the environment. These chemicals have received heightened attention from environmental regulators. Increased regulation of PFAS and other emerging contaminants at the federal, state, and local level could have a potential adverse effect on our operations but at this time, it is uncertain what impact, if any, there will be on our operations, financial condition or cash flows. Xcel Energy will continue to monitor these regulatory developments and their potential impact on its operations.
Environmental Costs
Environmental costs include amounts for nuclear plant decommissioning and payments for storage of spent nuclear fuel, disposal of hazardous materials and waste, remediation of contaminated sites, monitoring of discharges to the environment and compliance with laws and permits with respect to emissions.
Costs charged to operating expenses for nuclear decommissioning, spent nuclear fuel disposal, environmental monitoring and remediation and disposal of hazardous materials and waste were approximately:
-
$365 million in 2021.
-
$400 million in 2020.
-
$345 million in 2019.
Average annual expense of approximately $425 million from 2022 – 2026 is estimated for similar costs. The precise timing and amount of environmental costs, including those for site remediation and disposal of hazardous materials, are unknown. Additionally, the extent to which environmental costs will be included in and recovered through rates may fluctuate.
Capital expenditures for environmental improvements were approximately:
-
$60 million in 2021.
-
$30 million in 2020.
-
$30 million in 2019.
Other
Our operations are subject to workplace safety standards under the Federal Occupational Safety and Health Act of 1970 (“OSHA”) and comparable state laws that regulate the protection of worker health and safety. In addition, the Company is subject to other government regulations impacting such matters as labor, competition, data privacy, etc. Based on information to date and because our policies and business practices are designed to comply with all applicable laws, we do not believe the effects of compliance on our operations, financial condition or cash flows are material.
| Capital Spending and Financing |
See Item 7 for discussion of capital expenditures and funding sources.
| Executive Officers (a) | ||||||||||||||||||||
| Name | Age (b) | Current and Recent Positions | Time in Position | |||||||||||||||||
| Robert C. Frenzel | 51 | Chairman of the Board of Directors, Xcel Energy Inc. | December 2021 — Present | |||||||||||||||||
| President and Chief Executive Officer and Director, Xcel Energy Inc. | August 2021 — Present | |||||||||||||||||||
| Chief Executive Officer, NSP-Minnesota, NSP-Wisconsin, PSCo, and SPS | August 2021 — Present | |||||||||||||||||||
| President and Chief Operating Officer, Xcel Energy Inc. | March 2020 — August 2021 | |||||||||||||||||||
| Executive Vice President, Chief Financial Officer, Xcel Energy Inc. | May 2016 — March 2020 | |||||||||||||||||||
| Senior Vice President and Chief Financial Officer, Luminant, a subsidiary of Energy Future Holdings Corp. (c) | February 2012 — April 2016 | |||||||||||||||||||
| Brett C. Carter (d) | 55 | Executive Vice President and Chief Customer and Innovation Officer, Xcel Energy Inc. | May 2018 — Present | |||||||||||||||||
| Senior Vice President and Shared Services Executive, Bank of America, an institutional investment bank and financial services company | October 2015 — May 2018 | |||||||||||||||||||
| Patricia Correa | 48 | Senior Vice President, Chief Human Resources Officer, Xcel Energy Inc. | February 2022 — Present | |||||||||||||||||
| Senior Vice President, Human Resources, Eaton Corporation, a power management company | July 2019 — January 2022 | |||||||||||||||||||
| Vice President, Human Resources, Eaton Corporation | March 2016 — July 2019 | |||||||||||||||||||
| Senior Director, Talent & Organization Development, Kellogg Company, a food manufacturing company | July 2015 — March 2016 | |||||||||||||||||||
| Timothy O’Connor | 62 | Executive Vice President, Chief Operations Officer, Xcel Energy Inc. | August 2021 — Present | |||||||||||||||||
| Executive Vice President, Chief Generation Officer, Xcel Energy Inc. | March 2020 — August 2021 | |||||||||||||||||||
| Senior Vice President, Chief Nuclear Officer, Xcel Energy Services Inc | February 2013 — March 2020 | |||||||||||||||||||
| Frank Prager | 59 | Senior Vice President, Strategy, Planning and External Affairs, Xcel Energy Inc. | March 2020 — Present | |||||||||||||||||
| Vice President, Policy and Federal Affairs, Xcel Energy Services Inc. | January 2015 — March 2020 | |||||||||||||||||||
| Amanda Rome | 41 | Executive Vice President, General Counsel, Xcel Energy Inc. | June 2020 — Present | |||||||||||||||||
| Vice President and Deputy General Counsel, Xcel Energy Services Inc. | October 2019 — June 2020 | |||||||||||||||||||
| Managing Attorney, Xcel Energy Services Inc. | July 2018 — October 2019 | |||||||||||||||||||
| Rotational Position, Xcel Energy Services Inc. | January 2018 — July 2018 | |||||||||||||||||||
| Lead Assistant General Counsel, Xcel Energy Services Inc. | July 2015 — January 2018 | |||||||||||||||||||
| Jeffrey S. Savage (e) | 50 | Senior Vice President, Controller, Xcel Energy Inc. | January 2015 — Present | |||||||||||||||||
| Brian J. Van Abel | 40 | Executive Vice President, Chief Financial Officer, Xcel Energy Inc. | March 2020 — Present | |||||||||||||||||
| Senior Vice President, Finance and Corporate Development, Xcel Energy Services Inc. | September 2018 — March 2020 | |||||||||||||||||||
| Vice President, Treasurer, Xcel Energy Services Inc. | July 2015 — September 2018 |
(a) No family relationships exist between any of the executive officers or directors.
(b)Ages as of Feb. 23, 2022.
(c)In April 2014, Energy Future Holdings Corp., the majority of its subsidiaries, including Texas Competitive Energy Holdings the parent company of Luminant, filed a voluntary bankruptcy petition under Chapter 11 of the United States Bankruptcy Code. Texas Competitive Energy Holdings emerged from Chapter 11 in October 2016.
(d)Effective March 1, 2022, Mr. Carter will assume the role of Executive Vice President, Group President, Utilities, and Chief Customer Officer.
(e)Effective March 1, 2022, Mr. Savage will assume the role of Chief Audit and Financial Services Officer and will no longer be serving as an executive officer.
Previous: Cover and table of contents · Next: Item 1A. RISK FACTORS