 filings.tools
Yum! Brands (YUM) 10-K risk factor changes: FY2018 vs FY2017
The 2018-12-31 10-K against the 2017-12-31 one, compared heading by heading and sentence by sentence.
Item 1A72 rewritten27 added15 removed240 unchanged
All filing items1,208 rewritten856 added452 removed2,046 unchanged
Summary
counted, not written
- Item 1A lists 29 risk factor headings: 1 new, 3 reworded and 25 unchanged since FY2017. 0 headings from FY2017 no longer appear.
- Sentence by sentence, 856 added, 452 removed, 1,208 rewritten and 2,046 unchanged across 19 items that differ.
New Item 1A headings (1)
- Unreliable or inefficient restaurant or consumer interfacing technology or the failure to successfully implement technology initiatives in the future could adversely impact operating results.
Removed Item 1A headings (0)
Every FY2017 risk factor heading is still here, word for word or reworded.
Reworded Item 1A headings (3)
- There are risks associated with our increasing dependence on digital commerce platforms to maintain and grow sales.
[removed: In addition, aspects of our information technology systems][added: Such platforms] may experience disruptions, which could harm our ability to compete and conduct our business. [removed: The][added: A broader] standard for determining joint employer status[removed: could][added: may] adversely affect our business operations and increase our[removed: liabilities resulting from actions by our Concepts’ franchisees.][added: liabilities.]- Our Concepts’ brands may be
[removed: limited][added: harmed] or diluted through franchisee and third-party activity.
A heading is new when no FY2017 heading matches it after ignoring case and punctuation, and reworded when it shares at least 60 percent of its words with one that went away. All current risk factor headings.
Sentences by item
21 items, with every count and a link to each item that changed
Underlined words on a shaded ground are new in FY2018; struck-through words were in FY2017. Sentences that are wholly new or wholly gone are labelled rather than marked.
Item 1A. Risk Factors.
72 rewritten, 27 added, 15 removed, 240 unchanged
Food-borne illnesses, such as E. coli, [removed: trichinosis, listeria] [added: Listeria, Salmonella] and [removed: salmonella,] [added: Trichinosis,] occur or may occur within our system from time to time.
Any report or publicity linking us or one of our Concepts’ restaurants, including restaurants operated by us or our Concepts’ franchisees, or linking our competitors or [removed: our] [added: the retail food] industry generally, to instances of food-borne illness or food safety issues could adversely affect our Concepts’ brands and reputations as well as our revenues and profits, and possibly lead to product liability claims, litigation and damages.
If a customer of one of our Concepts becomes ill [added: from food borne illnesses or] as a result of food safety issues, restaurants in our system may be temporarily closed, which could disrupt our operations and have a material adverse effect on our business, financial condition and results of operations.
Such events could also significantly impact our industry and cause a temporary closure of restaurants, which [removed: would] [added: could] severely disrupt our operations and have a material adverse effect on our business, financial condition and results of operations.
Avian flu outbreaks could also adversely affect the price and availability of poultry, which could negatively impact [removed: our] profit margins and [removed: revenues.][added: revenues for us and our Concepts' franchisees.]
We could also be adversely affected if government authorities impose mandatory closures, seek voluntary [removed: closures or] [added: closures,] impose restrictions on operations of [removed: restaurants.][added: restaurants, or restrict the import or export of products, or if suppliers issue mass recalls of products.]
Our refranchising efforts have [removed: increased, and will continue to increase,] [added: increased] our dependence on the financial success and cooperation of our Concepts’ franchisees.
If our Concepts’ franchisees do not meet our expectations for new unit development, we may fall short of our system sales [removed: growth] targets.
If our Concepts’ franchisees [added: fail to adequately capitalize their businesses or] incur too much debt, if their operating expenses or commodity prices increase or if economic or sales trends deteriorate such that they are unable to operate profitably or repay existing debt, it could result in their financial distress, including insolvency or bankruptcy.
In addition, we are [removed: contingently] [added: secondarily] liable on certain of our Concepts’ franchisees’ lease agreements, including lease agreements that we have guaranteed or assigned to franchisees in connection with the refranchising of certain Company-owned restaurants.
Additionally, the failure of our Concepts’ franchisees to focus on the fundamentals of restaurant operations, such as [removed: quality] [added: quality,] service and cleanliness (even if such failures do not rise to the level of breaching the related franchise documents), could have a negative impact on our business.
We are in the process of implementing our [added: previously announced] strategic transformation plans to drive global expansion of our KFC, Pizza Hut and Taco Bell brands.
[removed: Among other things, this transformation includes a plan to become at least] [added: Following our becoming] 98% franchised [removed: by] [added: as of] the end of [removed: 2018 and] [added: 2018, the remaining components of this transformation include, among other things, a plan] to significantly reduce annual capital expenditures and our general and administrative [removed: costs, each] [added: costs] by the end of 2019.
[added: There is no assurance that we will successfully implement, or fully] realize the anticipated positive impact of, our transformation initiatives, or execute successfully on our transformation strategy, in the expected timeframes or at all.
In connection with the [removed: Separation,] [added: spin-off of our China business in 2016,] we entered into a Master License Agreement with Yum China pursuant to which Yum China is the exclusive licensee of the KFC, Pizza Hut and Taco Bell Concepts and their related marks and other intellectual property rights for restaurant services in China.
Yum China's business is exposed to risks in China, which include, among others, changes in economic conditions (including consumer spending, unemployment levels and wage and commodity inflation), consumer preferences, [removed: and] the regulatory environment, [added: and tax laws and regulations including the tax treatment of the royalty paid to YUM,] as well as increased media scrutiny of our Concepts and industry, fluctuations in foreign exchange [removed: rates] [added: rates, increased restrictions or tariffs on imported supplies as a result of trade disputes] and increased competition.
Our relationship with Yum China is governed [added: primarily] by a Master License Agreement, which may be terminated upon the occurrence of certain events, such as the insolvency or bankruptcy of Yum China.
As a result, our business [removed: is] [added: and the businesses of our Concepts’ franchisees are] increasingly exposed to risks inherent in international operations.
These risks, which can vary substantially by country, include political instability, corruption, anti-American sentiment and social and ethnic unrest, as well as changes in economic conditions (including consumer spending, unemployment levels and wage and commodity inflation), the regulatory environment, income and non-income based tax rates and laws, sanctions, foreign exchange control [removed: regimes,] [added: regimes including restrictions on currency conversion,] consumer preferences and the laws and policies that govern foreign investment in countries where our [added: Concepts'] restaurants are operated.
In addition, [added: we and] our franchisees do business in jurisdictions that may be subject to trade or economic sanction regimes and such sanctions could be expanded.
Any failure to comply with such sanction regimes or other similar laws or regulations could result in the assessment of damages, the imposition of penalties, suspension of business licenses, or a cessation of operations at our [added: or our] franchisees’ businesses, as well as damage to our and our Concepts’ brands’ images and reputations, all of which could harm our profitability.
[removed: There can be no assurance] as to the future effect of any such changes on our results of operations, financial condition or cash flows.
In addition, the [removed: Chinese government restricts] [added: governments in certain countries where we operate, including China, restrict] the [removed: convertibility] [added: conversion] of [removed: RMB] [added: local currency] into foreign currencies and, in certain cases, the remittance of currency out of [removed: China.][added: the country.]
In [removed: addition] [added: addition,] restrictions on the conversion of RMB to U.S. dollars or further restrictions on the remittance of currency out of China could result in delays in the remittance of Yum China’s license fee, which could impact our liquidity.
In addition, our vendors and/or franchisees receive and maintain certain personal, financial and other information about our employees [added: and customers.]
For example, the European Union adopted a new regulation that [removed: becomes] [added: became] effective in May 2018, The General Data Protection Regulation ("GDPR"), which requires companies to meet new requirements regarding the handling of personal data.
Our failure to adhere to or successfully implement appropriate processes to adhere to the requirements of [removed: GDPR] [added: GDPR, CCPA] and other [added: evolving] laws and regulations in this area could result in financial penalties, legal liability and could damage our and our Concepts’ brands’ reputations.
[removed: In addition, aspects of our information technology systems] [added: Such platforms] may experience disruptions, which could harm our ability to compete and conduct our business.*
[removed: In addition,] Yum China, our largest franchisee, [removed: relies heavily on] [added: utilizes] third-party mobile payment apps such as Alipay and WeChat as a means through which to generate sales and process payments.
The dissemination of information [removed: via social media] [added: online] could harm our business, reputation, financial condition, and results of operations, regardless of the information’s accuracy.
[removed: Such] [added: Future, similar] shortages or disruptions could be caused by inclement weather, natural disasters, inaccurate forecasting of customer demand, problems in production or distribution, restrictions on imports or [removed: exports,] [added: exports including due to trade disputes,] the inability of vendors to obtain credit, political instability in the countries in which [added: the] suppliers and distributors are located, the financial instability of suppliers and distributors, suppliers’ or distributors’ failure to meet our [removed: standards,] [added: standards or requirements,] product quality issues, inflation, other factors relating to the suppliers and distributors and the countries in which they are located, food safety warnings or advisories or the prospect of such pronouncements, [added: product recalls,] the cancellation of supply or distribution agreements or an inability to renew such arrangements or to find replacements on commercially reasonable terms, or other conditions beyond our control or the control of our Concepts’ franchisees.
Our growth strategy depends on our and our Concepts’ franchisees’ ability to increase [removed: our] net restaurant count in markets around the [removed: world, especially in emerging markets.][added: world.]
Other risks that could impact our ability to increase the number of our restaurants include prevailing economic conditions and trade or economic sanctions and our, or our Concepts’ franchisees’, ability to obtain suitable restaurant locations, negotiate acceptable lease or purchase terms for the locations, obtain required permits and approvals in a timely manner, hire and train qualified [added: management teams and] restaurant [removed: crews] [added: crews,] and meet construction schedules.
Expansion into target markets could also be affected by our Concepts’ franchisees’ [added: willingness to invest capital or] ability to obtain financing to construct and open new restaurants.
If it becomes more difficult or more expensive for our Concepts’ franchisees to obtain financing to develop new restaurants, [added: or if] the [added: perceived return on invested capital is not sufficiently attractive, the] expected growth of our system could slow and our future revenues and operating cash flows could be adversely impacted.
Restaurant operations are highly service-oriented and our success depends in part upon our and our Concepts’ franchisees’ ability to attract, retain and motivate a sufficient number of qualified employees, including [added: franchisee management,] restaurant managers and other crew members.
The market for qualified employees in [removed: our] [added: the retail food] industry is very competitive.
Any such delays, material increases in employee turnover rate in [added: franchisee management or] existing restaurants or widespread employee dissatisfaction could have a material adverse effect on our and our Concepts’ franchisees’ business and results of operations.
[removed: *The] [added: *A broader] standard for determining joint employer status [removed: could] [added: may] adversely affect our business operations and increase our [removed: liabilities resulting from actions by our Concepts’ franchisees.*][added: liabilities.*]
The National Labor Relations [removed: Board’s] [added: Board] (the “NLRB”) [added: in 2014 adopted a new and broader] standard for determining when two or more otherwise unrelated employers may be found to be a joint employer of the same employees under the National Labor Relations [removed: Act is uncertain and subject to change.][added: Act.]
At the end of 2018, over 98% of our stores are operated by franchisees.
If Yum China’s business is harmed or development of our Concepts’ restaurants is slowed in China due to any of these factors, it could negatively impact the royalty paid by Yum China to us, which would negatively impact our financial results or our growth prospects.
In addition, in June 2018 the State of California enacted the California Consumer Privacy Act (the “CCPA”), which will become effective in 2020, requiring companies that process information on California residents to, among other things, make new disclosures to consumers about data collection, use and sharing practices.
*Unreliable or inefficient restaurant or consumer interfacing technology or the failure to successfully implement technology initiatives in the future could adversely impact operating results.*
We and our Concepts’ franchisees' rely heavily on information technology systems in the conduct of our business, some of which are managed, hosted, provided and/or used by third parties, including, for example, point-of-sale processing in our restaurants, management of our supply chain and various other processes and procedures.
These systems are subject to damage, interruption or failure due to theft, fire, power outages, telecommunications failure, computer viruses, security breaches, malicious cyber-attacks or other catastrophic events.
Certain technology systems may also be unreliable or inefficient, and technology vendors may limit or terminate product support and maintenance, which could impact the reliability of critical systems operations.
If our or our Concepts' franchisees' information technology systems are damaged or fail to function properly, we may incur substantial costs to repair or replace them, and may experience loss of critical data and interruptions or delays in our ability to manage inventories or process transactions, which could result in lost sales, customer or employee dissatisfaction, or negative publicity that could negatively impact our reputation, results of operations and financial condition.
We and our Concepts’ franchisees rely on technology not only to efficiently operate our restaurants but also to drive the customer experience, sales growth and margin improvement.
Execution of our growth strategy will be dependent on our initiatives to implement technology solutions and gather and leverage data to enhance restaurant operations and improve the customer experience.
Our strategic technology initiatives may not be timely implemented or may not achieve the desired results.
Even if we effectively implement and manage our technology initiatives, they may not result in sales growth or margin improvement.
Additionally, implementing the evolving technology demands of the consumer may place a significant financial burden on us and our Concepts’ franchisees.
In February 2018, we and our franchisees transitioned to a new distributor for the products supplied to our approximately 900 KFCs in the United Kingdom and Ireland.
In connection with this transition, certain of the restaurants experienced supply availability issues which resulted in store closures or stores operating under a limited menu for a period of time.
The pending withdrawal of the United Kingdom from the European Union, particularly if such withdrawal occurs without a transition agreement in effect, may result in the reimposition of customs and border controls, which in turn may result in shortages or interruptions in supply to our Concepts in the United Kingdom with
consequences similar to those described above.
If we and our Concepts’ franchisees are unable to manage the cost
Changes in tax laws may arise as a result of guidance issued by the Organisation for Economic Co-operation and Development (“OECD”), a coalition of member nations including the United States.
The OECD guidance, referred to as the Base Erosion and Profit Shifting (“BEPS”) Action Plan, does not have the force of law, but certain countries may enact tax legislation, modify tax treaties, and/or increase audit scrutiny based on the BEPS guidance.
To the extent BEPS principles are adopted by major jurisdictions in which we operate, it could increase our taxes and have a material adverse impact on our results of operations and financial position.
In addition, public perception that we are not paying a sufficient amount of taxes could damage our Concepts’ reputations, which could harm our profitability.
We rely on a combination of
As of December 31, 2018, our total outstanding short-term borrowings and long-term debt was approximately $10 billion.
| • | increasing our exposure to the risk of discontinuance or modification of certain reference rates including LIBOR, which are used to calculate applicable interest rates of our indebtedness and certain derivative instruments that hedge interest rate risk; |
| --- | --- |
| | |
In 2016, we announced our plan to become at least 98% franchised by the end of 2018.
There is no assurance that we will successfully implement, or fully
and customers.
In addition, the general counsel’s office of the NLRB has issued complaints naming McDonald’s Corporation as a joint employer of workers at its franchisees for alleged violations of the U.S. Fair Labor Standards Act.
Further, there is no assurance that we or our Concepts will not receive similar complaints as McDonald’s Corporation in the future, which could result in legal proceedings based on the actions of our Concepts’ franchisees.
qualities.
Our accruals for tax liabilities are based on past experience, interpretations of applicable law, and judgments about potential actions by tax authorities, but because such accruals require significant judgment the ultimate resolution of any tax matters may result in payments greater than the amounts accrued.
On December 22, 2017, the U.S. government enacted comprehensive Federal tax legislation commonly referred to as the Tax Cuts and Jobs Act of 2017 (the “Tax Act”) which significantly modifies the U.S. corporate income tax system.
Due to the timing of the enactment and the complexity involved in applying the provisions of the Tax Act, we have made reasonable estimates of its effects and recorded provisional amounts for the year ended December 31, 2017, consistent with applicable SEC guidance.
(See details of the charge we recorded upon enactment of the Tax Act in Note 18 to the Consolidated Financial Statements included in Item 8 of this Form 10-K.) These provisional amounts include a one-time mandatory deemed repatriation tax on accumulated foreign earnings, the remeasurement of certain net deferred tax assets and liabilities and the establishment of a valuation allowance on our foreign tax credits.
We are continuing to evaluate the Tax Act and its requirements, as well as its application to our business and its impact on our ongoing effective tax rate.
The final impacts of the Tax Act may differ from current estimates and provisional amounts recorded, possibly materially, due to, among other things, changes in interpretations of the Tax Act, changes in accounting standards for income taxes or related accounting interpretations in response to the Tax Act, or updates or changes to estimates the Company has utilized to calculate the provisional impacts.
IRS.
In connection with the announcement of our strategic transformation plans, we have increased our indebtedness from approximately $4 billion to approximately $10 billion.
The proceeds from the debt were primarily used to return capital to shareholders through share repurchases and dividends.
An excerpt. Shown here: 40 of 72 rewritten, all 27 added and all 15 removed. The counts are complete. For every sentence, read Item 1A. Risk Factors. in the FY2018 filing and the FY2017 filing.
Item 7. Management’s Discussion and Analysis of Financial Condition and Results of Operations.
299 rewritten, 242 added, 111 removed, 418 unchanged
Brands, Inc. (“YUM” or the “Company”) [removed: operates or] franchises [added: or operates] a worldwide system of over [removed: 45,000] [added: 48,000] restaurants in more than [removed: 135] [added: 140] countries and territories, [added: primarily] under the concepts of KFC, Pizza Hut and Taco Bell (collectively, the "Concepts").
Of the over [removed: 45,000] [added: 48,000] restaurants, [removed: 3% are operated by the Company and its subsidiaries and 97%] [added: 98%] are operated by franchisees.
As of December 31, [removed: 2017,] [added: 2018,] YUM consists of three operating segments:
On October 31, [removed: 2016] [added: 2016,] (the “Distribution Date”), we completed the spin-off of our China business (the "Separation") into an independent, publicly-traded company under the name of Yum China Holdings, Inc. (“Yum China”).
Concurrent with the Separation, a subsidiary of the Company entered into a Master License Agreement with a subsidiary of Yum China for the exclusive right to use and sublicense the use of intellectual property owned by YUM and its affiliates for the development and operation of KFC, Pizza Hut and Taco Bell restaurants in [added: mainland] China.
| • | Building [removed: Distinctive, Relevant and] [added: Relevant,] Easy [added: and Distinctive] Brands |
| • | More Franchised. YUM [removed: intends] [added: successfully increased] franchise restaurant ownership to [removed: be at least] 98% [removed: by the end] [added: as] of [added: December 31,] 2018. |
We [removed: intend to fund] [added: are funding] these shareholder returns through a combination of refranchising proceeds, free cash flow generation and maintenance of our five times EBITDA leverage.
Rather, the Company believes that the presentation of these non-GAAP measurements provide additional information to investors to facilitate the comparison of past and present [removed: operations, excluding items that the Company does not believe are indicative of our ongoing operations due to their size and/or nature.][added: operations.]
[removed: Special Items are not included in any of our Division segment results as our] [added: Our] chief operating decision maker does not consider the impact of [removed: these items] [added: Special Items] when assessing segment performance.
[removed: We provide] [added: For 2016 we provided] Core Operating Profit excluding 53rd week and System sales excluding 53rd week to further enhance the comparability with the lapping of the 53rd week that was part of our fiscal calendar in 2016.
All comparisons within this summary are versus the same period a year [removed: ago and include the impact of lapping a 53rd week in 2016, unless otherwise noted.][added: ago.]
| | [removed: 2017] [added: 2018] | | | | [removed: 2016] [added: 2017] | | | | [removed: 2015] [added: 2016] | | | | [removed: 2017] [added: 2018] | | | | | [removed: 2016] [added: 2017] | | | |
| Company sales | $ | [removed: 3,572] [added: 2,000] | | | $ | [removed: 4,189] [added: 3,572] | | | $ | [removed: 4,336] [added: 4,189] | | | [removed: (15] [added: (44] | ) | | | | [removed: (3] [added: (15] | ) | | |
| Total revenues | $ | [removed: 5,878] [added: 5,688] | | | $ | [removed: 6,356] [added: 5,878] | | | $ | [removed: 6,418] [added: 6,356] | | | [removed: (8] [added: (3] | ) | | | | [removed: (1] [added: (8] | ) | | |
| Restaurant profit | $ | [removed: 618] [added: 366] | | | $ | [removed: 700] [added: 618] | | | $ | [removed: 709] [added: 700] | | | [removed: (12] [added: (41] | ) | | | | [removed: (1] [added: (12] | ) | | |
| Restaurant margin % | [removed: 17.3] [added: 18.3] | | % | | [removed: 16.7] [added: 17.3] | | % | | [removed: 16.3] [added: 16.7] | | % | | [removed: 0.6] [added: 1.0] | | | ppts. | | [removed: 0.4] [added: 0.6] | | | ppts. |
| G&A expenses | $ | [removed: 999] [added: 895] | | | $ | [removed: 1,129] [added: 999] | | | $ | [removed: 1,058] [added: 1,129] | | | [removed: 12] [added: 10] | | | | | [removed: (7] [added: 12] | [removed: )] | | |
| Franchise and [removed: license] [added: property] expenses | [removed: 237] [added: 188] | | | | [removed: 201] [added: 237] | | | | [removed: 240] [added: 201] | | | | [removed: (18] [added: 21] | [removed: )] | | | | [removed: 16] [added: (18] | [added: )] | | |
| Refranchising (gain) loss | [removed: (1,083] [added: (540] | | ) | | [removed: (163] [added: (1,083] | | ) | | [removed: 23] [added: (163] | | [added: )] | | [removed: NM] [added: (50] | [added: )] | | | | NM | | | |
| Other (income) expense | 7 | | | | [removed: 3] [added: 10] | | | | [removed: 20] [added: 18] | | | | [removed: (103] [added: NM] | [removed: )] | | | | [removed: 83] [added: NM] | | | |
| Operating Profit | $ | [removed: 2,761] [added: 2,296] | | | $ | [removed: 1,682] [added: 2,761] | | | $ | [removed: 1,434] [added: 1,682] | | | [removed: 64] [added: (17] | [added: )] | | | | [removed: 17] [added: 64] | | | |
| Other pension (income) expense | [removed: 47] [added: 14] | | | | [removed: 32] [added: 47] | | | | [removed: 40] [added: 32] | | | | [removed: (45] [added: 70] | [removed: )] | | | | [removed: 18] [added: (45] | [added: )] | | |
| Income tax provision | [removed: 934] [added: 297] | | | | [removed: 327] [added: 934] | | | | 327 | | | | [removed: NM] [added: 68] | | | | | [removed: —] [added: NM] | | | |
| Income from continuing operations | [removed: 1,340] [added: 1,542] | | | | [removed: 1,018] [added: 1,340] | | | | [removed: 926] [added: 1,018] | | | | [removed: 32] [added: 15] | | | | | [removed: 10] [added: 32] | | | |
| Income from discontinued operations, net of tax | N/A | | | | [removed: 625] [added: N/A] | | | | [removed: 357] [added: 625] | | | | NM | | | | | [removed: 75] [added: NM] | | | |
| Net Income | $ | [removed: 1,340] [added: 1,542] | | | $ | [removed: 1,643] [added: 1,340] | | | $ | [removed: 1,283] [added: 1,643] | | | [removed: (18] [added: 15] | [removed: )] | | | | [removed: 28] [added: (18] | [added: )] | | |
| Diluted EPS from continuing operations(a) | $ | [removed: 3.77] [added: 4.69] | | | $ | [removed: 2.54] [added: 3.77] | | | $ | [removed: 2.09] [added: 2.54] | | | [removed: 48] [added: 24] | | | | | [removed: 22] [added: 48] | | | |
| Diluted EPS from discontinued operations(a) | N/A | | | | [removed: $] [added: N/A] | [removed: 1.56] | | | $ | [removed: 0.81] [added: 1.56] | | | NM | | | | | [removed: 93] [added: NM] | | | |
| Diluted EPS(a) | $ | [removed: 3.77] [added: 4.69] | | | $ | [removed: 4.10] [added: 3.77] | | | $ | [removed: 2.90] [added: 4.10] | | | [removed: (8] [added: 24] | [removed: )] | | | | [removed: 42] [added: (8] | [added: )] | | |
| Effective tax rate - continuing operations | [removed: 41.1%] [added: 16.2%] | | | | [removed: 24.3%] [added: 41.1%] | | | | [removed: 26.1%] [added: 24.3%] | | | | [removed: (16.8] [added: 24.9] | [removed: )] | | ppts. | | [removed: 1.8] [added: (16.8] | [added: )] | | ppts. |
| Unit Count | [removed: 2017] [added: 2018] | | | [removed: 2016] [added: 2017] | | | [removed: 2015] [added: 2016] | | | [removed: 2017] [added: 2018] | | | [removed: 2016] [added: 2017] | |
| [removed: Franchise] [added: Franchise(a)] | [removed: 43,603] [added: 47,268] | | | [removed: 40,834] [added: 43,603] | | | [removed: 39,320] [added: 40,834] | | | [removed: 7] [added: 8] | | | [removed: 4] [added: 7] | |
| Company-owned | [removed: 1,481] [added: 856] | | | [removed: 2,841] [added: 1,481] | | | [removed: 3,163] [added: 2,841] | | | [removed: (48] [added: (42] | ) | | [removed: (10] [added: (48] | ) |
| | [removed: 45,084] [added: 48,124] | | | [removed: 43,675] [added: 45,084] | | | [removed: 42,483] [added: 43,675] | | | [removed: 3] [added: 7] | | | 3 | |
| | | [removed: 2017] [added: 2018] | | [added: 2017] | [removed: 2016] | [added: 2016] |
| System Sales Growth, reported | | [added: 5 | | |] 4 | | | 3 | |
| System Sales Growth, excluding FX | | [added: 5 | | |] 4 | | | 5 | |
| System Sales Growth, excluding FX and 53rd week | | [added: N/A | | |] 5 | | | 4 | |
| Same-Store Sales Growth | | 2 | | [added: 2] | [removed: 1] | [added: 1] |
On the Distribution Date, we distributed to each of our shareholders of record as of the close of business on October 19, 2016 (the “Record Date”) one share of Yum China common stock for each share of YUM common stock (“Common Stock”) held as of the Record Date.
The distribution was structured to be a tax free distribution to our U.S. shareholders for federal income tax purposes in the United States.
We intend to fund these shareholder returns through a combination of refranchising proceeds, free cash flow generation
and maintenance of our five times EBITDA leverage.
We generated pre-tax proceeds of $2.8 billion through our refranchising initiatives to achieve targeted franchise ownership of 98%, which were completed in December 2018.
Special Items are not included in any of our Division segment results as the Company does not believe they are indicative of our ongoing operations due to their size and/or nature.
For 2018, GAAP diluted EPS from continuing operations increased 24% to $4.69 per share, and diluted EPS from continuing operations excluding Special Items, increased 7% to $3.17 per share.
2018 financial highlights:
| KFC Division | +6 | | +2 | | +5 | | (2) | | (2) |
| Pizza Hut Division | +1 | | Even | | +10 | | +2 | | +2 |
| Taco Bell Division | +6 | | +4 | | +3 | | +2 | | +2 |
| Worldwide | +5 | | +2 | | +7 | | (17) | | Even |
| • | During the year, we opened 1,757 net new units and added 1,282 Telepizza units for 7% net new unit growth. |
| • | During the year, we refranchised 660 restaurants, including 364 KFC, 97 Pizza Hut and 199 Taco Bell units, for pre-tax proceeds of $825 million. We recorded net refranchising gains of $540 million in Special Items. |
| • | During the year, we repurchased 28.2 million shares totaling $2.4 billion at an average share price of $85. |
| | | | | | | | | | |
| --- | --- | --- | --- | --- | --- | --- | --- | --- | --- |
| | | | | | | | | | |
| | % Change | | | | | | | | |
| | System Sales, Ex FX | | Same-Store Sales | | Net New Units | | GAAP Operating Profit | | Core Operating Profit |
Additionally:
| Franchise and property revenues | 2,482 | | | | 2,306 | | | | 2,167 | | | | 8 | | | | | 6 | | | |
| Franchise contributions for advertising and other services | 1,206 | | | | — | | | | — | | | | N/A | | | | | N/A | | | |
| Franchise advertising and other services expense | 1,208 | | | | — | | | | — | | | | N/A | | | | | N/A | | | |
| Investment (income) expense, net | (9 | | ) | | (5 | | ) | | (2 | | ) | | 88 | | | | | NM | | | |
| Interest expense, net | 452 | | | | 445 | | | | 307 | | | | (1 | ) | | | | (45 | ) | | |
| (a) | Includes 1,282 Telepizza units as of December 31, 2018. See description of the Telepizza strategic alliance within this MD&A. |
| | | | | | | | | | |
| --- | --- | --- | --- | --- | --- | --- | --- | --- | --- |
| | | | | | | | | | |
| | | | | | | | | | |
| | | | | | | | | | |
| Special Items Income - Operating Profit | | 530 | | | | 1,001 | | | | 35 | | |
| Effective Tax Rate excluding Special Items(b) | | 20.4 | | % | | 18.8 | | % | | 26.3 | | % |
| (b) | During the year ended December 31, 2018, we recorded a $35 million decrease related to our provisional tax expense recorded in the fourth quarter of 2017 associated with the Tax Cuts and Jobs Act of 2017 ("Tax Act") that was reported as a Special Item. We also recorded a Special Items tax benefit of $31 million in the year ended December 31, 2018 related to current year U.S. foreign tax credits that became realizable directly as a result of the impact of deemed repatriation tax expense associated with the Tax Act. We recognized $434 million in our 2017 Income tax provision that was reported as a Special Item as a result of the December 22, 2017 enactment of the Tax Act. |
Items Impacting Reported Results and/or Expected to Impact Future Results
Beginning mid-May 2018, all restaurants opened for business, offering their full menus, with advertising beginning at the end of May.
On a full-year basis, Core Operating Profit growth was negatively impacted by approximately 2 percentage points for KFC Division and approximately 1 percentage point for YUM as a result of these first-half supply availability issues.
The negative impact to full-year same-store sales growth for 2018 was approximately 50 basis points for our KFC Division and approximately 25 basis points for YUM.
Investment in Grubhub
We anticipate generating proceeds in excess of $2 billion, net of tax, through our refranchising initiatives.
| • | Operating margin is Operating Profit divided by Total revenues. |
| | | | | | | | | | | | | | | | | | | | | | |
| --- | --- | --- | --- | --- | --- | --- | --- | --- | --- | --- | --- | --- | --- | --- | --- | --- | --- | --- | --- | --- | --- |
| Franchise and license fees and income | 2,306 | | | | 2,167 | | | | 2,082 | | | | 6 | | | | | 4 | | | |
| Closures and impairment expenses | 3 | | | | 15 | | | | 16 | | | | 82 | | | | | 8 | | | |
| Interest expense, net | 440 | | | | 305 | | | | 141 | | | | (44 | ) | | | | NM | | | |
| | | | | | | |
| | | % B/(W) | | | | |
| Franchise and license fees and income | 8 | | | | 6 | | | | 7 | | | | 21 | | |
| Franchise and license fees and income | $ | 8 | | | $ | 6 | | | $ | 7 | | | $ | 21 | |
Non-GAAP Items
| (c) | Our 2017 Effective Tax Rate excluding Special Items was lower than prior years due primarily to the inclusion of tax expense on the repatriation of certain foreign earnings in 2017 being included in the one-time Special Items charge referenced in (a) above. The majority of our foreign entities have a tax year-end of November 30. Amounts repatriated from these foreign entities after November 30, 2017, which were significant due to the timing of international refranchising proceeds, were required to be taxed as part of the mandatory deemed repatriation tax in connection with the Tax Act. See Note 18. |
The KFC Division has 21,487 units, 81% of which are located outside the U.S. The KFC Division has experienced significant unit growth in emerging markets, which comprised approximately 60% of both the Division’s units and profits, respectively, as of the end of 2017.
| | | | | | | | | | | | | | | | | | | | | | | | | | | | | | | | | | | | | |
| --- | --- | --- | --- | --- | --- | --- | --- | --- | --- | --- | --- | --- | --- | --- | --- | --- | --- | --- | --- | --- | --- | --- | --- | --- | --- | --- | --- | --- | --- | --- | --- | --- | --- | --- | --- | --- |
| | | | | | | | | | | | | | | % B/(W) | | | | | | | | | | | | % B/(W) | | | | | | | | | | |
| Franchise and license fees and income | | 1,182 | | | | 1,069 | | | | 1,031 | | | | 11 | | | | 10 | | | | 11 | | | | 4 | | | | 7 | | | | 7 | | |
| Franchise | | 18,473 | | | 994 | | | (412 | ) | | 180 | | | — | | | 1 | | | 19,236 | |
| Company-owned | | 1,513 | | | 114 | | | (39 | ) | | (180 | ) | | — | | | (1 | ) | | 1,407 | |
| Total | | 19,986 | | | 1,108 | | | (451 | ) | | — | | | — | | | — | | | 20,643 | |
| | | | | | | | | | | | | | | | | | | | | | | | |
| --- | --- | --- | --- | --- | --- | --- | --- | --- | --- | --- | --- | --- | --- | --- | --- | --- | --- | --- | --- | --- | --- | --- | --- |
| | 2016 vs. 2015 | | | | | | | | | | | | | | | | | | | | | | |
| Company sales | $ | 2,191 | | | $ | 24 | | | $ | 39 | | | $ | (124 | ) | | $ | 26 | | | $ | 2,156 | |
| Company restaurant expenses | $ | (1,884 | ) | | $ | (10 | ) | | $ | (31 | ) | | $ | 106 | | | $ | (20 | ) | | $ | (1,839 | ) |
The increase in Restaurant profit associated with store portfolio actions was driven by international net new unit growth.
Franchise and License Fees and Income
In 2016, the increase in G&A, excluding the impacts of foreign currency translation and 53rd week, were driven by the impact of higher compensation costs due to increased headcount and wage inflation in international markets and higher incentive compensation.
Emerging markets comprised approximately 35% of units and 40% of profits for the Division as of the end of 2017.
| Franchise and license fees and income | | 608 | | | | 615 | | | | 604 | | | | (1 | ) | | | (1 | ) | | | — | | | | 2 | | | | 4 | | | | 3 | | |
| Franchise | | 15,334 | | | 885 | | | (554 | ) | | 206 | | | — | | | — | | | 15,871 | |
| Company-owned | | 750 | | | 40 | | | (35 | ) | | (206 | ) | | — | | | — | | | 549 | |
| Total | | 16,084 | | | 925 | | | (589 | ) | | — | | | — | | | — | | | 16,420 | |
| Company sales | $ | 601 | | | $ | (120 | ) | | $ | 16 | | | $ | (9 | ) | | $ | 5 | | | $ | 493 | |
| Cost of sales | (167 | | ) | | 34 | | | | (5 | | ) | | 3 | | | | (2 | | ) | | (137 | | ) |
| Cost of labor | (187 | | ) | | 40 | | | | (11 | | ) | | 3 | | | | (1 | | ) | | (156 | | ) |
| Company restaurant expenses | $ | (543 | ) | | $ | 107 | | | $ | (21 | ) | | $ | 9 | | | $ | (4 | ) | | $ | (452 | ) |
In 2016, the increase in Franchise and license fees income, excluding the impacts of foreign currency translation and 53rd week, was driven by net new unit growth, refranchising and higher fees from expiring development agreements, partially offset by franchise same-store sales declines of 2%.
The Taco Bell Division has 6,849 units, 94% of which are in the U.S. As of the end of 2017, the Company owns 10% of the Taco Bell units in the U.S., where the brand has historically achieved high restaurant margins and returns.
An excerpt. Shown here: 40 of 299 rewritten, 40 of 242 added and 40 of 111 removed. The counts are complete. For every sentence, read Item 7. Management’s Discussion and Analysis of Financial Condition and Results of Operations. in the FY2018 filing and the FY2017 filing.
Item 7A. Quantitative and Qualitative Disclosures About Market Risk.
11 rewritten, 5 added, 1 removed, 21 unchanged
The Company is exposed to financial market risks associated with interest rates, foreign currency exchange [removed: rates and] [added: rates,] commodity [removed: prices.][added: prices and the value of our equity investment in Grubhub.]
We have a market risk exposure to changes in interest rates, principally in the U.S. Our outstanding [removed: Long-term] [added: total] debt of [removed: $9.8] [added: $10.1] billion includes [removed: 75%] [added: 76%] fixed-rate debt and [removed: 25%] [added: 24%] variable-rate debt.
We have attempted to minimize the interest rate risk [removed: related to $1.55 billion of this] [added: from] variable-rate debt through the use of interest rate [removed: swaps.][added: swaps that, as of December 31, 2018, result in a fixed interest rate on $1.55 billion of our variable rate debt.]
As a result, approximately [removed: 90%] [added: 91%] of our [removed: $9.8] [added: $10.1] billion of outstanding debt at December 31, [removed: 2017] [added: 2018] is effectively fixed-rate debt.
See Note [removed: 11] [added: 10] for details on these issuances and repayments and Note [removed: 13] [added: 12] for details related to interest rate swaps.
As of [added: both] December 31, [removed: 2017] [added: 2018] and December 31, [removed: 2016] [added: 2017] a hypothetical 100 basis-point increase in short-term interest rates would result, over the following twelve-month period after consideration of the aforementioned interest rate swaps, in an increase of approximately $9 million [removed: and $10 million, respectively,] in Interest expense, net within our Consolidated Statements of Income.
The fair value of our cumulative fixed-rate debt of [removed: $7.3] [added: $7.7] billion as of December 31, [removed: 2017,] [added: 2018,] would decrease approximately $400 million as a result of the same hypothetical 100 basis-point increase.
At December 31, [removed: 2017,] [added: 2018,] a hypothetical 100 basis-point decrease in short-term interest rates would decrease the fair value of our interest rate swaps approximately [removed: $50] [added: $100] million.
The Company’s foreign currency net asset exposure (defined as foreign currency assets less foreign currency liabilities) totaled approximately [removed: $2.0] [added: $1.6] billion as of December 31, [removed: 2017.][added: 2018.]
For the fiscal year ended December 31, [removed: 2017] [added: 2018] Operating Profit would have decreased approximately [removed: $180] [added: $135] million if all foreign currencies had uniformly weakened 10% relative to the U.S. dollar.
This estimated reduction assumes no changes in sales [removed: volumes or] [added: volumes,] local currency sales or input prices.
Equity Investment Risk
YUM holds 2,820,464 shares of Grubhub common stock (See Note 5).
As of December 31, 2018, the NYSE composite closing sales price of Grubhub was $76.81.
A hypothetical 10% decline in the price of these shares would result in a $21 million decrease in the fair value of these investments, which would be reflected as a charge in Investment (income) expense, net within our Consolidated Statements of Income.
The effects of changes in market prices for equity securities are unpredictable, which could cause significant fluctuations in our quarterly and annual results.
We attempt to minimize the exposure related to our net investments in foreign operations by financing those investments with local currency denominated debt when practical.
Item 1. Business.
30 rewritten, 40 added, 33 removed, 93 unchanged
Our website address is [removed: http://yum.com.][added: http://www.yum.com.]
[removed: Brands, Inc., referred to as the Company,] [added: While YUM] does not directly own or operate any restaurants, throughout this document we may refer to restaurants that are owned or operated by our subsidiaries as being Company-owned.
[removed: Financial Information] [added: Information] about Operating [removed: Segments and General Development of the Business][added: Segments]
As of December 31, [removed: 2017,] [added: 2018,] YUM consists of three operating segments:
Most restaurants in each Concept offer consumers the ability to dine in and/or [removed: carry out] [added: carryout] food.
[removed: In] [added: On] February [added: 7,] 2018, [removed: we] [added: certain of our subsidiaries] entered into [removed: an] [added: a master services] agreement with [removed: GrubHub, Inc., ("Grubhub") the leading] [added: an affiliate of Grubhub, Inc. ("Grubhub"), an] online and mobile [removed: take out] [added: takeout] food-ordering company in the [removed: U.S. Under the agreement, Grubhub will] [added: U.S., which is intended to] provide [added: dedicated] support [removed: in the U.S.] for the KFC and Taco Bell branded online delivery [removed: channels, along with access to Grubhub's] [added: channels in the U.S. through Grubhub’s] online ordering platform, logistics and last-mile support for delivery orders, [removed: and] [added: as well as] point-of-sale integration to streamline operations.
Under [removed: store-level] [added: both types of] franchise [removed: agreements,] [added: programs,] franchisees supply capital [removed: – initially] by [removed: paying a franchise fee to YUM, by] purchasing or leasing the land, building, equipment, signs, seating, inventories and supplies and, over the longer term, by reinvesting in the business.
In certain [added: historical] refranchising transactions the Company may [removed: retain] [added: have retained] ownership of land and building and [added: continues to] lease them to the franchisee.
Under master franchise arrangements, the Company enters into agreements that allow master franchisees to operate restaurants as well as sub-franchise [added: restaurants] within certain geographic territories.
Master franchisees are [added: typically] responsible for overseeing development within their territories and [removed: collect initial fees and royalties from] [added: performing certain other administrative duties with regard to the oversight of] sub-franchisees.
Our largest master franchisee, Yum China, pays [added: the Company] a [removed: 3% license] [added: continuing] fee [added: of 3%] on system sales of our Concepts in mainland [removed: China to the Company.][added: China.]
[removed: | • | KFC was founded in Corbin, Kentucky by Colonel Harland D. Sanders, an early developer of the quick service food business and a pioneer of the restaurant franchise concept.] The Colonel perfected his secret blend of 11 herbs and spices for Kentucky Fried Chicken in 1939 and signed up his first franchisee in 1952. [removed: |]
[removed: | • |] KFC restaurants across the world offer fried and non-fried chicken products such as sandwiches, chicken strips, chicken-on-the-bone and other chicken products marketed under a variety of names. [removed: KFC restaurants also offer a variety of entrees and side items suited to local preferences and tastes. Restaurant decor throughout the world is characterized by the image of the Colonel. |]
[removed: | • |] The first Pizza Hut restaurant was opened in 1958 in Wichita, Kansas, and within a year, the first franchise unit was opened. [removed: Today, Pizza Hut is the largest restaurant chain in the world specializing in the sale of ready-to-eat pizza products. |]
[removed: | • |] Pizza Hut operates in the delivery, carryout and casual dining segments around the world. [removed: Outside of the U.S., Pizza Hut often uses unique branding to differentiate these segments. Additionally, a growing percentage of Pizza Hut's customer orders are being generated digitally. |]
[removed: | • |] The first Taco Bell restaurant was opened in 1962 by Glen Bell in Downey, California, and in 1964, the first Taco Bell franchise was sold. [removed: |]
[removed: | • |] Taco Bell specializes in Mexican-style food products, including various types of tacos, burritos, quesadillas, salads, nachos and other related items. [removed: Taco Bell offers breakfast items in its U.S. stores. Taco Bell units feature a distinctive bell logo on their signage. |]
[removed: Non-traditional] units include express units and kiosks [removed: which] [added: that] have a more limited menu, usually generate lower sales volumes and operate in non-traditional locations like malls, airports, gasoline service stations, train stations, subways, convenience stores, stadiums, amusement parks and colleges, where a full-scale traditional outlet would not be practical or efficient.
The Company [removed: has] [added: does] not [removed: experienced any] [added: typically experience] significant continuous shortages of supplies, and alternative sources for most of these products are generally available.
We and our franchisees have approximately [removed: 6,400] [added: 6,300] food and paper suppliers, including U.S.-based suppliers that export to many countries.
The retail food industry, in which our Concepts compete, is made up of supermarkets, supercenters, warehouse stores, convenience stores, coffee shops, snack bars, delicatessens and restaurants (including [added: those in] the QSR segment), and is intensely competitive with respect to price and quality of food products, new product development, digital engagement, advertising levels and promotional initiatives, customer service reputation, restaurant location and attractiveness and maintenance of properties.
The [added: retail food] industry is often affected by changes in consumer tastes; national, regional or local economic conditions; currency fluctuations; demographic trends; traffic patterns; the type, number and location of competing food retailers and products; and disposable purchasing power.
Each of [removed: the] [added: our] Concepts competes with international, national and regional restaurant chains as well as locally-owned restaurants, not only for customers, but also for management and hourly personnel, suitable real estate sites and qualified franchisees.
During [removed: 2017,] [added: 2018,] there were no material capital expenditures for environmental control facilities and no such material expenditures are anticipated.
Each of our and our Concepts’ franchisees' restaurants in the U.S. must comply with licensing [added: requirements] and [removed: regulation] [added: regulations promulgated] by a number of governmental authorities, which include health, sanitation, safety, fire and zoning agencies in the state and/or municipality in which the restaurant is located.
In addition, each Concept must comply with various [added: state and federal laws that regulate the franchisor/franchisee relationship.]
To date, the Company has not been materially adversely affected by such licensing [added: requirements] and [removed: regulation] [added: regulations] or by any difficulty, delay or failure to obtain required licenses or approvals.
As of year end [removed: 2017,] [added: 2018,] the Company and its subsidiaries employed approximately [removed: 60,000] [added: 34,000] persons.
Some employees are subject to labor council relationships that vary due to the diverse [removed: cultures] [added: countries] in which the Company operates.
The Company and its Concepts consider [removed: their] employee relations to be good.
Overview of Business
YUM has over 48,000 restaurants in more than 140 countries and territories primarily operating under the three concepts of KFC, Pizza Hut and Taco Bell (the “Concepts”).
These three concepts are global leaders of the chicken, pizza and Mexican-style food categories, respectively.
At December 31, 2018, 98% of our units are operated by independent franchisees or licensees under the terms of franchise or license agreements.
Following is a summary of our Concepts' operations and a brief description of each Concept as of and for the year ended December 31, 2018:
| | | | | | | | | | | | | | | | | |
| --- | --- | --- | --- | --- | --- | --- | --- | --- | --- | --- | --- | --- | --- | --- | --- | --- |
| | | | | | | | | | | | | | | | | |
| | | Number of Units | | | % of Units International | | | Number of Countries and Territories | | | % Franchised | | System Sales (in Millions) | | | |
| KFC Division | | 22,621 | | | 82 | % | | 136 | | | 99% | | $ | 26,239 | | |
| Pizza Hut Division* | | 18,431 | | | 59 | % | | 111 | | | 99% | | 12,212 | | | |
| Taco Bell Division | | 7,072 | | | 7 | % | | 27 | | | 93% | | 10,786 | | | |
| YUM* | | 48,124 | | | 62 | % | | 145 | | | 98% | | $ | 49,237 | | |
| | | | | | | | | | | | | | | | | |
*Unit information includes 1,282 units operating under the Telepizza brand as of December 31, 2018.
See Part II, Item 7 for a description of the Telepizza strategic alliance.
KFC was founded in Corbin, Kentucky by Colonel Harland D.
Sanders, an early developer of the quick service food business and a pioneer of the restaurant franchise concept.
Today, Pizza Hut is the largest restaurant chain in the world specializing in the sale of ready-to-eat pizza products.
Business Strategy
Four growth drivers form the basis of YUM’s strategic plans and repeatable business model to accelerate same-store sales growth and net new restaurant development at KFC, Pizza Hut and Taco Bell around the world over the long term.
The Company is focused on becoming best-in-class in:
| • | Building Relevant, Easy and Distinctive Brands |
| • | Developing Unmatched Franchise Operating Capability |
| • | Driving Bold Restaurant Development |
| • | Growing Unrivaled Culture and Talent |
Franchise Agreements
The Company is focused on partnering with franchisees who have the commitment, capability and capitalization to grow our Concepts.
Of our over 47,000 franchised units at December 31, 2018, approximately 30% operate under our master franchise programs, primarily units in China and those operating under the Telepizza strategic alliance (see Part II, Item 7 for a description of the Telepizza strategic alliance).
The remainder of our franchise units operate under store-level franchise agreements.
Store-level franchise agreements typically require payment to the Company of certain upfront fees such as initial fees paid upon opening of a store, fees paid to renew the term of the franchise agreement and fees paid in the event the franchise agreement is transferred to another franchisee.
Franchisees also pay monthly continuing fees based on a percentage of their restaurants' sales (typically 4% - 6%) and are required to spend a certain amount to advertise and promote the brand.
In exchange, master franchisees retain a certain percentage of fees payable by the sub-franchisees under their franchise agreements and typically pay lower fees for the restaurants they operate.
Non-traditional
Advertising and Promotional Programs
Company-owned and franchise restaurants are required to spend a percentage of their respective restaurants’ sales on advertising programs with the goal of increasing sales and enhancing the reputation of the Concepts.
Advertising may be conducted nationally, regionally and locally.
When multiple franchisees operate in the same country or region the national and regional advertising spending is typically conducted by a cooperative to which the franchisees and Company-owned stores, if any, contribute funds as a percentage of restaurants’ sales.
The contributions are primarily used to pay for expenses relating to purchasing media for advertising, market research, commercial production, talent payments and other support functions for the respective Concepts.
We control the advertising activities of certain advertising cooperatives through our majority voting rights.
While YUM!
| | |
| --- | --- |
On October 31, 2016 (the “Distribution Date”), we completed the spin-off of our China business (the "Separation") into an independent, publicly-traded company under the name of Yum China Holdings, Inc. (“Yum China”).
On the Distribution Date, we distributed to each of our shareholders of record as of the close of business on October 19, 2016 (the “Record Date”) one share of Yum China common stock for each share of our Common Stock held as of the Record Date.
The distribution was structured to be a tax free distribution to our U.S. shareholders for federal income tax purposes in the United States.
Yum China’s common stock trades on the New York Stock Exchange under the symbol “YUMC.” After the distribution, we do not beneficially own any shares of Yum China common stock.
Concurrent with the Separation, a subsidiary of the Company entered into a Master License Agreement with a subsidiary of Yum China for the exclusive right to use and sublicense the use of intellectual property owned by YUM and its affiliates for the development and operation of KFC, Pizza Hut and Taco Bell restaurants in China.
Prior to the Separation, our operations in mainland China were reported in our former China Division segment results.
As a result of the Separation, the results of operations and cash flows of the separated business are presented as discontinued operations in our Consolidated Statements of Income and Consolidated Statements of Cash Flows for periods presented prior to the Separation.
See additional information related to the impact of the Separation in Item 8, Note 4 to the Consolidated Financial Statements.
Operating segment information for the years ended December 31, 2017, 2016 and 2015 for the Company is included in Part II, Item 7, Management's Discussion and Analysis of Financial Condition and Results of Operations ("MD&A") and in the related Consolidated Financial Statements in Part II, Item 8.
Narrative Description of Business
General
YUM has over 45,000 restaurants in more than 135 countries and territories.
The Company's three concepts of KFC, Pizza Hut and Taco Bell (the “Concepts”), develop, operate or franchise a worldwide system of restaurants which prepare, package and sell a menu of competitively priced food items.
Units are operated by the Concepts or by independent franchisees or licensees under the terms of franchise or license agreements, which typically require an initial non-refundable fee upon an individual store opening and the payment of sales-based fees for use of our Concepts' brands.
Restaurant Concepts
Each Concept has proprietary menu items and emphasizes the preparation of food with high quality ingredients, as well as unique recipes and special seasonings to provide appealing, tasty and convenient food at competitive prices.
Franchisees contribute to the Company’s revenues by paying non-refundable upfront fees at inception of the franchise agreement and on an ongoing basis through the payment of royalties based on a percentage of sales (usually 4% - 6%).
Master franchisees generally pay upfront fees and ongoing royalties at a reduced rate to the Company.
Following is a brief description of each Concept:
| • | KFC operates in 131 countries and territories throughout the world. As of year end 2017, KFC had 21,487 units, 97 percent of which are franchised. |
| • | Pizza Hut operates in 106 countries and territories throughout the world. As of year end 2017, Pizza Hut had 16,748 units, 99 percent of which are franchised. |
| • | Pizza Hut features a variety of pizzas which are marketed under varying names. Each of these pizzas is offered with a variety of different toppings suited to local preferences and tastes. Many Pizza Huts also offer pasta and chicken wings, including approximately 5,900 stores offering wings under the WingStreet brand in the U.S. Outside the U.S., Pizza Hut casual dining restaurants offer a variety of core menu products other than pizza, which are typically suited to local preferences and tastes. Pizza Hut units feature a distinctive red roof logo on their signage. |
| • | Taco Bell operates in 27 countries and territories throughout the world. As of year end 2017, there were 6,849 Taco Bell units, primarily in the U.S., 90 percent of which are franchised. |
Research and Development (“R&D”)
The Company operates R&D facilities in Plano, Texas (KFC and Pizza Hut Divisions); Irvine, California (Taco Bell Division); Louisville, Kentucky (KFC U.S.) and several other locations outside the U.S. In addition to Company R&D, we regularly also engage independent suppliers to conduct research and development activities for the benefit of the YUM system.
The Company expensed $22 million, $24 million and $25 million in 2017, 2016 and 2015, respectively, for R&D activities.
state and federal laws that regulate the franchisor/franchisee relationship.
Financial Information about Geographic Areas
Financial information about our significant geographic areas is incorporated herein by reference from the related Consolidated Financial Statements in Part II, Item 8.
These reports may also be obtained by visiting the SEC's Public Reference Room at 100 F Street, NE, Washington, DC 20549 or by calling the SEC at 1 (800) SEC-0330.
Item 3. Legal Proceedings.
2 rewritten, 1 added, 0 removed, 7 unchanged
[removed: Finally, as a publicly-traded company, disputes arise from time-to-time with our shareholders, including] allegations that the Company breached federal securities laws or that officers and/or directors breached fiduciary duties.
Descriptions of significant current specific claims and contingencies, if any, appear in Note [removed: 20,] [added: 19,] Contingencies, to the Consolidated Financial Statements included in Part II, Item 8, which is incorporated by reference into this item.
Finally, as a publicly-traded company, disputes arise from time-to-time with our shareholders, including
Cover and table of contents
8 rewritten, 0 added, 0 removed, 67 unchanged
| | | EXCHANGE ACT OF 1934 for the fiscal year ended December 31, [removed: 2017] [added: 2018] |
Indicate by check mark whether the registrant has submitted electronically [removed: and posted on its corporate Website, if any,] every Interactive Data File required to be submitted [removed: and posted] pursuant to Rule 405 of Regulation S-T during the preceding 12 months (or for such shorter period that the registrant was required to submit [removed: and post] such files).
Indicate by check mark whether the registrant is a large accelerated filer, an accelerated filer, a non-accelerated filer, a smaller reporting [removed: company] [added: company,] or an emerging growth company.
See [added: the] definitions of “large accelerated filer”, “accelerated filer”, “smaller reporting [removed: company” and"emerging] [added: company”, and "emerging] growth company" in Rule 12b-2 of the Exchange Act (Check one): Large accelerated filer: \[ü\] Accelerated filer: \[ \] Non-accelerated filer: \[ \] Smaller reporting company: \[ \] Emerging growth company: \[ \]
The aggregate market value of the voting stock (which consists solely of shares of Common Stock) held by non-affiliates of the registrant as of June 30, [removed: 2017] [added: 2018] computed by reference to the closing price of the registrant’s Common Stock on the New York Stock Exchange Composite Tape on such date was approximately [removed: $25.4] [added: $24.7] billion.
The number of shares outstanding of the registrant’s Common Stock as of February [removed: 14, 2018] [added: 13, 2019] was [removed: 332,513,103] [added: 306,414,175] shares.
Portions of the definitive proxy statement furnished to shareholders of the registrant in connection with the annual meeting of shareholders to be held on May [removed: 17, 2018] [added: 16, 2019] are incorporated by reference into Part III.
You should not place undue reliance on forward-looking statements, which speak only as of the date [removed: hereof.][added: they are made.]
Item 1B. Unresolved Staff Comments.
1 rewritten, 0 added, 0 removed, 3 unchanged
The Company has received no written comments regarding its periodic or current reports from the staff of the Securities and Exchange Commission that were issued 180 days or more preceding the end of its [removed: 2017] [added: 2018] fiscal year and that remain unresolved.
Item 2. Properties.
5 rewritten, 0 added, 0 removed, 17 unchanged
As of year end [removed: 2017,] [added: 2018,] the Company’s Concepts owned land, building or both for [removed: 580] [added: 339] units [removed: and leased land, building or both for 901 properties] worldwide in connection with the operation of [added: our 856] Company-owned restaurants.
| • | The KFC Division owned land, building or both for [removed: 184 units and leased land, building or both for 484] [added: 72] units. |
| • | The Pizza Hut Division owned land, building or both for [removed: 9 units and leased land, building or both for 151] [added: 4] units. |
| • | The Taco Bell Division owned land, building or both for [removed: 387 units and leased land, building or both for 266] [added: 263] units. |
The Company currently owns or leases land, building or both related to approximately [removed: 900] [added: 1,000] units, not included in the property counts above, that it leases or subleases to franchisees, principally in the U.S., United Kingdom, [removed: Germany, Australia] [added: Australia, Germany] and France.
Item 4. Mine Safety Disclosures.
11 rewritten, 5 added, 5 removed, 19 unchanged
The executive officers of the Company as of February [removed: 21, 2018,] [added: 20, 2019,] and their ages and current positions as of that date are as follows:
Greg Creed, [removed: 60,] [added: 61,] is Chief Executive Officer of YUM.
[removed: Roger Eaton, 57,] [added: Tony Lowings, 60,] is Chief Executive Officer of KFC Division, a position he has held since [removed: August 2015.][added: January 2019.]
Prior to that, he served as President [removed: of KFC Division from January 2014 to August 2015] and [removed: as] Chief Operations Officer of [removed: YUM] [added: KFC Division] from [removed: November 2011 to] August [removed: 2015.][added: 2018 to December 2018.]
David Gibbs, [removed: 54,] [added: 55,] is [removed: President] [added: President, Chief Operating Officer] and Chief Financial Officer of YUM.
He has [removed: served] [added: severed] in this position since [removed: May 2016.][added: July 2018.]
Prior to [removed: this position,] [added: these positions,] he served as Chief Executive Officer of Pizza Hut Division from January 2015 to April 2016.
[removed: Marc Kesselman, 46,] [added: Scott Catlett, 42,] is General [removed: Counsel,] [added: Counsel and] Corporate Secretary [removed: and Chief Government Affairs Officer] of YUM.
David Russell, [removed: 48,] [added: 49,] is Senior Vice President, Finance and Corporate Controller of YUM.
Tracy Skeans, [removed: 45,] [added: 46,] is Chief Transformation and People Officer of YUM.
From [removed: June 2006] [added: July 2009] to September 2011, she served as Director of Human Resources for Pizza Hut [added: U.S and was on the Pizza Hut] U.S. [added: Finance team from September 2000 to June 2009.]
He has served as President and Chief Financial Officer since May 2016 and as Chief Operating Officer since January 2019.
Prior to serving as General Counsel he served as Vice President and Deputy General Counsel of YUM from November 2015 to June 2018.
From September 2007 to October 2015 Mr. Catlett held various Yum positions including Vice President & Associate General Counsel.
From November 2016 to July 2018 he served as Managing Director of Asia-Pacific and from February 2013 to October 2016 as Managing Director of KFC SOPAC (Australia and New Zealand).
Mr. Lowings served in various positions including Chief Operations Officer of YRI and Managing Director of Latin America and the Caribbean for KFC, Pizza Hut and Taco Bell and General Manager of KFC and Pizza Hut in Australia and New Zealand from January 2010 to January 2013.
Prior to these positions, Mr. Eaton served as Chief Executive Officer of KFC U.S. and YUM Operational Excellence Officer from February 2011 to November 2011.
He has served as General Counsel and Corporate Secretary of YUM since February 2016 and as Chief Government Affairs Officer since November 2016.
Mr. Kesselman joined YUM from Dean Foods where he held the position of Executive Vice President, General Counsel, Corporate Secretary & Government Affairs from January 2015 to January 2016.
Prior to this position, he worked at PepsiCo from January 2009 to January 2015, most recently serving as Senior Vice President and General Counsel of PepsiCo Americas Foods & Frito Lay North America.
From May 2006 to December 2008 he served as General Counsel of the United States Department of Agriculture.
Item 5. Market for the Registrant’s Common Stock, Related Stockholder Matters and Issuer Purchases of Equity Securities.
14 rewritten, 13 added, 24 removed, 15 unchanged
The following sets forth the [removed: high and low NYSE composite closing sale prices] [added: dividends per common share declared] by quarter for the Company’s Common [removed: Stock and dividends per common share.][added: Stock.]
| First | | $ | [removed: 68.65 | | | $ | 63.18] [added: 0.36] | | | $ | 0.30 | |
| Second | | [removed: 74.82 | | | | 63.55] [added: 0.36] | | | | 0.30 | | |
| Fourth | | [removed: 83.47 | | | | 73.75] [added: 0.36] | | | | 0.30 | | |
This included a dividend distributed February 3, 2017, that had been declared on December 21, [removed: 2016, which was the first dividend declared subsequent to the Separation of the Company's China business.][added: 2016.]
As of February [removed: 14, 2018,] [added: 13, 2019,] there were [removed: 49,843] [added: 43,458] registered holders of record of the Company’s Common Stock.
The following table provides information as of December 31, [removed: 2017,] [added: 2018,] with respect to shares of Common Stock repurchased by the Company during the quarter then ended.
On [removed: November 16, 2017,] [added: August 10, 2018,] our Board of Directors authorized share repurchases through December [removed: 2018] [added: 2019] of up to [removed: $1.5] [added: $2] billion (excluding applicable transaction fees) of our outstanding Common Stock.
As of December 31, [removed: 2017,] [added: 2018,] we have remaining capacity to repurchase up to [removed: $1.5] [added: $1.1] billion of Common Stock under this authorization.
This graph compares the cumulative total return of our Common Stock to the cumulative total return of the S&P 500 Index and the S&P 500 Consumer Discretionary Sector Index, a peer group that includes YUM, for the period from December 31, [removed: 2012] [added: 2013] to December [removed: 29, 2017, the last trading day of our 2017 fiscal year.][added: 31, 2018.]
The graph assumes that the value of the investment in our Common Stock and each index was $100 at December 31, [removed: 2012] [added: 2013] and that all cash dividends were reinvested.
[removed: 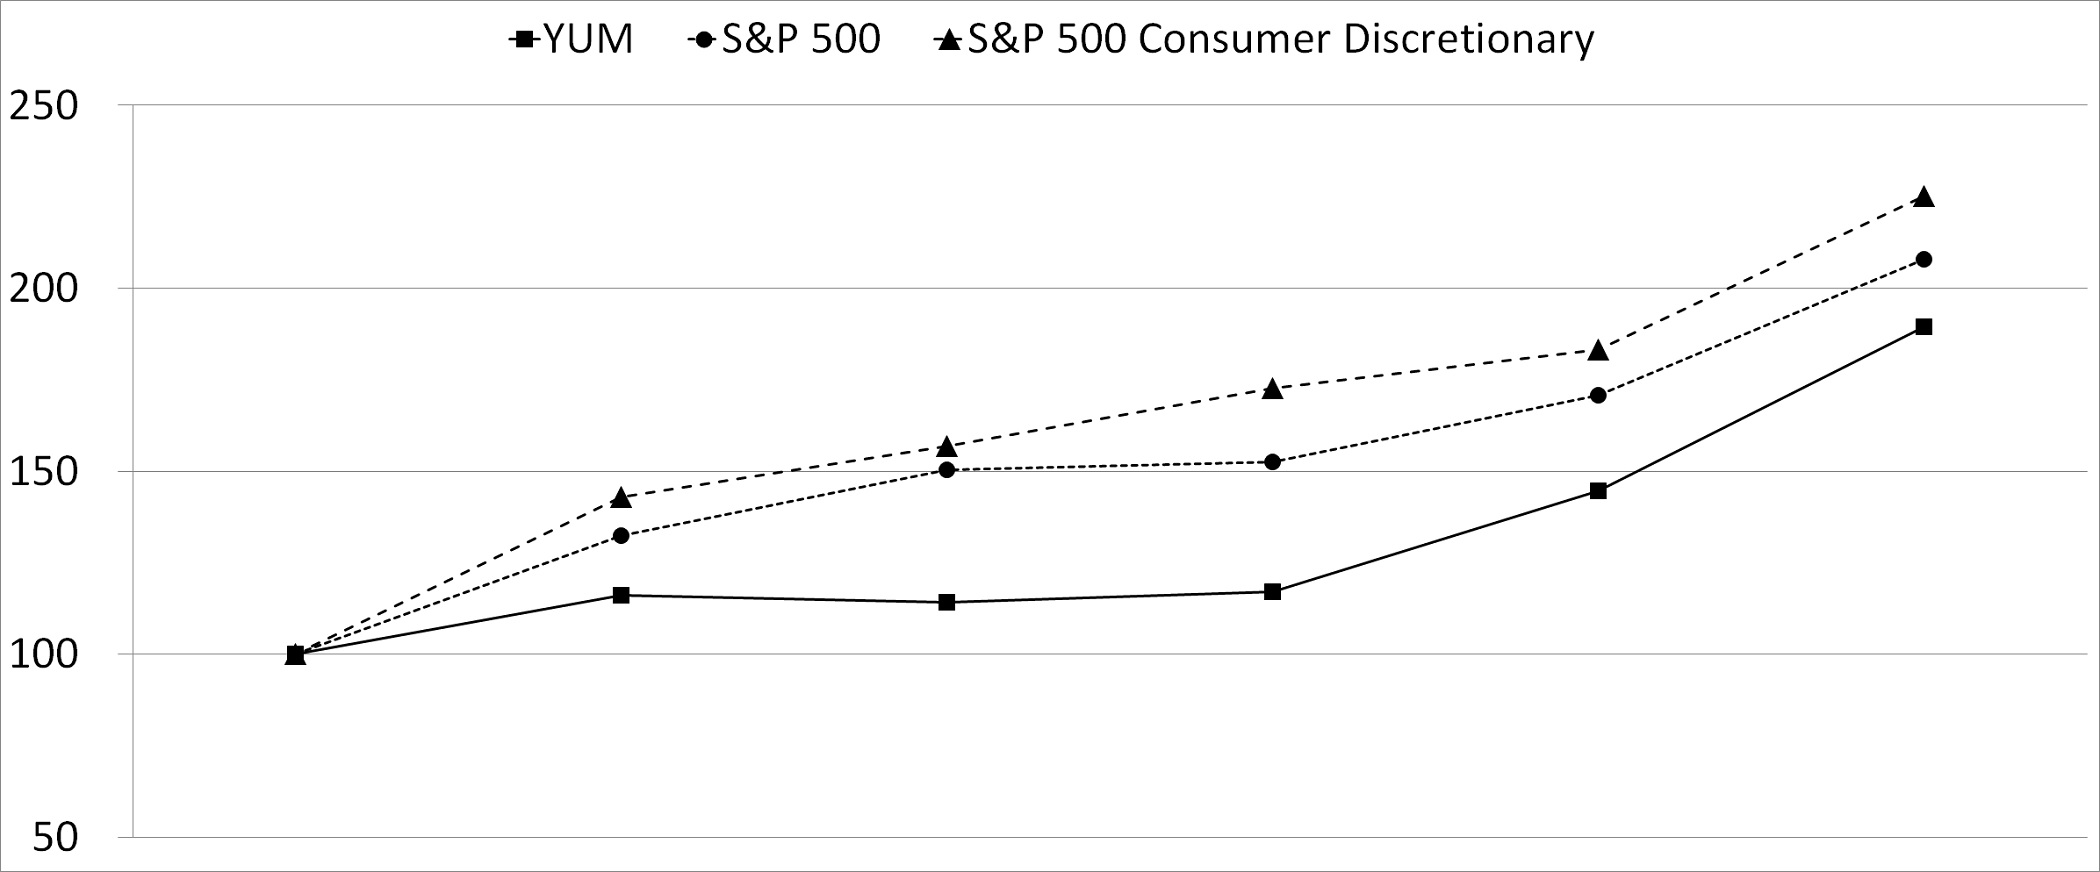][added: 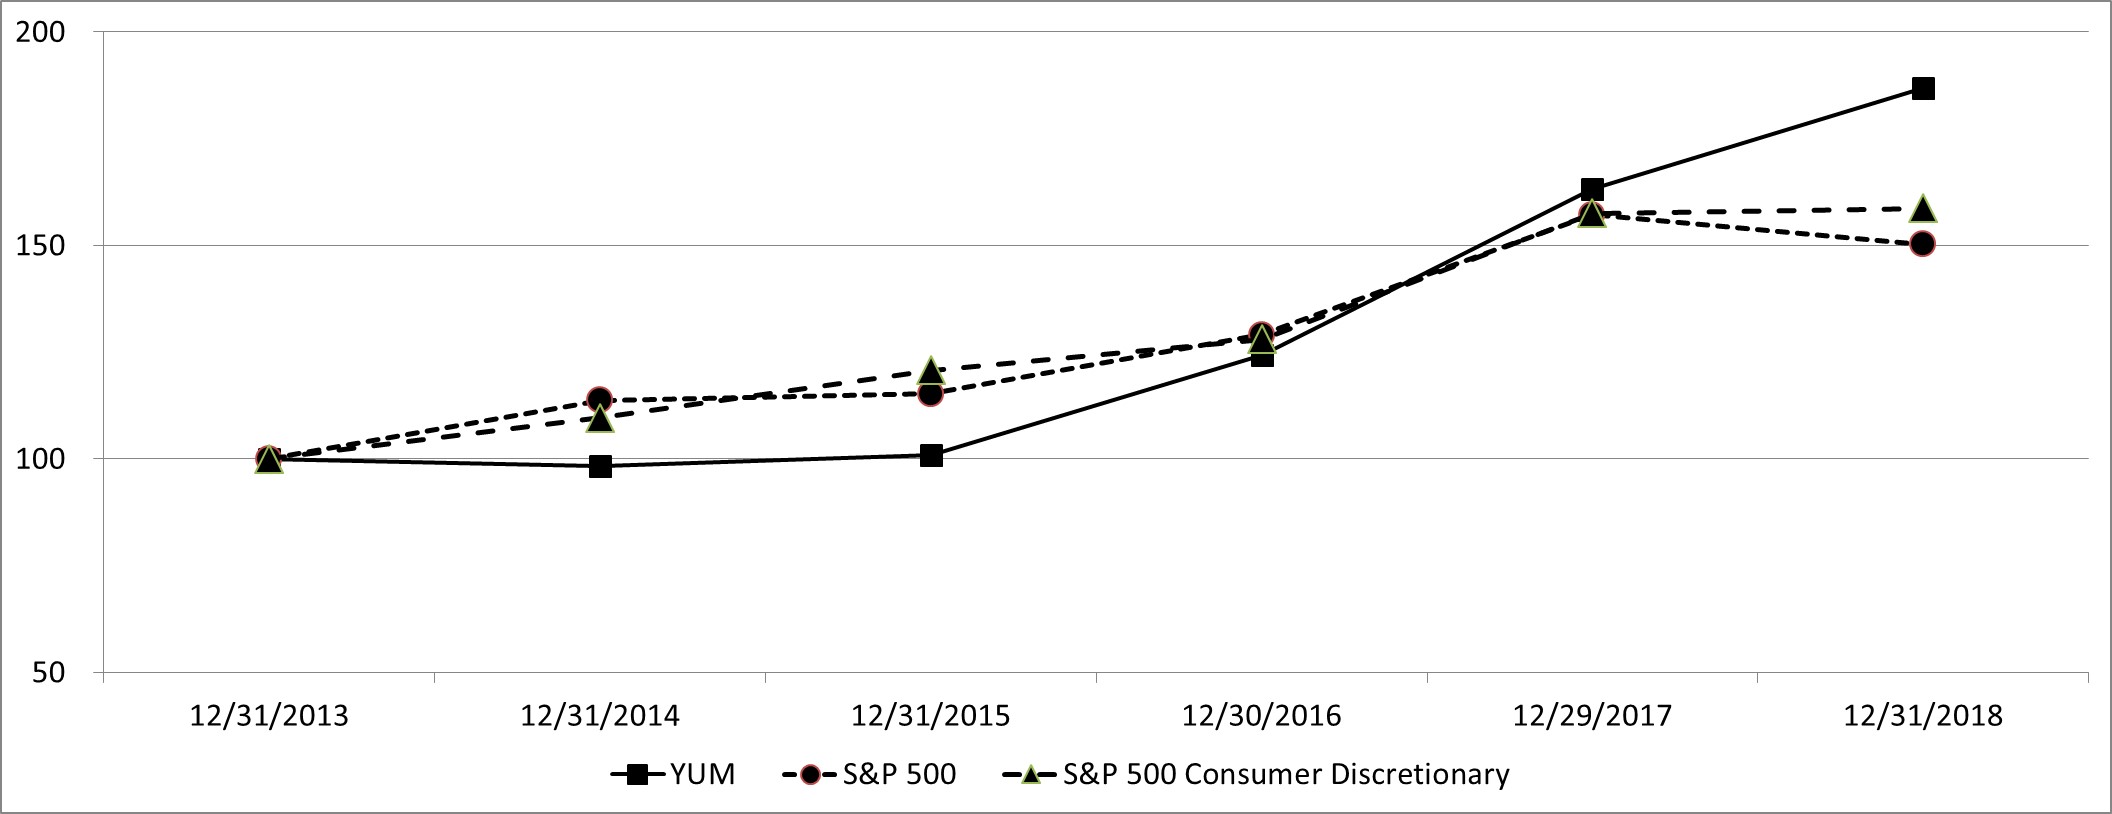]
| | | [removed: 12/31/2012 | | | |] 12/31/2013 | | | | 12/31/2014 | | | | 12/31/2015 | | | | 12/30/2016 | | | | 12/29/2017 | | | [added: | 12/31/2018 | | |]
[removed: Source:] [added: Source of total return data:] Bloomberg
| | | | | | | | | |
| --- | --- | --- | --- | --- | --- | --- | --- | --- |
| | | | | | | | | |
| Quarter | | 2018 | | | | 2017 | | |
| Third | | 0.36 | | | | — | | |
In 2018, the Company paid four cash dividends of $0.36 per share.
| 10/1/18 - 10/31/18 | | 1,249 | | $ | 89.12 | | | 1,249 | | $ | 1,691 | |
| 11/1/18- 11/30/18 | | 1,478 | | $ | 89.44 | | | 1,478 | | $ | 1,559 | |
| 12/1/18 - 12/31/18 | | 5,032 | | $ | 90.01 | | | 5,032 | | $ | 1,106 | |
| Total | | 7,759 | | | | | | 7,759 | | $ | 1,106 | |
| YUM | | $ | 100 | | | $ | 98 | | | $ | 101 | | | $ | 124 | | | $ | 163 | | | $ | 187 | |
| S&P 500 | | $ | 100 | | | $ | 114 | | | $ | 115 | | | $ | 129 | | | $ | 157 | | | $ | 150 | |
| S&P Consumer Discretionary | | $ | 100 | | | $ | 110 | | | $ | 121 | | | $ | 128 | | | $ | 157 | | | $ | 159 | |
On October 31, 2016 (the "Distribution Date"), we completed the spin-off of our China business (the "Separation") into an independent, publicly-traded company under the name Yum China Holdings, Inc. ("Yum China").
On the Distribution Date we distributed to each of our shareholders of record as of the close of business on October 19, 2016 (the "Record Date"), one share of Yum China common stock for each share of our Common Stock held as of the Record Date.
Stock prices prior to November 1, 2016, do not reflect any adjustment for the impact of the Separation.
| | | | | | | | | | | | | |
| --- | --- | --- | --- | --- | --- | --- | --- | --- | --- | --- | --- | --- |
| 2017 | | | | | | | | | | | | |
| Quarter | | High | | | | Low | | | | Dividends Declared | | |
| Third | | 77.80 | | | | 72.65 | | | | — | | |
| 2016 (As Restated)(a) | | | | | | | | | | | | |
| First | | $ | 82.25 | | | $ | 65.24 | | | $ | 0.46 | |
| Second | | 85.90 | | | | 79.33 | | | | 0.46 | | |
| Third | | 91.26 | | | | 83.04 | | | | 0.51 | | |
| Fourth (to October 31) | | 90.92 | | | | 85.36 | | | | — | | |
| Fourth (from November 1) | | 64.74 | | | | 59.70 | | | | 0.30 | | |
| | |
| --- | --- |
| (a) | Stock price information presented for 2016 is now reflective of our current reporting calendar. See Note 2 to the Consolidated Financial Statements in Item 8 of this Form 10-K for discussion of the change in our reporting calendar. |
| 10/1/17 - 10/31/17 | | 2,686 | | $ | 75.47 | | | 2,686 | | $ | 385 | |
| 11/1/17- 11/30/17 | | 3,162 | | $ | 79.68 | | | 3,162 | | $ | 1,633 | |
| 12/1/17 - 12/31/17 | | 1,603 | | $ | 82.95 | | | 1,603 | | $ | 1,500 | |
| Total | | 7,451 | | $ | 78.87 | | | 7,451 | | $ | 1,500 | |
| YUM | | $ | 100 | | | $ | 116 | | | $ | 114 | | | $ | 117 | | | $ | 145 | | | $ | 190 | |
| S&P 500 | | $ | 100 | | | $ | 132 | | | $ | 150 | | | $ | 153 | | | $ | 171 | | | $ | 208 | |
| S&P Consumer Discretionary | | $ | 100 | | | $ | 143 | | | $ | 157 | | | $ | 173 | | | $ | 183 | | | $ | 225 | |
Item 6. Selected Financial Data.
40 rewritten, 27 added, 12 removed, 16 unchanged
| | [removed: 2017] [added: 2018] | | | | [removed: 2016(a)(d)] [added: 2017] | | | | [removed: 2015(a)] [added: 2016] | | | | [removed: 2014(a)] [added: 2015] | | | | [removed: 2013(a)] [added: 2014] | | |
| Company sales | $ | [removed: 3,572] [added: 2,000] | | | $ | [removed: 4,189] [added: 3,572] | | | $ | [removed: 4,336] [added: 4,189] | | | $ | [removed: 4,503] [added: 4,336] | | | $ | [removed: 4,384] [added: 4,503] | |
| Franchise and [removed: license fees and income] [added: property revenues] | [removed: 2,306] [added: 2,482] | | | | [removed: 2,167] [added: 2,306] | | | | [removed: 2,082] [added: 2,167] | | | | [removed: 2,084] [added: 2,082] | | | | [removed: 2,033] [added: 2,084] | | |
| Total | [removed: 5,878] [added: 5,688] | | | | [removed: 6,356] [added: 5,878] | | | | [removed: 6,418] [added: 6,356] | | | | [removed: 6,587] [added: 6,418] | | | | [removed: 6,417] [added: 6,587] | | |
| Refranchising (gain) [removed: loss(b)] [added: loss] | [removed: (1,083] [added: (540] | | ) | | [removed: (163] [added: (1,083] | | ) | | [removed: 23] [added: (163] | | [added: )] | | [removed: (16] [added: 23] | | [removed: )] | | [removed: (95] [added: (16] | | ) |
| Operating [removed: Profit(b)] [added: Profit] | [removed: 2,761] [added: 2,296] | | | | [removed: 1,682] [added: 2,761] | | | | [removed: 1,434] [added: 1,682] | | | | [removed: 1,517] [added: 1,434] | | | | [removed: 1,530] [added: 1,517] | | |
| Other pension (income) [removed: expense(b)] [added: expense] | [removed: 47] [added: 14] | | | | [removed: 32] [added: 47] | | | | [removed: 40] [added: 32] | | | | [removed: N/A] [added: 40] | | | | N/A | | |
| Income from continuing operations before income [removed: taxes(b)] [added: taxes] | [removed: 2,274] [added: 1,839] | | | | [removed: 1,345] [added: 2,274] | | | | [removed: 1,253] [added: 1,345] | | | | [removed: 1,374] [added: 1,253] | | | | [removed: 1,279] [added: 1,374] | | |
| Income from continuing [removed: operations(b)] [added: operations] | [removed: 1,340] [added: 1,542] | | | | [removed: 1,018] [added: 1,340] | | | | [removed: 926] [added: 1,018] | | | | [removed: 1,006] [added: 926] | | | | [removed: 922] [added: 1,006] | | |
| Income from discontinued operations, net of tax | N/A | | | | [removed: 625] [added: N/A] | | | | [removed: 357] [added: 625] | | | | [removed: 45] [added: 357] | | | | [removed: 169] [added: 45] | | |
| Net [removed: Income(b)] [added: Income] | [removed: 1,340] [added: 1,542] | | | | [removed: 1,643] [added: 1,340] | | | | [removed: 1,283] [added: 1,643] | | | | [removed: 1,051] [added: 1,283] | | | | [removed: 1,091] [added: 1,051] | | |
| Basic earnings per [removed: common] share from continuing [removed: operations(b)] [added: operations] | [removed: 3.86] [added: 4.80] | | | | [removed: 2.58] [added: 3.86] | | | | [removed: 2.13] [added: 2.58] | | | | [removed: 2.27] [added: 2.13] | | | | [removed: 2.04] [added: 2.27] | | |
| Basic earnings per [removed: common] share from discontinued operations | N/A | | | | [removed: 1.59] [added: N/A] | | | | [removed: 0.82] [added: 1.59] | | | | [removed: 0.10] [added: 0.82] | | | | [removed: 0.37] [added: 0.10] | | |
| Basic earnings per [removed: common share(b)] [added: share] | [removed: 3.86] [added: 4.80] | | | | [removed: 4.17] [added: 3.86] | | | | [removed: 2.95] [added: 4.17] | | | | [removed: 2.37] [added: 2.95] | | | | [removed: 2.41] [added: 2.37] | | |
| Diluted earnings per [removed: common] share from continuing [removed: operations(b)] [added: operations] | [removed: 3.77] [added: 4.69] | | | | [removed: 2.54] [added: 3.77] | | | | [removed: 2.09] [added: 2.54] | | | | [removed: 2.22] [added: 2.09] | | | | [removed: 2.00] [added: 2.22] | | |
| Diluted earnings per [removed: common] share from discontinued operations | N/A | | | | [removed: 1.56] [added: N/A] | | | | [removed: 0.81] [added: 1.56] | | | | [removed: 0.10] [added: 0.81] | | | | [removed: 0.36] [added: 0.10] | | |
| Diluted earnings per [removed: common share(b)] [added: share] | [removed: 3.77] [added: 4.69] | | | | [removed: 4.10] [added: 3.77] | | | | [removed: 2.90] [added: 4.10] | | | | [removed: 2.32] [added: 2.90] | | | | [removed: 2.36] [added: 2.32] | | |
| Diluted earnings per [removed: common] share from continuing operations excluding Special [removed: Items(c)] [added: Items] | [removed: 2.96] [added: 3.17] | | | | [removed: 2.46] [added: 2.96] | | | | [removed: 2.31] [added: 2.46] | | | | [removed: 2.20] [added: 2.31] | | | | [removed: 2.04] [added: 2.20] | | |
| Provided by operating activities | $ | [removed: 1,030] [added: 1,176] | | | $ | [removed: 1,248] [added: 1,030] | | | $ | [removed: 1,260] [added: 1,248] | | | $ | [removed: 1,217] [added: 1,260] | | | $ | [removed: 1,289] [added: 1,217] | |
| Capital spending | [removed: 318] [added: 234] | | | | [removed: 427] [added: 318] | | | | [removed: 442] [added: 427] | | | | [removed: 508] [added: 442] | | | | [removed: 481] [added: 508] | | |
| Proceeds from refranchising of restaurants | [removed: 1,773] [added: 825] | | | | [removed: 370] [added: 1,773] | | | | [removed: 213] [added: 370] | | | | [removed: 83] [added: 213] | | | | [removed: 250] [added: 83] | | |
| Repurchase shares of Common Stock | [removed: 1,960] [added: 2,390] | | | | [removed: 5,403] [added: 1,960] | | | | [removed: 1,200] [added: 5,403] | | | | [removed: 820] [added: 1,200] | | | | [removed: 770] [added: 820] | | |
| Dividends paid on Common Stock | [removed: 416] [added: 462] | | | | [removed: 744] [added: 416] | | | | [removed: 730] [added: 744] | | | | [removed: 669] [added: 730] | | | | [removed: 615] [added: 669] | | |
| Total assets | $ | [removed: 5,311] [added: 4,130] | | | $ | [removed: 5,453] [added: 5,311] | | | $ | [removed: 4,939] [added: 5,453] | | | $ | [removed: 5,073] [added: 4,939] | | | $ | [removed: 4,975] [added: 5,073] | |
| Long-term debt | [removed: 9,429] [added: 9,751] | | | | [removed: 9,059] [added: 9,429] | | | | [removed: 2,988] [added: 9,059] | | | | [removed: 3,003] [added: 2,988] | | | | [removed: 2,888] [added: 3,003] | | |
| Total debt | [removed: 9,804] [added: 10,072] | | | | [removed: 9,125] [added: 9,804] | | | | [removed: 3,908] [added: 9,125] | | | | [removed: 3,268] [added: 3,908] | | | | [removed: 2,958] [added: 3,268] | | |
| Number of [removed: stores] [added: units] at year end | | | | | | | | | | | | | | | | | | | |
| Franchise | [removed: 43,603] [added: 47,268] | | | | [removed: 40,834] [added: 43,603] | | | | [removed: 39,320] [added: 40,834] | | | | [removed: 37,959] [added: 39,320] | | | | [removed: 36,746] [added: 37,959] | | |
| Company | [removed: 1,481] [added: 856] | | | | [removed: 2,841] [added: 1,481] | | | | [removed: 3,163] [added: 2,841] | | | | [removed: 3,279] [added: 3,163] | | | | [removed: 3,071] [added: 3,279] | | |
| System | [removed: 45,084] [added: 48,124] | | | | [removed: 43,675] [added: 45,084] | | | | [removed: 42,483] [added: 43,675] | | | | [removed: 41,238] [added: 42,483] | | | | [removed: 39,817] [added: 41,238] | | |
| System [removed: Sales(c)] [added: sales growth] | [added: 7] | | [added: %] | | [added: 5] | | [added: %] | | [added: 3] | | [added: %] | | [added: (3] | | [added: )%] | | [added: 1] | | [added: %] |
| [removed: KFC Division system] [added: KFC Division System] sales | [removed: 24,515] [added: $] | [added: 26,239] | | | [removed: 23,242] [added: $] | [added: 24,515] | | | [removed: 22,628] [added: $] | [added: 23,242] | | | [removed: 23,458] [added: $] | [added: 22,628] | | | [removed: 23,147] [added: $] | [added: 23,458] | |
| [removed: Pizza] [added: Pizza] Hut [removed: Division system] [added: Division System] sales | [removed: 12,034] [added: $] | [added: 12,212] | | | [removed: 12,019] [added: $] | [added: 12,034] | | | [removed: 11,999] [added: $] | [added: 12,019] | | | [removed: 12,106] [added: $] | [added: 11,999] | | | [removed: 11,948] [added: $] | [added: 12,106] | |
| [removed: Taco] [added: Taco] Bell [removed: Division system] [added: Division System] sales | [removed: 10,145] [added: $] | [added: 10,786] | | | [removed: 9,660] [added: $] | [added: 10,145] | | | [removed: 9,102] [added: $] | [added: 9,660] | | | [removed: 8,459] [added: $] | [added: 9,102] | | | [removed: 8,107] [added: $] | [added: 8,459] | |
| Shares outstanding at year end | [removed: 332] [added: 306] | | | | [removed: 355] [added: 332] | | | | [removed: 420] [added: 355] | | | | [removed: 434] [added: 420] | | | | [removed: 443] [added: 434] | | |
| Cash dividends declared per [removed: Common Share] [added: common share] | $ | [removed: 0.90] [added: 1.44] | | | $ | [removed: 1.73] [added: 0.90] | | | $ | [removed: 1.74] [added: 1.73] | | | $ | [removed: 1.56] [added: 1.74] | | | $ | [removed: 1.41] [added: 1.56] | |
| Market price per share at year [removed: end(e)] [added: end] | $ | [removed: 81.61] [added: 91.92] | | | $ | [removed: 63.33] [added: 81.61] | | | $ | [removed: 73.05] [added: 63.33] | | | $ | [removed: 73.14] [added: 73.05] | | | $ | [removed: 73.87] [added: 73.14] | |
[removed: | (a) |] Selected financial data for years 2016 and 2015 has been recast [added: from that originally presented] to present the change in our reporting calendar and retroactively adopting a new accounting standard related to the presentation of net periodic pension cost and net periodic postretirement benefit [removed: cost (collectively,"Benefit Costs"). See Notes 2 and 5 to the Consolidated Financial Statements in Item 8 of this Form 10-K for discussion related to adopting a new accounting standard on Benefit Costs and the change in our reporting calendar, respectively. 2014 reflects our Balance Sheet and store count data that were recast for purposes of presenting 2015 Consolidated Statement of Cash Flows and unit growth. No other data presented in 2014 or 2013 has been recast. |][added: cost.]
[removed: | (d) |] Fiscal years for our U.S. and certain international subsidiaries that operate on a weekly periodic calendar include 52 weeks in [added: 2018,] 2017, [removed: 2015, 2014] [added: 2015] and [removed: 2013] [added: 2014] and 53 weeks in 2016. [removed: Refer to Note 2 for additional details related to our fiscal calendar. |]
[removed: | (e) |] Historical stock prices prior to November 1, 2016, do not reflect any adjustment for the impact of the Separation. [removed: |]
| | | | | | | | | | | | | | | | | | | | |
| Franchise contributions for advertising and other services | 1,206 | | | | — | | | | — | | | | — | | | | — | | |
| Interest expense, net | 452 | | | | 445 | | | | 307 | | | | 141 | | | | 146 | | |
| System net new unit growth | 7 | | % | | 3 | | % | | 3 | | % | | 3 | | % | | 3 | | % |
| System and same-store sales | | | | | | | | | | | | | | | | | | | |
| System sales growth, ex FX | 6 | | % | | 6 | | % | | 7 | | % | | 5 | | % | | 4 | | % |
| Same-store sales growth | 2 | | % | | 3 | | % | | 2 | | % | | 1 | | % | | 1 | | % |
| System sales growth (decline) | 1 | | % | | — | | % | | — | | % | | (1 | | )% | | 1 | | % |
| System sales growth, ex FX | 1 | | % | | 1 | | % | | 2 | | % | | 3 | | % | | 2 | | % |
| Same-store sales growth (decline) | — | | % | | — | | % | | (2 | | )% | | — | | % | | (2 | | )% |
| System sales growth | 6 | | % | | 5 | | % | | 6 | | % | | 8 | | % | | 4 | | % |
| System sales growth, ex FX | 6 | | % | | 5 | | % | | 6 | | % | | 8 | | % | | 4 | | % |
| Same-store sales growth | 4 | | % | | 4 | | % | | 2 | | % | | 5 | | % | | 3 | | % |
The table above reflects the impact of the adoption of new revenue recognition accounting standards in fiscal year 2018.
Refer to Note 2 in our Consolidated Financial Statements for information regarding our adoption of the new revenue recognition standards.
System unit growth in 2018 includes addition of 1,282 Telepizza units.
See Management's Discussion and Analysis ("MD&A") Part II, Item 7 for a description of the Telepizza strategic alliance.
Refer to Note 2 in our Consolidated Financial Statements for additional details related to our fiscal calendar.
Discontinued operations in 2016, 2015 and 2014 reflects the spin-off of our China business into an independent, publicly traded company (the "Separation").
See Note 1 in our Consolidated Financial Statements.
The non-GAAP measures of System sales, System sales excluding the impacts of foreign currency translation ("FX") and Diluted earnings per share from continuing operations excluding Special Items are discussed in further detail in our MD&A within Part II, Item 7.
See discussion of our 2018, 2017 and 2016 Special Items in our MD&A.
Special Items in 2015 negatively impacted Operating Profit by $91 million and negatively impacted Net Income by $95 million, due to costs associated with the KFC Acceleration Agreement and Refranchising losses.
Special Items in 2014 positively impacted Operating Profit by $16 million and positively impacted Net Income by $12 million, primarily due to Refranchising gains.
2014 reflects our Balance Sheet and store count data that were recast for purposes of presenting 2015 Consolidated Statement of Cash Flows and unit growth.
No other data presented in 2014 has been recast.
Refer to Note 5 in our Consolidated Financial Statements for additional details related to our change in reporting calendar.
| | Fiscal Year | | | | | | | | | | | | | | | | | | |
| Interest expense, net(b) | 440 | | | | 305 | | | | 141 | | | | 143 | | | | 251 | | |
| Reported growth | 5 | | % | | 3 | | % | | (3 | | )% | | 1 | | % | | (2 | | )% |
| Growth in local currency | 6 | | % | | 7 | | % | | 5 | | % | | 4 | | % | | — | | % |
| Reported growth | — | | % | | — | | % | | (1 | | )% | | 1 | | % | | 3 | | % |
| Growth in local currency | 1 | | % | | 2 | | % | | 3 | | % | | 2 | | % | | 4 | | % |
| Reported growth | 5 | | % | | 6 | | % | | 8 | | % | | 4 | | % | | 4 | | % |
| Growth in local currency | 5 | | % | | 6 | | % | | 8 | | % | | 4 | | % | | 4 | | % |
| | |
| --- | --- |
| (b) | Includes amounts deemed as Special Items for some or all years presented. See discussion of our 2017, 2016 and 2015 Special Items in our Management's Discussion and Analysis ("MD&A"). Special Items in 2014 positively impacted Operating Profit by $16 million, primarily due to Refranchising gains. Special Items in 2013 positively impacted Operating Profit by $73 million, primarily due to Refranchising gains, partially offset by $10 million in pension settlement charges and $5 million of expense related to U.S. productivity initiatives and realignment of resources. Additionally, in 2013, we incurred $118 million of premiums paid and other costs related to the extinguishment of debt that were considered Special Items and were recorded in Interest expense, net. Special Items resulted in cumulative net tax benefits of $23 million 2013. |
| (c) | These non-GAAP measures are discussed in further detail in our MD&A. |
Item 8. Financial Statements and Supplementary Data.
674 rewritten, 474 added, 247 removed, 921 unchanged
[removed: |] Report of Independent Registered Public Accounting Firm [removed: | [50](#s6CBB2E37C5A65BE6AC09D60E13B4A4C7) | |]
| Consolidated Statements of Income | [removed: [52](#s5FFDEA8736BA56AC9A983D7EA16964CB)] [added: [54](#s0FD6016A5F4853B7AF30970A9DE8C040)] | |
| Consolidated Statements of Comprehensive Income | [removed: [53](#sCF7BC8F020AC566D9C1D5683C3F8E3E5)] [added: [55](#s83B9288F89855E4AA251FD351E343F76)] | |
| Consolidated Statements of Cash Flows | [removed: [54](#s3DB9DC4F55405D9FA76AEC713DC867A0)] [added: [56](#s7D4E730FD5135FFEAB70B85EF658E449)] | |
| Consolidated Balance Sheets | [removed: [55](#s81FE1FCEE6655B1DA41801FF6BBEA517)] [added: [57](#sBA6FF5E8DB2954EABD15795FD176D817)] | |
| Consolidated Statements of Shareholders’ Equity (Deficit) | [removed: [56](#s04CF22D571BF5678B16BEBCE76039694)] [added: [58](#s80425F4096F95E0AAA2BF2634DBEA65F)] | |
| Notes to Consolidated Financial Statements | [removed: [57](#s691B50BD986151919769D61DA764CDAE)] [added: [59](#s192A3F355E2B5E65A92B8525720BBD2C)] | |
[removed: Report] [added: | Report] of Independent Registered Public Accounting [removed: Firm][added: Firm | [52](#sBC367AA13BEE53D785B11F29CE4B044A) | |]
[removed: The] [added: To the Shareholders and] Board of Directors [removed: and Shareholders]
Brands, Inc. and Subsidiaries [removed: (YUM)] [added: (the Company)] as of December 31, [removed: 2017] [added: 2018] and [removed: 2016,] [added: 2017,] the related consolidated statements of income, comprehensive income, cash [removed: flows] [added: flows,] and shareholders’ equity (deficit) for each of the fiscal years in the [removed: three‑year] [added: three-year] period ended December 31, [removed: 2017,] [added: 2018,] and the related notes [removed: collectively,] [added: (collectively,] the “consolidated financial [removed: statements.” We also have audited YUM’s internal control over financial reporting as of December 31, 2017, based on criteria established in *Internal Control - Integrated Framework (2013)* issued by the Committee of Sponsoring Organizations of the Treadway Commission.][added: statements”).]
In our opinion, the consolidated financial statements referred to above present fairly, in all material respects, the financial position of [removed: YUM] [added: the Company] as of December 31, [removed: 2017] [added: 2018] and [removed: 2016,] [added: 2017,] and the results of its operations and its cash flows for each of the years in the three-year period ended December 31, [removed: 2017,] [added: 2018,] in conformity with U.S. generally accepted accounting principles.
Also in our opinion, [removed: YUM] [added: the Company] maintained, in all material respects, effective internal control over financial reporting as of December 31, [removed: 2017,] [added: 2018] based on criteria established in *Internal Control - Integrated Framework (2013)* issued by the Committee of Sponsoring Organizations of the Treadway Commission.
[removed: YUM’s] [added: The Company’s] management is responsible for these consolidated financial statements, for maintaining effective internal control over financial reporting, and for its assessment of the effectiveness of internal control over financial reporting, included in [removed: the accompanying Item 9A, “Management’s] [added: Management’s] Report on Internal Control [removed: over] [added: Over] Financial [removed: Reporting.” Our responsibility is to express an opinion on YUM’s consolidated financial statements and an opinion on YUM’s internal control over financial reporting based on our audits.][added: Reporting in the accompanying Item 9A.]
We are a public accounting firm registered with the Public Company Accounting Oversight Board (United States) [removed: (“PCAOB”)] [added: (PCAOB)] and are required to be independent with respect to [removed: YUM] [added: the Company] in accordance with the U.S. federal securities laws and the applicable rules and regulations of the Securities and Exchange Commission and the PCAOB.
A company’s internal control over financial reporting includes those policies and procedures that (1) pertain to the maintenance of records that, in reasonable detail, accurately and fairly reflect the transactions and dispositions of the assets [removed: of the company; (2) provide reasonable assurance that transactions are recorded as necessary to permit preparation of financial]
[added: of the company; (2) provide reasonable assurance that transactions are recorded as necessary to permit preparation of financial] statements in accordance with generally accepted accounting principles, and that receipts and expenditures of the company are being made only in accordance with authorizations of management and directors of the company; and (3) provide reasonable assurance regarding prevention or timely detection of unauthorized acquisition, use, or disposition of the company’s assets that could have a material effect on the financial statements.
We have served as [removed: YUM’s] [added: the Company’s] auditor since 1997.
[removed: February 21,] [added: | |] 2018 [added: | | | | | | | | | | | | | | | |]
| Fiscal years ended December 31, [removed: 2017, 2016] [added: 2018, 2017] and [removed: 2015] [added: 2016] | | | | | | | | | | | | |
| | | [removed: 2017] [added: 2018] | | | | [removed: 2016 (As Restated)] [added: 2017] | | | | [removed: 2015] [added: 2016] (As Restated) | | |
| Company sales | | $ | [removed: 3,572] [added: 2,000] | | | $ | [removed: 4,189] [added: 3,572] | | | $ | [removed: 4,336] [added: 4,189] | |
| Total revenues | | [removed: 5,878] [added: 5,688] | | | | [removed: 6,356] [added: 5,878] | | | | [removed: 6,418] [added: 6,356] | | |
| Company restaurant expenses | | [removed: 2,954] [added: 1,634] | | | | [removed: 3,489] [added: 2,954] | | | | [removed: 3,627] [added: 3,489] | | |
| General and administrative expenses | | [removed: 999] [added: 895] | | | | [removed: 1,129] [added: 999] | | | | [removed: 1,058] [added: 1,129] | | |
| Franchise and [removed: license] [added: property] expenses | | [removed: 237] [added: 188] | | | | [removed: 201] [added: 237] | | | | [removed: 240] [added: 201] | | |
| Refranchising (gain) loss | | [removed: (1,083] [added: (540] | | ) | | [removed: (163] [added: (1,083] | | ) | | [removed: 23] [added: (163] | | [added: )] |
| Other (income) expense | | 7 | | | | [removed: 3] [added: 10] | | | | [removed: 20] [added: 18] | | |
| Total costs and expenses, net | | [removed: 3,117] [added: 3,392] | | | | [removed: 4,674] [added: 3,117] | | | | [removed: 4,984] [added: 4,674] | | |
| Operating Profit | | [removed: 2,761] [added: 2,296] | | | | [removed: 1,682] [added: 2,761] | | | | [removed: 1,434] [added: 1,682] | | |
| Other pension (income) expense | | [removed: 47] [added: 14] | | | | [removed: 32] [added: 47] | | | | [removed: 40] [added: 32] | | |
| Interest expense, net | [added: 452] | [removed: 440] | | | [added: —] | [removed: 305] | | | | [removed: 141] [added: 452] | | |
| Income from continuing operations before income taxes | | [removed: 2,274] [added: 1,839] | | | | [removed: 1,345] [added: 2,274] | | | | [removed: 1,253] [added: 1,345] | | |
| Income tax provision | | [removed: 934] [added: 297] | | | | [removed: 327] [added: 934] | | | | 327 | | |
| Income from continuing operations | | [removed: 1,340] [added: 1,542] | | | | [removed: 1,018] [added: 1,340] | | | | [removed: 926] [added: 1,018] | | |
| Income from discontinued operations, net of tax | | N/A | | | | [removed: 625] [added: N/A] | | | | [removed: 357] [added: 625] | | |
| Net Income | | $ | [removed: 1,340] [added: 1,542] | | | $ | [removed: 1,643] [added: 1,340] | | | $ | [removed: 1,283] [added: 1,643] | |
| Basic Earnings per Common Share from continuing operations | | $ | [removed: 3.86] [added: 4.80] | | | $ | [removed: 2.58] [added: 3.86] | | | $ | [removed: 2.13] [added: 2.58] | |
| Basic Earnings per Common Share from discontinued operations | | N/A | | | | [removed: $] [added: N/A] | [removed: 1.59] | | | $ | [removed: 0.82] [added: 1.59] | |
| Basic Earnings Per Common Share | | $ | [removed: 3.86] [added: 4.80] | | | $ | [removed: 4.17] [added: 3.86] | | | $ | [removed: 2.95] [added: 4.17] | |
| Diluted Earnings per Common Share from continuing operations | | $ | [removed: 3.77] [added: 4.69] | | | $ | [removed: 2.54] [added: 3.77] | | | $ | [removed: 2.09] [added: 2.54] | |
We also have audited the Company’s internal control over financial reporting as of December 31, 2018, based on criteria established in *Internal Control - Integrated Framework* *(2013)* issued by the Committee of Sponsoring Organizations of the Treadway Commission.
As discussed in Notes 2 and 5 to the consolidated financial statements, the Company has changed its method of accounting for revenue from contracts with customers in fiscal year 2018 due to the adoption of Topic 606: *Revenue from Contracts with Customers*.
Our responsibility is to express an opinion on the Company’s consolidated financial statements and an opinion on the Company’s internal control over financial reporting based on our audits.
| Franchise and property revenues | | 2,482 | | | | 2,306 | | | | 2,167 | | |
| Franchise contributions for advertising and other services | | 1,206 | | | | — | | | | — | | |
| Franchise advertising and other services expense | | 1,208 | | | | — | | | | — | | |
| Investment (income) expense, net | | (9 | | ) | | (5 | | ) | | (2 | | ) |
| Interest expense, net | | 452 | | | | 445 | | | | 307 | | |
| | | 54 | | | | 35 | | | | (18 | | ) |
| | | 41 | | | | 21 | | | | (14 | | ) |
| | | (20 | | ) | | 6 | | | | 35 | | |
| | | (14 | | ) | | 4 | | | | 19 | | |
| Fiscal years ended December 31, 2018, 2017 and 2016 | | | | | | | | | | | | |
| Net Income | | $ | 1,542 | | | $ | 1,340 | | | $ | 1,643 | |
| Refranchising (gain) loss | | (540 | | ) | | (1,083 | | ) | | (163 | | ) |
| Investment (income) expense, net | | (9 | | ) | | (5 | | ) | | (2 | | ) |
| QuikOrder acquisition, net of cash acquired | | (66 | | ) | | — | | | | — | | |
| Investment in Grubhub Inc. common stock | | (200 | | ) | | — | | | | — | | |
| Total Current Assets | | 1,207 | | | | 2,507 | | |
| Goodwill | | 525 | | | | 512 | | |
| Other assets | | 724 | | | | 345 | | |
| Fiscal years ended December 31, 2018, 2017 and 2016 | | | | | | | | | | | | | | | | | | | | | | | | | | | |
| Adoption of accounting standards | | | | | | | | | (251 | | ) | | 2 | | | | | | | | (249 | | ) | | | | |
| Balance at December 31, 2018 | | 306 | | | $ | — | | | $ | (7,592 | ) | | $ | (334 | ) | | $ | — | | | $ | (7,926 | ) | | $ | — | |
Brands, Inc. and its Subsidiaries (collectively referred to herein as the “Company,” “YUM,” “we,” “us” or “our”) franchises or operates a system of over 48,000 quick service restaurants in more than 140 countries and territories.
At December 31, 2018, 98% of these restaurants were owned and operated by franchisees.
The company’s KFC, Pizza Hut and Taco Bell brands (collectively the “Concepts”) are global leaders of the chicken, pizza and Mexican-style food categories.
At the end of 2018, YUM has future lease payments
Our next fiscal year scheduled to include a 53rd week is 2019.
We adopted Topic 606 at the beginning of the year ended December 31, 2018.
Below is a discussion of how our revenues are earned, our accounting policies pertaining to revenue recognition prior to the adoption of Topic 606 ("Legacy GAAP"), our accounting policies pertaining to revenue recognition subsequent to the adoption of Topic 606 and other required disclosures.
Refer to Note 5 for information regarding the cumulative effect adjustment recorded to Accumulated deficit as of the beginning of the year ended December 31, 2018 to reflect the adoption of Topic 606.
Also included in Note 5 is disclosure of the amount by which each balance sheet and income statement line item was impacted in the current reporting period as compared to Legacy GAAP.
Company Sales
Revenues from the sale of food items by Company-owned restaurants are recognized as Company sales when a customer purchases the food, which is when our obligation to perform is satisfied.
The timing and amount of revenue recognized related to Company sales was not impacted by the adoption of Topic 606.
Franchise and Property Revenues
*Franchise Revenues*
Our most significant source of revenues arises from the operation of our Concepts' stores by our franchisees.
Our franchise agreements require that the franchisee remit continuing fees to us as a percentage of the applicable restaurant’s sales in exchange for the license of the intellectual property associated with our Concepts' brands (the “franchise right”).
As discussed in notes 2 and 5 to the consolidated financial statements, the comparative consolidated balance sheet as of December 31, 2016, and the comparative consolidated statements of income, comprehensive income, cash flows and shareholders’ equity (deficit) for the fiscal years ended December 31, 2016 and 2015 have been restated for the effects of the change in accounting principle whereby YUM changed its fiscal year from a 52-53 week fiscal year to a fiscal year ending on December 31 of each year and eliminated any of the one-month or one-period reporting lags of its international subsidiaries.
| --- | --- | --- | --- | --- | --- | --- | --- | --- | --- | --- | --- | --- |
| Franchise and license fees and income | | 2,306 | | | | 2,167 | | | | 2,082 | | |
| Company restaurants | | | | | | | | | | | | |
| Food and paper | | 1,103 | | | | 1,267 | | | | 1,340 | | |
| Payroll and employee benefits | | 939 | | | | 1,106 | | | | 1,125 | | |
| Occupancy and other operating expenses | | 912 | | | | 1,116 | | | | 1,162 | | |
| Closures and impairment (income) expenses | | 3 | | | | 15 | | | | 16 | | |
| | | 35 | | | | (18 | | ) | | 154 | | |
| | | 21 | | | | (14 | | ) | | 97 | | |
| | | 6 | | | | 35 | | | | (5 | | ) |
| | | 4 | | | | 19 | | | | (5 | | ) |
| Changes in inventories | | 3 | | | | 1 | | | | (4 | | ) |
| Inventories | | 13 | | | | 37 | | |
| Other assets | | 346 | | | | 376 | | |
| Balance at December 31, 2014 (As Restated) | | 434 | | | $ | — | | | $ | 1,784 | | | $ | (228 | ) | | $ | 57 | | | $ | 1,613 | | | $ | 9 | |
| Net Income (loss) | | | | | | | | | 1,283 | | | | | | | | 6 | | | | 1,289 | | | | (1 | | ) |
| Acquisition of Little Sheep store-level noncontrolling interests | | | | | 1 | | | | | | | | | | | | (1 | | ) | | — | | | | | | |
Brands, Inc. and its Subsidiaries (collectively referred to herein as “YUM” or the “Company”) comprise the worldwide operations of KFC, Pizza Hut and Taco Bell (collectively the “Concepts”).
YUM has over 45,000 units of which 60% are located outside the U.S. in more than 135 countries and territories.
YUM was created as an independent, publicly-owned company on October 6, 1997 via a tax-free distribution by our former parent, PepsiCo, Inc., of our Common Stock to its shareholders.
References to YUM throughout these Consolidated Financial Statements are made using the first person notations of “we,” “us” or “our.”
Each Concept has proprietary menu items and emphasizes the preparation of food with high quality ingredients as well as unique recipes and special seasonings to provide appealing, convenient, tasty and attractive food at competitive prices.
Advertising cooperative assets, consisting primarily of cash received from the Company and franchisees and accounts receivable from franchisees, can only be used to settle obligations of the respective cooperative.
Advertising cooperative liabilities represent the corresponding obligation arising from the receipt of the contributions to purchase advertising and promotional programs for which creditors do not have recourse to the general credit of the Company as the primary beneficiary.
As the contributions to these cooperatives are designated and segregated for advertising, we act as an agent for the franchisees with regard to these contributions.
Thus, we do not reflect franchisee contributions to these cooperatives in our Consolidated Statements of Income or Consolidated Statements of Cash Flows.
Our franchise agreements typically require the franchisee to pay an initial, non-refundable fee upon an individual store opening and continuing fees based upon a percentage of sales.
Subject to our approval and their payment of a renewal fee, a franchisee may generally renew the franchise agreement upon its expiration.
Additionally, we execute master franchise agreements in certain regions that transfer administrative and development obligations and sub-franchising rights to a franchisee in exchange for reduced franchise fees.
Revenue Recognition. Revenues from Company-owned restaurants are recognized when payment is tendered at the time of sale.
The Company presents sales net of sales-related taxes.
Income from our franchisees includes initial fees, continuing fees, renewal fees and rental income from restaurants we lease or sublease to them.
We recognize initial fees received from a franchisee as revenue when we have performed substantially all initial services required by the franchise agreement, which is generally upon the opening of a store.
We recognize continuing fees, which are based upon a percentage of franchisee sales as those sales occur and rental income is recognized as it is earned.
We recognize renewal fees when a renewal agreement with a franchisee becomes effective.
While the majority of our franchise agreements are entered into with terms and conditions consistent with those at a prevailing market rate, there are instances when we enter into franchise agreements with terms that are not at market rates (for example, below-market continuing fees) for a specified period of time.
We recognize the estimated value of terms in franchise agreements entered into concurrently with a refranchising transaction that are not consistent with market terms as part of the upfront Refranchising (gain) loss and amortize that amount into Franchise and license fees and income over the period such terms are in effect.
The value of terms that are not considered to be at market within franchise agreements is estimated based upon the difference between the present value of the cash expected to be received under the franchise agreement and the present value of the cash that would have been expected to be received under a franchise agreement with terms substantially consistent with market.
shown.
An excerpt. Shown here: 40 of 674 rewritten, 40 of 474 added and 40 of 247 removed. The counts are complete. For every sentence, read Item 8. Financial Statements and Supplementary Data. in the FY2018 filing and the FY2017 filing.
Item 9A. Controls and Procedures.
2 rewritten, 0 added, 0 removed, 11 unchanged
Based on our evaluation under the framework in *Internal Control – Integrated Framework (2013)*, our management concluded that our internal control over financial reporting was effective as of December 31, [removed: 2017.][added: 2018.]
There were no changes with respect to the Company’s internal control over financial reporting or in other factors that materially affected, or are reasonably likely to materially affect, internal control over financial reporting during the quarter ended December 31, [removed: 2017.][added: 2018.]
Item 10. Directors, Executive Officers and Corporate Governance.
1 rewritten, 0 added, 0 removed, 4 unchanged
Information regarding Section 16(a) compliance, the Audit Committee and the Audit Committee financial expert, the Company’s code of ethics and background of the directors appearing under the captions “Stock Ownership Information,” “Governance of the Company,” “Executive Compensation” and “Item 1: Election of Directors and Director biographies” is incorporated by reference from the Company’s definitive proxy statement which will be filed with the Securities and Exchange Commission no later than 120 days after December 31, [removed: 2017.][added: 2018.]
Item 11. Executive Compensation.
1 rewritten, 0 added, 0 removed, 3 unchanged
Information regarding executive and director compensation and the Compensation Committee appearing under the captions “Governance of the Company” and “Executive Compensation” is incorporated by reference from the Company’s definitive proxy statement which will be filed with the Securities and Exchange Commission no later than 120 days after December 31, [removed: 2017.][added: 2018.]
Item 12. Security Ownership of Certain Beneficial Owners and Management and Related Stockholder Matters.
1 rewritten, 0 added, 0 removed, 3 unchanged
Information regarding equity compensation plans and security ownership of certain beneficial owners and management appearing under the captions “Executive Compensation” and “Stock Ownership Information” is incorporated by reference from the Company’s definitive proxy statement which will be filed with the Securities and Exchange Commission no later than 120 days after December 31, [removed: 2017.][added: 2018.]
Item 13. Certain Relationships and Related Transactions, and Director Independence.
1 rewritten, 0 added, 0 removed, 3 unchanged
Information regarding certain relationships and related transactions and information regarding director independence appearing under the caption “Governance of the Company” is incorporated by reference from the Company’s definitive proxy statement which will be filed with the Securities and Exchange Commission no later than 120 days after December 31, [removed: 2017.][added: 2018.]
Item 14. Principal Accountant Fees and Services.
1 rewritten, 0 added, 0 removed, 4 unchanged
Information regarding principal accountant fees and services and audit committee pre-approval policies and procedures appearing under the caption “Item 2: Ratification of Independent Auditors” is incorporated by reference from the Company’s definitive proxy statement which will be filed with the Securities and Exchange Commission no later than 120 days after December 31, [removed: 2017.][added: 2018.]
Item 15. Exhibits and Financial Statement Schedules.
34 rewritten, 22 added, 4 removed, 172 unchanged
| Date: | February [removed: 21, 2018] [added: 20, 2019] |
| /s/ Greg Creed | | Chief Executive Officer | | February [removed: 21, 2018] [added: 20, 2019] |
| /s/ David W. Gibbs | | [removed: President] [added: President, Chief Operating Officer] and Chief Financial Officer | | February [removed: 21, 2018] [added: 20, 2019] |
| /s/ David E. Russell | | Senior Vice President, Finance and Corporate Controller | | February [removed: 21, 2018] [added: 20, 2019] |
| /s/ Paget L. Alves | | Director | | February [removed: 21, 2018] [added: 20, 2019] |
| /s/ Michael J. Cavanagh | | Director | | February [removed: 21, 2018] [added: 20, 2019] |
| /s/ Christopher M. Connor | | Director | | February [removed: 21, 2018] [added: 20, 2019] |
| /s/ Brian C. Cornell | | Director | | February [removed: 21, 2018] [added: 20, 2019] |
| /s/ Tanya L. Domier | | Director | | February [removed: 21, 2018] [added: 20, 2019] |
| /s/ Mirian M. Graddick-Weir | | Director | | February [removed: 21, 2018] [added: 20, 2019] |
| /s/ Thomas C. Nelson | | Director | | February [removed: 21, 2018] [added: 20, 2019] |
| /s/ P. Justin Skala | | Director | | February [removed: 21, 2018] [added: 20, 2019] |
| /s/ Elane B. Stock | | Director | | February [removed: 21, 2018] [added: 20, 2019] |
| /s/ Robert D. Walter | | Director | | February [removed: 21, 2018] [added: 20, 2019] |
| Exhibit Number | | | [added: |] Description of Exhibits | |
| 2.1 | | | [added: |] [Separation and Distribution Agreement, dated as of October 31, 2016, by and among YUM, Yum Restaurants Consulting (Shanghai) Company Limited and Yum China Holdings, Inc., which is incorporated herein by reference from Exhibit 2.1 to YUM's Report on Form 8-K filed on November 3, 2016.](http://www.sec.gov/Archives/edgar/data/1041061/000104106116000097/a16-20742_3ex2d1.htm) | |
| 3.1 | | | [added: |] [Restated Articles of Incorporation of YUM, effective May 26, 2011, which is incorporated herein by reference from Exhibit 3.1 to YUM's Report on Form 8-K filed on May 31, 2011.](http://www.sec.gov/Archives/edgar/data/1041061/000104106111000025/exhib3_1.htm) | |
| 3.2 | | | [added: |] [Amended and restated Bylaws of YUM, effective July 15, 2016, which are incorporated herein by reference from Exhibit 3.1 to YUM's Report on Form 8-K filed on July 19, 2016.](http://www.sec.gov/Archives/edgar/data/1041061/000104106116000086/ex31.htm) | |
| 4.1 | | | [added: |] [Indenture, dated as of May 1, 1998, between YUM and The Bank of New York Mellon Trust Company, N.A., successor in interest to The First National Bank of Chicago, which is incorporated herein by reference from Exhibit 4.1 to YUM's Report on Form 8-K filed on May 13, 1998.](http://www.sec.gov/Archives/edgar/data/1041061/0001047469-98-019880.txt) | |
| | | | [added: |] (i) | [removed: [6.25%] [added: [6.875%] Senior Notes due [removed: March] [added: November] 15, [removed: 2018] [added: 2037] issued under the foregoing May 1, 1998 indenture, which notes are incorporated by reference from Exhibit [removed: 4.2] [added: 4.3] (included in Exhibit 4.1) to YUM's Report on Form 8-K filed on October 22, 2007.](http://www.sec.gov/Archives/edgar/data/1041061/000110465907075918/a07-25341_4ex4d1.htm) |
| | | | [removed: (ii)] | [removed: [6.875%] [added: (vi) | [5.350%] Senior Notes due November [removed: 15, 2037] [added: 1, 2043] issued under the foregoing May 1, 1998 indenture, which notes are incorporated by reference from Exhibit 4.3 (included in Exhibit 4.1) to YUM's Report on Form 8-K filed [removed: on] October [removed: 22, 2007.](http://www.sec.gov/Archives/edgar/data/1041061/000110465907075918/a07-25341_4ex4d1.htm)] [added: 31, 2013.](http://www.sec.gov/Archives/edgar/data/1041061/000110465913079610/a13-23145_1ex4d1.htm)] |
| | | | [removed: (iii)] | [added: (ii) |] [5.30% Senior Notes due September 15, 2019 issued under the foregoing May 1, 1998 indenture, which notes are incorporated by reference from Exhibit 4.3 (included in Exhibit 4.1) to YUM's Report on Form 8-K filed on August 25, 2009.](http://www.sec.gov/Archives/edgar/data/1041061/000110465909051498/a09-23947_1ex4d1.htm) |
| | | | [removed: (iv)] | [added: (iii) |] [3.875% Senior Notes due November 1, 2020 issued under the foregoing May 1, 1998 indenture, which notes are incorporated by reference from Exhibit 4.2 (included in Exhibit 4.1) to YUM's Report on Form 8-K filed on August 31, 2010.](http://www.sec.gov/Archives/edgar/data/1041061/000110465910046672/a10-16558_1ex4d1.htm) |
| | | | [removed: (v)] | [added: (iv) |] [3.750% Senior Notes due November 1, 2021 issued under the foregoing May 1, 1998 indenture, which notes are incorporated by reference from Exhibit 4.2 (included in Exhibit 4.1) to YUM's Report on Form 8-K filed August 29, 2011.](http://www.sec.gov/Archives/edgar/data/1041061/000110465911049192/a11-24230_4ex4d1.htm) |
| | | | [removed: (vi)] | [added: (v) |] [3.875% Senior Notes due November 1, 2023 issued under the foregoing May 1, 1998 indenture, which notes are incorporated by reference from Exhibit 4.2 (included in Exhibit 4.1) to YUM's Report on Form 8-K filed October 31, 2013.](http://www.sec.gov/Archives/edgar/data/1041061/000110465913079610/a13-23145_1ex4d1.htm) |
| 10.1 | | | [added: |] [Credit Agreement, dated as of June 16, 2016, by and among Pizza Hut Holdings, LLC, KFC Holding Co., and Taco Bell of America, LLC, as the borrowers, the lenders party thereto, JPMorgan Chase Bank, N.A., as Administrative Agent and Collateral Agent, JPMorgan Chase Bank, N.A., Goldman Sachs Bank USA, Wells Fargo Securities, LLC, Citigroup Global Markets Inc., Merrill Lynch, Pierce, Fenner & Smith Incorporated, Morgan Stanley Senior Funding, Inc., Fifth Third Bank and The Bank of Tokyo-Mitsubishi UFJ, Ltd., as Joint Lead Arrangers and Joint Bookrunners, Barclays Bank PLC, The Bank of Nova Scotia, Cooperatieve Rabobank U.A., New York Branch, and Industrial and Commercial Bank of China Limited, New York Branch, as Co-Documentation Agents and Co-Managers, which is incorporated herein by reference from Exhibit 4.1 to YUM's Quarterly Report on Form 10-Q for the quarter ended June 11, 2016.](http://www.sec.gov/Archives/edgar/data/1041061/000104106116000084/yum-6112016xexx41.htm) | |
| 10.5.1† | | | [The Yum! Brands, Inc. Pension Equalization Plan, Restated Plan Document for the 409A Program effective January 1, 2005, as amended through January 1, 2017 as filed [removed: herewith.](https://www.sec.gov/Archives/edgar/data/1041061/000104106118000013/yum-12312017xex1051.htm)] [added: herewith.](http://www.sec.gov/Archives/edgar/data/1041061/000104106118000013/yum-12312017xex1051.htm)] | |
| [removed: 10.23] [added: 10.22.1] | | | [Series 2016-1 Supplement to Base Indenture dated as of May 11, 2016, by and between Taco Bell Funding, LLC, as issuer and Citibank, N.A. as [removed: trustee] [added: Trustee] and Series 2016-1 securities intermediary, which is incorporated herein by reference from Exhibit 4.2 to YUM’s Report on Form 8-K filed on May 16, 2016.](http://www.sec.gov/Archives/edgar/data/1041061/000110465916121437/a16-11235_1ex4d2.htm) | |
| 21.1 | | | [Active Subsidiaries of [removed: YUM.](https://www.sec.gov/Archives/edgar/data/1041061/000104106118000013/yum-12312017xex211.htm)] [added: YUM.](https://www.sec.gov/Archives/edgar/data/1041061/000104106119000010/yum-12312018xex211.htm)] | |
| 23.1 | | | [Consent of KPMG [removed: LLP.](https://www.sec.gov/Archives/edgar/data/1041061/000104106118000013/yum-12312017xex231.htm)] [added: LLP.](https://www.sec.gov/Archives/edgar/data/1041061/000104106119000010/yum-12312018xex231.htm)] | |
| 31.1 | | | [Certification of the Chief Executive Officer pursuant to Rule 13a-14(a) of Securities Exchange Act of 1934, as adopted pursuant to Section 302 of the Sarbanes-Oxley Act of [removed: 2002.](https://www.sec.gov/Archives/edgar/data/1041061/000104106118000013/yum-12312017xex311.htm)] [added: 2002.](https://www.sec.gov/Archives/edgar/data/1041061/000104106119000010/yum-12312018xex311.htm)] | |
| 31.2 | | | [Certification of the Chief Financial Officer pursuant to Rule 13a-14(a) of Securities Exchange Act of 1934, as adopted pursuant to Section 302 of the Sarbanes-Oxley Act of [removed: 2002.](https://www.sec.gov/Archives/edgar/data/1041061/000104106118000013/yum-12312017xex312.htm)] [added: 2002.](https://www.sec.gov/Archives/edgar/data/1041061/000104106119000010/yum-12312018xex312.htm)] | |
| 32.1 | | | [Certification of the Chief Executive Officer pursuant to 18 U.S.C. Section 1350, as adopted pursuant to Section 906 of the Sarbanes-Oxley Act of [removed: 2002.](https://www.sec.gov/Archives/edgar/data/1041061/000104106118000013/yum-12312017xex321.htm)] [added: 2002.](https://www.sec.gov/Archives/edgar/data/1041061/000104106119000010/yum-12312018xex321.htm)] | |
| 32.2 | | | [Certification of the Chief Financial Officer pursuant to 18 U.S.C. Section 1350, as adopted pursuant to Section 906 of the Sarbanes-Oxley Act of [removed: 2002.](https://www.sec.gov/Archives/edgar/data/1041061/000104106118000013/yum-12312017xex322.htm)] [added: 2002.](https://www.sec.gov/Archives/edgar/data/1041061/000104106119000010/yum-12312018xex322.htm)] | |
| | | | | | |
| --- | --- | --- | --- | --- | --- |
| | | | | | |
| | | | | | |
| | | | | | |
| | | | | | |
| | | | | | |
| | | | | | |
| | | | | | |
| | | | | | |
| | | | | | |
| | | | | | |
| | | | | | |
| | | | | | |
| | | | | | |
| | | | | | |
| 10.1.3 | | | [Refinancing Amendment, dated as of April 3, 2018, to Credit Agreement dated as of June 16, 2016 among Pizza Hut Holdings, LLC, KFC Holding Co. and Taco Bell of America, LLC, as borrowers, the Lenders from time to time party thereto and JPMorgan Chase Bank, N.A., as Collateral Agent, Swing Line Lender, an L/C Issuer and Administrative Agent for the Lenders, which is incorporated herein by reference from Exhibit 10.1 to YUM's Report on Form 8-K as filed on April 9, 2018.](http://www.sec.gov/Archives/edgar/data/1041061/000110465918022987/a18-9774_1ex10d1.htm) | |
| 10.22.2 | | | [Series 2018-1 Supplement to Base Indenture, dated as of November 28, 2018, by and between the Issuer and Citibank, N.A. as Trustee and Series 2018-1 securities intermediary, which is incorporated herein by reference from Exhibit 10.1 to YUM’s Report on Form 8-K filed on December 3, 2018.](http://www.sec.gov/Archives/edgar/data/1041061/000110465918071068/a18-40974_1ex10d1.htm) | |
| 10.22.3 | | | [Amendment No. 1 to Base Indenture, dated as of August 23, 2016, by and between the Issuer and Citibank, N.A. as Trustee and Series 2016-1 securities intermediary as filed herein.](https://www.sec.gov/Archives/edgar/data/1041061/000104106119000010/yum-12312018xex10223.htm) | |
| 10.22.4 | | | [Amendment No. 2 to Base Indenture, dated as of November 28, 2018, by and between the Issuer and Citibank, N.A. as Trustee and the Series 2018-1 securities intermediary, which is incorporated herein by reference from Exhibit 10.2 to YUM’s Report on Form 8-K filed on December 3, 2018.](http://www.sec.gov/Archives/edgar/data/1041061/000110465918071068/a18-40974_1ex10d2.htm) | |
| 10.25.1 | | | [Amendment No.1 to Management Agreement, dated as of August 24, 2016, among Taco Bell Funding, LLC, as issuer, Taco Bell Franchise Holder 1, LLC, Taco Bell Franchisor, LLC, Taco Bell IP Holder, LLC, Taco Bell Franchisor Holdings, LLC and Taco Bell Corp., as manager as filed herein.](https://www.sec.gov/Archives/edgar/data/1041061/000104106119000010/yum-12312018xex10251.htm) | |
| 10.25.2 | | | [Amendment No. 2 to Management Agreement, dated as of November 28, 2018, among Taco Bell Funding, LLC, as issuer, Taco Bell Franchise Holder 1, LLC, Taco Bell Franchisor, LLC, Taco Bell IP Holder, LLC, Taco Bell Franchisor Holdings, LLC, Citibank, N.A. and Taco Bell Corp., as manager as filed herein.](https://www.sec.gov/Archives/edgar/data/1041061/000104106119000010/yum-12312018xex10252.htm) | |
| | | | | |
| --- | --- | --- | --- | --- |
| | | | (vii) | [5.350% Senior Notes due November 1, 2043 issued under the foregoing May 1, 1998 indenture, which notes are incorporated by reference from Exhibit 4.3 (included in Exhibit 4.1) to YUM's Report on Form 8-K filed October 31, 2013.](http://www.sec.gov/Archives/edgar/data/1041061/000110465913079610/a13-23145_1ex4d1.htm) |
| 12.1 | | | [Computation of ratio of earnings to fixed charges.](https://www.sec.gov/Archives/edgar/data/1041061/000104106118000013/yum-12312017xex121.htm) | |