 filings.tools
Zebra Technologies 10-K 2016-12-31
Filed 2017-02-27. 21 sections, 338K characters. Original on sec.gov · Markdown · JSON
Cover and table of contents
10-K 1 a10k12312016zebra.htm 10-K
UNITED STATES
SECURITIES AND EXCHANGE COMMISSION
Washington, D. C. 20549
FORM 10-K
FOR ANNUAL AND TRANSITION REPORTS
PURSUANT TO SECTIONS 13 OR 15(d) OF THE
SECURITIES EXCHANGE ACT OF 1934
| ý | ANNUAL REPORT PURSUANT TO SECTION 13 OR 15(d) OF THE SECURITIES EXCHANGE ACT OF 1934 |
For the fiscal year ended December 31, 2016
OR
| ¨ | TRANSITION REPORT PURSUANT TO SECTION 13 OR 15(d) OF THE SECURITIES EXCHANGE ACT OF 1934 |
| For the transition period from to |
COMMISSION FILE NUMBER 000-19406
Zebra Technologies Corporation
(Exact name of registrant as specified in its charter)
| Delaware | 36-2675536 |
| (State or other jurisdiction of incorporation or organization) | (I.R.S. Employer Identification No.) |
3 Overlook Point, Lincolnshire, IL 60069
(Address of principal executive offices) (Zip Code)
Registrant’s telephone number, including area code: (847) 634-6700
Securities registered pursuant to Section 12(b) of the Act:
| Title of Each Class | Name of Exchange on which Registered | |
| Class A Common Stock, par value $.01 per share | The NASDAQ Stock Market, LLC |
Securities registered pursuant to Section 12(g) of the Act: None
Indicate by check mark if the registrant is a well-known seasoned issuer (as defined in Rule 405 of the Securities Act). Yes X No
Indicate by check mark if the registrant is not required to file reports pursuant to Section 13 or Section 15(d) of the Securities Act. Yes No X
Indicate by check mark whether the registrant (1) has filed all reports required to be filed by Section 13 or 15(d) of the Securities Exchange Act of 1934 during the preceding 12 months (or for such shorter period that the registrant was required to file such reports) and (2) has been subject to such filing requirements for the past 90 days. Yes X No
Indicate by check mark whether the registrant has submitted electronically and posted on its corporate web site, if any, every Interactive Data File required to be submitted and posted pursuant to Rule 405 of Regulation S-T (§232.405 of this chapter) during the preceding 12 months (or for such shorter period that the registrant was required to submit and post such files). Yes X No
Indicate by check mark if disclosure of delinquent filers pursuant to Item 405 of Regulation S-K is not contained herein, and will not be contained, to the best of the registrant’s knowledge, in definitive proxy or information statements incorporated by reference in Part III of this Form 10-K or any amendment to this Form 10-K. [ X ]
Indicate by check mark whether the registrant is a large accelerated filer, an accelerated filer, a non-accelerated filer or a smaller reporting company. See definitions of “accelerated filer,” “large accelerated filer” and “smaller reporting company” in Rule 12b-2 of the Securities Act) (Check one):
| Large accelerated filer X | Accelerated filer |
| Non-accelerated filer (Do not check if a smaller reporting company) | Smaller reporting company |
Indicate by check mark whether the registrant is a shell company (as defined in Rule 12b-2 of the Securities Act). Yes No X
As of July 2, 2016, the aggregate market value of each of the registrant’s Class A Common held by non-affiliates was approximately $2,589,001,121. The closing price of the Class A Common Stock on July 1, 2016, as reported on the Nasdaq Stock Market, was $49.82 per share.
As of February 20, 2017, there were 52,877,247 shares of Class A Common Stock, par value $.01 per share, outstanding.
Documents Incorporated by Reference
Certain sections of the registrant’s Notice of Annual Meeting of Stockholders and Proxy Statement for its Annual Meeting of Stockholders to be held on May 18, 2017, are incorporated by reference into Part III of this report, as indicated herein.
ZEBRA TECHNOLOGIES CORPORATION AND SUBSIDIARIES
INDEX
PART I
References in this document to “the Company,” “we,” “us,” or “our” refer to Zebra Technologies Corporation and its subsidiaries, unless the context specifically indicates otherwise.
Safe Harbor
Forward-looking statements contained in this filing are subject to the safe harbor created by the Private Securities Litigation Reform Act of 1995 and are highly dependent upon a variety of important factors, which could cause actual results to differ materially from those expressed or implied in such forward-looking statements. When used in this document and documents referenced, the words “anticipate,” “believe,” “intend,” “estimate,” “will,” and “expect” and similar expressions as they relate to the Company or its management are intended to identify such forward-looking statements but are not the exclusive means of identifying these statements. The forward-looking statements include, but are not limited to, the Company’s financial outlook for the first quarter and full year of 2017. These forward-looking statements are based on current expectations, forecasts and assumptions and are subject to the risks and uncertainties inherent in the Company’s industry, market conditions, general domestic and international economic conditions, and other factors. These factors include:
| • | Market acceptance of the Company’s products and solution offerings and competitors’ offerings and the potential effects of technological changes, |
| • | The effect of global market conditions, including North America; Europe, Middle East, and Africa; Latin America; and Asia-Pacific regions in which we do business, |
| • | The impact of foreign exchange rates due to the large percentage of our sales and operations being outside the United States (“U.S.”), |
| • | Our ability to control manufacturing and operating costs, |
| • | Risks related to the manufacturing of the Company’s products and conducting business operations in non-U.S. countries, including the risk of depending on key suppliers who are also in non-U.S. countries, |
| • | The Company’s ability to purchase sufficient materials, parts, and components to meet customer demand, particularly in light of global economic conditions, |
| • | The availability of credit and the volatility of capital markets, which may affect our suppliers, customers, and ourselves, |
| • | Success of integrating acquisitions, including the Enterprise business we acquired in October 2014 from Motorola Solutions, Inc., |
| • | Interest rate and financial market conditions, |
| • | Access to cash and cash equivalents held outside the United States, |
| • | The effect of natural disasters on our business, |
| • | The impact of changes in foreign and domestic governmental policies, laws, or regulations, |
| • | The outcome of litigation in which the Company may be involved, particularly litigation or claims related to infringement of third-party intellectual property rights, and |
| • | The outcome of any future tax matters or tax law changes. |
We encourage readers of this report to review Item 1A, “Risk Factors,” in this report for further discussion of issues that could affect the Company’s future results. We undertake no obligation, other than as may be required by law, to publicly update or revise any forward-looking statements, whether as a result of new information, future events, changed circumstances, or any other reason after the date of this report.
Item 1. Business
The Company
We are a global leader in the Automatic Identification and Data Capture (“AIDC”) market. The AIDC market consists of mobile computing, data capture, radio frequency identification devices (“RFID”), barcode printing, and other automation products and services. The Company’s solutions are proven to help our customers and end-users achieve their mission critical strategic business objectives, including improved operational efficiency, optimized workflows, increased asset utilization, and better customer experiences.
We design, manufacture, and sell a broad range of AIDC products, including: mobile computers, barcode scanners, RFID readers, specialty printers for barcode labeling and personal identification, real-time location systems (“RTLS”), related accessories and supplies, such as self-adhesive labels and other consumables, and utilities and application software. We also provide a full range of services, including maintenance, technical support, repair and managed services, including cloud-based subscriptions. End-users of our products and services include those in the retail, transportation and logistics, manufacturing, health care, hospitality, warehouse and distribution, energy and utilities, and education industries around the world. We provide
our products and services globally through a direct sales force and extensive network of channel partners. We provide products and services in over 170 countries, with approximately 120 facilities and 6,500 employees worldwide.
Through innovative application of our technologies, we are leading an evolution of the AIDC market into Enterprise Asset Intelligence (“EAI”) solutions. Specifically, EAI encompasses solutions which “sense” information from enterprise assets, including packages moving through a supply chain, equipment in a factory, workers in warehouse, and shoppers in a store. Operational data from enterprise assets, including status, location, utilization, or preferences, is then analyzed to provide actionable insights. Finally, with the benefits of mobility, these insights can be delivered to the right worker at the right time to drive more effective actions. As a result, our solutions and technologies enable enterprises to “sense, analyze, and act” more effectively to improve operational effectiveness and achieve critical business objectives.
The evolution of the AIDC market toward a more strategically oriented EAI focus is being driven by strong underlying secular trends in technology. These trends include internet of things (“IoT”), cloud-based data analytics, and mobility. The IoT is enabling a proliferation of smart, connected devices. EAI solutions, which include these smart, connected devices, capture a much broader range of information than is possible with traditional AIDC solutions and communicate this information in real-time. Cloud computing and expanded data analytics are allowing enterprises to make better business decisions through improved timeliness and visibility to information and workflows. While AIDC solutions sporadically capture limited amounts of data and populate static enterprise systems, EAI solutions continuously analyze real-time data from many sources to generate actionable insights. Finally, the continued rapid growth of mobile devices and applications are significantly expanding mobile computing use cases to levels of near ubiquity in the enterprise. With expanded mobility, end-users are able to consume or act upon dynamic enterprise data and information anytime and anywhere. The broad availability of wireless and internet connectivity also supports the adoption and deployment of the Company’s solutions to enable organizations to collect more data in real-time on the location, movement, and condition of their assets.
Acquisition of Enterprise Business
In October 2014, the Company acquired the Enterprise business (“Enterprise”), excluding its iDEN or Integrated Digital Enhanced Network Business, from Motorola Solutions, Inc. (“MSI”) for $3.45 billion in cash (the “Acquisition”). Enterprise is an industry leader in mobile computing and advanced data capture technologies and services, which complement the Company’s printing and RFID products. Its products include rugged and enterprise-grade mobile computers, barcode scanners and RFID readers, WLAN solutions, and accessories, software, and services that are associated with these products. Enterprise service revenues include sales arising from maintenance, repair, product support, system installation and integration services, and other services.
The Acquisition expanded the Company’s product lines with complementary products that together are employed by customers to obtain greater visibility and insights into their operations. It enables us to deliver end-to-end solutions supporting the IoT in targeted industries. The expanded capabilities of the combined company make us a more valued strategic supplier to end-users, as well as a more important supplier of products and solutions to our channel partners.
The Company funded the Acquisition through a combination of cash on hand of $250 million, the sale of 7.25% senior notes due 2022 in an aggregate principal amount of $1.05 billion (the “Senior Notes”), and a new credit agreement with various lenders that provided a term loan of $2.2 billion (the “Term Loan”) due 2021. A $250 million revolving credit facility (the “Revolving Credit Facility”) was included as part of the new credit agreement (the Senior Notes and, together with the Term Loan and Revolving Credit Facility, the “Debt Agreements”).
Integration of Enterprise Business
Since closing the Acquisition in October 2014, integration activities by the Company have focused on creating “One Zebra” by integrating the operations of Enterprise with Zebra to create a single business with common sales, service, supply chain, marketing, finance, information technology (“IT”), and other functions. Our priorities have centered on maintaining business continuity while identifying and implementing cost synergies, operating efficiencies, and integration of functional organizations and processes. Another key focus of the integration has been to conclude MSI-provided transition service agreements (“TSAs”) related primarily to IT support services. These TSAs are an interim measure to continue the operations of the Enterprise business without disruption while integration activities are in process.
During 2016, significant progress was made in the areas of culture development and integration of IT infrastructure and business systems, including those to support our global network of channel partners and our Asia-Pacific regional operations. These efforts resulted in the elimination of more than 75% of our TSAs, driven by Enterprise IT applications. In addition, the Company consolidated legacy channel programs of the Legacy Zebra and Enterprise businesses that culminated into the launch of the Company’s PartnerConnect channel program in April 2016.
Additional business system integration work remains including completion of the implementation of a common enterprise resource planning (“ERP”) system. Until such time that the Company is able to complete its transition to common systems, Legacy Zebra and Enterprise will continue to operate largely on separate systems, including separate ERP systems. The IT integration, when completed, will result in a modernized and right-sized IT network and streamlined business processes. Completion of the IT integration, including a common ERP system, is expected before the end of 2017 and will enable us to terminate the remaining TSAs. As a result of our integration efforts, we expect a more efficient and cost effective IT infrastructure, improved operational efficiency, and reduced operating costs.
Dispositions
On October 28, 2016, the Company concluded its Asset Purchase Agreement with Extreme Networks, Inc. (“Extreme”) whereby the Company sold its wireless LAN (“WLAN”) business (“Divestiture Group”) for a gross purchase price of $55 million. See Note 3 Business Combinations and Divestitures.
Operations
Our operations consist of two segments - (1) Legacy Zebra, comprised of barcode and card printing, location solutions, supplies, and services and (2) Enterprise, comprised of mobile computing, data capture, RFID, and services.
Legacy Zebra
Barcode and Card Printing: We design, manufacture, and sell printers, which produce high-quality labels, wristbands, tickets, receipts, and plastic cards on demand. Our customers use our printers in a wide range of applications, including routing and tracking, patient safety, transaction processing, personal identification, and product authentication. These applications require high levels of data accuracy, speed, and reliability. They also include specialty printing for receipts and tickets for improved customer service and productivity gains. Plastic cards are used for secure, reliable personal identification (e.g. state identification cards and drivers’ licenses, healthcare IDs), access control (e.g. employee or student building access), and financial cards (e.g. credit, debit and ATM cards) by financial institutions. Our RFID printers/encoders are used to print and encode passive RFID labels. We offer a wide range of accessories and options for our printers, including vehicle mounts and battery chargers.
Location Solutions: The Company offers a range of RTLS and services, which incorporate active and passive RFID and other tracking technologies to provide visibility into the location and movement of enterprise assets and personnel. Our solutions enable users to locate, track, manage, and optimize the utilization of high-value assets, equipment, and people. We provide substantially all elements of the location solution, including asset tags, call tags, sensors, exciters, middleware software, and application software. Applications for our location solutions span a broad array of industries where tracking assets, transactions, and people are critical. Our solutions are deployed primarily in industrial manufacturing, process industries, aerospace, transportation and logistics, sports, and healthcare environments. Various sports teams utilize our MotionWorks® sports solution to track the location and movement of personnel and objects in real-time during sporting events, as well as in training and practice activities.
Supplies: We produce and sell stock and customized thermal labels, receipts, ribbons, plastic cards, and wristbands suitable for use with our printers, and also wristbands which can be imaged in most commercial laser printers. We support our printing products, resellers, and end-users with an extensive line of superior quality, high-performance supplies optimized to a particular end-user’s needs. We promote the use of genuine Zebra branded supplies with its printing equipment. We also provide a family of self-laminating wristbands for use in laser printers. These wristbands are marketed under the LaserBand® name. We operate supplies production facilities located in the United States and Western Europe. We supplement our in-house production capabilities with those of third-party manufacturers to offer genuine Zebra supplies, principally in Asia.
Services: We provide a full range of maintenance, technical support, repair, and managed services. These offerings include multiple service levels and typically are contracted through multi-year service agreements. We also provide services strategically aligned to the way businesses manage their devices and related software applications. We provide our services directly and also through our network of partners to extend the geographic reach of our service offerings.
Enterprise
Mobile Computing: We design, manufacture, and sell rugged and enterprise-grade mobile computing products in a variety of specialized form factors and features for specific enterprise applications. Industrial applications include inventory management in warehouses and distribution centers; field mobility applications include field service, post and parcel, and direct store delivery; and retail and customer facing applications include e-commerce, omnichannel, mobile point of sale, inventory look-up, and staff collaboration. Our products incorporate both Android™ and Microsoft® Windows® operating systems and support local- and wide-area voice and data communications. Our mobile computing products often incorporate barcode scanning, global position system (“GPS”) and RFID features, and other sensory capabilities. We also provide related software tools, utilities, and applications.
Data Capture and RFID: We design, manufacture, and sell barcode scanners, image capture devices, and RFID readers. Our portfolio of barcode scanners includes laser scanning and imager products and form factors, including fixed, handheld, and embedded original equipment manufacturer (“OEM”) modules. The Company’s data capture products allow the capture of business critical information simply, quickly, and accurately. Common applications include asset identification and tracking and workflow management in a variety of industries, including retail, transportation and logistics, manufacturing, and healthcare. The devices collect and decode barcodes and images and transmit the resulting data to enterprise systems for analysis and timely decision making. Our RFID line of data capture products is focused on ultra-high frequency (“UHF”) technology. These RFID devices comply with the electronic product code (“EPC”) global Generation 2 UHF standard and similar standards around the world. We also provide related accessories.
Services: We provide a full range of maintenance, technical support, repair and managed services, including cloud-based subscriptions. These offerings include multiple service levels and typically are contracted through multi-year service agreements. We also provide services strategically aligned to the way enterprise businesses manage their mobility devices and related software applications. This includes services that help customers design, test, and deploy our solutions. We also assist customers in modernizing their mobile user experiences and increasing the efficiency of their operations by migrating legacy applications to newer architectures or redesigning user software applications, workflows, and backend system integrations. We provide our services directly and also through our network of partners to extend the geographic reach of our service offerings.
Our Competitive Strengths
The following are core competitive strengths that we believe enable us to differentiate ourselves from our competitors:
An industry leader focused solely on Enterprise Asset Intelligence
We focus on key technologies of Enterprise Asset Intelligence, including mobile computing; barcode and card printing; data capture; RFID; and location solutions. We also provide related software, services, and accessories. We believe we are the market leader in mobile computing, barcode printing, data capture, and UHF RFID readers.
High entry and switching barriers
On a global basis, we have long-standing relationships with end customers and with our extensive network of channel partners. We believe these customer relationships and a strong partner network are critical parts of our success and would be difficult for a new market entrant to replicate. We believe a significant portion of our products are deployed with specialized product performance and software application requirements, which could result in high switching costs.
Commitment to innovation and deep industry-specific expertise
We leverage our strong commitment to innovation and deep industry-specific expertise to deliver end-to-end solutions across targeted industries, with a broad portfolio of products and services.
Highly diversified business mix
We are highly diversified across business segments, end markets, geographies, customers, and suppliers. Additionally, we have strong recurring business in services and supplies driven by an extensive global installed base of products.
Global reach and brand
We sell to customers directly and through our network of channel partners around the world. This global presence gives us the capability to supply our customers with products, solutions, and services no matter the location of their operations. In addition, we believe we have strong brand recognition with a reputation in the industry as a trusted and strategic partner and supplier.
Scale advantages
We believe the size and scope of our operations, including market leadership; product development investment; portfolio breadth; and global distribution, give us advantages over our competitors. We believe we have the largest installed base of products, compared with other companies in our industry. These characteristics enable us to compete successfully, achieve economies of scale, and develop industry-leading solutions.
Our Business Strategies
Leverage our leadership position and innovation to drive profitable growth in our core business
We expect to drive revenue growth by continuing to outpace our competition in our core businesses, including mobile computing, data capture, barcode printing, and services. We expect to achieve this by leveraging our broad portfolio of solutions and product innovation and becoming a more strategic partner to our end customers. We also expect to drive growth by capitalizing on technology transitions occurring in the industry, including the transition to more modern mobile operating systems in mobile computing and transitions in data capture to newer technologies involving 2D imaging and RFID. This will be augmented by increased focus on market segments and geographies that offer share-gain opportunities. In addition, we plan
to leverage our market-leading installed base to accelerate growth in attach-oriented products, including services, supplies, and accessories. Our global channel partner network is vital to helping us achieve these goals. As such, we will ensure that we provide the necessary value and support for our partners to be successful.
Integrate and optimize the combined company as one seamless, focused company
We are integrating, optimizing, and reshaping the Company into a seamless, focused company with a high-performance culture characterized by a common purpose and shared set of values. We also plan to introduce common features, functions, and user experiences across our broad portfolio of solutions to drive competitive differentiation and increase cross-selling. Our plans include developing and delivering new offerings that integrate various devices, software, and services into complete, end-to-end solutions for our customers and partners. We also expect to continue to position ourselves for additional operating efficiencies driven by a common IT platform and operating model enhancements.
Drive our Enterprise Asset Intelligence vision
We believe that secular technology trends, particularly in enterprise mobility, cloud computing, and IoT are transforming our customers’ businesses and our industry and provide us with significant new opportunities to create value for our customers and for the Company. By capitalizing on these trends, and in particular the proliferation of smart connected sensors and devices in our core market segments, we plan to provide new end-to-end solutions that integrate these sensors and devices with cloud-based workflow and analytics applications. These solutions will enable increased visibility into the enterprise, real-time, actionable information, and improved customer experiences.
Continuously improve operating efficiency to expand profitability
We intend to continuously improve profitability through operational execution, cost reductions, and further operating efficiencies derived from continuous business process improvement and the integration of the Enterprise business and systems. We also intend to increase profitability through growing our business by delivering innovative end-to-end solutions that provide significant value to our customers.
Improve cash flow generation and reduce debt
Our primary balance sheet priority is to expand operating cash flow generation through growth in the business, margin expansion, and reductions in certain uses of cash, including costs and capital expenditures related to integration of the Company, as well as maintaining a strong focus on working capital efficiency. Our capital allocation priority will continue to be the reduction of debt.
Competition
We operate in a highly competitive environment. The need for companies to improve productivity and implement their strategies, as well as the secular trends around IoT, cloud computing, and mobility are some of the factors that are creating growth opportunities for established and new competitors.
Key competitive factors include the design, breadth and quality of products and services, price, product performance, durability, product and service availability, warranty coverage, brand recognition, company relationships with customers and channel partners, and company reputation. We believe we compete effectively with respect to these factors.
Mobile Computing: Competitors in mobile computing include companies that have historically served enterprises with ruggedized devices. We also compete with companies engaged in the design, manufacture, and marketing of devices for broader consumer and commercial applications, including notebook computers and tablets, smart phones, cordless phones, and cellular/wired infrastructure equipment. Competitors include the following: Apple, Datalogic, Honeywell, Panasonic, and Samsung.
Data Capture and RFID: Competitors that provide a broad portfolio of barcode scanning products that are suitable for the majority of global market applications include Honeywell and Datalogic. In addition, we also compete against several smaller companies that focus on limited product subsets or specific regions. These competitors include Code Corporation, Fujian, Impinj, Newland, and Opticon.
Barcode and Card Printing: We consider our direct competition in printing to be producers of on-demand thermal transfer and direct thermal label printing systems, RFID printer/encoders, and mobile printers. We also compete with companies engaged in the design, manufacture, and marketing of printing systems that use alternative technologies, such as ink-jet, direct marking and laser printing, as well as card printers based on ink-jet, thermal transfer, embossing, film-based systems, encoders, laser engraving, and large-scale dye sublimation printers. In addition, service bureaus, which provide centralized services, compete for end-user business and provide an alternative to the purchase of our card printing equipment and supplies. Competitors to our printing business include: Datacard, Evolis, Fargo Electronics (a unit of HID Global), Honeywell, Sato, and Toshiba TEC.
Location Solutions: We compete with a diverse group of companies marketing location solutions that are primarily based on active RFID technologies. These competitors include: Alien Technology, Cisco, Impinj, and Ubisense.
Supplies: The supplies industry is highly fragmented with competition comprised of numerous companies of various sizes around the world.
Customers
Our customers are diversified across a wide variety of industries, including retail, transportation and logistics, manufacturing, and healthcare industries. Over the past three years, we have had three customers that each accounted for 10% or more of our sales. All three of these customers are distributors and not end-users. No end-user accounts for 10% or more of net sales during these years. See Note 16 Segment Information and Geographic Data for further information.
| Year Ended December 31, | ||||||||
| 2016 | 2015 | 2014 | ||||||
| Customer A | 20.1 | % | 19.4 | % | 17.9 | % | ||
| Customer B | 13.2 | % | 12.7 | % | 13.6 | % | ||
| Customer C | 12.4 | % | 11.6 | % | 11.6 | % |
Sales and Marketing
Sales: We sell our products, solutions, and services primarily through distributors (two-tier distribution), value added resellers (“VAR”), independent software vendors (“ISVs”), direct marketers, and OEMs. We also sell directly to a select number of customers through our direct sales force. Distributors purchase our products and sell to VARs, ISVs and others, thereby increasing the distribution of our products globally. VARs, ISVs, OEMs, and systems integrators provide customers with a variety of hardware, accessories, software applications, and services. VARs and ISVs typically customize solutions for specific end-user applications using their industry, systems, and applications expertise. Some OEMs resell the Zebra-manufactured products under their own brands as part of their own product offering. Because these sales channels provide specific software, configuration, installation, integration, and support services to end-users within various industry segments, these relationships are highly valued by end-users and allow us to reach customers in a wide array of industries around the world. We believe that the breadth of our distributor and channel partner network enhances our ability to compete and to effectively offer our solutions to a wide array of end-users globally. Finally, we experience some seasonality in sales, depending upon the geographic region and industry served.
Marketing: Our marketing function aligns closely with sales and product management functions to market our products and to deliver and promote solutions that address the needs of our customers and partners. Our marketing organization includes global corporate marketing, solutions marketing, field marketing, business intelligence, demand center, and channel marketing functions. Our corporate marketing function manages our brand, public and industry relations, and other communications activities. Regional marketing encompasses field and channel marketing, demand generation, and sales enablement. Solutions marketing includes product and industry marketing. Business intelligence provides fact-based insights into our markets, competitors, customers, and partners. Our global demand center leads content development and digital marketing, including our website and social media. The global channel team develops and executes channel strategy and operations.
Manufacturing and Outsourcing
Final assembly of our hardware products is performed by third-parties, including electronics manufacturing services companies (“EMS”) and joint design manufacturers (“JDMs”). Our products are produced primarily in facilities located in China, Mexico, and Brazil. We maintain the services of JDMs for certain products. These JDMs or manufacturers produce our products to our design specifications. We maintain control over portions of the supply chain, including supplier selection and price negotiations for key components. The manufacturers purchase the components and subassemblies used in the production of our products. The majority of our products are shipped to regional distribution centers, which are primarily operated by 3rd party logistics providers (“3PL’s”). A portion of products are reconfigured at the distribution centers through firmware downloads, packaging, and customer specific customization before they are shipped to customers. In addition, certain products are manufactured in accordance with procurement regulations and various international trade agreements, and remain eligible for sale to the United States government. Production facilities for our supplies products are located in the United States and Western Europe. We also supplement our in-house production capabilities with those of third-party manufacturers to offer our supplies, principally in Asia.
Research and Development
The Company devotes significant resources to developing innovative solutions for our target markets and ensuring that our products and services maintain high levels of reliability and provide value to end-users. Research and development expenditures for the years ended 2016, 2015, and 2014 were $376 million, $394 million, and $151 million respectively, or
10.5% of net sales for 2016, 10.8% of net sales for 2015 and 9.0% of net sales in 2014. We have more than 1,500 product development engineers worldwide focused on strengthening and broadening our extensive portfolio of products and solutions.
Our Technology
Mobile Computing: Our mobile computing products incorporate a wide array of advanced technologies in rugged, ergonomic enclosures to meet the needs of specific use cases. These purpose-built devices couple hardened industry-standard operating systems with specialized hardware and software features to satisfy a customer’s mission-critical applications. Purpose-built rugged housings ensure reliable operations for targeted use cases, surviving years of rough handling and harsh environments. Specialized features such as advanced data capture technologies, voice and video collaboration tools, and advanced battery technologies enable our customers to work more efficiently and better serve their customers. A broad portfolio of enterprise accessories further tailors mobile computers to meet a wide variety of enterprise use cases. Our mobile computers are offered with software tools and services that support application development, device configuration, and field support to facilitate smooth and rapid deployment and ensure maximum customer return on investment.
Data Capture and RFID: Our data capture products allow businesses to track business critical information simply, quickly, and accurately - providing critical visibility into business processes and performance, thus, enabling real-time action in response to the information. These products include barcode scanners in a variety of form factors, including handheld scanners and standalone modules designed for integration into third-party OEM devices. These scanners incorporate a variety of technologies including area imagers, linear imagers, lasers and read linear, and two-dimensional barcodes. They are used in a broad range of applications, ranging from supermarket checkout to industrial warehouse optimization to patient management in hospitals. The design of these products reflects the diverse needs of these markets, with different ergonomics, multiple communication protocols, and varying levels of ruggedness. Our RFID readers use passive Ultra High Frequency (“UHF”) to provide high speed, non-line of sight data capture, reading data from hundreds or thousands of RFID tags in near real-time. Using the Electronic Product Code (“EPC”) standard, our customers take advantage of RFID technology across multiple industries to track high-value assets, monitor shipments, and drive increased retail sales though improved inventory accuracy. We also offer mobile computers that support high frequency (“HF”) near-field communications (“NFC”) and low frequency (“LF”) radio technologies.
Barcode and Card Printing: All of the Company’s printers and print engines incorporate thermal printing and RFID tag encoding technology. Thermal printing technology creates an image by heating certain pixels of an electrical printhead to selectively image a ribbon or heat-sensitive substrate. Thermal printing benefits applications requiring simple and reliable operations, yet it is flexible enough to support a wide range of specialty label materials and associated inks. Our dye-sublimation thermal card printers produce full-color, photographic quality images that are well-suited for driver’s licenses, access and identification cards, transaction cards, and on-demand photographs. Many of our printers also incorporate RFID technology that can encode data into passive RFID transponders embedded in a label or card.
The Company’s printers integrate company-designed mechanisms, electrical systems, and firmware. Enclosures of metal or high-impact plastic ensure the durability of our printers. Special mechanisms optimize handling of labels, ribbons, and plastic cards. Fast, high-current electrical systems provide consistent image quality. Firmware supports serial, parallel, Ethernet, USB, Bluetooth, or 802.11 wireless communications with appropriate security protocols. Printing instructions can be received as a proprietary language such as Zebra Programming Language II (“ZPL II®”), as a print driver-provided image, or as user-defined XML. These features make our printers easy to integrate into virtually all common computer systems.
Location Solutions: Our RTLS solutions use active and passive RFID technologies, beacons, and other tracking technologies to locate, track, manage, and optimize high-value assets, equipment, and people. We offer a range of scalable RTLS technologies that generate precise, on-demand information about the physical location and status of high-valued assets. Customers benefit by utilizing the choice or combination of asset tracking products that can be “application matched” based on ISO/IEC 24730-2, Cisco CCX Wi-Fi, precision GPS, beacons and ultra-wideband (“UWB”) technologies. In addition, we offer a selection of RTLS infrastructure products that receive tag transmissions and provide location and motion calculations, database and system management functions and asset visibility. The flexible infrastructure supports large tag populations and coverage areas that range from small to large.
Supplies: Our supplies business includes thermal labels, receipts, ribbons, plastic cards and wristbands suitable for use with our printers, and also wristbands which can be imaged in most commercial laser printers. Our wristbands incorporate multi-layer form technology to ensure trouble-free printing, wearer comfort, and reliable barcode reading, even when exposed to harsh chemical environments. We offer many thermal label, card, and receipt materials, and matching ribbons for diverse applications that may require meeting unique or precise specifications, including chemical or abrasion resistance, temperature extremes, exceptional image quality, or long life.
Intellectual Property
We rely on a combination of trade secrets, patents, trademarks, copyrights, and contractual rights to establish and protect our innovations, and holds a large portfolio of intellectual property rights in the United States and other countries. As of December 31, 2016, the Company owned approximately 1,600 trademark registrations and trademark applications, and approximately 4,200 patents and patent applications, worldwide. We continue to actively seek to obtain patents and trademarks, whenever possible and practical, to secure intellectual property rights in our innovations.
We believe that our intellectual property will continue to provide us with a competitive advantage in our core product areas as well as provide leverage for future technologies. We also believe that we are not dependent upon any single patent or select group of patents. Our success depends more upon our extensive know-how, deep understanding of end-user processes and workflows, innovative culture, technical leadership and marketing and sales abilities. Although we do not rely only on patents or other intellectual property rights to protect or establish our market position, we will enforce our intellectual property rights when and where appropriate.
Employees
As of December 31, 2016, the Company employed approximately 6,500 persons. Some portions of our business, primarily in Europe and China, are subject to labor laws that differ significantly from those in the United States. In Europe, for example, it is common for a works council to represent employees when discussing matters such as compensation, benefits, restructurings and layoffs. We consider our relations with our employees to be very good.
Regulatory Matters
Wireless Regulatory Matters
Our business is subject to certain wireless regulatory matters.
The use of wireless voice, data, and video communications systems requires radio spectrum, which is regulated by government agencies throughout the world. In the U.S., the Federal Communications Commission (“FCC”) and the National Telecommunications and Information Administration (“NTIA”) regulate spectrum use by non-federal entities and federal entities, respectively. Similarly, countries around the world have one or more regulatory bodies that define and implement the rules for use of the radio spectrum, pursuant to their respective national laws and international coordination under the International Telecommunications Union. We manufacture and market products in spectrum bands already made available by regulatory bodies- these include voice and data infrastructure, mobile radios, and portable or hand held devices. Consequently, our results of operations could be positively or negatively affected by the rules and regulations adopted from time-to-time by the FCC, NTIA, or regulatory agencies in other countries. Our products operate both on licensed and unlicensed spectrum. The availability of additional radio spectrum may provide new business opportunities, and consequently, the loss of available radio spectrum may result in the loss of business opportunities. Regulatory changes in current spectrum bands may also provide opportunities or may require modifications to some products so they can continue to be manufactured and marketed.
Other Regulatory Matters
Some of our operations use substances regulated under various federal, state, local, and international laws governing the environment and worker health and safety, including those governing the discharge of pollutants into the ground, air and water, the management and disposal of hazardous substances and wastes and the cleanup of contaminated sites. Certain products are subject to various federal, state, local, and international laws governing chemical substances in electronic products. During 2016, compliance with U.S. federal, state and local, and foreign laws regulating the discharge of materials into the environment, or otherwise relating to the protection of the environment did not have a material effect on our business or results of operations.
Item 1A. Risk Factors
Investors should carefully consider the risks, uncertainties, and other factors described below, as well as other disclosures in Management’s Discussion and Analysis of Financial Condition and Results of Operations, because they could have a material adverse effect on our business, financial condition, operating results, cash flows, and growth prospects. These risks are not the only risks we face. Our business operations could also be affected by additional factors that are not presently known to us or that we currently consider to be immaterial.
We have organized the risk factors into three sections: (1) Risks related to our business; (2) Risks related to the Acquisition and Integration of Enterprise; and (3) Risks related to our Indebtedness.
Risks related to our business
The Company has substantial operations and sells a significant portion of our products outside of the U.S. and purchases important components, including final products, from suppliers located outside the U.S. Shipments to non-U.S. customers are
expected to continue to account for a material portion of net sales. We also expect to continue the use of third-party contract manufacturing services with non-U.S. production and assembly operations for our products.
Risks associated with operations, sales, and purchases outside the United States include:
| • | Fluctuating foreign currency rates could restrict sales, increase costs of purchasing, and impact collection of receivables outside of the U.S.; |
| • | Volatility in foreign credit markets may affect the financial well-being of our customers and suppliers; |
| • | Violations of anti-corruption laws, including the Foreign Corrupt Practices Act and the U.K. Bribery Act; |
| • | Adverse changes in, or uncertainty of, local business laws or practices, including the following: |
| • | Foreign governments may impose burdensome tariffs, quotas, taxes, trade barriers, or capital flow restrictions; |
| • | Restrictions on the export or import of technology may reduce or eliminate the ability to sell in or purchase from certain markets; |
| • | Political and economic instability may reduce demand for our products or put our non-U.S. assets at risk; |
| • | Potentially limited intellectual property protection in certain countries may limit recourse against infringing on our products or cause us to refrain from selling in certain geographic territories; |
| • | Staffing may be difficult along with higher turnover at international operations; |
| • | A government controlled exchange rate and limitations on the convertibility of currencies, including the Chinese yuan; |
| • | Transportation delays and customs related delays that may affect production and distribution of our products; |
| • | Effectively managing and overseeing operations that are distant and remote from corporate headquarters may be difficult; and |
| • | Integration and enforcement of laws varies significantly among jurisdictions and may change significantly over time. |
The Company may not be able to continue to develop products or solutions to address user needs effectively in an industry characterized by ongoing change. To be successful, we must adapt to rapidly changing technological and application needs by continually improving our products, as well as introducing new products and services, to address user demands.
The Company’s industry is characterized by:
| • | Evolving industry standards, |
| • | Frequent new product and service introductions, |
| • | Evolving distribution channels, |
| • | Increasing demand for customized product and software solutions, |
| • | Changing customer demands, and |
| • | Changing security protocols. |
Future success will depend on our ability to effectively and economically adapt in this evolving environment. We could incur substantial costs if we have to modify our business to adapt to these changes, and may even be unable to adapt to these changes.
The Company participates in a competitive industry, which may become more competitive. Competitors may be able to respond more quickly to new or emerging technology and changes in customer requirements. We face significant competition in developing and selling our products and solutions. To remain competitive, we believe we must continue to effectively and economically provide:
| • | Technologically advanced systems that satisfy user demands, |
| • | Superior customer service, |
| • | High levels of quality and reliability, and |
| • | Dependable and efficient distribution networks. |
We cannot assure we will be able to compete successfully against current or future competitors. Increased competition in mobile computing products, data capture products, printers, or supplies may result in price reductions, lower gross profit margins, and loss of market share, and could require increased spending on research and development, sales and marketing, and customer support. Some competitors may make strategic acquisitions or establish cooperative relationships with suppliers or companies that produce complementary products, which may create additional pressures on our competitive position in the marketplace.
The Company is vulnerable to the potential difficulties associated with the increase in the complexity of our business. We have grown rapidly over the last several years through the Acquisition and worldwide growth. This growth has caused increased complexities in the business. We believe our future success depends in part on our ability to manage our growth and increased complexities of our business. The following factors could present difficulties to us:
| • | Managing our distribution channel partners; |
| • | Managing our contract manufacturing and supply chain; |
| • | Manufacturing an increased number of products; |
| • | Increased administrative and operational burden; |
| • | Maintaining and improving information technology infrastructure to support growth; |
| • | Increased logistical problems common to complex, expansive operations; and |
| • | Increasing international operations. |
Inability to consummate future acquisitions at appropriate prices could negatively impact our growth rate and stock price. Our ability to expand revenues, earnings, and cash flow depends in part upon our ability to identify and successfully acquire and integrate businesses at appropriate prices and to realize anticipated synergies. Acquisitions can be difficult to identify and consummate due to competition among prospective buyers and the need to satisfy applicable closing conditions and obtain antitrust and other regulatory approval on acceptable terms.
The Company could encounter difficulties in any acquisition it undertakes, including unanticipated integration problems and business disruption. Acquisitions could also dilute stockholder value and adversely affect operating results. We may acquire or make investments in other businesses, technologies, services, or products. An acquisition may present business issues which are new to us. The process of integrating any acquired business, technology, service, or product into our operations may result in unforeseen operating difficulties and expenditures. Integration of an acquired company also may consume considerable management time and attention, which could otherwise
Showing the first 8K of 65K characters. Open the full section
Item 1B. Unresolved Staff Comments
Not applicable.
Item 2. Properties
Our corporate headquarters are located in Lincolnshire, Illinois; a northern suburb of Chicago. We also operate manufacturing, production and warehousing, administrative, research, and sales facilities in other U.S. and international locations.
As of December 31, 2016, we owned 3 lab and warehouse facilities located in: Holtsville, NY; Preston, UK; and Mississauga, Ontario, Canada. The Company operates 8 facilities for the purposes of manufacturing, production, and warehousing, 5 of which are located in the United States and 3 are located in other countries. As of December 31, 2016, the Company leased 115 office facilities, 33 of which were located in the United States and 82 were located in other countries.
We generally consider the productive capacity of the plants to be adequate and sufficient for our requirements. The extent of utilization of each manufacturing facility varies throughout the year.
Item 3. Legal Proceedings
See Note 11 Contingencies in the Notes to Consolidated Financial Statements included in this Form 10-K.
Item 4. Mine Safety Disclosures
Not applicable.
PART II
Item 5. Market for Registrant’s Common Equity, Related Stockholder Matters and Issuer Purchases of Equity Securities
Stock Information: Price Range and Common Stock
Our Class A common stock is traded on the NASDAQ Stock Market under the symbol ZBRA. The following table shows the high and low trade prices for each fiscal quarter in 2016 and 2015, as reported by the NASDAQ Stock Market.
| 2016 | High | Low | 2015 | High | Low | |||||||||||||
| First Quarter | $ | 70.30 | $ | 52.14 | First Quarter | $ | 92.48 | $ | 74.40 | |||||||||
| Second Quarter | 68.49 | 48.51 | Second Quarter | 119.47 | 88.41 | |||||||||||||
| Third Quarter | 71.61 | 46.13 | Third Quarter | 117.00 | 71.95 | |||||||||||||
| Fourth Quarter | 88.00 | 62.91 | Fourth Quarter | 83.02 | 63.92 |
Source: The NASDAQ Stock Market
At February 20, 2017, the last reported price for the Class A common stock was $85.99 per share, and there were 140 registered stockholders of record for Zebra’s Class A common stock. In addition, we had approximately 25,868 stockholders who owned our stock in street name.
Dividend Policy
Since our initial public offering in 1991, we have not declared any cash dividends or distributions on our capital stock. We currently do not anticipate paying any cash dividends in the foreseeable future.
Treasury Shares
We did not purchase shares of Zebra Class A common stock during 2016 as part of the purchase plan program.
In November 2011, our Board authorized the purchase of up to an additional 3,000,000 shares under the purchase plan program and the maximum number of shares that may yet be purchased under the program is 665,475. The November 2011 authorization does not have an expiration date.
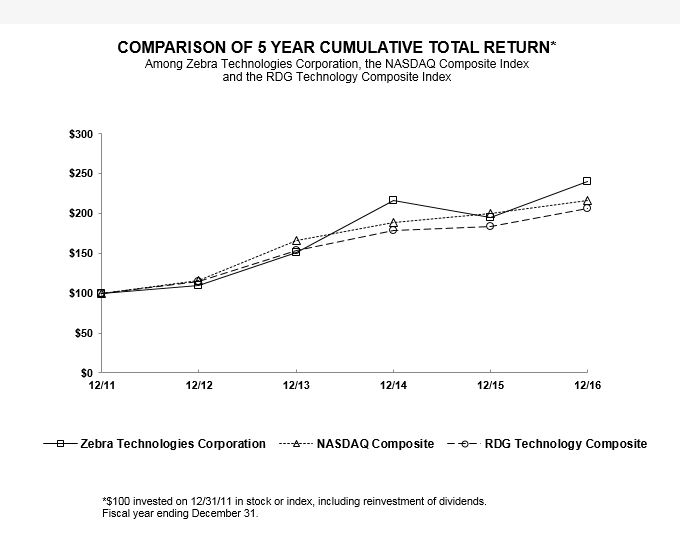
Stock Performance Graph
This graph compares the cumulative annual change since December 31, 2011, of the total stockholder return of Zebra Technologies Corporation Class A common stock with the cumulative return on the following published indices: (i) the RDG Technology Composite; and (ii) the NASDAQ Composite Market Index, during the same period. The comparison assumes that $100 was invested in each of the Company’s Class A common stock, the stocks comprising the RDG Technology Composite and the stocks comprising the NASDAQ Composite Market Index on December 31, 2011. The comparison assumes that all dividends were reinvested at the end of the month in which they were paid.
Item 6. Selected Financial Data
FIVE YEAR SUMMARY OF SELECTED CONSOLIDATED FINANCIAL DATA
(In millions, except shares and per share amounts)
| Year Ended December 31, | ||||||||||||||||||||
| Net (Loss)/Income(1) | 2016 | 2015 | 2014 | 2013 | 2012 | |||||||||||||||
| Net sales | $ | 3,574 | $ | 3,650 | $ | 1,671 | $ | 1,038 | $ | 996 | ||||||||||
| Cost of sales | 1,932 | 2,006 | 893 | 535 | 505 | |||||||||||||||
| Gross profit | 1,642 | 1,644 | 778 | 503 | 491 | |||||||||||||||
| Acquisition and integration costs | 125 | 145 | 127 | 5 | 3 | |||||||||||||||
| Exit and restructuring costs | 19 | 40 | 6 | 6 | 1 | |||||||||||||||
| Other operating expenses | 1,418 | 1,422 | 556 | 332 | 323 | |||||||||||||||
| Total operating expenses | 1,562 | 1,607 | 689 | 343 | 327 | |||||||||||||||
| Operating income | 80 | 37 | 89 | 160 | 164 | |||||||||||||||
| (Loss) income from continuing operations before income taxes | (129 | ) | (2) | (180 | ) | (2) | 17 | (2) | 164 | 164 | ||||||||||
| (Loss) income from continuing operations, net of tax | (137 | ) | (158 | ) | 32 | 134 | 122 | |||||||||||||
| Income from discontinued operations, net of tax(3) | — | — | — | — | 1 | |||||||||||||||
| Net (loss) income | $ | (137 | ) | $ | (158 | ) | $ | 32 | $ | 134 | $ | 123 | ||||||||
| Basic earnings per share: | ||||||||||||||||||||
| (Loss) income from continuing operations | $ | (2.65 | ) | $ | (3.10 | ) | $ | 0.64 | $ | 2.65 | $ | 2.36 | ||||||||
| Income from discontinued operations(3) | — | — | — | — | 0.02 | |||||||||||||||
| Net (loss) income | $ | (2.65 | ) | $ | (3.10 | ) | $ | 0.64 | $ | 2.65 | $ | 2.38 | ||||||||
| Diluted earnings per share: | ||||||||||||||||||||
| (Loss) income from continuing operations | $ | (2.65 | ) | $ | (3.10 | ) | $ | 0.63 | $ | 2.63 | $ | 2.35 | ||||||||
| Income from discontinued operations(3) | — | — | — | — | 0.02 | |||||||||||||||
| Net (loss) income | $ | (2.65 | ) | $ | (3.10 | ) | $ | 0.63 | $ | 2.63 | $ | 2.37 | ||||||||
| Weighted average shares outstanding | ||||||||||||||||||||
| Basic | 51,579,112 | 50,996,297 | 50,789,173 | 50,692,942 | 51,566,468 | |||||||||||||||
| Diluted | 51,579,112 | 50,996,297 | 51,379,698 | 51,063,189 | 51,843,051 |
| December 31, | ||||||||||||||||||||
| Balance Sheet(1) | 2016 | 2015 | 2014 | 2013 | 2012 | |||||||||||||||
| Cash and cash equivalents, investments and marketable securities | $ | 156 | $ | 192 | $ | 418 | $ | 416 | $ | 394 | ||||||||||
| Working capital(4) | 273 | 439 | 719 | 635 | 616 | |||||||||||||||
| Total assets | 4,632 | 5,040 | 5,539 | 1,120 | 968 | |||||||||||||||
| Long-term liabilities | 2,891 | 3,252 | 3,346 | 15 | 14 | |||||||||||||||
| Stockholders’ equity | 792 | 893 | 1,040 | 959 | 857 |
| (1) | Includes the Enterprise business from its date of acquisition, October 27, 2014. |
| (2) | 2016 includes interest expense of $193 million, accelerated loan discount amortization of $3 million due to debt refinancing, and a minimal impact from forward swaps. See Note 9 Long-Term Debt for further information on debt refinancing amendments. 2015 includes interest expense of $197 million and forward swaps gain of $4 million. 2014 includes interest expense of $57 million and forward swaps loss of $5 million. |
| (3) | Income from discontinued operations is related to a reversal of amounts previously reserved, which were part of the finalization of the accounting for the sale of Navis, LLC and Proveo AG during 2011. |
| (4) | Calculated as current assets minus current liabilities. |
Item 7. Management’s Discussion and Analysis of Financial Condition and Results of Operations
Overview
The Company is a global leader respected for innovative EAI solutions in the automatic information and data capture solutions industry. We design, manufacture, and sell a broad range of products that capture and move data, including: mobile computers; barcode scanners and imagers; RFID readers; specialty printers for barcode labeling and personal identification; RTLS; related accessories and supplies, such as self-adhesive labels and other consumables; and utilities and application software. We also provide a full range of services, including maintenance, technical support, repair, and managed services, including cloud-based subscriptions. End-users of our products and services include those in the retail, transportation and logistics, manufacturing, healthcare, hospitality, warehouse and distribution, energy and utilities, and education industries around the world. Benefits of our solutions include improved efficiency and workflow management, increased productivity and asset utilization, real-time, actionable enterprise information, and better customer experiences. We provide our products and services globally through a direct sales force and extensive network of partners. We provide products and services in over 170 countries, with approximately 120 facilities and 6,500 employees worldwide.
In October 2014, Zebra acquired Enterprise from MSI, excluding its iDEN, or Integrated Digital Enhanced Network Business, for $3.45 billion in cash. Zebra financed the Acquisition through a combination of cash on hand and borrowings of $3.25 billion (the “Indebtedness”), including the sale of 7.25% senior notes due 2022 with an aggregate principal amount of $1.05 billion and a new credit agreement with various lenders that provided a term loan of $2.20 billion due 2021. The new credit agreement also included a $250 million revolving credit facility. See Note 3 Business Combinations and Divestitures for additional information.
On September 13, 2016, the Company entered into an Asset Purchase Agreement with Extreme Networks, Inc. to divest of its wireless LAN (“WLAN”) business (“Divestiture Group”). WLAN operating results are reported in the Enterprise segment through the closing date of the WLAN divestiture of October 28, 2016. See Note 3 Business Combinations and Divestitures for additional information.
Segments
The Company’s operations consist of two reportable segments: Legacy Zebra and Enterprise.
Legacy Zebra
The Legacy Zebra segment is an industry leader in barcode printing and asset tracking technologies. Its major product lines include barcode and card printers, location solutions, supplies, and services. Industries served include retail, transportation and logistics, manufacturing, healthcare, and other end markets within the following regions: North America; Europe, Middle East, and Africa; Asia-Pacific; and Latin America.
Enterprise
The Enterprise segment is an industry leader in automatic information and data capture solutions. Its major product lines include mobile computing, data capture, RFID, and services. Industries served include retail, transportation and logistics, manufacturing, healthcare, and other end markets within the following regions: North America; Europe, Middle East, and Africa; Asia-Pacific; and Latin America.
Geographic Information. For the year ended December 31, 2016, the Company recorded $3.6 billion of net sales in its consolidated statements of operations, of which approximately 48.7% were attributable to North America; approximately 31.8% were attributable to Europe, Middle East, and Africa (“EMEA”); and other foreign locations accounted for the remaining 19.5%. Net sales attributable from each region are relatively consistent with the prior year period.
Results of Operations: Year Ended 2016 versus 2015 and Year Ended 2015 versus 2014
Consolidated Results of Operations
(Amounts in millions, except percentages)
| Year Ended December 31, | Percent Change 2016 vs 2015 | Percent Change 2015 vs 2014 | |||||||||||||||
| 2016 | 2015 | 2014(1) | |||||||||||||||
| Net sales | $ | 3,574 | $ | 3,650 | $ | 1,671 | (2.1 | )% | 118.3 | % | |||||||
| Gross profit | 1,642 | 1,644 | 778 | (0.1 | )% | 111.3 | % | ||||||||||
| Operating expenses | 1,562 | 1,607 | 689 | (2.8 | )% | 133.1 | % | ||||||||||
| Operating income | $ | 80 | $ | 37 | $ | 89 | 116.2 | % | (58.4 | )% | |||||||
| Gross margin | 45.9 | % | 45.0 | % | 46.6 | % |
Net sales by product category were as follows (amounts in millions, except percentages):
| Year Ended December 31, | Percent Change 2016 vs 2015 | Percent Change 2015 vs 2014 | |||||||||||||||
| 2016 | 2015 | 2014(1) | |||||||||||||||
| Hardware | $ | 2,778 | $ | 2,863 | $ | 1,234 | (3.0 | )% | 132.1 | % | |||||||
| Supplies | 278 | 268 | 265 | 3.7 | % | 1.2 | % | ||||||||||
| Service and Software | 518 | 519 | 172 | (0.2 | )% | 201.7 | % | ||||||||||
| Total Net sales | $ | 3,574 | $ | 3,650 | $ | 1,671 |
Net sales to customers by geographic region were as follows (in millions, except percentages):
| Year Ended December 31, | Percent Change 2016 vs 2015 | Percent Change 2015 vs 2014 | |||||||||||||||
| 2016 | 2015 | 2014(1) | |||||||||||||||
| Europe, Middle East, and Africa | $ | 1,138 | $ | 1,194 | $ | 583 | (4.7 | )% | 104.8 | % | |||||||
| Latin America | 214 | 219 | 135 | (2.3 | )% | 62.7 | % | ||||||||||
| Asia-Pacific | 483 | 463 | 216 | 4.3 | % | 114.3 | % | ||||||||||
| Total International | 1,835 | 1,876 | 934 | (2.2 | )% | 100.9 | % | ||||||||||
| North America | 1,739 | 1,774 | 737 | (2.0 | )% | 140.7 | % | ||||||||||
| Total Net sales | $ | 3,574 | $ | 3,650 | $ | 1,671 |
Operating expenses are summarized below (in millions, except percentages):
| Year Ended December 31, | Percent Change 2016 vs 2015 | Percent Change 2015 vs 2014 | |||||||||||||||
| 2016 | 2015 | 2014(1) | |||||||||||||||
| Selling and marketing | $ | 444 | $ | 494 | $ | 213 | (10.1 | )% | 131.6 | % | |||||||
| Research and development | 376 | 394 | 151 | (4.6 | )% | 160.7 | % | ||||||||||
| General and administrative | 307 | 283 | 138 | 8.5 | % | 104.8 | % | ||||||||||
| Amortization of intangible assets | 229 | 251 | 54 | (8.8 | )% | 364.0 | % | ||||||||||
| Acquisition and integration costs | 125 | 145 | 127 | (13.8 | )% | 14.4 | % | ||||||||||
| Impairment of goodwill and other intangibles | 62 | — | — | NMF | — | % | |||||||||||
| Exit and restructuring costs | 19 | 40 | 6 | (52.5 | )% | 565.9 | % | ||||||||||
| Total Operating expenses | $ | 1,562 | $ | 1,607 | $ | 689 | (2.8 | )% | 133.2 | % |
The Company’s non-operating income and expense items are summarized in the following tables (in millions, except percentages):
| Year Ended December 31, | Percent Change 2016 vs 2015 | Percent Change 2015 vs 2014 | |||||||||||||||
| 2016 | 2015 | 2014(1) | |||||||||||||||
| Foreign exchange loss | $ | (5 | ) | $ | (23 | ) | $ | (9 | ) | (78.3 | )% | 162.6 | % | ||||
| Interest expense | (193 | ) | (193 | ) | (62 | ) | — | % | 211.3 | % | |||||||
| Other, net | (11 | ) | (1 | ) | (1 | ) | 1,000.0 | % | — | % | |||||||
| Total Other (expenses) income | $ | (209 | ) | $ | (217 | ) | $ | (72 | ) | (3.7 | )% | 201.6 | % |
(1) The businesses included in our Enterprise segment were acquired as part of the Acquisition. The consolidated results for the year ended December 31, 2014 include only two months (November and December 2014) of the Enterprise segment. The increase in net sales, gross profit, operating expenses and operating income, for the year ended December 31, 2014 was primarily related to the Acquisition.
2016 compared to 2015
Net sales decreased by $76 million or 2.1% compared with the prior year period. The decline in net sales is due to lower hardware sales in North America, EMEA, and Latin America, including the unfavorable impact of foreign currency changes, partially offset by higher hardware sales in Asia-Pacific. The decline in hardware sales is largely attributable to lower sales of barcode printer, data capture, wireless LAN products, and location solutions. On a constant currency basis and excluding purchase accounting adjustments, overall net sales declined approximately 1% compared to the prior year period, reflecting growth of approximately 4% in Asia-Pacific, offset by declines of approximately 2%, 1%, and 3% in North America, EMEA, and Latin America, respectively.
Gross margin as a percent of sales was 45.9% compared to the prior year period of 45.0%. This improvement in gross margin reflects an increase in the Enterprise segment gross margin primarily due to lower services and hardware product costs. Legacy Zebra segment gross margin decreased primarily due to lower sales demand and the impact of incentive programs, including the concessions to distributors of printer products imported into China, partially offset by product cost improvements.
Operating expenses for the year ended December 31, 2016 and 2015, were $1.6 billion, or 43.7% and 44.0% of net sales, respectively. The reduction in operating expenses as a percentage of net sales reflects the Company’s continued focus on improving operating efficiency and controlling expenses. Selling and marketing expenses were lower compared to the prior year due to the full-year impact of staff reductions implemented in 2015 and lower discretionary expenses and promotional spending. The decrease in research and development costs was primarily due to a reduction in headcount and other third-party resources, the impact from the divestiture of the wireless LAN business, and shifting of headcount to lower cost engineering locations. The increase in general and administrative costs was primarily due to higher IT related expenses, including increased support and maintenance costs for IT infrastructure and business systems as we exit transition services agreements with Motorola Solutions, and increased legal fees and litigation related expenses. The decrease in amortization of intangibles was due to impairment charges taken in the current year along with other intangible assets becoming fully amortized. Impairment of goodwill and other intangibles of $62 million was recorded during the third quarter related to the wireless LAN business divestiture. The Company has made significant progress on its integration activities associated with the Acquisition, including exiting many transition services agreements with Motorola Solutions. This has resulted in a decline in acquisition and integration costs compared to the prior year period. Exit and restructuring costs were lower due to a reduced level of restructuring activity as the Company progresses with its restructuring plan related to the Acquisition, partially offset by expenses associated with the Company’s divestiture of its wireless LAN business.
Operating income increased $43 million or 116.2% compared to the prior year. The increase was primarily due to the decline in operating expenses.
The Company conducts business in multiple currencies throughout the world, thus has exposure to movements in foreign exchange rates with regard to non-functional denominated revenue, cash assets, and cash liabilities. As a result of these exposures, the Company recognized a foreign exchange loss of $5 million for 2016.
Interest expense was $193 million for the year ended December 31, 2016, flat compared to the prior year. Early repayments of debt resulted in accelerated amortization costs while debt refinancing savings were offset by closing costs of the refinancing.
Other non-operating expenses increased $10 million to $11 million for the year ended December 31, 2016. This increase is driven by long-term investment impairments of $7 million and an increase in accelerated loan discount amortization of $3 million due to the debt refinancing. See Note 9 Long-Term Debt for further information on the debt refinancing amendments.
In the period ending December 31, 2016, the Company recognized tax expense of $8 million compared to a tax benefit of $22 million for 2015. The Company’s effective tax rates were (6.2)% and 12.2% as of December 31, 2016 and December 31, 2015, respectively. The Company’s effective tax rate was lower than the federal statutory rate of 35% primarily due to deferred income taxed on the outbound transfer of U.S. assets, pre-tax losses in the United States, and the rate differential between U.S. and foreign jurisdictions.
2015 compared to 2014
Net sales growth of 118.3% for the twelve months ended December 31, 2015 as compared to the prior year was primarily as a result of the Acquisition of the Enterprise business and higher North America sales, offset partially by $149 million of unfavorable foreign currency effects, net of hedges. The Enterprise business contributed $1,888 million or 95.4% of the increase in total net sales, increased gross profit by $808 million or 93.4%, and increased recurring operating expenses by $830 million or 95.9%, and non-recurring operating expenses by $42 million or 81.3%. Included within the total recurring operating expenses was an increase of $197 million of amortization expense as a result of intangibles acquired. Within non-recurring operating expenses were increases of $18 million of integration and acquisition costs as a result of IT costs of transitioning and exiting the Motorola platforms and $34 million of exit and restructuring costs as a result of integrating acquired facilities and related employees.
Included in the total Enterprise impacts of 2015 versus 2014 are the following purchase accounting adjustments: a $10 million reduction in revenue related to the valuation of service contracts acquired, a $25 million decrease to cost of sales related to a step up in value of inventory acquired, and a $167 million increase in depreciation and amortization expenses.
Net sales, excluding the impact of the Acquisition of the Enterprise business, increased by $91 million or 7.7% in 2015 versus 2014. The unfavorable impact of foreign currency reduced sales by $70 million. This increase is primarily due to sales growth in the North America and Asia-Pacific regions, specifically higher volumes of barcode printers and location solutions. Latin America sales were lower driven by a weak macro-economic environment. Consolidated net sales, excluding the effect of the Enterprise business, grew 12.5%, on a constant currency basis.
Gross margin as a percent of sales, excluding the effect of the Enterprise business, was 50.9% for the year ended December 31, 2015 compared to 50.0% in the comparable year ended December 31, 2014. This increase in margins reflects the favorable impact of higher unit sales within the North America and Asia-Pacific regions and lower product costs for both hardware and supplies, offset partially by unfavorable foreign currency effects, net of hedges.
Operating expenses for the year ended December 31, 2015, excluding the effect of the Enterprise business, were $415 million compared to $370 million in the prior year. Included in the increase were exit and restructuring costs within Legacy Zebra of $10 million related to organizational redesign. As a percentage of sales, operating expenses, excluding the Enterprise business, were 32.3% for the year ended December 31, 2015 compared to 31.0% for the year ended December 31, 2014 primarily due to additional investments made to support business growth in the sales, research and development, and administrative functions, and exit and restructuring costs.
Operating income for the year ended December 31, 2015, excluding the effect of the Enterprise business, increased $12 million or 5.2% compared to the prior year. The increase is primarily due to higher sales and gross profit, partially offset by higher operating expenses and the unfavorable foreign currency effects, net of hedges.
The Company recognized a foreign exchange loss of $23 million for 2015 as a result of changes in the value of non-US dollar assets and liabilities primarily related to the Enterprise business that were not hedged during the period.
Interest expense was $194 million for the year ended December 31, 2015 compared to $63 million for 2014 mainly reflecting the indebtedness incurred related to the Acquisition of $3.2 billion borrowed in October of 2014. There was also $4 million of forward interest rate swap gains in 2015 included in interest expense compared to a $5 million loss in 2014 primarily due to the changes in market interest rates.
In 2015, the Company recognized a tax benefit of $22 million compared to a tax benefit of $15 million for 2014. The Company’s effective tax rates were 12.2% and (95.0)% as of December 31, 2015 and December 31, 2014, respectively. The Company’s effective tax rate was lower than the federal statutory rate of 35% primarily due to pre-tax losses in the United States and corporate structure realignment initiatives in various non-US jurisdictions.
Since the date of the Acquisition, as part of its corporate initiatives of integrating the Enterprise business, the Company has been executing its integration plan for the Enterprise business (the “Integration Plan”). The Company anticipates completing the Integration Plan as soon as practicable and expects that the Integration Plan will allow the combined businesses to achieve further synergies and cost savings associated with the Acquisition. As part of the Integration Plan, the Company began realigning certain acquired assets of the Enterprise business with and into the Company’s corporate structure and business model.
Results of Operations by Segment
The following commentary should be read in conjunction with the financial results of each operating business segment as detailed in Note 16 Segment Information and Geographic Data in the Notes to the Consolidated Financial Statements included in this Form 10-K. The segment results exclude purchase accounting adjustments, amortization of intangible assets, acquisition and integration costs, impairment of goodwill and intangibles, and exit and restructuring costs.
Legacy Zebra Segment
(amounts in millions, except percentages)
| Year Ended December 31, | Percent Change 2016 vs 2015 | Percent Change 2015 vs 2014 | |||||||||||||||
| 2016 | 2015 | 2014 | |||||||||||||||
| Net sales | $ | 1,247 | $ | 1,286 | $ | 1,195 | (3.0 | )% | 7.7 | % | |||||||
| Gross profit | 620 | 654 | 598 | (5.2 | )% | 9.4 | % | ||||||||||
| Operating expenses | 380 | 396 | 360 | (3.9 | )% | 10.0 | % | ||||||||||
| Operating income | $ | 240 | $ | 258 | $ | 238 | (7.0 | )% | 8.4 | % | |||||||
| Gross margin | 49.7 | % | 50.9 | % | 50.0 | % |
2016 compared to 2015
Net sales for the period ending December 31, 2016 within Legacy Zebra decreased $39 million or 3.0% compared to prior year period. The decline in net sales was primarily due to lower net sales of barcode printers and location solutions, and the unfavorable impact of foreign currency changes, most notably in EMEA which was partially offset by an increase in sales of supplies. The barcode printer sales decline was primarily due to lower sales in North America and EMEA. Legacy Zebra sales declined compared to the prior year period on a constant currency basis by approximately 1%.
Gross margin as a percentage of sales was 49.7% compared to 50.9% for comparable prior year period. The decrease in gross margin included impacts from lower sales of barcode printers, the impact of incentive programs, including the concession to distributors of printer products imported into China, costs associated with the relocation of North American distribution operations, and the unfavorable impact of foreign currency changes. These factors were partially offset by manufacturing cost improvements in supplies and lower hardware product costs.
Operating income declined 7.0% as a result of lower net sales and gross margin, partially offset by lower operating expenses.
2015 compared to 2014
Net sales for 2015 increased $91 million or 7.7% compared to 2014. Net sales growth compared to 2014 on a constant currency basis was $149 million or 12.5%. This reflects higher net sales for the North America and Asia-Pacific regions. Net sales in EMEA were essentially unchanged while Latin America net sales were lower. On a constant currency basis, net sales in EMEA increased 14% compared to 2014. The increase in net sales for the North America region was primarily due to higher volume of sales related to barcode printers and location solutions. The higher level of net sales for EMEA and Asia-Pacific regions reflected increased volumes of barcode printers. The decrease in net sales in the Latin America region was primarily driven by a weak macro-economic environment.
Gross margin as a percentage of sales was 50.9% for the year ended December 31, 2015 compared to 50.0% for 2014. This increase in margin reflects the favorable impact of higher unit sales and lower product costs for both hardware and supplies, offset partially by unfavorable foreign currency effects, net of hedges.
Operating income for the year ended December 31, 2015, increased 8.4% as a result of higher sales and gross profit partially offset by increases in operating expenses and unfavorable foreign currency effects, net of hedges. Operating expenses increased compared to the prior year primarily to support business growth.
Enterprise Segment (amounts in millions, except percentages)
| Year Ended December 31, | Percent Change 2016 vs 2015 | Percent Change 2015 vs 2014 | |||||||||||||||
| 2016 | 2015 | 2014(1) | |||||||||||||||
| Net sales | $ | 2,337 | $ | 2,380 | $ | 482 | (1.8 | )% | 393.6 | % | |||||||
| Gross profit | 1,032 | 1,010 | 215 | 2.2 | % | 370.3 | % | ||||||||||
| Operating expenses | 746 | 774 | 150 | (3.6 | )% | 416.7 | % | ||||||||||
| Operating income | $ | 286 | $ | 236 | $ | 65 | 21.2 | % | 263.1 | % | |||||||
| Gross margin | 44.2 | % | 42.4 | % | 44.5 | % | |||||||||||
| (1) The businesses included in our Enterprise segment were acquired as part of the Acquisition. The Enterprise segment’s results, including the increases in net sales, gross profit, operating expenses and operating income, for the year ended December 31, 2014 was primarily related to the Acquisition. Accordingly, the results for this segment for the year ended December 31, 2014 include only two months (November and December 2014). |
2016 compared to 2015
Net sales for the period ending December 31, 2016 within Enterprise decreased $43 million or 1.8% compared to prior year period. The decline in net sales was primarily driven by lower sales of wireless LAN and data capture products and the unfavorable impact of foreign currency changes in EMEA, partially offset by higher sales of mobile computing products. The sales decline compared to the prior year period on a constant currency basis was approximately 1%.
Gross profit margin for the year ended December 31, 2016 was 44.2% compared to 42.4% in the prior year period. The improvement in gross margin was due primarily to lower service and hardware product costs, including lower excess and obsolescence expense. The prior year costs also included higher product rebranding expenses. This improvement was partially offset by product mix and the unfavorable impact of foreign currency changes.
Operating income increased 21.2% primarily as a result of improvement in gross margin and lower operating expenses, partially offset by lower sales.
2015 compared to 2014
On October 27, 2014, the Company acquired Enterprise, an industry leader in mobile computing and data capture technologies and services, therefore 2014 only includes results since the acquisition date and is not directly comparable to the full fiscal year 2015.
For the year ended December 31, 2015, net sales for Enterprise were $2.4 billion compared to $482 million in 2014, which includes net sales only for the period following the Acquisition. Mobile computing, data capture, and repair services generated the majority of Enterprise net sales for the year in 2015 and 2014. The regions which accounted for the majority of 2015 and 2014 Enterprise net sales included North America and EMEA. Sales in the fourth quarter were $635 million, up 4.8% compared to the third quarter due to higher net sales in EMEA.
Gross profit margin for the year ended December 31, 2015 was 42.4% compared to 44.5% in the prior year period. Gross margin of 44.5% in 2014 reflects only the period following the Acquisition on October 27, 2014. Gross margin in the fourth quarter was 42.4%, comparable to the third quarter of 2015, reflecting higher gross margin in services offset by unfavorable foreign currency effects.
Enterprise’s operating expenses for the year ended December 31, 2015 were $774 million and operating income was $236 million. Operating expenses in the fourth quarter were flat compared to third quarter; however, the fourth quarter was 30.8% of sales compared to 31.9% in the third quarter of 2015 due to the improved operating leverage.
Critical Accounting Policies and Estimates
Management prepared the consolidated financial statements of the Company under accounting principles generally accepted in the United States of America. These principles require the use of estimates, judgments, and assumptions. We believe that the estimates, judgments, and assumptions we used are reasonable based upon the information available at that time.
Our estimates and assumptions affect the reported amounts in our consolidated financial statements. See Note 2 Summary of Significant Accounting Policies in the Notes to Consolidated Financial Statements included in this Form 10-K.
Recently Issued Accounting Pronouncements
See Note 2 Summary of Significant Accounting Policies in the Notes to Consolidated Financial Statements included in this Form 10-K.
Liquidity and Capital Resources
The primary factors that influence our liquidity include, but are not limited to, the amount and timing of our revenues, cash collections from our customers, capital expenditures, repatriation of foreign cash and investments, and acquisitions of third-parties. Management believes that our existing capital resources and funds generated from operations are sufficient to meet anticipated capital requirements and service our indebtedness. The following table summarizes our cash flow activities for the years indicated (in millions):
| Year Ended December 31, | |||||||||||
| 2016 | 2015 | 2014 | |||||||||
| Cash flow (used in) provided by: | |||||||||||
| Operating activities | $ | 372 | $ | 110 | $ | 248 | |||||
| Investing activities | (39 | ) | (148 | ) | (3,111 | ) | |||||
| Financing activities | (376 | ) | (149 | ) | 3,192 | ||||||
| Effect of exchange rates on cash balances | 7 | (15 | ) | 2 | |||||||
| Net (decrease) increase in cash and cash equivalents | $ | (36 | ) | $ | (202 | ) | $ | 331 |
The change in our cash and cash equivalents balance is reflective of the following:
2016 vs. 2015
Cash flows from operations increased $262 million during 2016 to $372 million. This improvement was driven by lower net losses of $21 million, which included significant non-cash drivers of a lower deferred income tax benefit of $98 million and asset impairment for goodwill, intangibles and other assets of $69 million, primarily related to the wireless LAN business divestiture. Additionally, the Company had improved working capital of $85 million during 2016. Working capital improvements consisted primarily of accounts payable increases due to the Company successfully renegotiating longer payment terms with vendors being partially offset by an increase in income tax cash outflows.
Net cash used in investing activities during 2016 included capital expenditures of $77 million compared to $122 million in 2015. The decrease consisted primarily of a reduction in integration and real estate related capital expenditures. This was offset somewhat by the sale of the wireless LAN business resulting in net cash received of $39 million.
Net cash used in financing activities during 2016 consisted primarily of early debt principal repayments of $382 million under the Term Loan compared to early debt principal repayments of $165 million in the comparable prior year period. Resulting from the debt refinancing amendments entered into during fiscal 2016, the Company recognized $102 million of proceeds from the issuance of long-term debt, offset by $102 million in payments of long-term debt within the Consolidated Statements of Cash Flows. Additionally, proceeds received from the exercise of stock options and employee stock purchase plan purchases (“ESPP”) were $11 million this year compared to $17 million in 2015 reflecting decreased option exercises and stock purchase plan purchases. The taxes paid related to the net share settlement of equity awards were $8 million in 2016 compared to $13 million in 2015 reflecting decreased stock exercises.
In connection with the Acquisition in October 2014, we incurred indebtedness totaling $3.25 billion. As of December 31, 2016, we had long-term debt, gross of unamortized discounts and debt issuance costs, totaling $2.7 billion. We did not have any borrowings against our revolving credit facility with $246 million available ($250 million less $4 million of outstanding letters of credit). See Note 9 Long-Term Debt for further details and under Financing activities below.
2015 vs. 2014
Cash flows from operations decreased $138 million during 2015 to $110 million. While an increase in net loss of $190 million netted against an increase in non-cash operating items of $161 million yielded a decrease in cash flow from operations of $29 million, the overall decrease in cash provided by operating activities is primarily attributable to changes in certain assets and liabilities of $109 million during 2015. These changes consisted primarily of a decrease in accounts payable and accrued liabilities of $252 million offset by a $72 million increase in accounts receivable and a $52 million increase in income taxes payable.
Net cash used in investing activities during 2015 included additional consideration of $51 million paid to MSI in relation to the opening cash balance and working capital adjustments. In addition, there were capital expenditures of $122 million in 2015 compared to $39 million in 2014. The increase in capital expenditures in 2015 as compared to 2014 consisted primarily of investments in IT infrastructure, software applications, facilities, engineering, development, test equipment, and production and tooling equipment. Reflecting the effect of the Acquisition on the Company’s capital structure, net cash used for investing activities during 2014 included $3.4 billion paid to MSI and purchases of marketable securities of $651 million offset by $644 million and $336 million of proceeds from the sale and maturity of investments in marketable securities, respectively.
Net cash used in financing activities during 2015 consisted primarily of principal repayments of $165 million under the Term Loan compared to proceeds of $3.2 billion from the issuance of long-term debt to fund the Acquisition during 2014. Additionally, proceeds received from the exercise of stock options and employee stock purchase plan purchases (“ESPP”) were $17 million this year compared to $26 million in 2014 reflecting decreased option exercises and ESPP purchases. The taxes paid related to the net share settlement of equity awards were $13 million in 2015 compared to $5 million in 2014 reflecting increased restricted stock exercises.
The following table shows our level of indebtedness as of December 31, 2016 (in millions):
| Senior Notes | $ | 1,050 | |
| Term loan | 1,653 | ||
| Less: debt issuance costs | (22 | ) | |
| Less: unamortized discounts | (33 | ) | |
| Total outstanding debt | $ | 2,648 |
Private Offering
On October 15, 2014, the Company completed a private offering of $1.05 billion in 7.25% Senior Notes due October 15, 2022. Interest on the Senior Notes is payable in cash on April 15 and October 15 of each year.
The indenture covering the Senior Notes contains certain covenants limiting among other things the ability of the Company and its restricted subsidiaries, with certain exceptions as described in the indenture, to; (i) incur indebtedness or issue certain preferred stock; (ii) incur liens; (iii) pay dividends or make distributions in respect of capital stock; (iv) purchase or redeem capital stock; (v) make investments or certain other restricted payments; (vi) sell assets; (vii) issue or sell stock of restricted subsidiaries; (viii) enter into transactions with stockholders or affiliates; or (ix) effect a consolidation or merger. On December 31, 2016, the Company was in compliance with the covenants.
Credit Facilities
On October 27, 2014, the Company entered into a new credit agreement which provides for a term loan of $2.2 billion (“Term Loan”) and a revolving credit facility of $250 million (“Revolving Credit Facility”). On June 2, 2016, the Company entered into the first amendment to the credit agreement (the “Refinancing Amendment 1”). The Refinancing Amendment lowered the index rate spread for LIBOR loans from LIBOR + 400 bp to LIBOR + 325 bp. During the second quarter of 2016, the Company recorded a one-time $2.7 million expense, primarily related to costs incurred with third parties for arranger, legal and other services and the loss incurred on the extinguished debt. These expenses are reflected as non-operating expenses within the consolidated statement of operations. Additionally, the Company paid $4.9 million to the creditors in exchange for the modification and reported it as debt discount which is being amortizing over the life of the modified debt using the interest method. Borrowings under the modified Term Loan bear interest at a variable rate subject to a floor of 4.00%.
On December 6, 2016, the Company entered into the second amendment to our existing credit agreement dated as of October 27, 2014 (the “Refinancing Amendment 2”). The Refinancing Amendment lowered the index rate spread for LIBOR loans from LIBOR + 325 bp to LIBOR + 250 bp. As a result of the December 6, 2016 refinancing transaction, the Company recorded a one-time $1.7 million expense, primarily related to costs incurred with third parties for arranger, legal and other services and the loss incurred on the modified debt. The Company had no costs due to creditors associated with fees for the modification.
As of December 31, 2016, the Term Loan interest rate was 3.45%. Interest payments are payable quarterly. The Company has entered into interest rate swaps to manage interest rate risk on its long-term debt. See Note 8 Derivative Instruments for further details.
The credit agreement requires the Company to prepay the Term Loan and Revolving Credit Facility, under certain circumstances or transactions defined in the credit agreement. Also, the Company may voluntarily prepay its obligations under the Term Loan at any time in whole or in part, without premium or penalty. The Company has made such optional principal prepayments of $382 million in 2016. Through February 2017, the Company made an additional optional principal prepayment
of $20 million. Unless satisfied by further optional prepayments, the Company is required to make a scheduled principal payment of $1.6 billion on October 27, 2021.
The Revolving Credit Facility is available for working capital and other general corporate purposes including letters of credit. The amount (including letters of credit) shall not exceed $250 million. As of December 31, 2016, the Company had established letters of credit totaling $4 million, which reduced funds available for other borrowings under the agreement to $246 million. The Revolving Credit Facility will mature and the commitments thereunder will terminate on October 27, 2019.
Borrowings under the Revolving Credit Facility bear interest at a variable rate plus an applicable margin. The applicable margin for borrowings under the Revolving Credit Facility ranges from 2.25% to 2.75% depending on the Company’s consolidated total secured net leverage ratio, which is evaluated on a quarterly basis. Interest payments are payable quarterly. As of December 31, 2016, the Company did not have any borrowings outstanding against the Revolving Credit Facility.
The Revolving Credit Facility contains certain covenants limiting among other things, the ability of the Company and its restricted subsidiaries, with certain exceptions as described in the credit agreement, to: (i) incur indebtedness, make guarantees or issue certain equity securities; (ii) pay dividends on its capital stock or redeem, repurchase or retire its capital stock; (iii) make certain investments, loans and acquisitions; (iv) sell certain assets or issue capital stock of restricted subsidiaries; (v) create liens or engage in sale-leaseback transactions; (vi) merge, consolidate or transfer or dispose of substantially all of their assets; (vii) engage in certain transactions with affiliates; (viii) alter the business it conducts; (ix) amend, prepay, redeem or purchase subordinated debt; and (x) enter into agreements limiting subsidiary dividends and distributions. The Revolving Credit Facility also requires the Company to comply with a financial covenant consisting of a quarterly maximum consolidated Total Secured Net Leverage Ratio, (as defined in the credit agreement). This test is only required to be performed at the end of the fiscal quarter and when 20% of the commitments under the Revolving Credit Facility have been drawn and remain outstanding.
The Term Loan and obligations under the Revolving Credit Facility are collateralized by a security interest in substantially all of the Company’s assets as defined in the security agreement and guaranteed by its direct and indirect wholly-owned existing and future domestic restricted subsidiaries, subject to certain exceptions.
Certain domestic subsidiaries of the Company (the “Guarantor Subsidiaries”) guarantee the Notes, the Term Loan and the Revolving Credit Facility on a senior basis: For the year ended December 31, 2016, the non-Guarantor Subsidiaries would have (a) accounted for 45% of our total revenue and (b) held 24% or $1 billion of our total assets and approximately 12% or $0.4 billion of our total liabilities including trade payables but excluding intercompany liabilities.
On December 31, 2016, the Company was in compliance with all covenants.
Historically, significant portions of our cash inflows were generated by our operations. We currently expect this trend to continue throughout 2017. We believe that our existing cash and investments, borrowings available under our Revolving Credit Facility, together with cash flows expected from operations will be sufficient to meet expected operating, capital expenditure and debt obligation requirements for the next 12 months.
As of December 31, 2016, the Company’s cash position of $156 million included foreign cash and investments of $98 million.
Management believes that existing capital resources and funds generated from operations are sufficient to finance anticipated capital requirements.
Contractual Obligations
Zebra’s contractual obligations as of December 31, 2016 were (in millions):
| Payments due by period | |||||||||||||||||||
| Total | Less than 1 year | 1-3 years | 3-5 years | More than 5 years | |||||||||||||||
| Operating lease obligations | $ | 140 | $ | 30 | $ | 46 | $ | 26 | $ | 38 | |||||||||
| Deferred compensation liability | 11 | — | — | — | 11 | ||||||||||||||
| Long-term debt – principal payments | 2,703 | — | — | 1,653 | 1,050 | ||||||||||||||
| Interest payments | 752 | 135 | 270 | 270 | 77 | ||||||||||||||
| Interest on interest rate swaps | 45 | 11 | 22 | 12 | — | ||||||||||||||
| Purchase obligations | 318 | 318 | — | — | — | ||||||||||||||
| Total | $ | 3,969 | $ | 494 | $ | 338 | $ | 1,961 | $ | 1,176 |
Purchase obligations are for purchases made in the normal course of business to meet operational requirements, primarily raw materials and finished goods.
Uncertain tax position liabilities of $42 million have been excluded from the above table as we cannot make a reasonably reliable estimate of the period of cash settlement with the respective taxing authority.
The Company anticipates that it is reasonably possible that $5 million of unrecognized tax benefits may reverse in 2017, due to settlements with the tax authorities. The Company is currently undergoing audits of the 2013 through 2015 US federal income tax returns. The Company is engaged in an inquiry from the UK HM Revenue and Customs for the years 2012 and 2014. The tax years 2011 through 2016 remain open to examination by multiple foreign and U.S. state taxing jurisdictions. Due to uncertainties in any tax audit outcome, the Company’s estimates of the ultimate settlement of uncertain tax positions may change and the actual tax benefits may differ significantly from the estimates. The Company continues to review these positions.
Item 7A. Quantitative and Qualitative Disclosures About Market Risk
Market risk is the sensitivity of income to changes in interest rates, commodity prices, and foreign currency changes. Zebra is exposed to the following types of market risk: interest rates and foreign currency.
Interest Rate Risk
Historically, we mitigated interest rate risk on marketable security investments with an investment policy and use of outside professional investment managers; our objective was to achieve stable and predictable targeted rates of return and to provide the liquidity necessary for the operations of our business.
In connection with the acquisition of Enterprise, Zebra incurred significant debt, including variable rate debt (subject to interest rate caps). As of December 31, 2016, we had $1.7 billion of debt outstanding under our Term Loan, which bears interest determined by reference to a variable rate index. A one percentage point increase or decrease in interest rates on the various debt instruments we hold would increase or decrease the annual interest expense we recognize and the cash we pay for interest expense by approximately $17 million. This amount excludes the impact of any associated derivative contracts. To mitigate this risk, we entered into forward interest rate swaps to hedge the interest rate risk associated with the variable interest payments on our Term Loan that was used to fund the acquisition of Enterprise. Refer to Note 8 Derivative Instruments in the Notes to Consolidated Financial Statements included in this Form 10-K for further discussions of hedging activities.
Foreign Exchange Risk
We provide products and services in over 170 countries throughout the world and, therefore, at times are exposed to risk based on movements in foreign exchange rates. On occasion, we invoice customers in their local currency and have a resulting foreign currency denominated revenue transaction and accounts receivable. We also purchase certain raw materials and other items in foreign currencies. We manage these risks using derivative financial instruments. See Note 8 Derivative Instruments for further discussions of hedging activities.
The following table sets forth the impact of a hypothetical ten percent (plus or minus) movement in the dollar/pound, dollar/euro, euro/pound, dollar/Czech koruna, dollar/Brazilian real, dollar/Canadian dollar, dollar/Malaysian ringgit, dollar/Australian dollar, and dollar/Singapore dollar rates measured as if Zebra did not engage in the selective hedging practices described above. The risk is increased through additional exposure as it relates to the euro, pound, Czech koruna, Brazilian real, Canadian dollar, Malaysian ringgit, Australian dollar, and Singapore dollar denominated assets and liabilities.
(in millions, except per share data)
| December 31, | |||||||
| Foreign exchange | 2016 | 2015 | |||||
| Dollar/Pound | |||||||
| Effect on Pretax Income | $ | — | $ | 1 | |||
| Effect on Diluted EPS (after tax) | — | 0.01 | |||||
| Dollar/Euro | |||||||
| Effect on Pretax Income | $ | 19 | $ | 13 | |||
| Effect on Diluted EPS (after tax) | 0.24 | 0.16 | |||||
| Euro/Pound | |||||||
| Effect on Pretax Income | $ | 1 | $ | 1 | |||
| Effect on Diluted EPS (after tax) | 0.01 | 0.02 | |||||
| Dollar/Czech Koruna | |||||||
| Effect on Pretax Income | $ | 1 | $ | 1 | |||
| Effect on Diluted EPS (after tax) | 0.01 | 0.01 | |||||
| Dollar/Brazilian Real | |||||||
| Effect on Pretax Income | $ | 1 | $ | 1 | |||
| Effect on Diluted EPS (after tax) | 0.01 | 0.01 | |||||
| Dollar/Canadian dollar | |||||||
| Effect on Pretax Income | $ | — | $ | 1 | |||
| Effect on Diluted EPS (after tax) | — | 0.01 | |||||
| Dollar/Malaysian Ringgit | |||||||
| Effect on Pretax Income | $ | 1 | $ | — | |||
| Effect on Diluted EPS (after tax) | 0.01 | — | |||||
| Dollar/Australian Dollar | |||||||
| Effect on Pretax Income | $ | 1 | $ | — | |||
| Effect on Diluted EPS (after tax) | 0.01 | — | |||||
| Dollar/Singapore Dollar | |||||||
| Effect on Pretax Income | $ | 1 | $ | — | |||
| Effect on Diluted EPS (after tax) | 0.01 | — |
Item 8. Financial Statements and Supplementary Data
The financial statements and schedules of Zebra are annexed to this report as pages F-2 through F-36. An index to such materials appears on page F-1.
Item 9. Changes in and Disagreements with Accountants on Accounting and Financial Disclosures
Not applicable.
Item 9A. Controls and Procedures
Evaluation of Disclosure Controls and Procedures
We conducted an evaluation of the effectiveness of the design and operation of our disclosure controls and procedures (as defined in Rules 13a-15(e) and 15d-15(e) under the Securities Exchange Act of 1934 (the “Exchange Act”)) as of the end of the period covered by this Form 10-K. The evaluation was conducted under the supervision of our Disclosure Committee, and with the participation of management, including our Chief Executive Officer and Chief Financial Officer. Based on that evaluation, our Chief Executive Officer and Chief Financial Officer have concluded that our disclosure controls and procedures were effective to provide reasonable assurance that (i) the information required to be disclosed by us in this Form 10-K was recorded, processed, summarized and reported within the time periods specified in the SEC’s rules and forms, and (ii) information required to be disclosed by us in our reports that we file or furnish under the Exchange Act is accumulated and communicated to our management, including our principal executive and principal financial officers, or persons performing similar functions, as appropriate to allow timely decisions regarding required disclosure.
Management’s Report on Internal Control over Financial Reporting
Our management is responsible for establishing and maintaining adequate internal control over financial reporting as defined in Rules 13a-15(f) and 15d-15(f) under the Exchange Act to provide reasonable assurance regarding the reliability of our financial reporting and the preparation of financial statements for external purposes in accordance with generally accepted accounting principles. Our management assessed the effectiveness of our internal control over financial reporting as of December 31, 2016. In making this assessment, our management used the criteria set forth by the Committee of Sponsoring Organizations of the Treadway Commission in Internal Control-Integrated Framework as released in 2013. Based on this assessment and those criteria, our management believes that, as of December 31, 2016, our internal control over financial reporting is effective.
Changes in Internal Control over Financial Reporting
In the first quarter of 2015, the Company identified a material weakness related to the process to prepare and review its quarterly and annual income tax provision as a result of the increased complexity in the legal entity structure of the business following the Enterprise acquisition. A material weakness is a deficiency, or combination of deficiencies, in the internal control over financial reporting such that there is a reasonable possibility that a material misstatement of the Company’s annual or interim financial statements will not be prevented or detected on a timely basis. The impact of this material weakness contributed to the restatement of our consolidated financial statements for the year-ended December 31, 2015, the three-months ended April 2016, and the three and six months ended July 2, 2016.With the identification of the material weakness associated with the preparation and review process of our quarterly and annual tax provision in 2015, we began implementing a remediation plan to address these issues. This plan included the implementation of improved and documented processes and procedures, as well as hiring additional accounting and tax professionals.
During the fourth quarter of 2016, we successfully completed the testing necessary to conclude that the material weakness has been remediated. Our independent registered public accounting firm, Ernst & Young LLP, has issued an attestation report on Zebra’s internal control over financial reporting. Ernst & Young LLP’s report is included on page 40 of this report on Form 10-K.
Except as noted above, there have been no other changes in our internal controls that have materially affected, or are reasonably likely to materially affect, our internal control over financial reporting.
Inherent Limitations on the Effectiveness of Controls
Our management, including our Chief Executive Officer and Chief Financial Officer, does not expect that our disclosure controls and procedures or our internal controls will prevent or detect all errors and all fraud. A control system, no matter how well conceived and operated, can provide only reasonable, not absolute, assurance that the objectives of the control system are met. Further, the design of a control system must reflect the fact that there are resource constraints, and the benefits of controls
must be considered relative to their costs. Because of the inherent limitations in all control systems, no evaluation of controls can provide absolute assurance that misstatements due to error or fraud will not occur or that all control issues and instances of fraud, if any, within Zebra have been prevented or detected. These inherent limitations include the realities that judgments in decision-making can be faulty and that breakdowns can occur because of simple error or mistake. Controls can also be circumvented by the individual acts of some persons, by collusion of two or more people, or by management override of the controls. The design of any system of controls is based in part on certain assumptions about the likelihood of future events, and there can be no assurance that any design will succeed in achieving its stated goals under all potential future conditions. Projections of any evaluation of controls effectiveness to future periods are subject to risks. Over time, controls may become inadequate because of changes in conditions or deterioration in the degree of compliance with policies or procedures.
Report of Independent Registered Public Accounting Firm
The Board of Directors and Stockholders of
Zebra Technologies Corporation:
We have audited Zebra Technologies Corporation and subsidiaries’ (“the Company”) internal control over financial reporting as of December 31, 2016, based on criteria established in Internal Control-Integrated Framework issued by the Committee of Sponsoring Organizations of the Treadway Commission (2013 framework) (the COSO criteria). Zebra Technologies Corporation’s management is responsible for maintaining effective internal control over financial reporting, and for its assessment of the effectiveness of internal control over financial reporting included in the accompanying Management’s Report on Internal Control over Financial Reporting. Our responsibility is to express an opinion on the Company’s internal control over financial reporting based on our audit.
We conducted our audit in accordance with the standards of the Public Company Accounting Oversight Board (United States). Those standards require that we plan and perform the audit to obtain reasonable assurance about whether effective internal control over financial reporting was maintained in all material respects. Our audit included obtaining an understanding of internal control over financial reporting, assessing the risk that a material weakness exists, testing and evaluating the design and operating effectiveness of internal control based on the assessed risk, and performing such other procedures as we considered necessary in the circumstances. We believe that our audit provides a reasonable basis for our opinion.
A company’s internal control over financial reporting is a process designed to provide reasonable assurance regarding the reliability of financial reporting and the preparation of financial statements for external purposes in accordance with generally accepted accounting principles. A company’s internal control over financial reporting includes those policies and procedures that (1) pertain to the maintenance of records that, in reasonable detail, accurately and fairly reflect the transactions and dispositions of the assets of the company; (2) provide reasonable assurance that transactions are recorded as necessary to permit preparation of financial statements in accordance with generally accepted accounting principles, and that receipts and expenditures of the company are being made only in accordance with authorizations of management and directors of the company; and (3) provide reasonable assurance regarding prevention or timely detection of unauthorized acquisition, use, or disposition of the company’s assets that could have a material effect on the financial statements.
Because of its inherent limitations, internal control over financial reporting may not prevent or detect misstatements. Also, projections of any evaluation of effectiveness to future periods are subject to the risk that controls may become inadequate because of changes in conditions, or that the degree of compliance with the policies or procedures may deteriorate.
In our opinion, Zebra Technologies Corporation and subsidiaries maintained, in all material respects, effective internal control over financial reporting as of December 31, 2016, based on the COSO criteria.
We also have audited, in accordance with the standards of the Public Company Accounting Oversight Board (United States), the consolidated balance sheets of Zebra Technologies Corporation and subsidiaries as of December 31, 2016 and 2015, and the related consolidated statements of operations, comprehensive income (loss), stockholders' equity and cash flows for each of the three years in the period ended December 31, 2016, and our report dated February 27, 2017 expressed an unqualified opinion thereon.
/s/Ernst & Young LLP
Chicago, Illinois
February 27, 2017
Item 9B. Other Information
Not applicable.
PART III
Item 10. Directors, Executive Officers and Corporate Governance
We have adopted a Code of Ethics for Senior Financial Officers that applies to Zebra’s Chief Executive Officer, Chief Financial Officer and the Chief Accounting Officer. The Code of Ethics is posted on the Investor Relations – Corporate Governance page of Zebra’s Internet web site, www.zebra.com, and is available for download. Any waiver from the Code of Ethics and any amendment to the Code of Ethics will be disclosed on such page of Zebra’s web site
All other information in response to this item is incorporated by reference from the Proxy Statement sections entitled “Corporate Governance,” “Election of Directors,” “Board and Committees of the Board,” “Executive Officers,” and “Section 16(a) Beneficial Ownership Reporting Compliance.”
Item 11. Executive Compensation
The information in response to this item is incorporated by reference from the Proxy Statement sections entitled “Compensation Discussion and Analysis-Executive Summary,” “Compensation Discussion and Analysis,” “Executive Compensation,” “Director Compensation,” “Compensation Committee Interlocks and Insider Participation” and “Compensation Committee Report.”
Item 12. Security Ownership of Certain Beneficial Owners and Management and Related Stockholder Matters
The information in response to this item is incorporated by reference from the Proxy Statement sections entitled “Ownership of our Common Stock” and “Equity Compensation Plan Information.”
Item 13. Certain Relationships and Related Transactions, and Director Independence
The information in response to this item is incorporated by reference from the Proxy Statement section entitled “Corporate Governance.”
Item 14. Principal Accounting Fees and Services
The information in response to this item is incorporated by reference from the Proxy Statement section entitled “Fees of Independent Auditors.”
PART IV
Item 15. Exhibits, Financial Statement Schedules
The financial statements and schedule filed as part of this report are listed in the accompanying Index to Financial Statements and Schedule. The exhibits filed as a part of this report are listed in the accompanying Index to Exhibits.
SIGNATURES
Pursuant to the requirements of Section 13 or 15(d) of the Securities Exchange Act of 1934, the Registrant has duly caused this report to be signed on its behalf by the undersigned, there unto duly authorized, on the 27th day of February 2017.
| ZEBRA TECHNOLOGIES CORPORATION |
| By: /s/ Anders Gustafsson |
| Anders Gustafsson |
| Chief Executive Officer |
Pursuant to the requirements of the Securities and Exchange Act of 1934, the report has been signed below by the following persons in the capacities and on the dates indicated.
| Signature | Title | Date |
| /s/ Anders Gustafsson Anders Gustafsson | Chief Executive Officer and Director (Principal Executive Officer) | February 27, 2017 |
| /s/ Olivier Leonetti Olivier Leonetti | Chief Financial Officer (Principal Financial Officer) | February 27, 2017 |
| /s/ Colleen O’Sullivan Colleen O’Sullivan | Chief Accounting Officer | February 27, 2017 |
| /s/ Michael A. Smith Michael A. Smith | Director and Chairman of the Board of Directors | February 27, 2017 |
| /s/ Andrew K. Ludwick Andrew K. Ludwick | Director | February 27, 2017 |
| /s/ Ross W. Manire Ross W. Manire | Director | February 27, 2017 |
| /s/ Richard L. Keyser Richard L. Keyser | Director | February 27, 2017 |
| /s/ Janice M. Roberts Janice M. Roberts | Director | February 27, 2017 |
| /s/ Chirantan J. Desai Chirantan J. Desai | Director | February 27, 2017 |
| /s/ Frank B. Modruson Frank B. Modruson | Director | February 27, 2017 |
ZEBRA TECHNOLOGIES CORPORATION AND SUBSIDIARIES
INDEX TO CONSOLIDATED FINANCIAL STATEMENTS AND SCHEDULE
All other financial statement schedules are omitted because they are not applicable or the required information is shown in the consolidated financial statements or related notes.
F-1
Report of Independent Registered Public Accounting Firm
To the Board of Directors and Stockholders of
Zebra Technologies Corporation
We have audited the accompanying consolidated balance sheets of Zebra Technologies Corporation and subsidiaries (“the Company”) as of December 31, 2016 and 2015, and the related consolidated statements of operations, comprehensive income (loss), stockholders’ equity and cash flows for each of the three years in the period ended December 31, 2016. Our audits also included the financial statement schedule listed in Index at Item 15. These financial statements and schedule are the responsibility of the Company’s management. Our responsibility is to express an opinion on these financial statements and schedule based on our audits.
We conducted our audits in accordance with the standards of the Public Company Accounting Oversight Board (United States). Those standards require that we plan and perform the audit to obtain reasonable assurance about whether the financial statements are free of material misstatement. An audit includes examining, on a test basis, evidence supporting the amounts and disclosures in the financial statements. An audit also includes assessing the accounting principles used and significant estimates made by management, as well as evaluating the overall financial statement presentation. We believe that our audits provide a reasonable basis for our opinion.
In our opinion, the financial statements referred to above present fairly, in all material respects, the consolidated financial position of Zebra Technologies Corporation and subsidiaries at December 31, 2016 and 2015, and the consolidated results of its operations and its cash flows for each of the three years in the period ended December 31, 2016, in conformity with U.S. generally accepted accounting principles. Also, in our opinion, the related financial statement schedule, when considered in relation to the basic consolidated financial statements taken as a whole, presents fairly in all material respects the information set forth therein.
We also have audited, in accordance with the standards of the Public Company Accounting Oversight Board (United States), Zebra Technologies Corporation and subsidiaries’ internal control over financial reporting as of December 31, 2016, based on criteria established in Internal Control-Integrated Framework issued by the Committee of Sponsoring Organizations of the Treadway Commission (2013 framework) and our report dated February 27, 2017 expressed an unqualified opinion thereon.
/s/ Ernst & Young LLP
Chicago, Illinois
February 27, 2017
F-2
ZEBRA TECHNOLOGIES CORPORATION AND SUBSIDIARIES
CONSOLIDATED BALANCE SHEETS
(In millions, except share data)
| December 31, | |||||||
| 2016 | 2015 | ||||||
| Assets | |||||||
| Current assets: | |||||||
| Cash and cash equivalents | $ | 156 | $ | 192 | |||
| Accounts receivable, net | 625 | 671 | |||||
| Inventories, net | 345 | 397 | |||||
| Income tax receivable | 32 | 4 | |||||
| Prepaid expenses and other current assets | 64 | 70 | |||||
| Total Current assets | 1,222 | 1,334 | |||||
| Property, plant and equipment, net | 292 | 298 | |||||
| Goodwill | 2,458 | 2,490 | |||||
| Other intangibles, net | 480 | 757 | |||||
| Long-term deferred income taxes | 113 | 70 | |||||
| Other long-term assets | 67 | 91 | |||||
| Total Assets | $ | 4,632 | $ | 5,040 | |||
| Liabilities and Stockholders’ Equity | |||||||
| Current liabilities: | |||||||
| Accounts payable | $ | 413 | $ | 289 | |||
| Accrued liabilities | 323 | 367 | |||||
| Deferred revenue | 191 | 197 | |||||
| Income taxes payable | 22 | 42 | |||||
| Total Current liabilities | 949 | 895 | |||||
| Long-term debt | 2,648 | 3,012 | |||||
| Long-term deferred tax liability | 3 | 1 | |||||
| Long-term deferred revenue | 124 | 124 | |||||
| Other long-term liabilities | 116 | 115 | |||||
| Total Liabilities | 3,840 | 4,147 | |||||
| Stockholders’ Equity: |
Showing the first 8K of 153K characters. Open the full section