 filings.tools
Item 5. Market for Registrant’s Common Equity, Related Stockholder Matters and Issuer Purchases of Equity Securities
4K characters. Original on sec.gov ·
Item 5. Market for Registrant’s Common Equity, Related Stockholder Matters and Issuer Purchases of Equity Securities
Stock Information
Our Class A Common Stock is traded on the NASDAQ Stock Market, LLC under the symbol “ZBRA”.
As of February 4, 2020, the last reported price for the Company’s Class A Common Stock was $247.87 per share, and there were 112 registered stockholders of record for Zebra’s Class A Common Stock.
Dividend Policy
Since our initial public offering in 1991, we have not declared any cash dividends or distributions on our capital stock. We currently do not anticipate paying any cash dividends in the foreseeable future.
Treasury Shares
The following table sets forth information with respect to repurchases of the Company’s common stock for the three months ended December 31, 2019.
| Period | Total Number of Shares Purchased | Average Price Paid per Share | Total Number of Shares Purchased as Part of Publicly Announced Plans or Programs (1) | Approximate Dollar Value of Shares that May Yet Be Purchased Under the Plans or Programs (in millions) (1) | ||||||||||
| September 29, 2019 - October 26, 2019 | 136,824 | $ | 196.15 | 136,824 | $ | 953 | ||||||||
| October 27, 2019 - November 23, 2019 | — | — | — | 953 | ||||||||||
| November 24, 2019 - December 31, 2019 | — | — | — | 953 | ||||||||||
| Total | 136,824 | $ | 196.15 | 136,824 | $ | 953 |
| (1) | On July 30, 2019, the Company announced that its Board of Directors authorized a share repurchase program for up to an aggregate amount of $1 billion of its outstanding shares of common stock. The share repurchase program supersedes the Company’s prior share repurchase program, which was authorized in November 2011 and under which the Company had not repurchased any shares. Repurchases may be effected from time to time through open market purchases, including pursuant to a pre-set trading plan meeting the requirements of Rule 10b5-1(c) of the Securities Exchange Act of 1934. As of December 31, 2019, the remaining amount authorized for repurchases under the program, which does not have a stated expiration date, was approximately $953 million. |
Stock Performance Graph
The following graph compares the cumulative total stockholder return, calculated on a dividend-reinvested basis, in Zebra Technologies Corporation Class A Common Stock, the RDG Technology Composite, and the NASDAQ Composite Market Index for the five years ended December 31, 2019. The comparison assumes that $100 was invested in each of the Company’s Class A Common Stock, the RDG Technology Composite and the NASDAQ Composite Market Index as of the market close on December 31, 2014. Note that historic stock price performance is not necessarily indicative of future stock price performance.
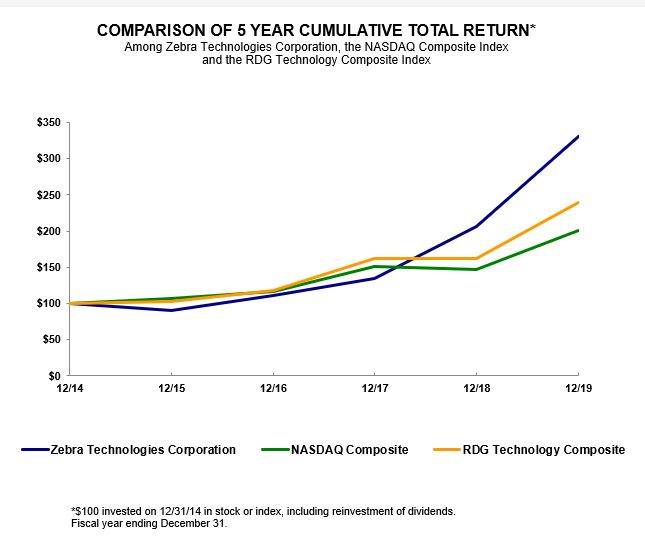
| Value at each year-end of $100 initial investment made on December 31, 2014 | ||||||||||||||||||||||||
| 12/14 | 12/15 | 12/16 | 12/17 | 12/18 | 12/19 | |||||||||||||||||||
| Zebra Technologies Corporation | $ | 100.00 | $ | 89.98 | $ | 110.79 | $ | 134.09 | $ | 205.70 | $ | 329.98 | ||||||||||||
| RDG Technology Composite | $ | 100.00 | $ | 103.42 | $ | 118.01 | $ | 161.58 | $ | 162.31 | $ | 238.96 | ||||||||||||
| NASDAQ Composite | $ | 100.00 | $ | 106.96 | $ | 116.45 | $ | 150.96 | $ | 145.67 | $ | 200.49 |
Previous: Item 4. Mine Safety Disclosures · Next: Item 6. Selected Financial Data