 filings.tools
Item 5. Market for Registrant’s Common Equity, Related Stockholder Matters and Issuer Purchases of Equity Securities.
6K characters. Original on sec.gov · Markdown
Item 5. Market for Registrant’s Common Equity, Related Stockholder Matters and Issuer Purchases of Equity Securities.
Our shares of common stock have been listed on the NYSE (symbol ZTS) since February 1, 2013. Prior to that time, there was no public market for our stock.
As of February 11, 2021, there were 475,166,373 shares of our common stock outstanding, held by 1,748 shareholders of record.
Additional information relating to our common stock is included in this Annual Report on Form 10-K in Notes to Consolidated Financial Statements— Note 16. Stockholders' Equity.
Purchases of Equity Securities by the Issuer
On December 12, 2018, our Board of Directors authorized a multi-year share repurchase program of up to $2.0 billion of our outstanding common stock. As of December 31, 2020, there was approximately $1.4 billion remaining under this authorization. The company temporarily suspended share repurchases beginning in the second quarter of 2020. In January 2021, the company resumed share repurchases under its share repurchase program.
The program does not have a stated expiration date. Purchases of Zoetis shares may be made at the discretion of management, depending on market conditions and business needs. We repurchase shares pursuant to Rules 10b5-1 and 10b-18 under the Securities Exchange Act of 1934, as amended (Exchange Act), through repurchase agreements established with several brokers.
Issuer purchases of equity securities for the three months ended December 31, 2020 were as follows:
| Issuer Purchases of Equity Securities | ||||||||||||||
| Total Number of Shares Purchased(a) | Average Price Paid Per Share | Total Number of Shares Purchased as Part of Publicly Announced Programs(b) | Approximate Dollar Value of Shares that May Yet Be Purchased Under Plans or Programs | |||||||||||
| October 1 - October 31, 2020 | 1,026 | $162.05 | — | $1,424,104,390 | ||||||||||
| November 1 - November 30, 2020 | 617 | $161.86 | — | $1,424,104,390 | ||||||||||
| December 1 - December 31, 2020 | 641 | $161.28 | — | $1,424,104,390 | ||||||||||
| Total | 2,284 | $161.78 | — | $1,424,104,390 |
(a) The company repurchased 2,284 shares during the three-month period ended December 31, 2020, that were not part of the publicly announced share repurchase authorization. These shares were purchased from employees to satisfy tax withholding requirements on the vesting of restricted shares from equity-based awards.
(b) The company temporarily suspended share repurchases beginning in the second quarter of 2020.
Dividend Policy, Declaration and Payment
The declaration and payment of dividends to holders of our common stock will be at the discretion of our Board of Directors in accordance with applicable law after taking into account various factors, including our financial condition, operating results, current and anticipated cash needs, cash flows available in the U.S., impact on our effective tax rate, indebtedness, legal requirements and other factors that our Board of Directors deems relevant. In addition, the instruments governing our indebtedness may limit our ability to pay dividends. Therefore, no assurance is given that we will pay any dividends to our common stockholders or as to the amount of any such dividends if our Board of Directors determines to do so.
Because we are a holding company, our ability to pay cash dividends on our common stock will depend on the receipt of dividends or other distributions from certain of our subsidiaries.
37 |
Stock Performance Graph(a)
The graph below compares the cumulative total shareholder return on an investment in our common stock, the S&P 500 Index and the S&P 500 Pharmaceuticals Index for the five fiscal years beginning with the close of trading on December 31, 2015 and ending December 31, 2020. The shareholder return shown on the graph is not necessarily indicative of future performance, and we do not make or endorse any predictions as to future shareholder returns.
The graph assumes an investment of $100 on December 31, 2015, in our common stock, the S&P 500 Index and the S&P 500 Pharmaceuticals Index and assumes dividends, if any, were reinvested.
COMPARISON OF CUMULATIVE TOTAL RETURN
Among Zoetis Inc., the S&P 500 Index and the S&P 500 Pharmaceuticals Index
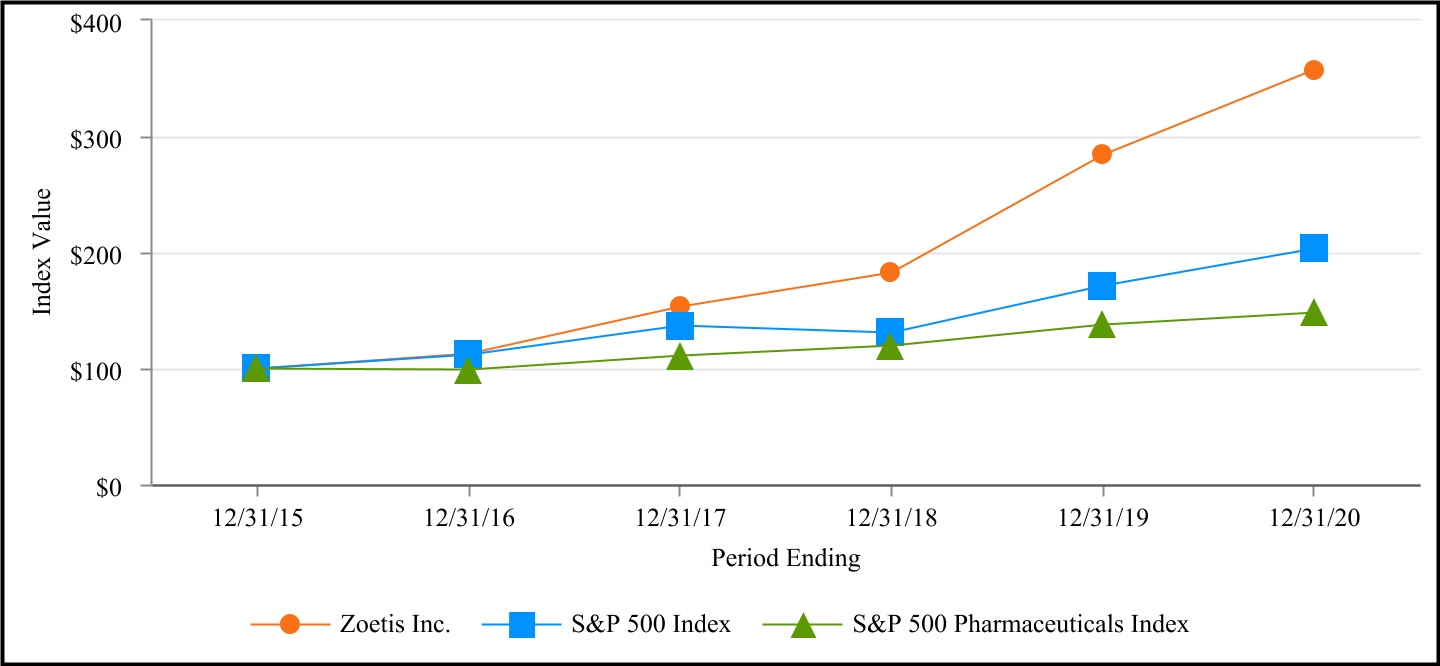
| December 31, 2015 | December 31, 2016 | December 31, 2017 | December 31, 2018 | December 31, 2019 | December 31, 2020 | |||||||||||||||
| Zoetis Inc. | $100 | $112.64 | $152.69 | $182.38 | $283.99 | $357.15 | ||||||||||||||
| S&P 500 Index | $100 | $111.96 | $136.40 | $130.42 | $171.49 | $203.04 | ||||||||||||||
| S&P 500 Pharmaceuticals Index | $100 | $98.44 | $110.81 | $119.78 | $137.85 | $148.23 |
(a) This section is not “soliciting material,” is not deemed “filed” with the SEC and is not to be incorporated by reference in any filing of Zoetis under the Securities Act of 1933, as amended, or the Exchange Act whether made before or after the date hereof and irrespective of any general incorporation language contained in any such filing.
38 |
Previous: Item 4. Mine Safety Disclosures. · Next: Item 7. Management’s Discussion and Analysis of Financial Condition and Results of Operations.