 filings.tools
Item 5. Market for Registrant’s Common Equity, Related Stockholder Matters and Issuer Purchases of Equity Securities
7K characters. Original on sec.gov · Markdown
Item 5. Market for Registrant’s Common Equity, Related Stockholder Matters and Issuer Purchases of Equity Securities
The Company’s common stock is traded on the NASDAQ Stock Market LLC (“NASDAQ”) under the symbol AAPL.
Price Range of Common Stock
The price range per share of common stock presented below represents the highest and lowest intraday sales prices for the Company’s common stock on the NASDAQ during each quarter of the two most recent years.
| Fourth Quarter | Third Quarter | Second Quarter | First Quarter | ||||
| 2016 price range per share | $116.18 - $91.50 | $112.39 - $89.47 | $109.43 - $92.39 | $123.82 - $105.57 | |||
| 2015 price range per share | $132.97 - $92.00 | $134.54 - $123.10 | $133.60 - $104.63 | $119.75 - $95.18 |
Holders
As of October 14, 2016, there were 25,641 shareholders of record.
Dividends
The Company paid a total of $12.0 billion and $11.4 billion in dividends during 2016 and 2015, respectively, and expects to pay quarterly dividends of $0.57 per common share each quarter, subject to declaration by the Board of Directors. The Company also plans to increase its dividend on an annual basis, subject to declaration by the Board of Directors.
Apple Inc. | 2016 Form 10-K | 18
Purchases of Equity Securities by the Issuer and Affiliated Purchasers
Share repurchase activity during the three months ended September 24, 2016 was as follows (in millions, except number of shares, which are reflected in thousands, and per share amounts):
| Periods | Total Number of Shares Purchased | Average Price Paid Per Share | Total Number of Shares Purchased as Part of Publicly Announced Plans or Programs | Approximate Dollar Value of Shares That May Yet Be Purchased Under the Plans or Programs (1) | ||||||||||
| June 26, 2016 to July 30, 2016: | ||||||||||||||
| Open market and privately negotiated purchases | 9,036 | $ | 96.83 | 9,036 | ||||||||||
| July 31, 2016 to August 27, 2016: | ||||||||||||||
| May 2016 ASR | 12,269 | (2) | 12,269 | |||||||||||
| Open market and privately negotiated purchases | 11,919 | $ | 108.11 | 11,919 | ||||||||||
| August 28, 2016 to September 24, 2016: | ||||||||||||||
| August 2016 ASR | 22,468 | (3) | (3) | 22,468 | (3) | |||||||||
| Open market and privately negotiated purchases | 7,624 | $ | 109.71 | 7,624 | ||||||||||
| Total | 63,316 | $ | 42,024 |
| (1) | In April 2016, the Company’s Board of Directors increased the Company's share repurchase program authorization from $140 billion to $175 billion of the Company’s common stock. As of September 24, 2016, $133 billion of the $175 billion had been utilized. The remaining $42 billion in the table represents the amount available to repurchase shares under the authorized repurchase program as of September 24, 2016. The Company’s share repurchase program does not obligate it to acquire any specific number of shares. Under the program, shares may be repurchased in privately negotiated and/or open market transactions, including under plans complying with Rule 10b5-1 under the Exchange Act. |
| (2) | In May 2016, the Company entered into an accelerated share repurchase arrangement ("ASR") to purchase up to $6.0 billion of the Company's common stock. In August 2016, the purchase period for this ASR ended and an additional 12.3 million shares were delivered and retired. In total, 60.5 million shares were delivered under this ASR at an average repurchase price of $99.25. |
| (3) | In August 2016, the Company entered into a new ASR to purchase up to $3.0 billion of the Company’s common stock. In exchange for an up-front payment of $3.0 billion, the financial institution party to the arrangement committed to deliver shares to the Company during the ASR’s purchase period, which will end in or before November 2016. The total number of shares ultimately delivered, and therefore the average price paid per share, will be determined at the end of the applicable purchase period based on the volume weighted-average price of the Company’s common stock during that period. |
Apple Inc. | 2016 Form 10-K | 19
Company Stock Performance
The following graph shows a comparison of cumulative total shareholder return, calculated on a dividend reinvested basis, for the Company, the S&P 500 Index, the S&P Information Technology Index and the Dow Jones U.S. Technology Supersector Index for the five years ended September 24, 2016. The graph assumes $100 was invested in each of the Company’s common stock, the S&P 500 Index, the S&P Information Technology Index and the Dow Jones U.S. Technology Supersector Index as of the market close on September 23, 2011. Note that historic stock price performance is not necessarily indicative of future stock price performance.
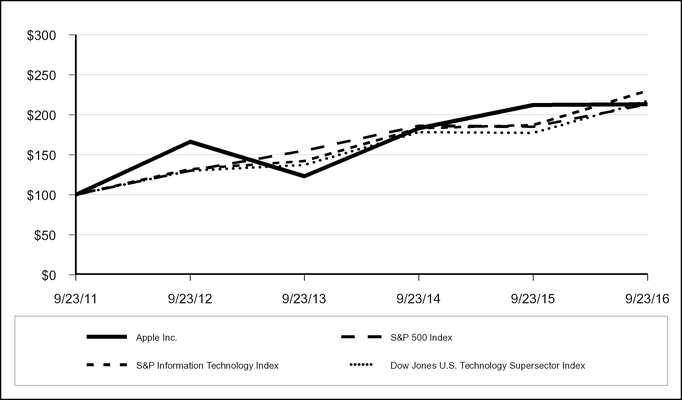
| * | $100 invested on 9/23/11 in stock or index, including reinvestment of dividends. Data points are the last day of each fiscal year for the Company’s common stock and September 30th for indexes. |
Copyright© 2016 S&P, a division of McGraw Hill Financial. All rights reserved.
Copyright© 2016 Dow Jones & Co. All rights reserved.
| September 2011 | September 2012 | September 2013 | September 2014 | September 2015 | September 2016 | |||||||||||||||||||
| Apple Inc. | $ | 100 | $ | 166 | $ | 123 | $ | 183 | $ | 212 | $ | 213 | ||||||||||||
| S&P 500 Index | $ | 100 | $ | 130 | $ | 155 | $ | 186 | $ | 185 | $ | 213 | ||||||||||||
| S&P Information Technology Index | $ | 100 | $ | 132 | $ | 142 | $ | 183 | $ | 187 | $ | 230 | ||||||||||||
| Dow Jones U.S. Technology Supersector Index | $ | 100 | $ | 130 | $ | 137 | $ | 178 | $ | 177 | $ | 217 |
Apple Inc. | 2016 Form 10-K | 20
Previous: Item 4. Mine Safety Disclosures · Next: Item 6. Selected Financial Data