 filings.tools
Item 5. MARKET FOR REGISTRANT’S COMMON EQUITY, RELATED STOCKHOLDER MATTERS AND ISSUER PURCHASES OF EQUITY SECURITIES
5K characters. Original on sec.gov · Markdown
Item 5. MARKET FOR REGISTRANT’S COMMON EQUITY, RELATED STOCKHOLDER MATTERS AND ISSUER PURCHASES OF EQUITY SECURITIES
Our common stock is listed on The Nasdaq Global Select Market under the symbol ADI. The number of holders of record of our common stock at November 20, 2020 was 2,019. This number does not include shareholders for whom shares are held in a “nominee” or “street” name. On October 30, 2020, the last reported sales price of our common stock on The Nasdaq Global Select Market was $118.53 per share.
On November 23, 2020, our Board of Directors declared a cash dividend of $0.62 per outstanding share of common stock. The dividend will be paid on December 15, 2020 to all shareholders of record at the close of business on December 4, 2020 and is expected to total approximately $229.1 million. We currently expect quarterly dividends to continue in future periods, although they remain subject to determination and declaration by our Board of Directors. The payment of future dividends, if any, will be based on several factors, including our financial performance, outlook and liquidity.
Information regarding our equity compensation plans and the securities authorized for issuance thereunder is set forth in Item 12 of this Annual Report on Form 10-K.
Issuer Purchases of Equity Securities
The table below summarizes the activity related to stock repurchases for the three months ended October 31, 2020. In March 2020, we temporarily suspended our share repurchase program as a result of the global macroeconomic environment. That suspension continued through the fourth quarter of fiscal 2020 given the planned acquisition of Maxim Integrated Products, Inc. We reinstated the common stock repurchase program effective November 2020 (fiscal 2021). Future repurchases of common stock will be dependent upon our financial position, results of operations, outlook, liquidity, and other factors we deem relevant.
| Period | Total Number of Shares Purchased (1) | Average Price Paid Per Share (2) | Total Number of Shares Purchased as Part of Publicly Announced Plans or Programs (3) | Approximate Dollar Value of Shares that May Yet Be Purchased Under the Plans or Programs | ||||||||||||||||||||||
| August 2, 2020 through August 29, 2020 | 9,671 | $ | 117.38 | — | $ | 1,893,079,550 | ||||||||||||||||||||
| August 30, 2020 through September 26, 2020 | 4,702 | $ | 114.52 | — | $ | 1,893,079,550 | ||||||||||||||||||||
| September 27, 2020 through October 31, 2020 | 44,794 | $ | 123.86 | — | $ | 1,893,079,550 | ||||||||||||||||||||
| Total | 59,167 | $ | 122.06 | — | $ | 1,893,079,550 |
(1)All shares repurchased related to shares withheld by us from employees to satisfy employee tax obligations upon vesting of restricted stock units/awards granted to our employees under our equity compensation plans.
(2)The average price paid for shares in connection with vesting of restricted stock units/awards are averages of the closing stock price at the vesting date which is used to calculate the number of shares to be withheld.
(3)Shares repurchased pursuant to the stock repurchase program publicly announced on August 12, 2004. On August 21, 2018, the Board of Directors approved an increase to the current authorization for the stock repurchase program by an additional $2.0 billion to $8.2 billion in the aggregate. Under the repurchase program, we may repurchase outstanding shares of our common stock from time to time in the open market and through privately negotiated transactions. Unless terminated earlier by resolution of our Board of Directors, the repurchase program will expire when we have repurchased all shares authorized for repurchase under the repurchase program.
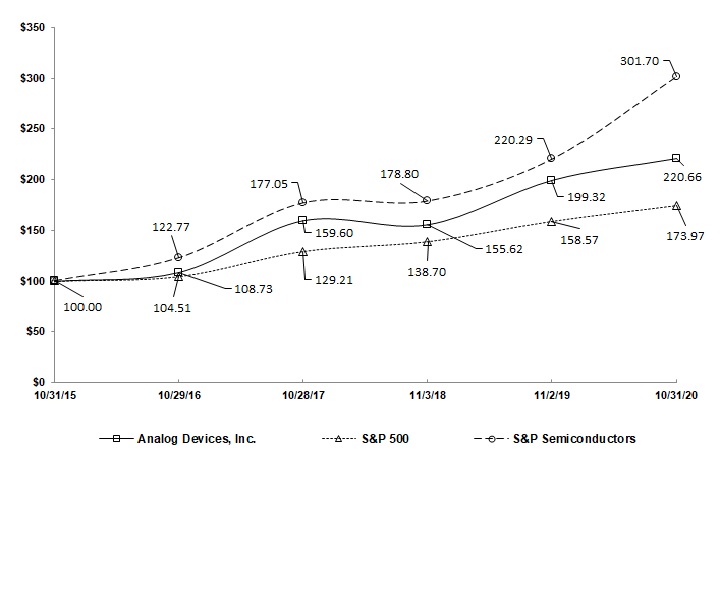
Comparative Stock Performance Graph
The following graph compares cumulative total shareholder return on our common stock since October 31, 2015 with the cumulative total return of the Standard & Poor’s (S&P) 500 Index and the S&P Semiconductors Index. This graph assumes the investment of $100 on October 31, 2015 in our common stock, the S&P 500 Index and the S&P Semiconductors Index and assumes all dividends are reinvested. Measurement points are the last trading day for each respective fiscal year.
Previous: Item 4. MINE SAFETY DISCLOSURES · Next: Item 6. SELECTED FINANCIAL DATA