 filings.tools
AES 10-K 2017-12-31
Filed 2018-02-27. 21 sections, 867K characters. Original on sec.gov · Markdown · JSON
Cover and table of contents
10-K 1 a2017form10-k.htm 10-K
UNITED STATES
SECURITIES AND EXCHANGE COMMISSION
WASHINGTON, D.C. 20549
FORM 10-K
| x | ANNUAL REPORT PURSUANT TO SECTION 13 OR 15(d) OF THE SECURITIES EXCHANGE ACT OF 1934 |
For the Fiscal Year Ended December 31, 2017
-OR-
| ¨ | TRANSITION REPORT FILED PURSUANT TO SECTION 13 OR 15(d) OF THE SECURITIES EXCHANGE ACT OF 1934 |
| COMMISSION FILE NUMBER 1-12291 |
THE AES CORPORATION
(Exact name of registrant as specified in its charter)
| Delaware | 54 1163725 | |
| (State or other jurisdiction of incorporation or organization) | (I.R.S. Employer Identification No.) | |
| 4300 Wilson Boulevard Arlington, Virginia | 22203 | |
| (Address of principal executive offices) | (Zip Code) | |
| Registrant's telephone number, including area code: (703) 522-1315 | ||
| Securities registered pursuant to Section 12(b) of the Act: | ||
| Title of Each Class | Name of Each Exchange on Which Registered | |
| Common Stock, par value $0.01 per share | New York Stock Exchange |
Securities registered pursuant to Section 12(g) of the Act: None
Indicate by check mark if the Registrant is a well-known seasoned issuer, as defined in Rule 405 of the Securities Act. Yes x No o
Indicate by check mark if the Registrant is not required to file reports pursuant to Section 13 or Section 15 (d) of the Act. Yes x No o
Indicate by check mark whether the registrant (1) has filed all reports required to be filed by Section 13 or 15(d) of the Securities Exchange Act of 1934 during the preceding 12 months (or for such shorter period that the registrant was required to file such reports), and (2) has been subject to such filing requirements for the past 90 days. Yes x No o
Indicate by check mark whether the registrant has submitted electronically and posted on its corporate Web site, if any, every Interactive Data File required to be submitted and posted pursuant to Rule 405 of Regulation S-T during the preceding 12 months (or for such shorter period that the registrant was required to submit and post such files). Yes x No o
Indicate by check mark if disclosure of delinquent filers pursuant to Item 405 of Regulation S-K is not contained herein, and will not be contained, to the best of registrant's knowledge, in definitive proxy or information statements incorporated by reference in Part III of this Form 10-K or any amendment to this Form 10-K. x
Indicate by check mark whether the registrant is a large accelerated filer, an accelerated filer, a non-accelerated filer, smaller reporting company, or an emerging growth company. See the definitions of “large accelerated filer,” “accelerated filer,” “smaller reporting company,” and “emerging growth company” in Rule 12b-2 of the Exchange Act. (Check one):
| Large accelerated filer x | Accelerated filer ¨ | Smaller reporting company ¨ | Emerging growth company ¨ | |||
| Non-accelerated filer ¨ | (Do not check if a smaller reporting company) |
If an emerging growth company, indicate by check mark if the registrant has elected not to use the extended transition period for complying with any new or revised financial accounting standards provided pursuant to Section 13(a) of the Exchange Act. ¨
Indicate by check mark whether the Registrant is a shell company (as defined in Rule 12b-2 of the Exchange Act). Yes o No x
The aggregate market value of the voting and non-voting common equity held by non-affiliates on June 30, 2017, the last business day of the Registrant's most recently completed second fiscal quarter (based on the adjusted closing sale price of $10.75 of the Registrant's Common Stock, as reported by the New York Stock Exchange on such date) was approximately $7.10 billion.
The number of shares outstanding of Registrant's Common Stock, par value $0.01 per share, on February 21, 2018 was 660,449,495.
DOCUMENTS INCORPORATED BY REFERENCE
Portions of Registrant's Proxy Statement for its 2018 annual meeting of stockholders are incorporated by reference in Parts II and III
THE AES CORPORATION FISCAL YEAR 2017 FORM 10-K
TABLE OF CONTENTS
GLOSSARY OF TERMS
The following terms and abbreviations appear in the text of this report and have the definitions indicated below:
| Adjusted EPS | Adjusted Earnings Per Share, a non-GAAP measure |
| Adjusted PTC | Adjusted Pre-tax Contribution, a non-GAAP measure of operating performance |
| AES | The Parent Company and its subsidiaries and affiliates |
| AOCL | Accumulated Other Comprehensive Loss |
| ASC | Accounting Standards Codification |
| ASEP | National Authority of Public Services |
| BACT | Best Available Control Technology |
| BART | Best Available Retrofit Technology |
| BOT | Build, Operate and Transfer |
| BTA | Best Technology Available |
| CAA | United States Clean Air Act |
| CAMMESA | Wholesale Electric Market Administrator in Argentina |
| CCGT | Combined Cycle Gas Turbine |
| CDPQ | La Caisse de dépôt et placement du Quebéc |
| CEO | Chief Executive Officer |
| CHP | Combined Heat and Power |
| COFINS | Contribuição para o Financiamento da Seguridade Social |
| CO2 | Carbon Dioxide |
| COSO | Committee of Sponsoring Organizations of the Treadway Commission |
| CP | Capacity Performance |
| CPI | United States Consumer Price Index |
| CPP | Clean Power Plan |
| CRES | Competitive Retail Electric Service |
| CSAPR | Cross-State Air Pollution Rule |
| CWA | U.S. Clean Water Act |
| DG Comp | Directorate-General for Competition of the European Commission |
| Dodd-Frank Act | Dodd-Frank Wall Street Reform and Consumer Protection Act |
| DP&L | The Dayton Power & Light Company |
| DPL | DPL Inc. |
| DPLER | DPL Energy Resources, Inc. |
| DPP | Dominican Power Partners |
| EBITDA | Earnings before Interest, Taxes, Depreciation & Amortization |
| EPA | United States Environmental Protection Agency |
| EPC | Engineering, Procurement, and Construction |
| ERC | Energy Regulatory Commission |
| ERCOT | Electric Reliability Council of Texas |
| ESP | Electric Security Plan |
| EU ETS | European Union Greenhouse Gas Emission Trading Scheme |
| EURIBOR | Euro Inter Bank Offered Rate |
| EUSGU | Electric Utility Steam Generating Unit |
| EVN | Electricity of Vietnam |
| EVP | Executive Vice President |
| FASB | Financial Accounting Standards Board |
| FERC | Federal Energy Regulatory Commission |
| FONINVEMEM | Fund for the Investment Needed to Increase the Supply of Electricity in the Wholesale Market |
| FPA | Federal Power Act |
| FX | Foreign Exchange |
| GAAP | Generally Accepted Accounting Principles in the United States |
| GHG | Greenhouse Gas |
| GRIDCO | Grid Corporation of Odisha Ltd. |
| GWh | Gigawatt Hours |
| HLBV | Hypothetical Liquidation Book Value |
| IBEX | Independent Bulgarian Power Exchange |
| IDEM | Indiana Department of Environmental Management |
| IPALCO | IPALCO Enterprises, Inc. |
| IPL | Indiana, Indianapolis Power & Light Company |
| IPP | Independent Power Producers |
| ISO | Independent System Operator |
| IURC | Indiana Utility Regulatory Commission |
| LIBOR | London Inter Bank Offered Rate |
| LNG | Liquefied Natural Gas |
| MATS | Mercury and Air Toxics Standards |
| MISO | Midcontinent Independent System Operator, Inc. |
| MRE | Energy Reallocation Mechanism |
| MW | Megawatts |
| MWh | Megawatt Hours |
| NCI | Noncontrolling Interest |
| NCRE | Non-Conventional Renewable Energy |
| NEK | Natsionalna Elektricheska Kompania (state-owned electricity public supplier in Bulgaria) |
| NEPCO | National Electric Power Company |
| NERC | North American Electric Reliability Corporation |
| NM | Not Meaningful |
| NOV | Notice of Violation |
| NOX | Nitrogen Dioxide |
| NPDES | National Pollutant Discharge Elimination System |
| NSPS | New Source Performance Standards |
| NYSE | New York Stock Exchange |
| O&M | Operations and Maintenance |
| ONS | National System Operator |
| OPGC | Odisha Power Generation Corporation, Ltd. |
| Parent Company | The AES Corporation |
| Pet Coke | Petroleum Coke |
| PIS | Partially Integrated System |
| PJM | PJM Interconnection, LLC |
| PM | Particulate Matter |
| PPA | Power Purchase Agreement |
| PREPA | Puerto Rico Electric Power Authority |
| PSD | Prevention of Significant Deterioration |
| PSU | Performance Stock Unit |
| PUCO | The Public Utilities Commission of Ohio |
| PURPA | Public Utility Regulatory Policies Act |
| QF | Qualifying Facility |
| RGGI | Regional Greenhouse Gas Initiative |
| RMRR | Routine Maintenance, Repair and Replacement |
| RSU | Restricted Stock Unit |
| RTO | Regional Transmission Organization |
| SADI | Argentine Interconnected System |
| SBU | Strategic Business Unit |
| SCE | Southern California Edison |
| SEC | United States Securities and Exchange Commission |
| SEM | Single Electricity Market |
| SIC | Central Interconnected Electricity System |
| SIN | National Interconnected System |
| SING | Northern Interconnected Electricity System |
| SIP | State Implementation Plan |
| SNE | National Secretary of Energy |
| SO2 | Sulfur Dioxide |
| SSO | Standard Service Offer |
| TECONS | Term Convertible Preferred Securities |
| U.S. | United States |
| VAT | Value Added Tax |
| VIE | Variable Interest Entity |
| Vinacomin | Vietnam National Coal-Mineral Industries Holding Corporation Ltd. |
| YPF | Argentina state-owned gas company |
PART I
In this Annual Report the terms “AES,” “the Company,” “us,” or “we” refer to The AES Corporation and all of its subsidiaries and affiliates, collectively. The terms “The AES Corporation” and “Parent Company” refer only to the parent, publicly held holding company, The AES Corporation, excluding its subsidiaries and affiliates.
FORWARD-LOOKING INFORMATION
In this filing we make statements concerning our expectations, beliefs, plans, objectives, goals, strategies, and future events or performance. Such statements are “forward-looking statements” within the meaning of the Private Securities Litigation Reform Act of 1995. Although we believe that these forward-looking statements and the underlying assumptions are reasonable, we cannot assure you that they will prove to be correct.
Forward-looking statements involve a number of risks and uncertainties, and there are factors that could cause actual results to differ materially from those expressed or implied in our forward-looking statements. Some of those factors (in addition to others described elsewhere in this report and in subsequent securities filings) include:
| • | the economic climate, particularly the state of the economy in the areas in which we operate, including the fact that the global economy faces considerable uncertainty for the foreseeable future, which further increases many of the risks discussed in this Form 10-K; |
| • | changes in inflation, demand for power, interest rates and foreign currency exchange rates, including our ability to hedge our interest rate and foreign currency risk; |
| • | changes in the price of electricity at which our generation businesses sell into the wholesale market and our utility businesses purchase to distribute to their customers, and the success of our risk management practices, such as our ability to hedge our exposure to such market price risk; |
| • | changes in the prices and availability of coal, gas and other fuels (including our ability to have fuel transported to our facilities) and the success of our risk management practices, such as our ability to hedge our exposure to such market price risk, and our ability to meet credit support requirements for fuel and power supply contracts; |
| • | changes in and access to the financial markets, particularly changes affecting the availability and cost of capital in order to refinance existing debt and finance capital expenditures, acquisitions, investments and other corporate purposes; |
| • | our ability to manage liquidity and comply with covenants under our recourse and non-recourse debt, including our ability to manage our significant liquidity needs and to comply with covenants under our senior secured credit facility and other existing financing obligations; |
| • | changes in our or any of our subsidiaries' corporate credit ratings or the ratings of our or any of our subsidiaries' debt securities or preferred stock, and changes in the rating agencies' ratings criteria; |
| • | our ability to purchase and sell assets at attractive prices and on other attractive terms; |
| • | our ability to compete in markets where we do business; |
| • | our ability to manage our operational and maintenance costs, the performance and reliability of our generating plants, including our ability to reduce unscheduled down times; |
| • | our ability to locate and acquire attractive "greenfield" or "brownfield" projects and our ability to finance, construct and begin operating our "greenfield" or "brownfield" projects on schedule and within budget; |
| • | our ability to enter into long-term contracts, which limit volatility in our results of operations and cash flow, such as PPAs, fuel supply, and other agreements and to manage counterparty credit risks in these agreements; |
| • | variations in weather, especially mild winters and cooler summers in the areas in which we operate, the occurrence of difficult hydrological conditions for our hydropower plants, as well as hurricanes and other storms and disasters, and low levels of wind or sunlight for our wind and solar facilities; |
| • | our ability to meet our expectations in the development, construction, operation and performance of our new facilities, whether greenfield, brownfield or investments in the expansion of existing facilities; |
| • | the success of our initiatives in other renewable energy projects and energy storage projects; |
| • | our ability to keep up with advances in technology; |
| • | the potential effects of threatened or actual acts of terrorism and war; |
| • | the expropriation or nationalization of our businesses or assets by foreign governments, with or without adequate compensation; |
| • | our ability to achieve reasonable rate treatment in our utility businesses; |
| • | changes in laws, rules and regulations affecting our international businesses; |
| • | changes in laws, rules and regulations affecting our North America business, including, but not limited to, regulations which may affect competition, the ability to recover net utility assets and other potential stranded costs by our utilities; |
| • | changes in law resulting from new local, state, federal or international energy legislation and changes in political or regulatory oversight or incentives affecting our wind business and solar projects, our other renewables projects and our initiatives in GHG reductions and energy storage, including tax incentives; |
| • | changes in environmental laws, including requirements for reduced emissions of sulfur, nitrogen, carbon, mercury, hazardous air pollutants and other substances, GHG legislation, regulation, and/or treaties and coal ash regulation; |
| • | changes in tax laws, including U.S. tax reform, and the effects of our strategies to reduce tax payments; |
| • | the effects of litigation and government and regulatory investigations; |
| • | our ability to maintain adequate insurance; |
| • | decreases in the value of pension plan assets, increases in pension plan expenses, and our ability to fund defined benefit pension and other postretirement plans at our subsidiaries; |
| • | losses on the sale or write-down of assets due to impairment events or changes in management intent with regard to either holding or selling certain assets; |
| • | changes in accounting standards, corporate governance and securities law requirements; |
| • | our ability to maintain effective internal controls over financial reporting; |
| • | our ability to attract and retain talented directors, management and other personnel, including, but not limited to, financial personnel in our foreign businesses that have extensive knowledge of accounting principles generally accepted in the United States; and |
| • | cyber-attacks and information security breaches. |
These factors in addition to others described elsewhere in this Form 10-K, including those described under Item 1A.—Risk Factors, and in subsequent securities filings, should not be construed as a comprehensive listing of factors that could cause results to vary from our forward-looking information.
We undertake no obligation to publicly update or revise any forward-looking statements, whether as a result of new information, future events, or otherwise. If one or more forward-looking statements are updated, no inference should be drawn that additional updates will be made with respect to those or other forward-looking statements.
Item 1. BUSINESS
Item 1.—Business is an outline of our strategy and our businesses by SBU, including key financial drivers. Additional items that may have an impact on our businesses are discussed in Item 1A.—Risk Factors and Item 3.—Legal Proceedings.
Executive Summary
Incorporated in 1981, AES is a power generation and utility company, providing affordable, sustainable energy through our diverse portfolio of thermal and renewable generation facilities and distribution businesses. Our vision is to be the world's leading sustainable power company that safely provides reliable, affordable energy. We do this by leveraging our unique electricity platforms and the knowledge of our people to provide the energy and infrastructure solutions our customers need. Our people share a passion to help meet the world's current and increasing energy needs, while providing communities and countries the opportunity for economic growth due to the availability of reliable, affordable electric power.
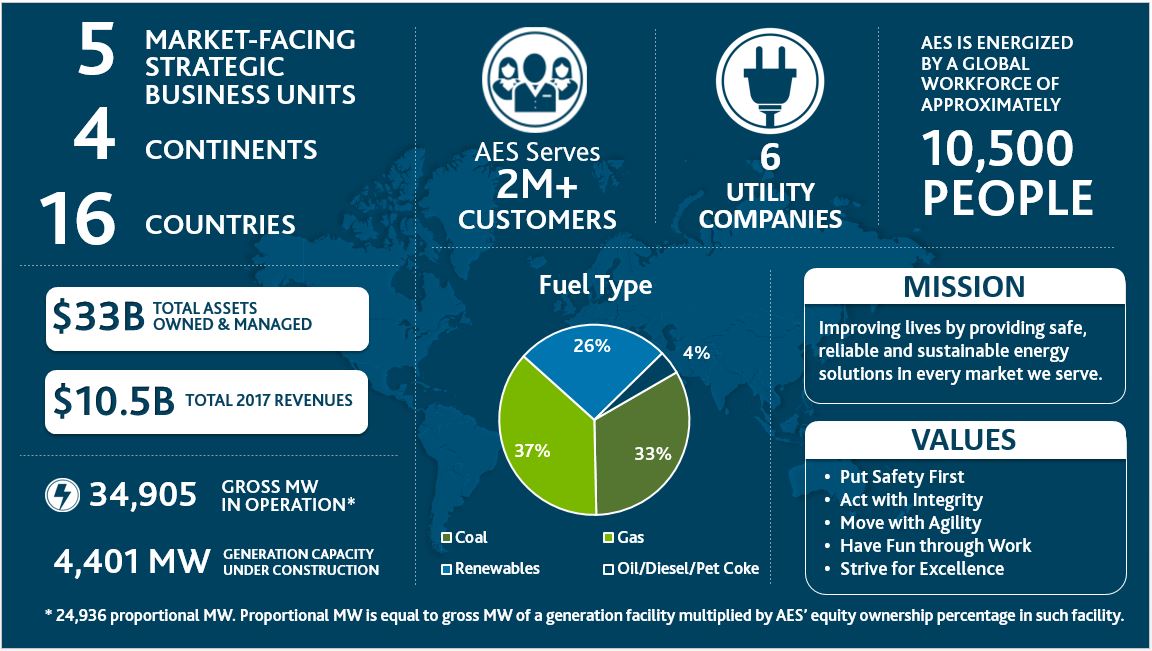
In 2017, we announced the sale or retirement of 4.3 GW of mostly merchant coal-fired generation, representing 30% of our coal-fired capacity.
Future growth across our company will be heavily weighted toward less carbon-intensive wind, solar and gas generation. In 2017, AES and AIMCo completed the joint acquisition of sPower, the leading independent solar developer in the United States. sPower has 1.3 GW of solar and wind projects and an additional 10 GW of renewables in its development pipeline. sPower's robust development pipeline and expertise position AES to significantly grow our renewables portfolio in the coming years.
Growth in renewables not only provides an opportunity for direct investments in solar and wind generation, but also presents significant potential for energy storage. We are a leader in lithium-ion, battery-based energy storage, with approximately 400 MW in operation, under construction or in advanced development across seven countries. We believe that battery-based energy storage will play a critical role in an increasingly renewables-based generation mix. In January 2018, we partnered with Siemens to form Fluence, a new global energy storage technology and services company. Through a sales partnership with Siemens' global sales force, Fluence will be able to sell energy storage solutions and services in 160 countries as this market grows.
AES continues to invest in LNG opportunities to provide cleaner alternatives to countries with oil-fired power generation. Specifically, AES introduced LNG in the Dominican Republic in 2003 and currently has a 380 MW
CCGT and LNG storage and regasification facility under construction in Panama.
In the United States, primarily at IPL, we completed a multi-year rate base investment in environmental upgrades to our coal plants and are in the process of re-powering several units from coal to gas.
As a result of our efforts to decrease our exposure to coal-fired generation and increase our portfolio of renewables, energy storage and natural gas capacity, we are significantly reducing our carbon dioxide emissions per MWh of generation. Under our current strategy, we anticipate a reduction of carbon intensity levels by 25% from 2016 to 2020 and by 50% from 2016 to 2030.
In February 2018, we announced a reorganization as a part of our on-going strategy to simplify our portfolio, optimize our cost structure and reduce our carbon intensity. Reflecting this simplified portfolio, we will manage our global operations separate from our growth and commercial activities.
Strategic Priorities
We have made significant progress towards meeting our strategic goals to maximize value for our shareholders.
| Leveraging Our Platforms | |||||||
| Focusing our growth in markets where we already operate and have a competitive advantage to realize attractive risk-adjusted returns | |||||||
| ● | In 2017, brought on-line seven projects for a total of 279 MW | ||||||
| ● | 4,401 MW currently under construction and expected to come on-line through 2021 | ||||||
| ● | Will continue to advance select projects from our development pipeline | ||||||
| Reducing Complexity | |||||||
| Exiting businesses and markets where we do not have a competitive advantage, simplifying our portfolio and reducing risk | |||||||
| ● | Since 2011 | ||||||
| ○ | Announced or closed $5.4 billion in equity proceeds from sales or sell-downs | ||||||
| ○ | Decreased total number of countries where we have operations from 28 to 16 | ||||||
| ● | In 2017, announced or closed $1.1 billion in equity proceeds from sales or sell-downs of three businesses | ||||||
| Performance Excellence | |||||||
| Striving to be the low-cost manager of a portfolio of assets and deriving synergies and scale from our businesses | |||||||
| ● | Since 2012, achieved $300 million in cost savings and revenue enhancements, including $50 million in 2017 | ||||||
| ○ | Includes overhead reductions, procurement efficiencies and operational improvements | ||||||
| ○ | Expect to achieve an additional $50 million in 2018 and another $50 million from 2019 to 2020, for a total of $400 million in annual savings in 2020 | ||||||
| Expanding Access to Capital | |||||||
| Optimizing risk-adjusted returns in existing businesses and growth projects | |||||||
| ● | Adjust our global exposure to commodity, fuel, country and other macroeconomic risks | ||||||
| ● | Building strategic partnerships at the project and business level with an aim to optimize our risk-adjusted returns in our business and growth projects | ||||||
| Allocating Capital in a Disciplined Manner | |||||||
| Maximizing risk-adjusted returns to our shareholders by investing our free cash flow to strengthen our credit and deliver attractive growth in cash flow and earnings | |||||||
| ● | In 2017, we generated substantial cash by executing on our strategy, which we allocated in line with our capital allocation framework | ||||||
| ○ | Used $341 million to prepay and refinance Parent Company debt | ||||||
| ○ | Returned $317 million to shareholders through quarterly dividends | ||||||
| ■ | Increased our quarterly dividend by 8.3% to $0.13 per share beginning in the first quarter of 2018 | ||||||
| ○ | Invested $481 million in our subsidiaries | ||||||
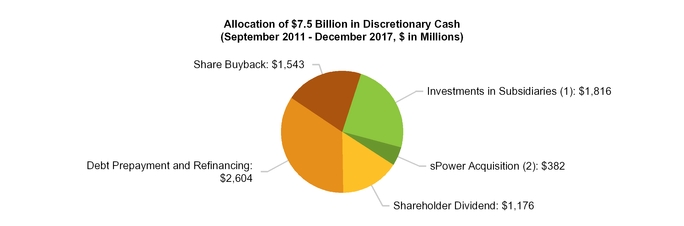
| (1) | Investments in subsidiaries excludes $2.2 billion investment in DPL |
| (2) | Excludes working capital adjustments and growth activity prior to the close of the acquisition. |
Segments
We are organized into five market-oriented SBUs: US (United States), Andes (Chile, Colombia, and Argentina), Brazil, MCAC (Mexico, Central America, and the Caribbean), and Eurasia (Europe and Asia) — which are led by our SBU Presidents. The Eurasia SBU resulted
Showing the first 8K of 177K characters. Open the full section
Item 1A. RISK FACTORS
You should consider carefully the following risks, along with the other information contained in or incorporated by reference in this Form 10-K. Additional risks and uncertainties also may adversely affect our business and
operations, including those discussed in Item 7.—Management's Discussion and Analysis of Financial Condition and Results of Operations in this Form 10-K. If any of the following events actually occur, our business, financial results and financial condition could be materially adversely affected.
We routinely encounter and address risks, some of which may cause our future results to be different, sometimes materially different, than we presently anticipate. The categories of risk we have identified in Item 1A.—Risk Factors of this Form 10-K include the following:
| • | risks related to our high level of indebtedness; |
| • | risks associated with our ability to raise needed capital; |
| • | external risks associated with revenue and earnings volatility; |
| • | risks associated with our operations; and |
| • | risks associated with governmental regulation and laws. |
These risk factors should be read in conjunction with Item 7.—Management's Discussion and Analysis of Financial Condition and Results of Operations, and the Consolidated Financial Statements and related notes included elsewhere in this report.
Risks Related to our High Level of Indebtedness
We have a significant amount of debt, a large percentage of which is secured, which could adversely affect our business and the ability to fulfill our obligations.
As of December 31, 2017, we had approximately $20 billion of outstanding indebtedness on a consolidated basis. All outstanding borrowings, if any, under The AES Corporation's senior secured credit facility and secured term loan are secured by certain of our assets, including the pledge of capital stock of many of The AES Corporation's directly held subsidiaries. Most of the debt of The AES Corporation's subsidiaries is secured by substantially all of the assets of those subsidiaries. Since we have such a high level of debt, a substantial portion of cash flow from operations must be used to make payments on this debt. Furthermore, since a significant percentage of our assets are used to secure this debt, this reduces the amount of collateral available for future secured debt or credit support and reduces our flexibility in operating these secured assets. This high level of indebtedness and related security could have other important consequences to us and our investors, including:
| • | making it more difficult to satisfy debt service and other obligations at the holding company and/or individual subsidiaries; |
| • | increasing our vulnerability to general adverse industry and economic conditions, including but not limited to adverse changes in foreign exchange rates and commodity prices; |
| • | reducing the availability of cash flow to fund other corporate purposes and grow our business; |
| • | limiting our flexibility in planning for, or reacting to, changes in our business and the industry; |
| • | placing us at a competitive disadvantage to our competitors that are not as highly leveraged; and |
| • | limiting, along with the financial and other restrictive covenants relating to such indebtedness, among other things, our ability to borrow additional funds as needed or take advantage of business opportunities as they arise, pay cash dividends or repurchase common stock. |
The agreements governing our indebtedness, including the indebtedness of our subsidiaries, limit, but do not prohibit the incurrence of additional indebtedness. To the extent we become more leveraged, the risks described above would increase. Further, our actual cash requirements in the future may be greater than expected. Accordingly, our cash flows may not be sufficient to repay at maturity all of the outstanding debt as it becomes due and, in that event, we may not be able to borrow money, sell assets, raise equity or otherwise raise funds on acceptable terms or at all to refinance our debt as it becomes due. See Note 10.—Debt included in Item 8.—Financial Statements and Supplementary Data of this Form 10-K for a schedule of our debt maturities.
The AES Corporation is a holding company and its ability to make payments on its outstanding indebtedness, including its public debt securities, is dependent upon the receipt of funds from its subsidiaries by way of dividends, fees, interest, loans or otherwise.
The AES Corporation is a holding company with no material assets other than the stock of its subsidiaries. Almost all of The AES Corporation's cash flow is generated by the operating activities of its subsidiaries. Therefore, The AES Corporation's ability to make payments on its indebtedness and to fund its other obligations is dependent not only on the ability of its subsidiaries to generate cash, but also on the ability of the subsidiaries to distribute cash to it in the form of dividends, fees, interest, tax sharing payments, loans or otherwise.
However, our subsidiaries face various restrictions in their ability to distribute cash to The AES Corporation. Most of the subsidiaries are obligated, pursuant to loan agreements, indentures or non-recourse financing arrangements, to satisfy certain restricted payment covenants or other conditions before they may make distributions to The AES Corporation, if at all. Business performance and local accounting and tax rules may also limit dividend distributions. Subsidiaries in foreign countries may also be prevented from distributing funds to The AES Corporation as a result of foreign governments restricting the repatriation of funds or the conversion of currencies.
The AES Corporation's subsidiaries are separate and distinct legal entities and, unless they have expressly guaranteed any of The AES Corporation's indebtedness, have no obligation, contingent or otherwise, to pay any amounts due pursuant to such debt or to make any funds available whether by dividends, fees, loans or other payments.
Even though The AES Corporation is a holding company, existing and potential future defaults by subsidiaries or affiliates could adversely affect The AES Corporation.
We attempt to finance our domestic and foreign projects primarily under loan agreements and related documents which, except as noted below, require the loans to be repaid solely from the project's revenues and provide that the repayment of the loans (and interest thereon) is secured solely by the capital stock, physical assets, contracts and cash flow of that project subsidiary or affiliate. This type of financing is usually referred to as non-recourse debt or "non-recourse financing." In some non-recourse financings, The AES Corporation has explicitly agreed to undertake certain limited obligations and contingent liabilities, most of which by their terms will only be effective or will be terminated upon the occurrence of future events. These obligations and liabilities take the form of guarantees, indemnities, letters of credit, letter of credit reimbursement agreements and agreements to pay, in certain circumstances, the project lenders or other parties.
As of December 31, 2017, we had approximately $20 billion of outstanding indebtedness on a consolidated basis, of which approximately $4.6 billion was recourse debt of The AES Corporation and approximately $15.3 billion was non-recourse debt. In addition, we have outstanding guarantees, indemnities, letters of credit, and other credit support commitments which are further described in this Form 10-K in Item 7.—Management's Discussion and Analysis of Financial Condition and Results of Operations—Ca
Showing the first 8K of 90K characters. Open the full section
Item 1B. UNRESOLVED STAFF COMMENTS
None.
Item 2. PROPERTIES
We maintain offices in many places around the world, generally pursuant to the provisions of long- and short-term leases, none of which we believe are material. With a few exceptions, our facilities, which are described in Item 1—Business of this Form 10-K, are subject to mortgages or other liens or encumbrances as part of the project's related finance facility. In addition, the majority of our facilities are located on land that is leased. However, in a few instances, no accompanying project financing exists for the facility, and in a few of these cases, the land interest may not be subject to any encumbrance and is owned outright by the subsidiary or affiliate.
Item 3. LEGAL PROCEEDINGS
The Company is involved in certain claims, suits and legal proceedings in the normal course of business. The Company has accrued for litigation and claims where it is probable that a liability has been incurred and the amount of loss can be reasonably estimated. The Company believes, based upon information it currently possesses and taking into account established reserves for estimated liabilities and its insurance coverage, that the ultimate outcome of these proceedings and actions is unlikely to have a material adverse effect on the Company's financial statements. It is reasonably possible, however, that some matters could be decided unfavorably to the Company and could require the Company to pay damages or make expenditures in amounts that could be material but cannot be estimated as of December 31, 2017.
In December 2001, Grid Corporation of Odisha (“GRIDCO”) served a notice to arbitrate pursuant to the Indian Arbitration and Conciliation Act of 1996 on the Company, AES Orissa Distribution Private Limited (“AES ODPL”), and Jyoti Structures (“Jyoti”) pursuant to the terms of the shareholders agreement between GRIDCO, the Company, AES ODPL, Jyoti and the Central Electricity Supply Company of Orissa Ltd. (“CESCO”), an affiliate of the Company. In the arbitration, GRIDCO asserted that a comfort letter issued by the Company in connection with the Company's indirect investment in CESCO obligates the Company to provide additional financial support to cover all of CESCO's financial obligations to GRIDCO. GRIDCO appeared to be seeking approximately $189 million in damages, plus undisclosed penalties and interest, but a detailed alleged damage analysis was not filed by GRIDCO. The Company counterclaimed against GRIDCO for damages. In June 2007, a 2-to-1 majority of the arbitral tribunal rendered its award rejecting GRIDCO's claims and holding that none of the respondents, the Company, AES ODPL, or Jyoti, had any liability to GRIDCO. The respondents' counterclaims were also rejected. A majority of the tribunal later awarded the respondents, including the Company, some of their costs relating to the arbitration. GRIDCO filed challenges of the tribunal's awards with the local Indian court. GRIDCO's challenge of the costs award has been dismissed by the court, but its challenge of the liability award remains pending. A hearing on the liability award is scheduled for March 15, 2018. The Company believes that it has meritorious defenses to the claims asserted against it and will defend itself vigorously in these proceedings; however, there can be no assurances that it will be successful in its efforts.
In January 2012, the Brazil Federal Tax Authority issued an assessment alleging that AES Tietê had paid PIS and COFINS taxes from 2007 to 2010 at a lower rate than the tax authority believed was applicable. AES Tietê challenged the assessment on the grounds that the tax rate was set in the applicable legislation. In April 2013, the FIAC determined that AES Tietê should have calculated the taxes at the higher rate and that AES Tietê was liable for unpaid taxes, interest, and penalties totaling approximately R$1.17 billion ($353 million) as estimated by AES Tietê. AES Tietê appealed to the SIAC. In January 2015, the SIAC issued a decision in AES Tietê's favor, finding that AES Tietê was not liable for unpaid taxes. The public prosecutor subsequently filed an appeal, which was denied as untimely. The Tax Authority thereafter filed a motion for clarification of the SIAC's decision, which was denied in September 2016. The Tax Authority later filed a special appeal (“Special Appeal”), which was rejected as untimely in October 2016. The Tax Authority thereafter filed an interlocutory appeal with the Superior Administrative Court (“SAC”). In March 2017, the President of the SAC determined that the SAC would analyze the Special Appeal on timeliness and, if required, the merits. AES Tietê has challenged the Special Appeal. AES Tietê believes it has meritorious defenses to the claim and will defend itself vigorously in these proceedings; however, there can be no assurances that it will be successful in its efforts.
In January 2015, DPL received NOVs from the EPA alleging violations of opacity at Stuart and Killen Stations, and in October 2015, IPL received a similar NOV alleging violations at Petersburg Station. In February 2017, the EPA issued a second NOV for DPL Stuart Station, alleging violations of opacity in 2016. Moreover, in February 2016, IPL received an NOV from the EPA alleging violations of NSR and other CAA regulations, the Indiana SIP, and the Title V operating permit at Petersburg Station. It is too early to determine whether the NOVs could have a material impact on our business, financial condition or results of our operations. IPL would seek recovery of any operating or capital expenditures, but not fines or penalties, related to air pollution control technology to reduce regulated air emissions; however, there can be no assurances that we would be successful in this regard.
In September 2015, AES Southland Development, LLC and AES Redondo Beach, LLC filed a lawsuit against the California Coastal Commission (the “CCC”) over the CCC's determination that the site of AES Redondo Beach included approximately 5.93 acres of CCC-jurisdictional wetlands. The CCC has asserted that AES Redondo Beach has improperly installed and operated water pumps affecting the alleged wetlands in violation of the California Coastal Act and Redondo Beach Local Coastal Program and has ordered AES Redondo Beach to restore the site. Additional potential outcomes of the CCC determination could include an order requiring AES Redondo Beach to fund a wetland mitigation project and/or pay fines or penalties. AES Redondo Beach believes that it has meritorious arguments and intends to vigorously prosecute such lawsuit, but there can be no assurances that it will be successful.
In October 2015, Ganadera Guerra, S.A. (“GG”) and Constructora Tymsa, S.A. (“CT”) filed separate lawsuits against AES Panama in the local courts of Panama. The claimants allege that AES Panama profited from a hydropower facility (La Estrella) being partially located on land owned initially by GG and currently by CT, and that AES Panama must pay compensation for its use of the land. The damages sought from AES Panama are approximately $685 million (GG) and $100 million (CT). In October 2016, the court dismissed GG's claim because of GG's failure to comply with a court order requiring GG to disclose certain information. GG has refiled its lawsuit. Also, there are ongoing administrative proceedings concerning whether AES Panama is entitled to acquire an easement over the land and whether AES Panama can continue to occupy the land. AES Panama believes it has
meritorious defenses and claims and will assert them vigorously; however, there can be no assurances that it will be successful in its efforts.
In January 2017, the Superintendencia del Medio Ambiente (“SMA”) issued a Formulation of Charges asserting that Alto Maipo is in violation of certain conditions of the Environmental Approval Resolution (“RCA”) governing Alto Maipo’s hydropower project, for, among other things, operating vehicles at unauthorized times and failing to mitigate the impact of water intrusion during tunnel construction. In February 2017, Alto Maipo submitted a compliance plan to the SMA which, if approved by the agency, would resolve the matter without materially impacting construction of the project. In June 2017, the SMA issued a resolution detailing its comments on the compliance plan. Alto Maipo responded to the SMA’s comments in July 2017. In January 2018, the SMA requested additional information from Alto Maipo relating to the compliance plan and Formulation of Charges. In February 2018, Alto Maipo submitted certain information to the SMA, which is under consideration by the agency. The outcome of this matter is uncertain, but an adverse decision by the SMA could have a negative impact on the construction of the project. Alto Maipo will pursue its interests vigorously in this matter; however, there can be no assurance that it will be successful in its efforts.
In June 2017, Alto Maipo terminated one of its contractors, Constructora Nuevo Maipo S.A. (“CNM”), given CNM’s stoppage of tunneling works, its failure to produce a completion plan, and its other breaches of contract. Alto Maipo also initiated arbitration against CNM to recover excess completion costs and other damages relating to these breaches. CNM subsequently initiated a separate arbitration, seeking a declaration that its termination was wrongful, damages, and other relief. CNM has not supported its alleged damages, but it has asserted that it is entitled to recover over $20 million in damages, legal costs, and approximately $73 million that was drawn by Alto Maipo under letters of credit. The arbitrations have been consolidated into a single action. The evidentiary hearing is scheduled for May 20-31, 2019. In the interim, CNM requested that the arbitral Tribunal issue an order requiring Alto Maipo to immediately return or escrow the letter of credit funds. In February 2018, the Tribunal denied CNM’s request for interim relief. However, the ultimate merits of CNM’s arbitration claims will be decided after the May 2018 hearing, including in relation to the letters of credit. In addition, CNM is attempting to seek relief in the Chilean court of appeals concerning the draws on the letters of credit. That action is pending. Alto Maipo believes it has meritorious claims and defenses and will assert them vigorously in these proceedings; however, there can be no assurances that it will be successful in its efforts.
In October 2017, the Ministry of Justice (“MOJ”) of the Republic of Kazakhstan (“ROK”) filed a lawsuit in the Specialized Economic Court of Eastern-Kazakhstan Region (“Economic Court”) against Tau Power BV (an AES affiliate), Altai Power LLP (an AES affiliate), the Company, and two hydropower plants (“HPPs”) previously under concession to Tau Power. In its lawsuit, the MOJ references a 2013 treaty arbitration award (“2013 Award”) against the ROK concerning the ROK’s energy laws. While its lawsuit is unclear, the MOJ appears to seek relief relating to the net income distributed by the HPPs during certain years of the concession period. In November 2017, the Economic Court issued a decision that purports to allow the MOJ to enforce the 2013 Award in Kazakhstan. The decision was affirmed on intermediate appeal. The AES defendants have appealed to the Kazakhstan Supreme Court. The AES defendants believe that the lawsuit is without merit and they will assert their defenses vigorously; however, there can be no assurances that they will be successful in their efforts.
Item 4. MINE SAFETY DISCLOSURES
Not applicable.
PART II
Item 5. MARKET FOR REGISTRANT'S COMMON EQUITY, RELATED STOCKHOLDER MATTERS AND ISSUER PURCHASES OF EQUITY SECURITIES
Recent Sales of Unregistered Securities
None.
Purchases of Equity Securities by the Issuer and Affiliated Purchasers
Stock Repurchase Program — The Board authorization permits the Parent Company to repurchase stock through a variety of methods, including open market repurchases and/or privately negotiated transactions. There can be no assurances as to the amount, timing or prices of repurchases, which may vary based on market conditions and other factors. The Program does not have an expiration date and can be modified or terminated by the Board of Directors at any time. The cumulative repurchase from the commencement of the Program in July 2010 through December 31, 2017 is 154.3 million shares at a total cost of $1.9 billion, at an average price per share of $12.12 (including a nominal amount of commissions). As of December 31, 2017, $246 million remained available for repurchase under the Program. No repurchases were made by The AES Corporation of its common stock during the year ended December 31, 2017. The Parent Company repurchased 8,686,983 and 39,684,131 shares of its common stock in 2016 and 2015, respectively.
Market Information
Our common stock is traded on the NYSE under the symbol "AES." The closing price of our common stock as reported by the NYSE on February 21, 2018, was $10.23 per share. The following tables present the high and low intraday sale prices of our common stock and cash dividends declared for the indicated periods.
| 2017 | 2016 | ||||||||||||||||||||||
| Sales Price | Cash Dividends | Sales Price | Cash Dividends | ||||||||||||||||||||
| High | Low | Declared | High | Low | Declared | ||||||||||||||||||
| First Quarter | $ | 12.06 | $ | 10.93 | $ | 0.12 | $ | 11.80 | $ | 8.22 | $ | 0.11 | |||||||||||
| Second Quarter | 12.05 | 10.95 | — | 12.48 | 10.49 | — | |||||||||||||||||
| Third Quarter | 11.66 | 10.60 | 0.12 | 13.32 | 11.85 | 0.11 | |||||||||||||||||
| Fourth Quarter | 11.34 | 10.00 | 0.25 | 12.75 | 10.98 | 0.23 |
Dividends
The Parent Company commenced a quarterly cash dividend in the fourth quarter of 2012. The Parent Company has increased this dividend annually and the cash dividend for the last three years are displayed below.
| Commencing the fourth quarter of | 2017 | 2016 | 2015 | |||
| Cash dividend | $0.13 | $0.12 | $0.11 |
The fourth quarter 2017 cash dividend is to be paid in the first quarter of 2018. There can be no assurance that the AES Board will declare a dividend in the future or, if declared, the amount of any dividend. Our ability to pay dividends will also depend on receipt of dividends from our various subsidiaries across our portfolio.
Under the terms of our senior secured credit facility, which we entered into with a commercial bank syndicate, we have limitations on our ability to pay cash dividends and/or repurchase stock. Our subsidiaries' ability to declare and pay cash dividends to us is also subject to certain limitations contained in the project loans, governmental provisions and other agreements to which our subsidiaries are subject. See the information contained under Item 12.—Security Ownership of Certain Beneficial Owners and Management and Related Stockholder Matters—Securities Authorized for Issuance under Equity Compensation Plans of this Form 10-K.
Holders
As of February 21, 2018, there were approximately 4,120 record holders of our common stock.
Performance Graph
THE AES CORPORATION
PEER GROUP INDEX/STOCK PRICE PERFORMANCE
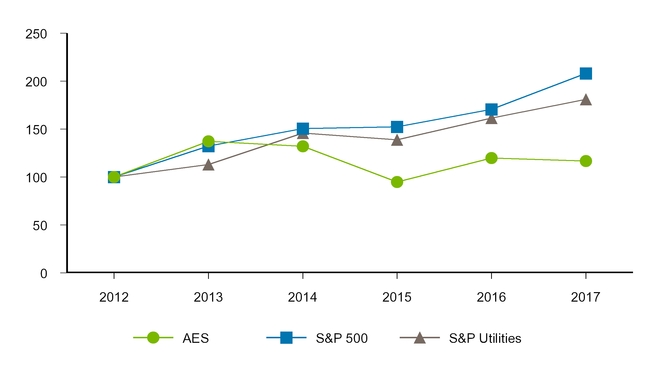
Source: Bloomberg
We have selected the Standard and Poor's ("S&P") 500 Utilities Index as our peer group index. The S&P 500 Utilities Index is a published sector index comprising the 28 electric and gas utilities included in the S&P 500.
The five year total return chart assumes $100 invested on December 31, 2012 in AES Common Stock, the S&P 500 Index and the S&P 500 Utilities Index. The information included under the heading Performance Graph shall not be considered "filed" for purposes of Section 18 of the Securities Exchange Act of 1934 or incorporated by reference in any filing under the Securities Act of 1933 or the Securities Exchange Act of 1934.
Item 6. SELECTED FINANCIAL DATA
The following table presents our selected financial data as of the dates and for the periods indicated. This data should be read together with Item 7.—Management's Discussion and Analysis of Financial Condition and Results of Operations and the Consolidated Financial Statements and the notes thereto included in Item 8.—Financial Statements and Supplementary Data of this Form 10-K. The selected financial data for each of the years in the five year period ended December 31, 2017 have been derived from our audited Consolidated Financial Statements. Prior period amounts have been restated to reflect discontinued operations in all periods presented. Prior to July 1, 2014, a discontinued operation was a component of the Company that either had been disposed of or was classified as held-for-sale and where the Company did not expect to have significant cash flows or significant continuing involvement with the component as of one year after its disposal or sale. Effective July 1, 2014, the Company adopted new accounting guidance under which the Company reports a business as discontinued operations if the disposal represents a strategic shift that has (or will have) a major effect on the Company’s operations and financial results when the business is sold or classified as held-for-sale. Please refer to Note 1 in Item 8.—Financial Statements and Supplementary Data of this Form 10-K for further explanation. Our historical results are not necessarily indicative of our future results.
Acquisitions, disposals, reclassifications and changes in accounting principles affect the comparability of information included in the tables below. Please refer to the Notes to the Consolidated Financial Statements included in Item 8.—Financial Statements and Supplementary Data of this Form 10-K for further explanation of the effect of such activities. Please also refer to Item 1A.—Risk Factors of this Form 10-K and Note 25—Risks and Uncertainties to the Consolidated Financial Statements included in Item 8.—Financial Statements and
Supplementary Data of this Form 10-K for certain risks and uncertainties that may cause the data reflected herein not to be indicative of our future financial condition or results of operations.
SELECTED FINANCIAL DATA
| 2017 | 2016 | 2015 | 2014 | 2013 | |||||||||||||||
| Statement of Operations Data for the Years Ended December 31: | (in millions, except per share amounts) | ||||||||||||||||||
| Revenue | $ | 10,530 | $ | 10,281 | $ | 11,260 | $ | 12,604 | $ | 12,051 | |||||||||
| Income (loss) from continuing operations (1) | (148 | ) | 191 | 682 | 941 | 751 | |||||||||||||
| Income (loss) from continuing operations attributable to The AES Corporation, net of tax | (507 | ) | (20 | ) | 318 | 678 | 264 | ||||||||||||
| Income (loss) from discontinued operations attributable to The AES Corporation, net of tax | (654 | ) | (1,110 | ) | (12 | ) | 91 | (150 | ) | ||||||||||
| Net income (loss) attributable to The AES Corporation | $ | (1,161 | ) | $ | (1,130 | ) | $ | 306 | $ | 769 | $ | 114 | |||||||
| Per Common Share Data | |||||||||||||||||||
| Basic earnings (loss) per share: | |||||||||||||||||||
| Income (loss) from continuing operations attributable to The AES Corporation, net of tax | $ | (0.77 | ) | $ | (0.04 | ) | $ | 0.46 | $ | 0.94 | $ | 0.36 | |||||||
| Income (loss) from discontinued operations attributable to The AES Corporation, net of tax | (0.99 | ) | (1.68 | ) | (0.01 | ) | 0.13 | (0.21 | ) | ||||||||||
| Basic earnings (loss) per share | $ | (1.76 | ) | $ | (1.72 | ) | $ | 0.45 | $ | 1.07 | $ | 0.15 | |||||||
| Diluted earnings (loss) per share: | |||||||||||||||||||
| Income (loss) from continuing operations attributable to The AES Corporation, net of tax | $ | (0.77 | ) | $ | (0.04 | ) | $ | 0.46 | $ | 0.94 | $ | 0.35 | |||||||
| Income (loss) from discontinued operations attributable to The AES Corporation, net of tax | (0.99 | ) | (1.68 | ) | (0.02 | ) | 0.12 | (0.20 | ) | ||||||||||
| Diluted earnings (loss) per share | $ | (1.76 | ) | $ | (1.72 | ) | $ | 0.44 | $ | 1.06 | $ | 0.15 | |||||||
| Dividends Declared Per Common Share | $ | 0.49 | $ | 0.45 | $ | 0.41 | $ | 0.25 | $ | 0.17 | |||||||||
| Cash Flow Data for the Years Ended December 31: | |||||||||||||||||||
| Net cash provided by operating activities | $ | 2,489 | $ | 2,884 | $ | 2,134 | $ | 1,791 | $ | 2,715 | |||||||||
| Net cash used in investing activities | (2,749 | ) | (2,108 | ) | (2,366 | ) | (656 | ) | (1,774 | ) | |||||||||
| Net cash provided by (used in) financing activities | 43 | (747 | ) | 28 | (1,262 | ) | (1,136 | ) | |||||||||||
| Total (decrease) increase in cash and cash equivalents | (295 | ) | 26 | (231 | ) | (119 | ) | (253 | ) | ||||||||||
| Cash and cash equivalents, ending | 949 | 1,244 | 1,218 | 1,517 | 1,636 | ||||||||||||||
| Balance Sheet Data at December 31: | |||||||||||||||||||
| Total assets | $ | 33,112 | $ | 36,124 | $ | 36,545 | $ | 38,676 | $ | 40,100 | |||||||||
| Non-recourse debt (noncurrent) | 13,176 | 13,731 | 12,184 | 12,077 | 11,486 | ||||||||||||||
| Non-recourse debt (noncurrent)—Discontinued operations | — | 758 | 772 | 1,226 | 1,629 | ||||||||||||||
| Recourse debt (noncurrent) | 4,625 | 4,671 | 4,966 | 5,047 | 5,485 | ||||||||||||||
| Redeemable stock of subsidiaries | 837 | 782 | 538 | 78 | 78 | ||||||||||||||
| Retained earnings (accumulated deficit) | (2,276 | ) | (1,146 | ) | 143 | 512 | (150 | ) | |||||||||||
| The AES Corporation stockholders' equity | 2,465 | 2,794 | 3,149 | 4,272 | 4,330 |
| (1) | Includes pre-tax impairment expense of $537 million, $1.1 billion, $602 million, $383 million, and $596 million for the years ended December 31, 2017, 2016, 2015, 2014 and 2013, respectively. See Note 8—Goodwill and Other Intangible Assets and Note 19—Asset Impairment Expense included in Item 8.—Financial Statements and Supplementary Data of this Form 10-K for further information. |
Item 7. MANAGEMENT'S DISCUSSION AND ANALYSIS OF FINANCIAL CONDITION AND RESULTS OF OPERATIONS
Executive Summary
Diluted loss per share from continuing operations for the year ended December 31, 2017 was $0.77, an increase of $0.73 compared to the year ended December 31, 2016. The increase was primarily due to a one-time transition tax on foreign earnings following the enactment of the U.S. Tax Cuts and Jobs Act in the fourth quarter of 2017. This impact was partially offset by lower impairment expense, primarily at DPL in the US SBU. Adjusted EPS, a non-GAAP financial measure, for the year ended December 31, 2017 increased $0.14 to $1.08, reflecting higher margins, primarily at the MCAC SBU, and contributions from new businesses in the U.S. and MCAC.
Strategic Priorities
As a result of our efforts to decrease our exposure to coal-fired generation and increase our portfolio of renewables, energy storage, and natural gas capacity, we are significantly reducing our carbon intensity. In 2017, AES and AIMCo completed the joint acquisition of sPower, the largest independent solar developer in the United States. In addition, we announced the sale or retirement of 4.5 GW of mostly merchant coal-fired generation, representing 31% of our coal-fired capacity.
In February 2018, we announced a reorganization as a part of our ongoing strategy to simplify our portfolio, optimize our cost structure, and reduce our carbon intensity. Reflecting this simplified portfolio, we will manage our global operations separate from our growth and commercial activities.
Overview of 2017 Results and Strategic Performance
Earnings Per Share and Free Cash Flow Results in 2017 (in millions, except per share amounts)
| Years Ended December 31, | 2017 | 2016 | 2015 | ||||||||
| Diluted earnings (loss) per share from continuing operations | $ | (0.77 | ) | $ | (0.04 | ) | $ | 0.46 | |||
| Adjusted EPS (a non-GAAP measure) (1) | 1.08 | 0.94 | 1.24 | ||||||||
| Net cash provided by operating activities | 2,489 | 2,884 | 2,134 | ||||||||
| Free Cash Flow (a non-GAAP measure) (1) | 1,921 | 2,244 | 1,628 |
| (1) | See reconciliation and definition under SBU Performance Analysis—Non-GAAP Measures. |
Diluted loss per share from continuing operations increased to a loss per share of $0.77 primarily due to a higher effective tax rate as a result of the U.S. Tax Reform Law enacted on December 22, 2017, partially offset by prior year impairments at DPL.
Adjusted EPS, a non-GAAP measure, increased by 15% to $1.08 primarily driven by higher margins at our MCAC SBU, contributions from new solar projects in the US, a one-time allowance on a non-trade receivable recognized in 2016, and the favorable impact of the YPF legal settlement at AES Uruguaiana, which was partially offset by higher adjusted effective tax rate.
Net cash provided by operating activities decreased by 14% to $2.5 billion primarily driven the collection of $360 million of overdue receivables at Maritza in 2016 and additional investments in working capital at Eletropaulo of $189 million. These decreases were partially offset by the $98 million increase in operating margin, excluding non cash drivers, at the Andes SBU.
Free Cash Flow, a non-GAAP measure, decreased by 14% to $1.9 billion primarily driven by a $395 million decrease in net cash provided by operating activities.
Review of Consolidated Results of Operations
| Years Ended December 31, | 2017 | 2016 | 2015 | % Change 2017 vs. 2016 | % Change 2016 vs. 2015 | ||||||||||||
| (in millions, except per share amounts) | |||||||||||||||||
| Revenue: | |||||||||||||||||
| US SBU | $ | 3,229 | $ | 3,429 | $ | 3,593 | -6 | % | -5 | % | |||||||
| Andes SBU | 2,710 | 2,506 | 2,489 | 8 | % | 1 | % | ||||||||||
| Brazil SBU | 542 | 450 | 962 | 20 | % | -53 | % | ||||||||||
| MCAC SBU | 2,448 | 2,172 | 2,353 | 13 | % | -8 | % | ||||||||||
| Eurasia SBU | 1,590 | 1,670 | 1,875 | -5 | % | -11 | % | ||||||||||
| Corporate and Other | 35 | 77 | 31 | -55 | % | NM | |||||||||||
| Intersegment eliminations | (24 | ) | (23 | ) | (43 | ) | -4 | % | 47 | % | |||||||
| Total Revenue | 10,530 | 10,281 | 11,260 | 2 | % | -9 | % | ||||||||||
| Operating Margin: | |||||||||||||||||
| US SBU | 567 | 582 | 621 | -3 | % | -6 | % | ||||||||||
| Andes SBU | 658 | 634 | 618 | 4 | % | 3 | % | ||||||||||
| Brazil SBU | 203 | 186 | 397 | 9 | % | -53 | % | ||||||||||
| MCAC SBU | 589 | 523 | 543 | 13 | % | -4 | % | ||||||||||
| Eurasia SBU | 423 | 429 | 452 | -1 | % | -5 | % | ||||||||||
| Corporate and Other | 23 | 15 | 33 | 53 | % | -55 | % | ||||||||||
| Intersegment eliminations | 1 | 11 | (1 | ) | 91 | % | NM | ||||||||||
| Total Operating Margin | 2,464 | 2,380 | 2,663 | 4 | % | -11 | % | ||||||||||
| General and administrative expenses | (215 | ) | (194 | ) | (196 | ) | 11 | % | -1 | % | |||||||
| Interest expense | (1,170 | ) | (1,134 | ) | (1,145 | ) | 3 | % | -1 | % | |||||||
| Interest income | 244 | 245 | 256 | — | % | -4 | % | ||||||||||
| Loss on extinguishment of debt | (68 | ) | (13 | ) | (182 | ) | NM | -93 | % | ||||||||
| Other expense | (57 | ) | (79 | ) | (24 | ) | -28 | % | NM | ||||||||
| Other income | 120 | 64 | 84 | 88 | % | -24 | % | ||||||||||
| Gain (loss) on disposal and sale of businesses | (52 | ) | 29 | 29 | NM | — | % | ||||||||||
| Goodwill impairment expense | — | — | (317 | ) | — | % | -100 | % | |||||||||
| Asset impairment expense | (537 | ) | (1,096 | ) | (285 | ) | -51 | % | NM | ||||||||
| Foreign currency transaction gains (losses) | 42 | (15 | ) | 106 | NM | NM | |||||||||||
| Income tax expense | (990 | ) | (32 | ) | (412 | ) | NM | -92 | % | ||||||||
| Net equity in earnings of affiliates | 71 | 36 | 105 | 97 | % | -66 | % | ||||||||||
| INCOME (LOSS) FROM CONTINUING OPERATIONS | (148 | ) | 191 | 682 | NM | -72 | % | ||||||||||
| Income (loss) from operations of discontinued businesses | (18 | ) | 151 | 80 | NM | 89 | % | ||||||||||
| Net loss from disposal and impairments of discontinued operations | (611 | ) | (1,119 | ) | — | -45 | % | NM | |||||||||
| NET INCOME (LOSS) | (777 | ) | (777 | ) | 762 | — | % | NM | |||||||||
| Noncontrolling interests: | |||||||||||||||||
| Less: Income from continuing operations attributable to noncontrolling interests and redeemable stock of subsidiaries | (359 | ) | (211 | ) | (364 | ) | 70 | % | -42 | % | |||||||
| Less: Income from discontinued operations attributable to noncontrolling interests | (25 | ) | (142 | ) | (92 | ) | -82 | % | 54 | % | |||||||
| NET INCOME (LOSS) ATTRIBUTABLE TO THE AES CORPORATION | $ | (1,161 | ) | $ | (1,130 | ) | $ | 306 | 3 | % | NM | ||||||
| AMOUNTS ATTRIBUTABLE TO THE AES CORPORATION COMMON STOCKHOLDERS: | |||||||||||||||||
| Income (loss) f |
Showing the first 8K of 169K characters. Open the full section
Item 7A. QUANTITATIVE AND QUALITATIVE DISCLOSURES ABOUT MARKET RISK
Overview Regarding Market Risks — Our businesses are exposed to and proactively manage market risk. Our primary market risk exposure is to the price of commodities, particularly electricity, oil, natural gas, coal and environmental credits. In addition, our businesses are also exposed to lower electricity prices due to increased competition, including from renewable sources such as wind and solar, as a result of lower costs of entry and lower variable costs. We operate in multiple countries and as such are subject to volatility in exchange rates at varying degrees at the subsidiary level and between our functional currency, the U.S. dollar, and currencies of the countries in which we operate. We are also exposed to interest rate fluctuations due to our issuance of debt and related financial instruments.
The disclosures presented in this Item 7A are based upon a number of assumptions; actual effects may differ. The safe harbor provided in Section 27A of the Securities Act of 1933 and Section 21E of the Securities Exchange Act of 1934 shall apply to the disclosures contained in this Item 7A. For further information regarding market risk, see Item 1A.—Risk Factors, Our financial position and results of operations may fluctuate significantly due to fluctuations in currency exchange rates experienced at our foreign operations, Our businesses may incur substantial costs and liabilities and be exposed to price volatility as a result of risks associated with the electricity markets, which could have a material adverse effect on our financial performance, and We may not be adequately hedged against our exposure to changes in commodity prices or interest rates of this 2017 Form 10-K.
Commodity Price Risk — Although we prefer to hedge our exposure to the impact of market fluctuations in the price of electricity, fuels and environmental credits, some of our generation businesses operate under short-term sales or under contract sales that leave an unhedged exposure on some of our capacity or through imperfect fuel pass-throughs. In our utility businesses, we may be exposed to commodity price movements depending on our excess or shortfall of generation relative to load obligations and sharing or pass-through mechanisms. These businesses subject our operational results to the volatility of prices for electricity, fuels and environmental credits in competitive markets. We employ risk management strategies to hedge our financial performance against the effects of fluctuations in energy commodity prices. The implementation of these strategies can involve the use of physical and financial commodity contracts, futures, swaps and options.
The portion of our sales and purchases that are not subject to such agreements or contracted businesses where indexation is not perfectly matched to business drivers will be exposed to commodity price risk. When hedging the output of our generation assets, we utilize contract sales that lock in the spread per MWh between variable costs and the price at which the electricity can be sold.
AES businesses will see changes in variable margin performance as global commodity prices shift. For 2018, we project pre-tax earnings exposure on a 10% move in commodity prices would be approximately $10 million for U.S. power (DPL), less than $5 million for natural gas, $5 million for oil and $5 million for coal. Our estimates exclude correlation of oil with coal or natural gas. For example, a decline in oil or natural gas prices can be accompanied by a decline in coal price if commodity prices are correlated. In aggregate, the Company's downside exposure occurs with lower oil, lower natural gas, and higher coal prices. Exposures at individual businesses will change as new contracts or financial hedges are executed, and our sensitivity to changes in commodity prices generally increases in later years with reduced hedge levels at some of our businesses.
Commodity prices affect our businesses differently depending on the local market characteristics and risk management strategies. Spot power prices, contract indexation provisions and generation costs can be directly or indirectly affected by movements in the price of natural gas, oil and coal. We have some natural offsets across our businesses such that low commodity prices may benefit certain businesses and be a cost to others. Exposures are not perfectly linear or symmetric. The sensitivities are affected by a number of local or indirect market factors. Examples of these factors include hydrology, local energy market supply/demand balances, regional fuel supply issues, regional competition, bidding strategies and regulatory interventions such as price caps. Operational flexibility changes the shape of our sensitivities. For instance, certain power plants may limit downside exposure by reducing dispatch in low market environments. Volume variation also affects our commodity exposure. The volume sold under contracts or retail concessions can vary based on weather and economic conditions resulting in a higher or lower volume of sales in spot markets. Thermal unit availability and hydrology can affect the generation output available for sale and can affect the marginal unit setting power prices.
In the US SBU, the generation businesses are largely contracted but may have residual risk to the extent contracts are not perfectly indexed to the business drivers. IPL primarily generates energy to meet its retail customer demand; however, it opportunistically sells surplus economic energy into wholesale markets at market prices. Additionally, at DPL, competitive retail markets permit our customers to select alternative energy suppliers or elect to remain in aggregated customer pools for which energy is supplied by third party suppliers through a
competitive auction process. DPL participates in these auctions held by other utilities and sells the remainder of its economic energy into the wholesale market. Given that natural gas-fired generators generally get energy prices for many markets, higher natural gas prices tend to expand our coal fixed margins. Our non-contracted generation margins are impacted by many factors, including the growth in natural gas-fired generation plants, new energy supply from renewable sources, and increasing energy efficiency.
In the Andes SBU, our business in Chile owns assets in the central and northern regions of the country and has a portfolio of contract sales in both. In the central region, the contract sales generally cover the efficient generation from our coal-fired and hydroelectric assets. Any residual spot price risk will primarily be driven by the amount of hydrological inflows. In the case of low hydroelectric generation, spot price exposure is capped by the ability to dispatch our natural gas/diesel assets, the price of which depends on fuel pricing at the time required. There is a small amount of coal generation in the northern region that is not covered by the portfolio of contract sales and therefore subject to spot price risk. In both regions, generators with oil or oil-linked fuel generally set power prices. In Colombia, we operate under a short-term sales strategy and have commodity exposure to unhedged volumes. Because we own hydroelectric assets there, contracts are not indexed to fuel.
In the Brazil SBU, the hydroelectric generating facility is covered by contract sales. Under normal hydrological volatility, spot price risk is mitigated through a regulated sharing mechanism across all hydroelectric generators in the country. Under drier conditions, the sharing mechanism may not be sufficient to cover the business' contract position, and therefore it may have to purchase power at spot prices driven by the cost of thermal generation.
In the MCAC SBU, our businesses have commodity exposure on unhedged volumes. Panama is highly contracted under a portfolio of fixed volume contract sales. To the extent hydrological inflows are greater than or less than the contract sales volume, the business will be sensitive to changes in spot power prices which may be driven by oil prices in some time periods. In the Dominican Republic, we own natural gas-fired assets contracted under a portfolio of contract sales and a coal-fired asset contracted with a single contract, and both contract and spot prices may move with commodity prices. Additionally, the contract levels do not always match our generation availability and our assets may be sellers of spot prices in excess of contract levels or a net buyer in the spot market to satisfy contract obligations.
In the Eurasia SBU, our Kilroot facility operates on a short-term sales strategy. To the extent that sales are unhedged, the commodity risk at our Kilroot business is to the clean dark spread, which is the difference between electricity price and our coal-based variable dispatch cost, including emissions. Natural gas-fired generators set power prices for many periods, so higher natural gas prices generally expand margins and higher coal or emissions prices reduce them. Similarly, increased wind generators displace higher cost generation, reducing Kilroot's margins, and vice versa. Two coal-fired generating units at Kilroot and one steam gas generating unit at Ballylumford are expected to close by the end of May 2018 as a result of unfavorable capacity market conditions in Northern Ireland. The remaining steam gas generating unit at Ballylumford and the OCGTs at both Ballylumford and Kilroot will continue to operate as peaking units at times of high demand. Our Masinloc business is a coal-fired generation facility which hedges its output under a portfolio of contract sales that are indexed to fuel prices, with generation in excess of contract volume or shortfalls of generation relative to contract volumes settled in the spot market. Low oil prices may be a driver of margin compression since oil affects spot power sale prices sold in the spot market. Our Mong Duong business has minimal exposure to commodity price risk as it has no merchant exposure and fuel is subject to a pass-through mechanism.
Foreign Exchange Rate Risk — In the normal course of business, we are exposed to foreign currency risk and other foreign operations risks that arise from investments in foreign subsidiaries and affiliates. A key component of these risks stems from the fact that some of our foreign subsidiaries and affiliates utilize currencies other than our consolidated reporting currency, the U.S. dollar ("USD"). Additionally, certain of our foreign subsidiaries and affiliates have entered into monetary obligations in USD or currencies other than their own functional currencies. We have varying degrees of exposure to changes in the exchange rate between the USD and the following currencies: Argentine peso, British pound, Brazilian real, Chilean peso, Colombian peso, Dominican peso, Euro, Indian rupee, and Mexican peso. These subsidiaries and affiliates have attempted to limit potential foreign exchange exposure by entering into revenue contracts that adjust to changes in foreign exchange rates. We also use foreign currency forwards, swaps and options, where possible, to manage our risk related to certain foreign currency fluctuations.
AES enters into cash flow hedges to protect economic value of the business and minimize impact of foreign exchange rate fluctuations to AES' portfolio. While protecting cash flows, the hedging strategy is also designed to reduce forward-looking earnings foreign exchange volatility. Due to variation of timing and amount between cash distribution and earnings exposure, the hedge impact may not fully cover the earnings exposure on a realized basis, which could result in greater volatility in earnings. The largest foreign exchange risks over a 12-month forward-
looking period stem from the following currencies: Brazilian real, Euro, and British pound. As of December 31, 2017, assuming a 10% USD appreciation, cash distributions attributable to foreign subsidiaries exposed to movement in the exchange rate of the Brazilian real, Euro, and British pound each is projected to be reduced by less than $5 million. These numbers have been produced by applying a one-time 10% USD appreciation to forecasted exposed cash distributions for 2018 coming from the respective subsidiaries exposed to the currencies listed above, net of the impact of outstanding hedges and holding all other variables constant. The numbers presented above are net of any transactional gains/losses. These sensitivities may change in the future as new hedges are executed or existing hedges are unwound. Additionally, updates to the forecasted cash distributions exposed to foreign exchange risk may result in further modification. The sensitivities presented do not capture the impacts of any administrative market restrictions or currency inconvertibility.
Interest Rate Risks — We are exposed to risk resulting from changes in interest rates as a result of our issuance of variable and fixed-rate debt, as well as interest rate swap, cap, floor and option agreements.
Decisions on the fixed-floating debt mix are made to be consistent with the risk factors faced by individual businesses or plants. Depending on whether a plant's capacity payments or revenue stream is fixed or varies with inflation, we partially hedge against interest rate fluctuations by arranging fixed-rate or variable-rate financing. In certain cases, particularly for non-recourse financing, we execute interest rate swap, cap and floor agreements to effectively fix or limit the interest rate exposure on the underlying financing. Most of our interest rate risk is related to non-recourse financings at our businesses.
As of December 31, 2017, the portfolio's pre-tax earnings exposure for 2018 to a one-time 100-basis-point increase in interest rates for our Argentine peso, Brazilian real, Chilean peso, Colombian peso, Euro and USD denominated debt would be approximately $25 million on interest expense for the debt denominated in these currencies. These amounts do not take into account the historical correlation between these interest rates.
Item 8. FINANCIAL STATEMENTS AND SUPPLEMENTARY DATA
REPORT OF INDEPENDENT REGISTERED PUBLIC ACCOUNTING FIRM
To the Stockholders and the Board of Directors of The AES Corporation:
Opinion on the Financial Statements
We have audited the accompanying consolidated balance sheets of The AES Corporation (the Company) as of December 31, 2017 and 2016, and the related consolidated statements of operations, comprehensive loss, changes in equity, and cash flows for each of the three years in the period ended December 31, 2017, and the related notes and the financial statement schedule listed in the Index at Item 15(a) (collectively referred to as the “financial statements”). In our opinion, the financial statements referred to above present fairly, in all material respects, the consolidated financial position of the Company at December 31, 2017 and 2016, and the consolidated results of its operations and its cash flows for each of the three years in the period ended December 31, 2017, in conformity with U.S. generally accepted accounting principles.
We also have audited, in accordance with the standards of the Public Company Accounting Oversight Board (United States) (PCAOB), the Company’s internal control over financial reporting as of December 31, 2017, based on criteria established in Internal Control — Integrated Framework issued by the Committee of Sponsoring Organizations of the Treadway Commission (2013 framework) and our report dated February 26, 2018, expressed an unqualified opinion thereon.
Basis for Opinion
These financial statements are the responsibility of the Company’s management. Our responsibility is to express an opinion on the Company’s financial statements based on our audits. We are a public accounting firm registered with the PCAOB and are required to be independent with respect to the Company in accordance with the U.S. federal securities laws and the applicable rules and regulations of the Securities and Exchange Commission and the PCAOB.
We conducted our audits in accordance with the standards of the PCAOB. Those standards require that we plan and perform the audit to obtain reasonable assurance about whether the financial statements are free of material misstatement, whether due to error or fraud. Our audits included performing procedures to assess the risks of material misstatement of the financial statements, whether due to error or fraud, and performing procedures that respond to those risks. Such procedures include examining, on a test basis, evidence regarding the amounts and disclosures in the financial statements. Our audits also included evaluating the accounting principles used and significant estimates made by management, as well as evaluating the overall presentation of the financial statements. We believe that our audits provide a reasonable basis for our opinion.
/s/ Ernst & Young LLP
We have served as the Company's auditor since 2008.
Tysons, Virginia
February 26, 2018
THE AES CORPORATION
CONSOLIDATED BALANCE SHEETS
DECEMBER 31, 2017 AND 2016
| 2017 | 2016 | ||||||
| (in millions, except share and per share data) | |||||||
| ASSETS | |||||||
| CURRENT ASSETS | |||||||
| Cash and cash equivalents | $ | 949 | $ | 1,244 | |||
| Restricted cash | 274 | 277 | |||||
| Short-term investments | 424 | 530 | |||||
| Accounts receivable, net of allowance for doubtful accounts of $10 and $17, respectively | 1,463 | 1,421 | |||||
| Inventory | 562 | 622 | |||||
| Prepaid expenses | 62 | 72 | |||||
| Other current assets | 630 | 657 | |||||
| Current assets of discontinued operations and held-for-sale businesses | 2,034 | 1,593 | |||||
| Total current assets | 6,398 | 6,416 | |||||
| NONCURRENT ASSETS | |||||||
| Property, Plant and Equipment: | |||||||
| Land | 502 | 518 | |||||
| Electric generation, distribution assets and other | 24,119 | 24,911 | |||||
| Accumulated depreciation | (7,942 | ) | (7,919 | ) | |||
| Construction in progress | 3,617 | 2,905 | |||||
| Property, plant and equipment, net | 20,296 | 20,415 | |||||
| Other Assets: | |||||||
| Investments in and advances to affiliates | 1,197 | 621 | |||||
| Debt service reserves and other deposits | 565 | 438 | |||||
| Goodwill | 1,059 | 1,157 | |||||
| Other intangible assets, net of accumulated amortization of $441 and $399, respectively | 366 | 287 | |||||
| Deferred income taxes | 130 | 227 | |||||
| Service concession assets, net of accumulated amortization of $206 and $114, respectively | 1,360 | 1,445 | |||||
| Other noncurrent assets | 1,741 | 1,775 | |||||
| Noncurrent assets of discontinued operations and held-for-sale businesses | — | 3,343 | |||||
| Total other assets | 6,418 | 9,293 | |||||
| TOTAL ASSETS | $ | 33,112 | $ | 36,124 | |||
| LIABILITIES AND EQUITY | |||||||
| CURRENT LIABILITIES | |||||||
| Accounts payable | $ | 1,371 | $ | 1,238 | |||
| Accrued interest | 228 | 216 | |||||
| Accrued and other liabilities | 1,232 | 1,117 | |||||
| Non-recourse debt, including $1,012 and $273, respectively, related to variable interest entities | 2,164 | 1,052 | |||||
| Current liabilities of discontinued operations and held-for-sale businesses | 1,033 | 1,654 | |||||
| Total current liabilities | 6,028 | 5,277 | |||||
| NONCURRENT LIABILITIES | |||||||
| Recourse debt | 4,625 | 4,671 | |||||
| Non-recourse debt, including $1,358 and $1,502 respectively, related to variable interest entities | 13,176 | 13,731 | |||||
| Deferred income taxes | 1,006 | 804 | |||||
| Pension and other postretirement liabilities | 230 | 237 | |||||
| Other noncurrent liabilities | 2,365 | 2,327 | |||||
| Noncurrent liabilities of discontinued operations and held-for-sale businesses | — | 2,595 | |||||
| Total noncurrent liabilities | 21,402 | 24,365 | |||||
| Commitments and Contingencies (see Notes 11 and 12) | |||||||
| Redeemable stock of subsidiaries | 837 | 782 | |||||
| EQUITY | |||||||
| THE AES CORPORATION STOCKHOLDERS’ EQUITY | |||||||
| Common stock ($0.01 par value, 1,200,000,000 shares authorized; 816,312,913 issued and 660,388,128 outstanding at December 31, 2017 and 816,061,123 issued and 659,182,232 outstanding at December 31, 2016) | 8 | 8 | |||||
| Additional paid-in capital | 8,501 | 8,592 | |||||
| Accumulated deficit | (2,276 | ) | (1,146 | ) | |||
| Accumulated other comprehensive loss | (1,876 | ) | (2,756 | ) | |||
| Treasury stock, at cost (155,924,785 and 156,878,891 shares at December 31, 2017 and 2016, respectively) | (1,892 | ) | (1,904 | ) | |||
| Total AES Corporation stockholders’ equity | 2,465 | 2,794 | |||||
| NONCONTROLLING INTERESTS | 2,380 | 2,906 | |||||
| Total equity | 4,845 | 5,700 | |||||
| TOTAL LIABILITIES AND EQUITY | $ | 33,112 | $ | 36,124 |
See Accompanying Notes to Consolidated Financial Statements.
THE AES CORPORATION
CONSOLIDATED STATEMENTS OF OPERATIONS
YEARS ENDED DECEMBER 31, 2017, 2016, AND 2015
| 2017 | 2016 | 2015 | |||||||||
| (in millions, except per share amounts) | |||||||||||
| Revenue: | |||||||||||
| Regulated | $ | 3,109 | $ | 3,310 | $ | 3,240 | |||||
| Non-Regulated | 7,421 | 6,971 | 8,020 | ||||||||
| Total revenue | 10,530 | 10,281 | 11,260 |
Showing the first 8K of 311K characters. Open the full section
Item 9. CHANGES IN AND DISAGREEMENTS WITH ACCOUNTANTS ON ACCOUNTING AND FINANCIAL DISCLOSURE
None.
Item 9A. CONTROLS AND PROCEDURES
Conclusion Regarding the Effectiveness of Disclosure Controls and Procedures
The Company maintains disclosure controls and procedures that are designed to ensure that information required to be disclosed in the reports that the Company files or submits under the Securities Exchange Act of 1934, as amended (the "Exchange Act") is recorded, processed, summarized and reported within the time periods specified in the SEC's rules and forms, and that such information is accumulated and communicated to the CEO and CFO, as appropriate, to allow timely decisions regarding required disclosures.
The Company carried out the evaluation required by Rules 13a-15(b) and 15d-15(b), under the supervision and with the participation of our management, including the CEO and CFO, of the effectiveness of our “disclosure controls and procedures” (as defined in the Exchange Act Rules 13a-15(e) and 15d-15(e)). Based upon this evaluation, the CEO and CFO concluded that as of December 31, 2017, our disclosure controls and procedures were effective.
On August 3, 2017, AES completed the acquisition of the Wind Farm Alto Sertão II and as a result, assets acquired and liabilities assumed in the acquisition have been included in AES’s consolidated balance sheet as of December 31, 2017. Alto Sertão II’s total assets and total liabilities represented 1.5% and 1.4% of AES’s consolidated total assets and total liabilities, respectively, as of December 31, 2017. Alto Sertão II’s net income of $2.9 million for the period August 3, 2017 through December 31, 2017 was included in AES’s consolidated statement of operations for the year ended December 31, 2017. As permitted by the SEC guidance, Alto Sertão II’s internal controls over financial reporting have been excluded from management’s formal evaluation of the effectiveness of AES’s disclosure controls and procedures due to the timing of acquisition.
Management's Report on Internal Control over Financial Reporting
Management of the Company is responsible for establishing and maintaining adequate internal control over financial reporting, as defined in Rule 13a-15(f) under the Exchange Act. The Company's internal control over financial reporting is a process designed to provide reasonable assurance regarding the reliability of financial reporting and the preparation of financial statements for external purposes in accordance with GAAP and includes those policies and procedures that:
| • | pertain to the maintenance of records that in reasonable detail, accurately and fairly reflect the transactions and dispositions of the assets of the Company; |
| • | provide reasonable assurance that transactions are recorded as necessary to permit preparation of financial statements in accordance with GAAP, and that receipts and expenditures of the Company are being made only in accordance with authorizations of management and directors of the Company; and |
| • | provide reasonable assurance that unauthorized acquisition, use or disposition of the Company's assets that could have a material effect on the financial statements are prevented or detected timely. |
Management, including our CEO and CFO, does not expect that our internal controls will prevent or detect all errors and all fraud. A control system, no matter how well designed and operated, can provide only reasonable, not absolute, assurance that the objectives of the control system are met. Further, the design of a control system must reflect the fact that there are resource constraints, and the benefits of controls must be considered relative to their costs. In addition, any evaluation of the effectiveness of controls is subject to risks that those internal controls may become inadequate in future periods because of changes in business conditions, or that the degree of compliance with the policies or procedures deteriorates.
Management assessed the effectiveness of our internal control over financial reporting as of December 31, 2017. In making this assessment, management used the criteria established in Internal Control—Integrated Framework issued by the Committee of Sponsoring Organizations of the Treadway Commission ("COSO") in 2013. Based on this assessment, management believes that the Company maintained effective internal control over financial reporting as of December 31, 2017.
The effectiveness of the Company's internal control over financial reporting as of December 31, 2017, has been audited by Ernst & Young LLP, an independent registered public accounting firm, as stated in their report, which appears herein.
Changes in Internal Control Over Financial Reporting:
There were no changes that occurred during the quarter ended December 31, 2017 that have materially affected, or are reasonably likely to materially affect, our internal control over financial reporting.
REPORT OF INDEPENDENT REGISTERED PUBLIC ACCOUNTING FIRM
To the Stockholders and the Board of Directors of The AES Corporation:
Opinion on Internal Control over Financial Reporting
We have audited The AES Corporation’s internal control over financial reporting as of December 31, 2017, based on criteria established in Internal Control — Integrated Framework issued by the Committee of Sponsoring Organizations of the Treadway Commission (2013 framework) (the COSO criteria). In our opinion, The AES Corporation (the Company) maintained, in all material respects, effective internal control over financial reporting as of December 31, 2017, based on the COSO criteria.
As indicated in the accompanying Item 9A, Management’s Report on Internal Control over Financial Reporting, management’s assessment of and conclusion on the effectiveness of internal control over financial reporting did not include the internal controls of Alto Sertão II, which is included in the 2017 consolidated financial statements of the Company and constituted 1.5% and 1.9% of total and net assets, respectively, as of December 31, 2017. Alto Sertão II's net income of $2.9 million for the period August 3, 2017 through December 31, 2017 was included in the Company's consolidated statement of operations for the year then ended. Our audit of internal control over financial reporting of the Company also did not include an evaluation of the internal control over financial reporting of Alto Sertão II.
We also have audited, in accordance with the standards of the Public Company Accounting Oversight Board (United States) (PCAOB), the consolidated balance sheets of the Company as of December 31, 2017 and 2016, and the related consolidated statements of operations, comprehensive loss, changes in equity, and cash flows for each of the three years in the period ended December 31, 2017, of the Company, and the related notes and financial statement schedule listed in the Index at Item 15(a) (collectively referred to as the “financial statements”), and our report dated February 26, 2018, expressed an unqualified opinion thereon.
Basis for Opinion
The Company’s management is responsible for maintaining effective internal control over financial reporting and for its assessment of the effectiveness of internal control over financial reporting included in the accompanying Management’s Report on Internal Control over Financial Reporting. Our responsibility is to express an opinion on the Company’s internal control over financial reporting based on our audit. We are a public accounting firm registered with the PCAOB and are required to be independent with respect to the Company in accordance with the U.S. federal securities laws and the applicable rules and regulations of the Securities and Exchange Commission and the PCAOB.
We conducted our audit in accordance with the standards of the PCAOB. Those standards require that we plan and perform the audit to obtain reasonable assurance about whether effective internal control over financial reporting was maintained in all material respects.
Our audit included obtaining an understanding of internal control over financial reporting, assessing the risk that a material weakness exists, testing and evaluating the design and operating effectiveness of internal control based on the assessed risk, and performing such other procedures as we considered necessary in the circumstances. We believe that our audit provides a reasonable basis for our opinion.
Definition and Limitations of Internal Control Over Financial Reporting
A company’s internal control over financial reporting is a process designed to provide reasonable assurance regarding the reliability of financial reporting and the preparation of financial statements for external purposes in accordance with generally accepted accounting principles. A company’s internal control over financial reporting includes those policies and procedures that (1) pertain to the maintenance of records that, in reasonable detail, accurately and fairly reflect the transactions and dispositions of the assets of the company; (2) provide reasonable assurance that transactions are recorded as necessary to permit preparation of financial statements in accordance with generally accepted accounting principles, and that receipts and expenditures of the company are being made only in accordance with authorizations of management and directors of the company; and (3) provide reasonable assurance regarding prevention or timely detection of unauthorized acquisition, use, or disposition of the company’s assets that could have a material effect on the financial statements.
Because of its inherent limitations, internal control over financial reporting may not prevent or detect misstatements. Also, projections of any evaluation of effectiveness to future periods are subject to the risk that controls may become inadequate because of changes in conditions, or that the degree of compliance with the policies or procedures may deteriorate.
/s/ Ernst & Young LLP
Tysons, Virginia
February 26, 2018
Item 9B. OTHER INFORMATION
None.
PART III
Item 10. DIRECTORS, EXECUTIVE OFFICERS AND CORPORATE GOVERNANCE
The following information is incorporated by reference from the Registrant's Proxy Statement for the Registrant's 2018 Annual Meeting of Stockholders which the Registrant expects will be filed on or around March 9, 2018 (the "2018 Proxy Statement"):
| • | information regarding the directors required by this item found under the heading Board of Directors; |
| • | information regarding AES' Code of Ethics found under the heading Additional Governance Matters - AES Code of Business Conduct and Corporate Governance Guidelines; |
| • | information regarding compliance with Section 16 of the Exchange Act required by this item found under the heading Additional Governance Matters - Other Governance Information - Section 16(a) Beneficial Ownership Reporting Compliance; and |
| • | information regarding AES' Financial Audit Committee found under the heading Board and Committee Governance Matters - Financial Audit Committee (the “Audit Committee”). |
Certain information regarding executive officers required by this Item is presented as a supplementary item in Part I hereof (pursuant to Instruction 3 to Item 401(b) of Regulation S-K). The other information required by this Item, to the extent not included above, will be contained in our 2018 Proxy Statement and is herein incorporated by reference.
Item 11. EXECUTIVE COMPENSATION
The information required by Item 402 of Regulation S-K is contained in the 2018 Proxy Statement under "Director Compensation" and "Executive Compensation" (excluding the information under the caption “Report of the Compensation Committee”) and is incorporated herein by reference.
The information required by Item 407(e)(5) of Regulation S-K is contained under the caption “Report of the Compensation Committee Report” of the Proxy Statement. Such information shall not be deemed to be “filed.”
Item 12. SECURITY OWNERSHIP OF CERTAIN BENEFICIAL OWNERS AND MANAGEMENT AND RELATED STOCKHOLDER MATTERS
| (a) | Security Ownership of Certain Beneficial Owners and Management. |
See the information contained under the heading Security Ownership of Certain Beneficial Owners, Directors, and Executive Officers of the 2018 Proxy Statement, which information is incorporated herein by reference.
| (b) | Securities Authorized for Issuance under Equity Compensation Plans. |
The following table provides information about shares of AES common stock that may be issued under AES' equity compensation plans, as of December 31, 2017:
Securities Authorized for Issuance under Equity Compensation Plans (As of December 31, 2017)
| (a) | (b) | (c) | |||||||
| Plan category | Number of securities to be issued upon exercise of outstanding options, warrants and rights | Weighted average exercise price of outstanding options, warrants and rights | Number of securities remaining available for future issuance under equity compensation plans (excluding securities reflected in column (a)) | ||||||
| Equity compensation plans approved by security holders (1) | 11,490,439 | (2) | $ | 12.75 | 15,290,314 | ||||
| Equity compensation plans not approved by security holders | — | — | — | ||||||
| Total | 11,490,439 | $ | 12.75 | 15,290,314 |
| (1) | The following equity compensation plans have been approved by The AES Corporation's Stockholders: |
| (A) | The AES Corporation 2003 Long Term Compensation Plan was adopted in 2003 and provided for 17,000,000 shares authorized for issuance thereunder. In 2008, an amendment to the Plan to provide an additional 12,000,000 shares was approved by AES' stockholders, bringing the total authorized shares to 29,000,000. In 2010, an additional amendment to the Plan to provide an additional 9,000,000 shares was approved by AES' stockholders, bringing the total authorized shares to 38,000,000. In 2015, an additional amendment to the Plan to provide an additional 7,750,000 shares was approved by AES' stockholders, bringing the total authorized shares to 45,750,000. The weighted average exercise price of Options outstanding under this plan included in Column (b) is $12.75 (excluding performance stock units, restricted stock units and director stock units), with 15,290,314 shares available for future issuance). |
| (B) | The AES Corporation 2001 Plan for outside directors adopted in 2001 provided for 2,750,000 shares authorized for issuance. There are no Options outstanding under this plan. In conjunction with the 2010 amendment to the 2003 Long Term Compensation plan, ongoing award issuance from this plan was discontinued in 2010. Any remaining shares under this plan, which are not reserved for |
issuance under outstanding awards, are not available for future issuance and thus the amount of 2,088,633 shares is not included in Column (c) above.
| (C) | The AES Corporation Second Amended and Restated Deferred Compensation Plan for directors provided for 2,000,000 shares authorized for issuance. Column (b) excludes the Director stock units granted thereunder. In conjunction with the 2010 amendment to the 2003 Long Term Compensation Plan, ongoing award issuance from this plan was discontinued in 2010 as Director stock units will be issued from the 2003 Long Term Compensation Plan. Any remaining shares under this plan, which are not reserved for issuance under outstanding awards, are not available for future issuance and thus the amount of 105,341 shares is not included in Column (c) above. |
| (2) | Includes 4,678,447 (of which 575,721 are vested and 4,102,726 are unvested) shares underlying PSU and RSU awards (assuming performance at a median level), 1,642,551 shares underlying Director stock unit awards, and 5,169,441 shares issuable upon the exercise of Stock Option grants, for an aggregate number of 11,490,439 shares. |
Item 13. CERTAIN RELATIONSHIPS AND RELATED PARTY TRANSACTIONS, AND DIRECTOR INDEPENDENCE
The information regarding related party transactions required by this item is included in the 2018 Proxy Statement found under the headings Transactions with Related Persons and Board and Committee Governance Matters and are incorporated herein by reference.
Item 14. PRINCIPAL ACCOUNTANT FEES AND SERVICES
The information required by this Item 14 is included in the 2018 Proxy Statement under the headings Information Regarding The Independent Registered Public Accounting Firm, Audit Fees, Audit Related Fees, and Pre-Approval Policies and Procedures and is incorporated herein by reference.
PART IV
Item 15. EXHIBITS AND FINANCIAL STATEMENT SCHEDULES
| (a) | Financial Statements. |
| (b) | Exhibits. |
| (c) | Schedules |
Schedule I—Financial Information of Registrant
SIGNATURES
Pursuant to the requirements of Section 13 or 15(d) of the Securities Exchange Act of 1934, as amended, the Company has duly caused this report to be signed on its behalf by the undersigned, thereunto duly authorized.
| THE AES CORPORATION (Company) | ||||
| Date: | February 26, 2018 | By: | /s/ ANDRÉS GLUSKI | |
| Name: | Andrés Gluski | |||
| President, Chief Executive Officer |
Pursuant to the requirements of the Securities Exchange Act of 1934, as amended, this report has been signed below by the following persons on behalf of the Company and in the capacities and on the dates indicated.
| Name | Title | Date | ||
| * | President, Chief Executive Officer (Principal Executive Officer) and Director | |||
| Andrés Gluski | February 26, 2018 | |||
| * | Director | |||
| Charles L. Harrington | February 26, 2018 | |||
| * | Director | |||
| Kristina M. Johnson | February 26, 2018 | |||
| * | Director | |||
| Tarun Khanna | February 26, 2018 | |||
| * | Director | |||
| Holly K. Koeppel | February 26, 2018 | |||
| * | Director | |||
| James H. Miller | February 26, 2018 | |||
| * | Director | |||
| Alain Monié | February 26, 2018 | |||
| * | Director | |||
| John B. Morse | February 26, 2018 | |||
| * | Director | |||
| Moises Naim | February 26, 2018 | |||
| * | Chairman of the Board and Lead Independent Director | |||
| Charles O. Rossotti | February 26, 2018 | |||
| * | Director | |||
| Jeffrey W. Ubben | February 26, 2018 | |||
| /s/ THOMAS M. O'FLYNN | Executive Vice President and Chief Financial Officer (Principal Financial Officer) | |||
| Thomas M. O'Flynn | February 26, 2018 | |||
| /s/ SARAH R. BLAKE | Vice President and Controller (Principal Accounting Officer) | |||
| Sarah R. Blake | February 26, 2018 |
| *By: | /s/ PAUL L. FREEDMAN | February 26, 2018 | |
| Attorney-in-fact |
THE AES CORPORATION AND SUBSIDIARIES
INDEX TO FINANCIAL STATEMENT SCHEDULES
| Schedule I—Condensed Financial Information of Registrant | S-2 |
Schedules other than that listed above are omitted as the information is either not applicable, not required, or has been furnished in the consolidated financial statements or notes thereto included in Item 8 hereof.
See Notes to Schedule I
S-1
THE AES CORPORATION
SCHEDULE I CONDENSED FINANCIAL INFORMATION OF PARENT
BALANCE SHEETS
| December 31, | ||||||||
| 2017 | 2016 | |||||||
| (in millions) | ||||||||
| ASSETS | ||||||||
| Current Assets: | ||||||||
| Cash and cash equivalents | $ | 10 | $ | 109 | ||||
| Restricted cash | — | 3 | ||||||
| Accounts and notes receivable from subsidiaries | 143 | 155 | ||||||
| Prepaid expenses and other current assets | 27 | 39 | ||||||
| Total current assets | 180 | 306 | ||||||
| Investment in and advances to subsidiaries and affiliates | 8,239 | 7,561 | ||||||
| Office Equipment: | ||||||||
| Cost | 27 | 26 | ||||||
| Accumulated depreciation | (18 | ) | (16 | ) | ||||
| Office equipment, net | 9 | 10 | ||||||
| Other Assets: | ||||||||
| Other intangible assets, net of accumulated amortization | 3 | 5 | ||||||
| Deferred financing costs, net of accumulated amortization of $2 and $1, respectively | 5 | 5 | ||||||
| Deferred income taxes | 289 | 1,041 | ||||||
| Other assets | 2 | 13 | ||||||
| Total other assets | 299 | 1,064 | ||||||
| Total assets | $ | 8,727 | $ | 8,941 | ||||
| LIABILITIES AND STOCKHOLDERS' EQUITY | ||||||||
| Current Liabilities: | ||||||||
| Accounts payable | $ | 18 | $ | 18 | ||||
| Accounts and notes payable to subsidiaries | 381 | 304 | ||||||
| Accrued and other liabilities | 246 | 250 | ||||||
| Senior notes payable—current portion | 5 | — | ||||||
| Total current liabilities | 650 | 572 | ||||||
| Long-term Liabilities: | ||||||||
| Senior notes payable | 4,625 | 4,154 | ||||||
| Junior subordinated notes and debentures payable | — | 517 | ||||||
| Accounts and notes payable to subsidiaries | 967 | 883 | ||||||
| Other long-term liabilities | 20 | 21 | ||||||
| Total long-term liabilities | 5,612 | 5,575 | ||||||
| Stockholders' equity: | ||||||||
| Common stock | 8 | 8 | ||||||
| Additional paid-in capital | 8,501 | 8,592 | ||||||
| Accumulated deficit | (2,276 | ) | (1,146 | ) | ||||
| Accumulated other comprehensive loss | (1,876 | ) | (2,756 | ) | ||||
| Treasury stock | (1,892 | ) | (1,904 | ) | ||||
| Total stockholders' equity | 2,465 | 2,794 | ||||||
| Total liabilities and equity | $ | 8,727 | $ | 8,941 |
See Notes to Schedule I.
S-2
THE AES CORPORATION
SCHEDULE I CONDENSED FINANCIAL INFORMATION OF PARENT
STATEMENTS OF OPERATIONS
| For the Years Ended December 31, | 2017 | 2016 | 2015 | |||||||||
| (in millions) | ||||||||||||
| Revenue from subsidiaries and affiliates | $ | 28 | $ | 14 | $ | 24 | ||||||
| Equity in earnings of subsidiaries and affiliates | 630 | (615 | ) | 859 | ||||||||
| Interest income | 49 | 19 | 24 | |||||||||
| General and administrative expenses | (158 | ) | (144 | ) | (154 | ) | ||||||
| Other income | 5 | 7 | 24 | |||||||||
| Other expense | (554 | ) | (65 | ) | (6 | ) | ||||||
| Loss on extinguishment of debt | (92 | ) | (14 | ) | (105 | ) | ||||||
| Interest expense | (317 | ) | (344 | ) | (364 | ) | ||||||
| Income (loss) before income taxes | (409 | ) | (1,142 | ) | 302 | |||||||
| Income tax benefit (expense) | (752 | ) | 12 | 4 | ||||||||
| Net income (loss) | $ | (1,161 | ) | $ | (1,130 | ) | $ | 306 |
See Notes to Schedule I.
S-3
THE AES CORPORATION
SCHEDULE I CONDENSED FINANCIAL INFORMATION OF PARENT
STATEMENTS OF COMPREHENSIVE LOSS
YEARS ENDED DECEMBER 31, 2017, 2016, AND 2015
| 2017 | 2016 | 2015 | |||||||||
| (in millions) | |||||||||||
| NET INCOME (LOSS) | $ | (1,161 | ) | $ | (1,130 | ) | $ | 306 | |||
| Foreign currency translation activity: | |||||||||||
| Foreign currency translation adjustments, net of income tax benefit (expense) of $11, $1 and $1, respectively | 18 | 117 | (674 | ) | |||||||
| Reclassification to earnings, net of $0 income tax for all periods | 643 | 992 | — | ||||||||
| Total foreign currency translation adjustments, net of tax | 661 | 1,109 | (674 | ) | |||||||
| Derivative activity: | |||||||||||
| Change in derivative fair value, net of income tax benefit (expense) of $13, $(5) and $4, respectively | (14 | ) | 2 | (5 | ) | ||||||
| Reclassification to earnings, net of income tax benefit (expense) of $1, $1 and $(12), respectively | 37 | 28 | 48 | ||||||||
| Total change in fair value of derivatives, net of tax | 23 | 30 | 43 | ||||||||
| Pension activity: | |||||||||||
| Prior service cost for the period, net of income tax expense of $1, $5 and $0, respectively | 1 | 9 | 1 | ||||||||
| Change in pension adjustments due to net actuarial gain (loss) for the period, net of income tax benefit (expense) of $6, $10 and $(7), respectively | (20 | ) | (22 | ) | 18 | ||||||
| Reclassification of earnings due to amortization of net actuarial loss, net of income tax benefit (expense) of $(126), $2 and $(2), respectively | 248 | 1 | 2 | ||||||||
| Total change in unfunded pension obligation | 229 | (12 | ) | 21 | |||||||
| OTHER COMPREHENSIVE INCOME (LOSS) | 913 | 1,127 | (610 | ) | |||||||
| COMPREHENSIVE LOSS | $ | (248 | ) | $ | (3 | ) | $ | (304 | ) |
See Notes to Schedule I.
S-4
THE AES CORPORATION
SCHEDULE I CONDENSED FINANCIAL INFORMATION OF PARENT
STATEMENTS OF CASH FLOWS
| For the Years Ended December 31, | 2017 | 2016 | 2015 | |||||||||
| (in millions) | ||||||||||||
| Net cash provided by operating activities | $ | 148 | $ | 818 | $ | 475 | ||||||
| Investing Activities: | ||||||||||||
| Investment in and net advances to subsidiaries | (339 | ) | (650 | ) | (221 | ) | ||||||
| Return of capital | 243 | 247 | 501 | |||||||||
| Decrease in restricted cash | 3 | 29 | 49 | |||||||||
| Additions to property, plant and equipment | (13 | ) | (12 | ) | (11 | ) | ||||||
| Net cash provided by (used in) investing activities | (106 | ) | (386 | ) | 318 | |||||||
| Financing Activities: | ||||||||||||
| Borrowings under the revolver, net | 207 | — | — | |||||||||
| Borrowings of notes payable and other coupon bearing securities | 1,025 | 500 | 575 | |||||||||
| Repayments of notes payable and other coupon bearing securities | (1,353 | ) | (808 | ) | (915 | ) | ||||||
| Loans from subsidiaries | 309 | 183 | — | |||||||||
| Purchase of treasury stock | — | (79 | ) | (482 | ) | |||||||
| Proceeds from issuance of common stock | 1 | 1 | 4 | |||||||||
| Common stock dividends paid | (317 | ) | (290 | ) | (276 | ) | ||||||
| Payments for deferred financing costs | (12 | ) | (12 | ) | (6 | ) | ||||||
| Distributions to noncontrolling interests | — | (2 | ) | — | ||||||||
| Other financing | (7 | ) | (3 | ) | (18 | ) | ||||||
| Net cash used in financing activities | (147 | ) | (510 | ) | (1,118 | ) | ||||||
| Effect of exchange rate changes on cash | 6 | 1 | — | |||||||||
| Decrease in cash and cash equivalents | (99 | ) | (77 | ) | (325 | ) | ||||||
| Cash and cash equivalents, beginning | 109 | 186 | 511 | |||||||||
| Cash and cash equivalents, ending | $ | 10 | $ | 109 | $ | 186 | ||||||
| Supplemental Disclosures: | ||||||||||||
| Cash payments for interest, net of amounts capitalized | $ | 282 | $ | 296 | $ | 314 | ||||||
| Cash payments for income taxes, net of refunds | $ | 2 | $ | 6 | $ | — |
See Notes to Schedule I.
S-5
THE AES CORPORATION
SCHEDULE I
NOTES TO SCHEDULE I
- Application of Significant Accounting Principles
The Schedule I Condensed Financial Information of the Parent includes the accounts of The AES Corporation (the “Parent Company”) and certain holding companies.
ACCOUNTING FOR SUBSIDIARIES AND AFFILIATES — The Parent Company has accounted for the earnings of its subsidiaries on the equity method in the financial information.
INCOME TAXES — Positions taken on the Parent Company's income tax return which satisfy a more-likely-than-not threshold will be recognized in the financial statements. The income tax expense or benefit computed for the Parent Company reflects the tax assets and liabilities on a stand-alone basis and the effect of filing a consolidated U.S. income tax return with certain other affiliated companies as well as effects of U.S. tax law reform enacted in 2017.
ACCOUNTS AND NOTES RECEIVABLE FROM SUBSIDIARIES — Amounts have been shown in current or long-term assets based on terms in agreements with subsidiaries, but payment is dependent upon meeting conditions precedent in the subsidiary loan agreements.
- Debt
Senior and Secured Notes and Loans Payable ($ in millions)
| December 31, | ||||||||||||
| Interest Rate | Maturity | 2017 | 2016 | |||||||||
| Senior Unsecured Note | LIBOR + 3.00% | 2019 | $ | — | $ | 240 | ||||||
| Senior Unsecured Note | 8.00% | 2020 | 228 | 469 | ||||||||
| Senior Unsecured Note | 7.38% | 2021 | 690 | 966 | ||||||||
| Drawings on secured credit facility | LIBOR + 2.00% | 2021 | 207 | — | ||||||||
| Senior Secured Term Loan | LIBOR + 2.00% | 2022 | 521 | — | ||||||||
| Senior Unsecured Note | 4.88% | 2023 | 713 | 713 | ||||||||
| Senior Unsecured Note | 5.50% | 2024 | 738 | 738 | ||||||||
| Senior Unsecured Note | 5.50% | 2025 | 573 | 573 | ||||||||
| Senior Unsecured Note | 6.00% | 2026 | 500 | 500 | ||||||||
| Senior Unsecured Note | 5.13% | 2027 | 500 | — | ||||||||
| Unamortized (discounts)/premiums & debt issuance (costs) | (40 | ) | (45 | ) | ||||||||
| Subtotal | $ | 4,630 | $ | 4,154 | ||||||||
| Less: Current maturities | (5 | ) | — | |||||||||
| Total | $ | 4,625 | $ | 4,154 |
Junior Subordinated Notes Payable ($ in millions)
| December 31, | ||||||||||||
| Interest Rate | Maturity | 2017 | 2016 | |||||||||
| Term Convertible Trust Securities | 6.75% | 2029 | $ | — | $ | 517 |
FUTURE MATURITIES OF RECOURSE DEBT — As of December 31, 2017 scheduled maturities are presented in the following table (in millions):
| December 31, | Annual Maturities | ||
| 2018 | $ | 5 | |
| 2019 | 5 | ||
| 2020 | 234 | ||
| 2021 | 902 | ||
| 2022 | 500 | ||
| Thereafter | 3,024 | ||
| Unamortized (discount)/premium & debt issuance (costs) | (40 | ) | |
| Total debt | $ | 4,630 |
- Dividends from Subsidiaries and Affiliates
Cash dividends received from consolidated subsidiaries were $1.2 billion, $1 billion, and $748 million for the years ended December 31, 2017, 2016, and 2015, respectively. There were no cash dividends received from affiliates accounted for by the equity method for the years ended December 31, 2017, 2016, and 2015.
S-6
- Guarantees and Letters of Credit
GUARANTEES — In connection with certain of its project financing, acquisition, and power purchase agreements, the Parent Company has expressly undertaken limited obligations and commitments, most of which will only be effective or will be terminated upon the occurrence of future events. These obligations and commitments, excluding those collateralized by letter of credit and other obligations discussed below, were limited as of December 31, 2017, by the terms of the agreements, to an aggregate of approximately $842 million representing 22 agreements with individual exposures ranging from $1 million to $272 million. These amounts exclude normal and customary representations and warranties in agreements for the sale of assets (including ownership in associated legal entities) where the associated risk is considered to be nominal.
LETTERS OF CREDIT — At December 31, 2017, the Parent Company had $36 million in letters of credit outstanding under the senior secured credit facility, representing 21 agreements with individual exposures up to $13 million, and $52 million in letters of credit outstanding under the senior unsecured credit facility, representing 4 agreements with individual exposures ranging from $2 million to $26 million. During 2017, the Parent Company paid letter of credit fees ranging from 0.25% to 2.25% per annum on the outstanding amounts.
S-7