 filings.tools
Item 5. Market for Registrant’s Common Equity, Related Stockholder Matters and Issuer Purchases of Equity Securities
10K characters. Original on sec.gov · Markdown
Item 5. Market for Registrant’s Common Equity, Related Stockholder Matters and Issuer Purchases of Equity Securities
Stock Performance Graph
The following chart compares the total stockholder returns (stock price increase plus dividends paid) on our common stock from December 31, 2011 through December 31, 2016 with the total stockholder returns for the S&P 400 MidCap Index and the S&P 500 Index, as the broad equity market indexes, and the S&P 400 Multi-line Insurance Index and the S&P 500 Multi-line Insurance Index, as the published industry indexes. The graph assumes that the value of the investment in the common stock and each index was $100 on December 31, 2011 and that all dividends were reinvested.
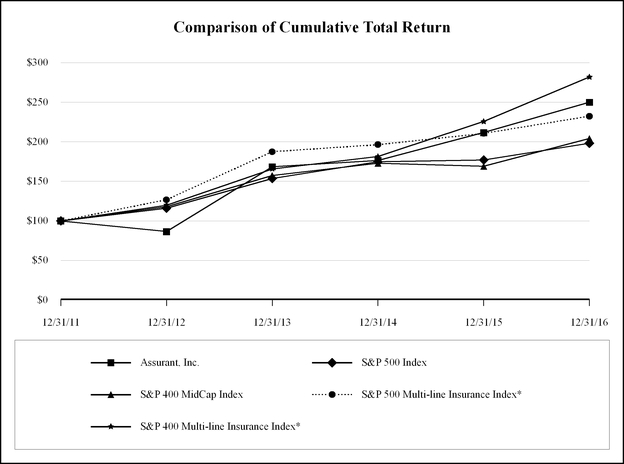
Total Values/Return to Stockholders
(Includes reinvestment of dividends)
| Base Period 12/31/11 | INDEXED VALUES Years Ending | ||||||||||||||||||||
| Company / Index | 12/31/12 | 12/31/13 | 12/31/14 | 12/31/15 | 12/31/16 | ||||||||||||||||
| Assurant, Inc. | $100 | $ | 86.44 | $ | 168.42 | $ | 176.42 | $ | 211.58 | $ | 249.97 | ||||||||||
| S&P 500 Index | 100 | 116.00 | 153.57 | 174.60 | 177.01 | 198.18 | |||||||||||||||
| S&P 400 MidCap Index | 100 | 117.88 | 157.37 | 172.74 | 168.98 | 204.03 | |||||||||||||||
| S&P 500 Multi-line Insurance Index* | 100 | 126.70 | 187.39 | 196.32 | 210.54 | 232.17 | |||||||||||||||
| S&P 400 Multi-line Insurance Index* | 100 | 119.90 | 165.71 | 181.24 | 225.59 | 281.75 | |||||||||||||||
| ANNUAL RETURN PERCENTAGE Years Ending | |||||||||||||||||||||
| Company / Index | 12/31/12 | 12/31/13 | 12/31/14 | 12/31/15 | 12/31/16 | ||||||||||||||||
| Assurant, Inc. | (13.56 | )% | 94.85 | % | 4.75 | % | 19.93 | % | 18.14 | % | |||||||||||
| S&P 500 Index | 16.00 | 32.39 | 13.69 | 1.38 | 11.96 | ||||||||||||||||
| S&P 400 MidCap Index | 17.88 | 33.50 | 9.77 | (2.18 | ) | 20.74 | |||||||||||||||
| S&P 500 Multi-line Insurance Index* | 26.70 | 47.90 | 4.77 | 7.24 | 10.27 | ||||||||||||||||
| S&P 400 Multi-line Insurance Index* | 19.90 | 38.21 | 9.37 | 24.47 | 24.90 |
| * | S&P 400 Multi-line Insurance Index is comprised of mid-cap companies, while the S&P 500 Multi-line Insurance Index is comprised of large-cap companies. |
Common Stock Price
Our common stock is listed on the NYSE under the symbol “AIZ.” The following table sets forth the high and low intraday sales prices per share of our common stock as reported by the NYSE and dividends per share of common stock declared by our Board of Directors for the periods indicated.
| Year Ended December 31, 2016 | High | Low | Dividends | ||||||||
| First Quarter | $ | 81.31 | $ | 66.23 | $ | 0.50 | |||||
| Second Quarter | $ | 88.67 | $ | 77.09 | $ | 0.50 | |||||
| Third Quarter | $ | 92.25 | $ | 83.01 | $ | 0.50 | |||||
| Fourth Quarter | $ | 93.74 | $ | 78.72 | $ | 0.53 | |||||
| Year Ended December 31, 2015 | High | Low | Dividends | ||||||||
| First Quarter | $ | 67.77 | $ | 60.22 | $ | 0.27 | |||||
| Second Quarter | $ | 68.87 | $ | 59.86 | $ | 0.30 | |||||
| Third Quarter | $ | 79.60 | $ | 68.14 | $ | 0.30 | |||||
| Fourth Quarter | $ | 86.81 | $ | 78.25 | $ | 0.50 |
Holders
On February 9, 2017, there were approximately 194 registered holders of record of our common stock. The closing price of our common stock on the NYSE on February 9, 2017 was $91.36.
Please see Item 12 of this Report for information about securities authorized for issuance under our equity compensation plans.
Shares Repurchased
| Period in 2016 | Total Number of Shares Purchased | Average Price Paid Per Share | Total Number of Shares Purchased as Part of Publicly Announced Programs (1) | Approximate Dollar Value of Shares that May Yet be Repurchased Under the Programs (1) | |||||||||
| January 1 – January 31 | 1,147,337 | $ | 78.44 | 1,147,337 | $ | 862,125 | |||||||
| February 1 – February 28 | 869,898 | 70.69 | 869,898 | 800,645 | |||||||||
| March 1 – March 31 | 1,405,025 | 76.12 | 1,405,025 | 693,717 | |||||||||
| Total first quarter | 3,422,260 | 75.52 | 3,422,260 | 693,717 | |||||||||
| April 1 – April 30 | 1,033,098 | 79.90 | 1,033,098 | 611,195 | |||||||||
| May 1 – May 31 | 845,869 | 87.01 | 845,869 | 537,609 | |||||||||
| June 1 – June 30 | 439,031 | 84.75 | 439,031 | 500,406 | |||||||||
| Total second quarter | 2,317,998 | 83.41 | 2,317,998 | 500,406 | |||||||||
| July 1 – July 31 | 485,725 | 86.61 | 485,725 | 458,345 | |||||||||
| August 1 – August 31 | 1,177,372 | 85.92 | 1,177,372 | 357,213 | |||||||||
| September 1 – September 30 | 1,028,006 | 89.92 | 1,028,006 | 264,798 | |||||||||
| Total third quarter | 2,691,103 | 87.57 | 2,691,103 | 264,798 | |||||||||
| October 1 – October 31 | 1,065,648 | 86.96 | 1,065,648 | 172,147 | |||||||||
| November 1 – November 30 | 539,943 | 83.79 | 539,943 | 726,918 | |||||||||
| December 1 – December 31 | 481,600 | 91.38 | 481,600 | 682,920 | |||||||||
| Total fourth quarter | 2,087,191 | 87.16 | 2,087,191 | 682,920 | |||||||||
| Total January 1 through December 31 | 10,518,552 | $ | 82.65 | 10,518,552 | $ | 682,920 |
| (1) | Shares purchased pursuant to the November 14, 2016 publicly announced share repurchase authorization of up to $600,000 of outstanding common stock. |
Dividend Policy
On January 13, 2017, our Board of Directors declared a quarterly dividend of $0.53 per common share payable on March 20, 2017 to stockholders of record as of February 27, 2017. We paid dividends of $0.53 per common share on December 12, 2016, and $0.50 on September 13, 2016, June 14, 2016 and March 14, 2016. We paid dividends of $0.30 per common share on December 14, 2015, September 15, 2015 and June 9, 2015, and $0.27 per common share on March 9, 2015. Any determination to pay future dividends will be at the discretion of our Board of Directors and will be dependent upon: our subsidiaries’ payment of dividends and/or other statutorily permissible payments to us; our results of operations and cash flows; our financial position and capital requirements; general business conditions; any legal, tax, regulatory and contractual restrictions on the payment of dividends; and any other factors our Board of Directors deems relevant.
Assurant, Inc. is a holding company and, therefore, its ability to pay dividends, service its debt and meet its other obligations depends primarily on the ability of its regulated U.S. domiciled insurance subsidiaries to pay dividends and make other statutorily permissible payments to the holding company. Our insurance subsidiaries are subject to significant regulatory and contractual restrictions limiting their ability to declare and pay dividends. See “Item 1A – Risk Factors – Risks Relating to Our Company – The inability of our subsidiaries to pay sufficient dividends to the holding company could prevent us from meeting our obligations and paying future stockholder dividends.” For the calendar year 2017, the maximum amount of dividends our regulated U.S. domiciled insurance subsidiaries could pay us, under applicable laws and regulations without prior regulatory approval, is approximately $319,000. Dividends or returns of capital paid by our subsidiaries, net of infusions and excluding amounts used or set aside for acquisitions, was approximately $1,653,000 in 2016.
We may seek approval of regulators to pay dividends in excess of any amounts that would be permitted without such approval. However, there can be no assurance that we would obtain such approval if sought.
Payments of dividends on shares of common stock are subject to the preferential rights of preferred stock that our Board of Directors may create from time to time. There is no preferred stock issued and outstanding as of December 31, 2016. For more information regarding restrictions on the payment of dividends by us and our insurance subsidiaries, including those pursuant to the terms of our revolving credit facilities, see “Item 7 – Management’s Discussion and Analysis of Financial Condition and Results of Operations – Liquidity and Capital Resources.”
In addition, our $400,000 revolving credit facility restricts payments of dividends if an event of default under the facility has occurred or if a proposed dividend payment would cause an event of default under the facility.
Previous: Item 4. Mine Safety Disclosures · Next: Item 6. Selected Financial Data