 filings.tools
Allstate 10-K 2018-12-31
Filed 2019-02-15. 22 sections, 1191K characters. Original on sec.gov · Markdown · JSON
Cover and table of contents
10-K 1 allcorp-12311810xk.htm 10-K
UNITED STATES
SECURITIES AND EXCHANGE COMMISSION
Washington, D.C. 20549
FORM 10-K
| ý | ANNUAL REPORT PURSUANT TO SECTION 13 OR 15(d) OF THE SECURITIES EXCHANGE ACT OF 1934 |
For the fiscal year ended December 31, 2018
OR
| o | TRANSITION REPORT PURSUANT TO SECTION 13 OR 15(d) OF THE SECURITIES EXCHANGE ACT OF 1934 |
For the transition period from to
Commission file number 1-11840

THE ALLSTATE CORPORATION
(Exact name of registrant as specified in its charter)
| Delaware | 36-3871531 | |
| (State or Other Jurisdiction of Incorporation or Organization) | (I.R.S. Employer Identification No.) |
2775 Sanders Road, Northbrook, Illinois 60062
(Address of principal executive offices) (Zip Code)
Registrant’s telephone number, including area code: (847) 402-5000
Securities registered pursuant to Section 12(b) of the Act:
| Title of each class | Name of each exchange on which registered |
| Common Stock, par value $0.01 per share | New York Stock Exchange Chicago Stock Exchange |
| 5.10% Fixed-to-Floating Rate Subordinated Debentures due 2053 | New York Stock Exchange |
| Depositary Shares each representing a 1/1,000th interest in a share of Fixed Rate Noncumulative Perpetual Preferred Stock, Series A | New York Stock Exchange |
| Depositary Shares each representing a 1/1,000th interest in a share of Fixed Rate Noncumulative Perpetual Preferred Stock, Series D | New York Stock Exchange |
| Depositary Shares each representing a 1/1,000th interest in a share of Fixed Rate Noncumulative Perpetual Preferred Stock, Series E | New York Stock Exchange |
| Depositary Shares each representing a 1/1,000th interest in a share of Fixed Rate Noncumulative Perpetual Preferred Stock, Series F | New York Stock Exchange |
| Depositary Shares each representing a 1/1,000th interest in a share of Fixed Rate Noncumulative Perpetual Preferred Stock, Series G | New York Stock Exchange |
Securities registered pursuant to Section 12(g) of the Act: None
Indicate by check mark if the registrant is a well-known seasoned issuer, as defined in Rule 405 of the Securities Act. Yes X No
Indicate by check mark if the registrant is not required to file reports pursuant to Section 13 or Section 15(d) of the Act. Yes No X
Indicate by check mark whether the registrant (1) has filed all reports required to be filed by Section 13 or 15(d) of the Securities Exchange Act of 1934 during the preceding 12 months (or for such shorter period that the registrant was required to file such reports), and (2) has been subject to such filing requirements for the past 90 days. Yes X No
Indicate by check mark whether the registrant has submitted electronically every Interactive Data File required to be submitted pursuant to Rule 405 of Regulation S-T (§ 232.405 of this chapter) during the preceding 12 months (or for such shorter period that the registrant was required to submit such files). Yes X No
Indicate by check mark if disclosure of delinquent filers pursuant to Item 405 of Regulation S-K (§ 229.405 of this chapter) is not contained herein, and will not be contained, to the best of registrant’s knowledge in definitive proxy or information statements incorporated by reference in Part III of this Form 10-K or any amendment to this Form 10-K.
Indicate by check mark whether the registrant is a large accelerated filer, an accelerated filer, a non-accelerated filer, a smaller reporting company, or an emerging growth company. See the definitions of “large accelerated filer,” “accelerated filer,” “smaller reporting company,” and “emerging growth company” in Rule 12b-2 of the Exchange Act.
| Large accelerated filer X | Accelerated filer | |
| Non-accelerated filer | Smaller reporting company | |
| Emerging growth company |
If an emerging growth company, indicate by check mark if the registrant has elected not to use the extended transition period for complying with any new or revised financial accounting standards provided pursuant to Section 13(a) of the Exchange Act. ____
Indicate by check mark whether the registrant is a shell company (as defined in Rule 12b-2 of the Exchange Act). Yes No X
The aggregate market value of the common stock held by non-affiliates of the registrant, computed by reference to the closing price as of the last business day of the registrant’s most recently completed second fiscal quarter, June 30, 2018, was approximately $31.24 billion.
As of January 31, 2019, the registrant had 331,963,104 shares of common stock outstanding.
Documents Incorporated By Reference
Portions of the following documents are incorporated herein by reference as follows:
Part III of this Form 10-K incorporates by reference certain information from the registrant’s definitive proxy statement for its annual stockholders meeting to be held on May 21, 2019, (the “Proxy Statement”) to be filed not later than 120 days after the end of the fiscal year covered by this Form 10-K.
Table of Contents
2018 Form 10-K Item 1. Business
Part I
Item 1. Business
The Allstate Corporation was incorporated under the laws of the State of Delaware on November 5, 1992 to serve as the holding company for Allstate Insurance Company. Its business is conducted principally through Allstate Insurance Company, Allstate Life Insurance Company and other subsidiaries (collectively, including The Allstate Corporation, “Allstate”).
Allstate’s purpose is to protect people from life’s uncertainties and prepare them for the future so they can realize their hopes and dreams. Allstate is primarily engaged in the property and casualty insurance business in the United States and Canada. Additionally, Allstate provides customers other protection offerings such as life, accident and health insurance and protection plans that cover electronic devices and personal identities.
The Allstate Corporation is one of the largest publicly held personal lines insurers in the United States. Allstate’s Property-Liability strategy is to serve distinct customer segments with differentiated offerings. The Allstate brand is widely known through the “You’re In Good Hands With Allstate®” slogan. Allstate is the 3rd largest personal property and casualty insurer in the United States on the basis of 2017 statutory direct premiums written according to A.M. Best.
In addition, Allstate also has strong market positions in other protection products. According to A.M. Best, Allstate is the nation’s 20th largest issuer of life insurance business on the basis of 2017 ordinary life insurance in force and 38th largest on the basis of 2017 statutory admitted assets. Allstate Benefits provides accident, health and life insurance through employers and is one of the top five voluntary benefits carriers in the market based on a 2017 voluntary/worksite industry survey. SquareTrade provides protection plans on a wide variety of consumer goods such as cell phones, tablets, computers and appliances, and has a leading position in distribution through major retailers. InfoArmor provides identity protection through employers and has a leading position in this distribution channel. In total, Allstate had 113.9 million policies in force (“PIF”) as of December 31, 2018.
In this Annual Report on Form 10-K, we occasionally refer to statutory financial information. All domestic United States insurance companies are required to prepare statutory-basis financial statements. As a result, industry data is available that enables comparisons between insurance companies, including competitors that are not required to prepare financial statements in conformity with accounting principles generally accepted in the United States of America (“GAAP”). We frequently use industry publications containing statutory financial information to assess our competitive position.
The Allstate Corporation  1
1
Item 1. Business 2018 Form 10-K
Strategy and Segment Information
Allstate's strategy is to grow personal property-liability market share and expand other protection businesses by leveraging our brand, customer base, investment expertise, distribution channels and capital.
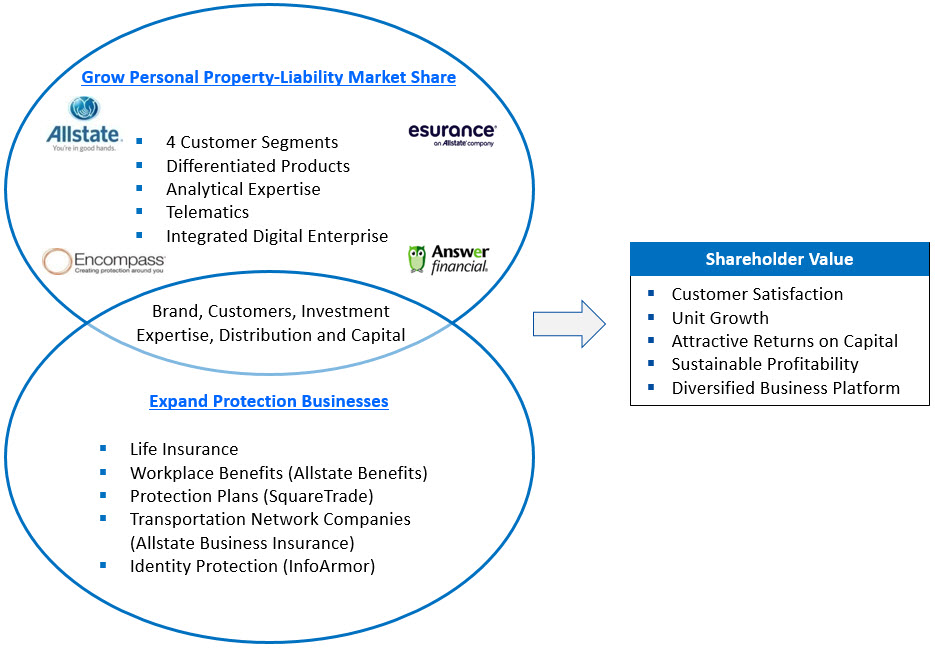
We evaluate performance and make resource and capital decisions across seven reportable segments.
| Reportable segments | ||
| Allstate Protection (1) | Includes the Allstate, Encompass and Esurance brands and Answer Financial. Offers private passenger auto, homeowners, other personal lines and commercial insurance through agencies and direct, including contact centers and the internet. | |
| Service Businesses | Includes SquareTrade, Arity, InfoArmor, Allstate Roadside Services and Allstate Dealer Services, which offer a broad range of products and services that expand and enhance our customer value propositions. InfoArmor is included in Service Businesses since its acquisition on October 5, 2018. | |
| Allstate Life | Offers traditional, interest-sensitive and variable life insurance products through Allstate exclusive agencies and exclusive financial specialists. | |
| Allstate Benefits | Offers voluntary benefits products, including life, accident, critical illness, short-term disability and other health insurance products sold through workplace enrolling independent agents and Allstate exclusive agencies. | |
| Allstate Annuities | Consists of deferred fixed annuities and immediate fixed annuities (including standard and sub-standard structured settlements) in run-off. | |
| Discontinued Lines and Coverages (1) | Relates to property and casualty insurance policies written during the 1960's through the mid-1980's with exposure to asbestos, environmental and other claims in run-off. | |
| Corporate and Other | Includes holding company activities and certain non-insurance operations. |
| (1) | Allstate Protection and Discontinued Lines and Coverages segments comprise Property-Liability. |
The Allstate Corporation 2
Item 1. Business 2018 Form 10-K
Allstate Protection Segment
Our Allstate Protection segment accounted for 90.2% of Allstate’s 2018 consolidated insurance premiums and contract charges and 29.2% of Allstate’s December 31, 2018 PIF. In this segment, private passenger auto, homeowners, and other personal lines insurance products are offered to consumers through agencies and directly through contact centers and online. Our strategy is to position product offerings and distribution channels to meet customers’ evolving needs and help them manage the risks they face.
Allstate Protection has four market-facing businesses with products and services that cater to different customer preferences for advice and brand recognition to improve our competitive position and performance.
Strategy
We serve all four consumer segments using differentiated products, analytical expertise, telematics and an integrated digital enterprise that leverages data and technology to redesign our processes with a focus on greater effectiveness and efficiencies and long-term expense savings.
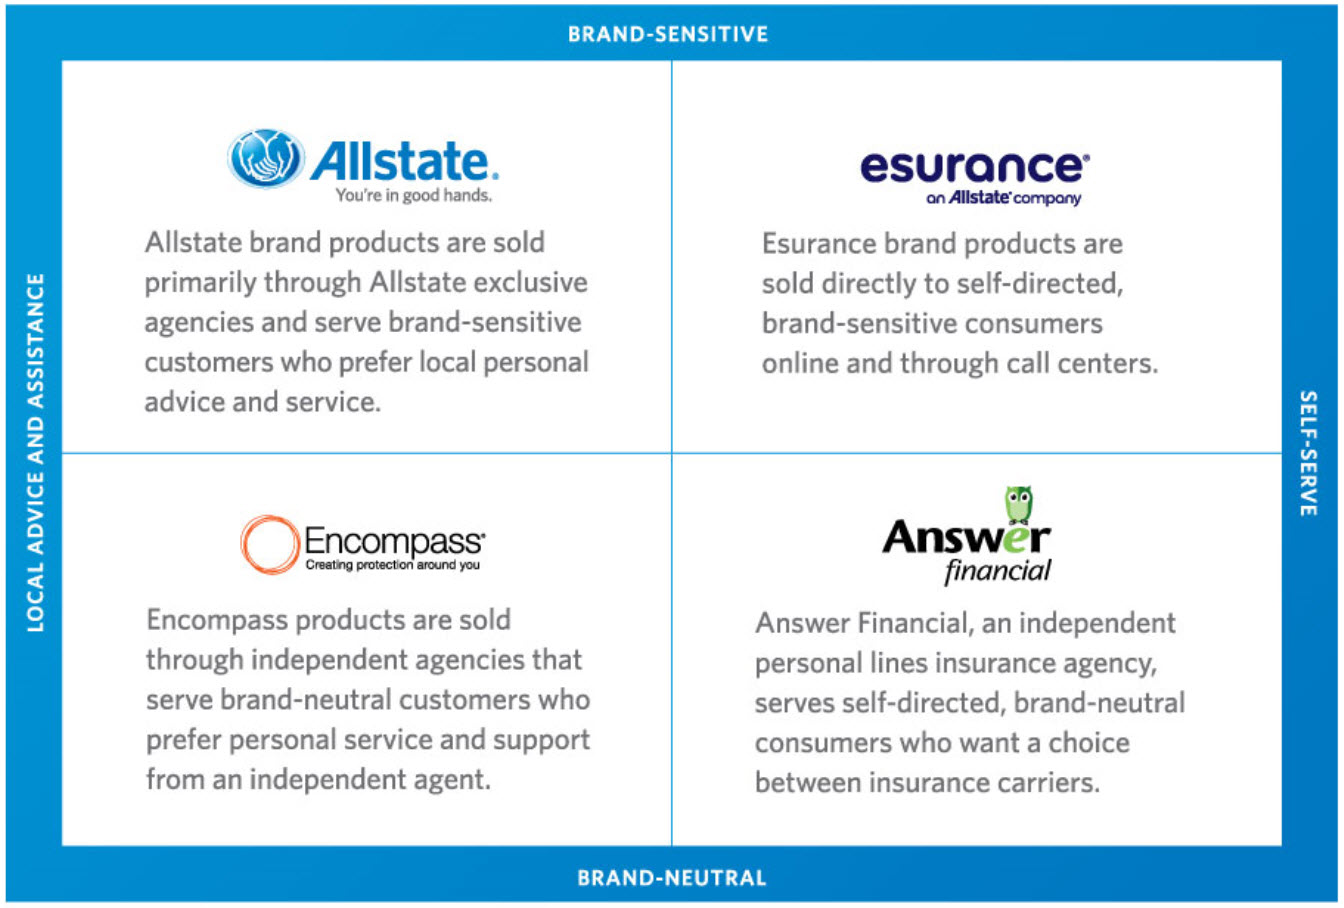
Allstate brand strategy
Our strategy is to grow profitably through exclusive agencies, who serve as trusted advisors to customers, while leveraging best-in-class operational capabilities to gain market share and efficiencies. The Allstate brand differentiates itself by offering comprehensive product options and features through agencies that provide local advice and service, including a partnership with exclusive financial specialists to deliver life and retirement solutions. This strategy focuses on four customer-centric themes to expand our trusted advisor initiative and deliver profitable growth:
| Available | Competitive | Simple | Connected | |||
| Provide products and services that protect what matters most | Offer products that make good use of our customers’ hard-earned money | Easy to interact with | Know our customers and proactively interact in value-added ways | |||
| Continue to build effective and efficient distribution systems and product offerings that provide a competitive advantage | Advance our pricing sophistication and improve cost competitiveness | Provide seamless, personalized customer interactions supported by contemporary products and technology | Expand the breadth of value-added products and services, enabled by connections with our customers |
The Allstate Corporation 3
2018 Form 10-K Item 1. Business
Available Allstate’s 10,700 exclusive agencies provide customized solutions and support based on our consumers’ needs. Agencies are established in 10,600 locations, supported by 26,900 licensed sales professionals and 1,100 exclusive financial specialists who are trusted advisors to our customers.
| Being a trusted advisor means that our agencies |
| • Have a local presence in our customers’ communities |
| • Know customers and understand the unique needs of their households |
| • Help customers assess the potential risks they face |
| • Provide local expertise and personalized guidance on how to protect what matters most to customers by offering customized solutions |
| • Support customers when they have changes in their lives and during their times of need |
Allstate exclusive agencies also offer life and retirement solutions and can partner with exclusive financial specialists who provide expertise with more complex life and retirement solutions and other financial needs of our customers.
Exclusive agencies and financial specialists are supported through marketing assistance, service and business processes, technology, education, offering financing to grow their businesses and other resources to help them enhance the customer experience and to acquire and retain more customers. We continue to focus on the effectiveness and efficiency of our distribution system and the breadth of our product offerings.
Competitive Data, analytics and technology support advancements in pricing sophistication for all lines of business. Pricing and underwriting strategies and decisions are designed to generate sustainable profitable growth.
Targeted marketing includes messaging that communicates the value of our Good Hands®, the importance of having proper coverage, product options, and the ease of doing business with Allstate and our exclusive agencies.
Enhanced loss cost management and expense control are a priority. To achieve this, we are continuing to modernize our operating platform (including enhanced digital capabilities) and optimizing vendor relationships. Investments are being made to increase efficiencies and reduce expenses.
Simple We are focused on creating value through simplicity, quality, rewarding engagement and improving ease of access and service through an integrated digital enterprise.
Emerging technologies and predictive analytics are being used to simplify the customer experience and expedite the claims process. To achieve this, we have opened several Digital Operating Centers to handle auto physical damage claims countrywide. The centers utilize virtual estimation capabilities, which include estimating damage through photos and video with the use of QuickFoto Claim® and Virtual Assist® (video chat technology used to review supplemental damage with auto body shops). We are also leveraging virtual
capabilities to handle property claims by estimating damage through video with Virtual Assist and aerial imagery using satellites, airplanes and drones.
Connected We will continue to leverage telematics to offer customers a highly individualized price, better understand their risks and improve customer experience delivered through innovative products and services.
Current capabilities are being expanded through our partnership with Arity, which uses telematics to offer personalized, engaging programs that empower drivers with insights about their vehicle’s health, costs and safety.
Exclusive agency compensation structure The compensation structure for Allstate exclusive agencies rewards agencies for delivering high value to customers and achieving certain business outcomes such as product profitability, growth and household penetration. Allstate exclusive agency remuneration comprises a base commission, variable compensation and a bonus.
| • | Agencies receive a monthly base commission payment as a percentage of their total eligible written premium. |
| • | Variable compensation rewards agencies for meeting customers’ needs for life insurance and retirement policies sold relative to the size of the agency. |
| • | Bonus compensation is based on a percentage of premiums and can be earned by agencies who are meeting certain sales goals and selling additional policies to meet customer needs profitably. |
Agencies have the ability to earn commissions and additional bonuses on non-proprietary products provided to customers when an Allstate product is not available. In 2018, Ivantage had $1.8 billion non-proprietary premiums under management and is a leading provider of property and casualty brokerage services.
Allstate exclusive financial specialists receive commissions for proprietary and non-proprietary sales and earn a bonus based on the volume of business produced with Allstate exclusive agencies.
Allstate independent agent remuneration comprises a base commission and a bonus that can be earned by agents who achieve sales goals and a target loss ratio.
Commercial lines strategy We are actively pursuing profitable expansion of our commercial lines, including the shared economy, such as transportation network companies. Profit improvement actions have been implemented for our traditional commercial lines insurance products, emphasizing pricing, claims, governance and operational improvements.
Esurance strategy
We are working to make insurance surprisingly painless by innovating to make it simple, transparent, and affordable. We plan to grow profitably by
Item 1. Business 2018 Form 10-K
delivering an excellent customer experience at an exceptional value through an engaged and high-performing workforce. To provide an enhanced customer experience we:
| • | Offer a seamless online and mobile experience with fast quoting for ease and convenience. |
| • | Provide hassle-free purchases and claims processing through intuitive tools and advanced technology. |
| • | Offer a broad suite of protection products and solutions to our customers. |
| • | Offer innovative product options and features. |
Encompass strategy
Our strategy is to expand the independent agency footprint, broaden geographic and product diversification, enhance pricing and underwriting sophistication and provide a superior customer and agent experience.
Over the past several years, Encompass has been executing on a profit improvement plan emphasizing pricing, governance and operational improvements at both the state and countrywide levels. These actions have improved underlying profitability but led to a reduction of policies in force compared to prior years for both auto and homeowners.
Answer Financial strategy
Answer Financial is an insurance agency that sells other insurance companies’ products directly to customers online. Our strategy as a technology-enabled insurance agency is to provide comparison shopping and related services for businesses, offering customers choice, convenience and ease of use.
Allstate Protection pricing and risk management strategies
Our pricing and underwriting strategies and decisions are designed to generate sustainable profitable growth.
A proprietary database of underwriting and loss experience enables sophisticated pricing algorithms and methodologies to more accurately price risks while also seeking to attract and retain customers in multiple risk segments.
| • | For auto insurance, risk evaluation factors can include, but are not limited to, vehicle make, model and year; driver age and marital status; territory; years licensed; loss history; years insured with prior carrier; prior liability limits; prior lapse in coverage; and insurance scoring utilizing telematics data and other consumer information. |
| • | For property insurance, risk evaluation factors can include, but are not limited to, the amount of insurance purchased; geographic location of the property; loss history; age, condition and construction characteristics of the property; and |
characteristics of the insured including insurance scoring utilizing other consumer information.
A combination of underwriting information, pricing and discounts are also used to achieve a more competitive position and growth. The pricing strategy involves local marketplace pricing and underwriting decisions based on risk evaluation factors and an evaluation of competitors to the extent permissible by applicable law.
Pricing of property products is intended to establish risk-adjusted returns that are acceptable over a long-term period. Rate increases are pursued to keep pace with loss trends, including losses from catastrophic events and those that are weather-related (such as wind, hail, lightning and freeze not meeting our criteria to be declared a catastrophe). We also take into consideration potential customer disruption, the impact on our ability to market our products, regulatory limitations, our competitive position and profitability.
In any reporting period, loss experience from catastrophic events and weather-related losses may contribute to negative or positive underwriting performance relative to the expectations incorporated into product pricing.
Property catastrophe exposure is managed with the goal of providing shareholders an acceptable return on the risks assumed in the property business and to reduce the variability of earnings. Our property business includes personal homeowners, commercial property and other property insurance lines. Our current catastrophe reinsurance program supports our risk tolerance framework that targets less than a 1% likelihood of annual aggregate catastrophe losses from hurricanes and earthquakes, net of reinsurance, exceeding $2 billion. The use of different assumptions and updates to industry models, and updates to our risk transfer program could materially change the projected loss. Growth strategies include areas where we believe diversification can be enhanced and an appropriate return can be earned for the risk. As a result, our modeled exposure may increase, but in aggregate remain lower than $2 billion as noted above. In addition, we have exposure to other severe weather events and wildfires, which impact catastrophe losses.
Property catastrophe exposure management includes purchasing reinsurance to provide coverage for known exposure to hurricanes, earthquakes, wildfires, fires following earthquakes and other catastrophes. We are also working to promote measures to prevent and mitigate losses and make homes and communities more resilient, including enactment of stronger building codes and effective enforcement of those codes, adoption of sensible land use policies, and development of effective and affordable methods of improving the resilience of existing structures.
The Allstate Corporation 5
2018 Form 10-K Item 1. Business
Products and distribution
Allstate Protection differentiates itself by offering solutions to meet broad-based household protection needs and a comprehensive range of innovative product options and features across distribution channels that best suit each consumer segment.
| Insurance products | |||
| Allstate brand | Auto | ||
| Homeowners | |||
| Specialty auto (motorcycle, trailer, motor home and off-road vehicle) | |||
| Other personal lines (renters, condominium, landlord, boat, umbrella, manufactured home and stand-alone scheduled personal property) | |||
| Commercial lines | |||
| Esurance brand | Auto | ||
| Homeowners | |||
| Motorcycle | |||
| Renters | |||
| Encompass brand | Auto | ||
| Homeowners | |||
| Other personal lines (renters, condominium, landlord, boat and umbrella) | |||
| Answer Financial | Comparison quotes for non-proprietary auto, homeowners and other personal lines (condominium, renters, motorcycle, recreational vehicle and boat) |
Item 1. Business 2018 Form 10-K
| Innovative product offerings and features | |||
| Market-leading solutions | |||
| Allstate brand | Your Choice Auto® | Qualified customers choose from a variety of options, such as Accident Forgiveness, Deductible Rewards®, Safe Driving Bonus® and New Car Replacement. | |
| Allstate House and Home® | Featured options include Claim RateGuard®, Claim-Free Bonus, deductible rewards and flexibility in options and coverages, including graduated roof coverage and pricing based on roof type and age for damage related to wind and hail events. | ||
| Claim Satisfaction Guarantee® | Promised return of premium to standard auto insurance customers dissatisfied with their claims experience. | ||
| Bundling Benefits | Auto customers with a qualifying property policy are provided an auto renewal guarantee and a deductible waiver (when the same event, with the same covered cause of loss, damages both auto and property). Offered in 15 states as of December 31, 2018. | ||
| Auto Replacement Protection | Replaces a qualifying customer’s vehicle involved in a total loss accident with a vehicle of the same or similar make and model that is one year newer. Offered in 15 states as of December 31, 2018. | ||
| Encompass brand | EncompassOne Policy® | Packaged insurance product with one premium, one bill, one policy deductible and one renewal date. Broad coverage options include customizable features such as enhanced accident forgiveness, new-car replacement coverage, walk-away home coverage option should the insured decide not to rebuild, flexible additional living expense coverage, water-sewer backup coverage options and roadside assistance. This product is offered in 36 states and the District of Columbia (“D.C.”) as of December 31, 2018. | |
| Surround Solutions by EncompassSM | Offers contemporary auto (6-months), homeowner and specialty lines products, pricing, services and support designed to provide flexibility and be customized based on consumer needs. Offered exclusively in four states for Encompass as of December 31, 2018. | ||
| Telematics offerings | |||
| Allstate brand | Drivewise® | Telematics-based insurance program, available in 49 states and the District of Columbia as of December 31, 2018, that uses a mobile application or an in-car device to capture driving behaviors and encourage safe driving. It provides customers with information and tools, incentives and driving challenges. For example, in most states, Allstate Rewards® provides reward points for safe driving. | |
| Milewise® | Usage-based insurance product, available in 6 states as of December 31, 2018, that gives customers flexibility to customize their insurance and pay based on the number of miles they drive. | ||
| Esurance brand | DriveSense® | Telematics-based insurance program, available in 32 states as of December 31, 2018, that primarily uses a mobile application to capture driving behaviors and reward customers for safe driving. | |
| Encompass brand | Route ReportSM | Telematics application, available in 4 states as of December 31, 2018, used to capture driving behaviors and reward customer participation. | |
| Answer Financial | StreetWiseSM | Telematics application, available in all 50 states and D.C. as of December 31, 2018, used to capture driving behaviors. | |
| Shared economy solutions | |||
| Allstate brand | Transportation Network Company Commercial Auto | Commercial coverage for drivers of transportation networking companies during various phases of the ridesharing service. | |
| Allstate Ride for Hire®/ HostAdvantage® | Supplemental personal insurance coverage for those using their vehicle to drive for a transportation network company or their house for peer-to-peer property sharing. |
| Distribution channels | |
| Allstate brand | In the U.S., we offer products through 10,700 Allstate exclusive agencies operating in 10,600 locations, supported by 26,900 licensed sales professionals, and 1,100 exclusive financial specialists. We also offer products through 2,700 independent agencies that are primarily in rural areas and through contact centers and online. In Canada, we offer Allstate brand products through 900 employee producers. |
| Esurance brand | Sold to customers online and through contact centers. |
| Encompass brand | Distributed through 2,600 independent agencies. |
| Answer Financial | Comparison quotes offered to customers online or through contact centers. |
Allstate exclusive agencies also support the Service Businesses, Allstate Life and Allstate Benefits segments through offering roadside assistance and protection plans, life insurance and voluntary benefits products.
The Allstate Corporation 7
2018 Form 10-K Item 1. Business
When an Allstate product is not available, we may offer non-proprietary products to consumers through arrangements made with other companies, agencies, and brokers. As of December 31, 2018, Allstate agencies had approximately $1.6 billion of non-proprietary personal insurance premiums under management, primarily related to property business in hurricane exposed areas, and approximately $220 million of non-proprietary commercial insurance premiums under management. Additionally, we offer a homeowners product through our subsidiary North Light Specialty Insurance Company in certain areas with higher risk of catastrophes or where customers do not meet the Allstate brand standard underwriting profile.
Competition
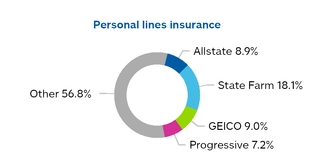
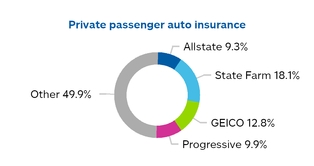
The personal lines insurance markets, including private passenger auto and homeowners insurance, are highly competitive. The following charts provide Allstate Protection’s combined market share compared to our principal competitors in the U.S. using statutory direct written premium for the year ended December 31, 2017, according to A.M. Best.
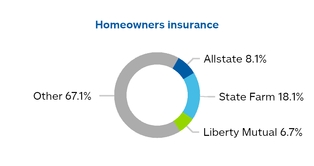
Esurance is among the top 25 largest providers of personal property and casualty insurance products in the U.S., and Encompass is among the top 20 largest providers of personal property and casualty insurance products through independent agencies in the U.S., based on statutory direct written premium according to A.M. Best for 2017.
Geographic markets
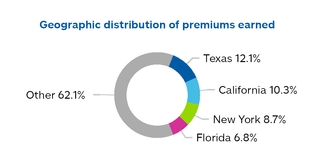
Our principal geographic markets are in the U.S. Through various subsidiaries, we are authorized to sell a variety of personal property and casualty products in all 50 states, D.C., Puerto Rico and Canada. The top U.S. geographic markets are reflected below based on 2018 information contained in statements filed with the state insurance departments.
Item 1. Business 2018 Form 10-K
Service Businesses Segment
Our Service Businesses segment accounted for 3.3% of Allstate’s 2018 consolidated total revenue and 65.1% of Allstate’s December 31, 2018 PIF. Service Businesses include SquareTrade, Arity, InfoArmor, Allstate Roadside Services and Allstate Dealer Services, which offer a broad range of products and services that expand and enhance customer value propositions. Starting in the fourth quarter of 2018, the Service Businesses segment includes the results of InfoArmor, a leading provider of identity protection to more than 1 million employees and their family members at over 1,400 firms, which was acquired on October 5, 2018.
Strategy - To deliver superior value propositions and build strategic platforms to connect and engage with customers and effectively address their changing needs and preferences.
| SquareTrade® | Expand distribution of consumer protection plan and technical support products through new and existing retail and mobile operator accounts while increasing profitability and returns. | |
| Arity® | Build a strategic platform leveraging our analytics and deep understanding of driver risk. The platform will be used by those industries effected most by the changing face of transportation, including insurance companies, shared mobility companies and the automotive ecosystem. | |
| InfoArmor® | Create a leading position in the identity protection market, offering full identity protection monitoring with proactive alerts, digital exposure reporting, identity theft reimbursement and excellent customer service. | |
| Allstate Roadside Services® | Digitize the roadside assistance business and enhance capabilities to deliver a superior customer experience while lowering costs in the customer assistance centers and optimizing the rescue network. | |
| Allstate Dealer Services® | Expand distribution of Allstate branded finance and insurance products and services to auto dealerships, while pursuing additional distribution through strategic partnerships. |
Products and distribution
| Products and services | ||
| SquareTrade | Provides consumer protection plans and related technical support for mobile phones, consumer electronics and appliances which provide customers protection from mechanical or electrical failure, and in certain cases, accidental damage from handling. | |
| Arity | The Arity platform provides data and analytics solutions using automotive telematics information. Customers receive value from our solutions either by using web based software tools, white labeled mobile applications or through embedding our technology in their mobile applications. | |
| InfoArmor | Provides identity protection services including monitoring, alerts, remediation and a proprietary indicator of identity health. | |
| Allstate Roadside Services | A leading roadside assistance provider in North America offering towing, jump-start, lockout, fuel delivery and tire change services to retail customers and customers of our wholesale partners. Good Hands Rescue® is a pay-per-use mobile application service that connects users to a select countrywide network of third-party providers and a proprietary crowdsourced network to assist with emergencies. | |
| Allstate Dealer Services | Offers finance and insurance products, including vehicle service contracts, guaranteed asset protection waivers, road hazard tire and wheel protection, and paintless dent repair protection. |
| Distribution channels | ||
| SquareTrade | Major retailers in the U.S. and mobile operators in Europe. | |
| Arity | Sells directly to affiliate and non-affiliate customers and through strategic industry specific partners. | |
| InfoArmor | Workplace benefit programs provided to employees with a strategic focus to leverage relationships with our Allstate Benefits segment and expand into other distribution channels. | |
| Allstate Roadside Services | Allstate exclusive agencies, wholesale partners, affinity groups and a mobile application. | |
| Allstate Dealer Services | Independent agencies and brokers through auto dealerships in the U.S. to customers in conjunction with the purchase of a new or used vehicle. |
Geographic markets
The Service Businesses primarily operate in the U.S., with certain businesses offering services in Europe, Canada and Puerto Rico.
Competition
We compete on a variety of factors, including product offerings, brand recognition, financial strength, price, distribution and the customer experience. The market for these services is highly fragmented and competitive.
The Allstate Corporation 9
2018 Form 10-K Item 1. Business
Allstate Life Segment
Strategy
Our Allstate Life segment accounted for 4.8% of Allstate’s 2018 consolidated total revenue and 1.8% of Allstate’s December 31, 2018 PIF. Our overall strategy is to broaden Allstate’s customer relationships and value proposition. The Allstate Life segment’s product offerings are a part of the Allstate brand trusted advisor strategy. We also distribute non-proprietary retirement products offered by third-party providers. Our target customers are those who prefer local personalized advice and service and are brand-sensitive.
Our product positioning provides solutions to help meet customer needs during various phases of life. Term and whole life insurance products offer basic life protection solutions while universal life and financial planning solutions cover more advanced needs. Many Allstate exclusive agencies partner with exclusive financial specialists to deliver life and retirement solutions. These specialists have expertise with advanced life and retirement cases and other more complex customer needs. Successful partnerships assist agencies with building stronger and deeper customer relationships. Sales producer education and technology improvements are being made to ensure agencies have the tools and information needed to help customers meet their needs and build personal relationships as trusted advisors.
The operating model is being modernized through investments in data and analytics and technology capabilities, tailoring distribution support, product innovation and enhancing the underwriting process.
Products and distribution
| Insurance products | ||
| Term life | Interest-sensitive life | |
| Whole life | Variable life |
| Distribution channel |
| Allstate exclusive agencies and exclusive financial specialists. |
Allstate exclusive agencies and exclusive financial specialists also sell certain non-proprietary products, including mutual funds, fixed and variable annuities, disability insurance, and long-term care insurance to provide a broad suite of protection and retirement products. As of December 31, 2018, Allstate agencies had approximately $14.1 billion of non-proprietary mutual funds and fixed and variable annuity account balances under management. New and additional deposits into these non-proprietary products were $2.2 billion in 2018.
Competition
We compete on a variety of factors, including product offerings, brand recognition, financial strength and ratings, price, distribution and the level of customer service. The market for life insurance continues to be highly fragmented and competitive. As of December 31, 2017, there were approximately 360 groups of life insurance companies in the United States.
Geographic markets
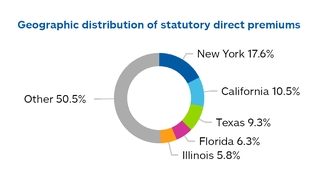
Through subsidiaries, we are authorized to sell various types of life insurance products in all 50 states, D.C. and Puerto Rico. Our top geographic markets are reflected below.
Item 1. Business 2018 Form 10-K
Allstate Benefits Segment
Strategy
Our Allstate Benefits segment accounted for 3.0% of Allstate’s 2018 consolidated total revenue and 3.7% of Allstate’s December 31, 2018 PIF. The Allstate Benefits segment provides consumers with financial protection against the risk of accidents, illness and mortality. We are an industry leader in the rapidly growing voluntary benefits market, offering a broad range of products through workplace enrollment. The voluntary market continues to grow as voluntary benefits products have become a core component of employer benefit offerings. Our life insurance portfolio includes individual and group term life and permanent life solutions.
Our products are offered through a network of independent agents and Allstate exclusive agencies. A broad product portfolio, flexible enrollment solutions and technology (including significant presence on employer benefit administration systems), our strong national accounts team, and a well-recognized brand differentiates Allstate Benefits.
Our strategy for growth is to become the industry leader in the voluntary benefits market by delivering substantially more value through innovative products and technology, tailored solutions and exceptional service. Initiatives are focused on expanding into non-traditional products and becoming an integrated digital enterprise through investments in future-state technologies and data and analytics capabilities.
Products and distribution
Our target customers are middle market consumers with family financial protection needs employed by small, medium and large sized firms. Allstate Benefits is well represented in all market segments and is a leader in the large and mega (over 10,000 employees) market segments.
| Voluntary benefits products | ||
| Life | Short-term disability | |
| Accident | Other health | |
| Critical illness |
| Distribution channels |
| Primary distribution continues to be through 6,200 workplace enrolling independent agents. |
| Allstate exclusive agencies, focusing on small employers, also distribute products. |
Competition
We compete on a wide variety of factors, including product offerings, brand recognition, financial strength and ratings, price, distribution and customer service.
The market for voluntary benefits is growing as these products help employees fill the increasing gaps associated with continued medical cost inflation and the shifting of costs from employers to employees to cover co-pays and deductibles. Favorable industry and economic trends have increased competitive pressure and attracted new traditional and non-traditional entrants to the voluntary benefits market. Recent entrants, including large group medical, life and disability insurance carriers, are leveraging core benefit capabilities by bundling and discounting to capture voluntary market share.
Geographic markets
We are authorized to sell voluntary benefits products in all 50 states, D.C., Puerto Rico, the U.S. Virgin Islands, Guam and Canada. The top geographic markets are reflected below. 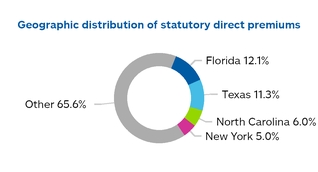
The Allstate Corporation 11
Item 1. Business 2018 Form 10-K
Allstate Annuities Segment
Strategy
Our Allstate Annuities segment accounted for 2.4% of Allstate’s 2018 consolidated total revenue and 0.2% of Allstate’s December 31, 2018 PIF. The Allstate Annuities segment consists primarily of deferred fixed annuities and immediate fixed annuities (including standard and sub-standard structured settlements). The segment is in run-off and is focused on increasing lifetime economic value. Both the deferred and immediate annuity businesses have been adversely impacted by the historically low interest rate environment. Our immediate annuity business has also been impacted by medical advancements that have resulted in annuitants living longer than anticipated when many of these contracts were originated.
Allstate Annuities focuses on the distinct risk and return profiles of the specific products when developing investment and liability management strategies. The level of legacy deferred annuities in force has been significantly reduced and the investment portfolio and crediting rates are proactively managed to improve profitability of the business while providing appropriate levels of liquidity.
The investment portfolio supporting our immediate annuities is managed to ensure the assets match the characteristics of the liabilities and provide the long-term returns needed to support this business. To better match the long-term nature of our immediate annuities, we use performance-based investments in which we have ownership interests and a greater proportion of return is derived from idiosyncratic asset or operating performance.
We continue to review strategic options to reduce exposure and improve returns of the business. As a result, we may take additional operational and financial actions that offer return improvement and risk reduction opportunities.
Products and distribution
We previously offered and continue to have in force deferred fixed annuities and immediate fixed annuities (including standard and sub-standard structured settlements). We exited the continuing sale of annuities over an eight year period from 2006 to 2014, reflecting our expectations of declining returns. In 2006, we disposed of substantially all of the variable annuity business through reinsurance agreements. For discussion of non-proprietary retirement and investment products sold through our Allstate exclusive agencies and exclusive financial specialists, see Part I, Item 1. Allstate Life Segment of this report.
Other Business Segments
Discontinued Lines and Coverages Segment
The Discontinued Lines and Coverages segment includes results from property and casualty insurance coverage that primarily relates to policies written during the 1960s through the mid-1980s.
Strategy Management of this segment has been assigned to a designated group of professionals with expertise in claims handling, policy coverage interpretation, exposure identification, litigation and reinsurance collection. As part of its responsibilities, this group may at times be engaged in policy buybacks, settlements and reinsurance assumed and ceded commutations.
Development in the reserves established for asbestos, environmental and other discontinued lines losses in the future may continue. Reserve changes can be caused by new information relating to new and additional claims or the impact of resolving unsettled claims based on unanticipated events such as arbitrations, litigation, legislative, judicial or regulatory actions. Environmental losses may also increase as the result of additional funding for environmental site clean-up.
Challenges related to the concentration of insurance and reinsurance claims from companies who specialize in this business continue to be addressed.
Corporate and Other Segment
Our Corporate and Other segment is comprised of holding company activities and certain non-insurance operations.
The Allstate Corporation 12
Item 1. Business 2018 Form 10-K
Regulation
Allstate is subject to extensive regulation, primarily at the state level. The method, extent and substance of such regulation vary by state but generally have their source in statutes that establish standards and requirements for conducting the business of insurance and that also delegate regulatory authority to a state agency. These rules have a substantial effect on our business and relate to a wide variety of matters, including insurer solvency and statutory surplus sufficiency, reserve adequacy, insurance company licensing and examination, agent and adjuster licensing, policy forms, rate setting, the nature and amount of investments, claims practices, participation in shared markets and guaranty funds, transactions with affiliates, the payment of dividends, underwriting standards, statutory accounting methods, trade practices, privacy regulation and data security, corporate governance and risk management. In addition, state legislators and insurance regulators continue to examine the appropriate nature and scope of state insurance regulation. For a discussion of statutory financial information, see Note 16 of the consolidated financial statements. For a discussion of regulatory contingencies, see Note 14 of the consolidated financial statements. Notes 14 and 16 are incorporated in this Part I, Item 1 by reference.
As part of an effort to strengthen the regulation of the financial services market, the Dodd-Frank Wall Street Reform and Consumer Protection Act (“Dodd-Frank”) was enacted in 2010. Dodd-Frank created the Federal Insurance Office (“FIO”) within the U.S. Department of the Treasury (“Treasury”). The FIO monitors the insurance industry, provides advice to the Financial Stability Oversight Council (“FSOC”), represents the U.S. on international insurance matters, and studies the current regulatory system.
Additional regulations or new requirements may emerge from the activities of various regulatory entities, including the Federal Reserve Board, FIO, FSOC, the National Association of Insurance Commissioners (“NAIC”), and the International Association of Insurance Supervisors (“IAIS”), that are evaluating solvency and capital standards for insurance company groups. In addition, the NAIC has adopted amendments to its model holding company law that have been adopted by some jurisdictions. The outcome of these actions is uncertain; however, these actions may result in an increase in the level of capital and liquidity required by insurance holding companies.
We cannot predict whether any specific state or federal measures will be adopted to change the nature or scope of the regulation of insurance or what effect any such measures would have on Allstate. We are working for changes in the regulatory environment to make insurance more available and affordable for customers, encourage market innovation, improve driving safety, strengthen cybersecurity, and promote better catastrophe preparedness and loss mitigation.
Agent and Broker Compensation. In recent years, several states considered new legislation or regulations regarding the compensation of agents and
brokers by insurance companies. The proposals ranged in nature from new disclosure requirements to new duties on insurance agents and brokers in dealing with customers.
Limitations on Dividends by Insurance Subsidiaries. As a holding company with no significant business operations of its own, The Allstate Corporation relies on dividends from Allstate Insurance Company as one of the principal sources of cash to pay dividends and to meet its obligations, including the payment of principal and interest on debt or to fund non-insurance-related businesses. Allstate Insurance Company is regulated as an insurance company in Illinois, and its ability to pay dividends is restricted by Illinois law. For additional information regarding those restrictions, see Part II, Item 7 - Management’s Discussion and Analysis of Financial Condition and Results of Operations of this report. The laws of the other jurisdictions that generally govern our other insurance subsidiaries contain similar limitations on the payment of dividends. However, such laws in some jurisdictions may be more restrictive.
Insurance Holding Company Regulation – Change of Control. The Allstate Corporation and Allstate Insurance Company are insurance holding companies subject to regulation in the jurisdictions in which their insurance subsidiaries do business. In the U.S., these subsidiaries are organized under the insurance codes of Florida, Illinois, Massachusetts, New Jersey, New York, Texas, and Wisconsin. Additionally, some of these subsidiaries are considered commercially domiciled in California and Florida.
Generally, the insurance codes in these states provide that the acquisition or change of “control” of a domestic or commercially domiciled insurer or of any person that controls such an insurer cannot be consummated without the prior approval of the relevant insurance regulator. In general, a presumption of “control” arises from the ownership, control, possession with the power to vote, or possession of proxies with respect to ten percent or more of the voting securities of an insurer or of a person who controls an insurer. In addition, certain state insurance laws require pre-acquisition notification to state agencies of a change in control with respect to a non-domestic insurance company licensed to do business in that state. While such pre-acquisition notification statutes do not authorize the state agency to disapprove the change of control, such statutes do authorize certain remedies, including the issuance of a cease-and-desist order with respect to the non-domestic insurer if certain conditions exist, such as undue market concentration.
Thus, any transaction involving the acquisition of ten percent or more of The Allstate Corporation’s common stock would generally require prior approval by the state insurance departments in California, Florida, Illinois, Massachusetts, New Jersey, New York, Texas and Wisconsin. Moreover, notification would be required in those other states that have adopted pre-acquisition notification provisions and where the
The Allstate Corporation 13
2018 Form 10-K Item 1. Business
insurance subsidiaries are admitted to transact business. Such approval requirements may deter, delay or prevent certain transactions affecting the ownership of The Allstate Corporation’s common stock.
Rate Regulation. Nearly all states have insurance laws requiring personal property and casualty insurers to file rating plans, policy or coverage forms, and other information with the state’s regulatory authority. In many cases, such rating plans, policy forms, or both must be approved prior to use.
The speed with which an insurer can change rates in response to competition or increasing costs depends, in part, on whether the rating laws are (i) prior approval, (ii) file-and-use or (iii) use-and-file laws. In states having prior approval laws, the regulator must approve a rate before the insurer may use it. In states having file-and-use laws, the insurer does not have to wait for the regulator’s approval to use a rate, but the rate must be filed with the regulatory authority prior to being used. A use-and-file law requires an insurer to file rates within a certain period of time after the insurer begins using them. Eighteen states, including California and New York, have prior approval laws. Under all three types of rating laws, the regulator has the authority to disapprove a rate filing.
An insurer’s ability to adjust its rates in response to competition or to changing costs is dependent on an insurer’s ability to demonstrate to the regulator that its rates or proposed rating plan meets the requirements of the rating laws. In those states that significantly restrict an insurer’s dis
Showing the first 8K of 100K characters. Open the full section
Item 1A. Risk Factors and Other Disclosures 2018 Form 10-K
for their incurred indemnifiable claims, the MCCA’s annual operating expenses, and any amounts necessary to recoup prior year assessment differences. The MCCA’s current fiscal year private passenger per vehicle assessment is $192 comprising $161 for current fiscal year claims and expenses and $31 for deficit recoupment. The MCCA has a statutory accounting permitted practice that has been granted by the Michigan Department of Insurance to discount its liabilities for loss and loss adjustment expense. As of June 30, 2018, the date of the most recent statutory financial reports, the permitted practice reduced the MCCA’s accumulated deficit of $50.17 billion by $47.25 billion to $2.92 billion. Calculation of the pre-funding discount is dependent on actuarial estimates and investment funding decisions. As of December 31, 2017, our auto market share in Michigan was 8.2%.
On May 17, 2018, member companies of the MCCA were notified of the ratification of amendments to the MCCA’s Plan of Operation. The amendments were designed to clarify the MCCA’s preapproval requirements for certain actions and activities involving benefits provided to covered claimants, including the preapproval of any agreement that sets attendant care rates or residential care facility rates and the preapproval of all nonemergency medical flights. The amendments also require timely notification to the MCCA by member companies of the filing of a lawsuit by claimants. In addition, the amendments address members’ filing inadequate or untimely claim reports, requests for reimbursement payments without required documentation, and the treatment of recoveries obtained from third-parties involving claims for which members have received reimbursement from the MCCA. The amendments became effective on October 1, 2018. At this time, we are unable to determine whether, or to what extent, the amendments, or the exercise of the amendments, will delay or result in denials of the indemnification of members’ ultimate loss and therefore whether or to what extent there could be a material effect on our results of operations and financial condition. Other legislative proposals to change the MCCA operation in the future are put forth periodically.
Technological changes such as autonomous or partially autonomous vehicles or technologies that facilitate ride sharing could significantly impact the number of vehicles in use or the extent of customer needs for vehicle insurance. Although the timing and extent of the technology changes and their impact on the numbers of motor vehicle insurance policies and the extent of their coverage in Michigan are uncertain, these changes may result in a diminished number of insured vehicles over which MCCA assessments can be recovered. To the extent the MCCA assessment to members results in a premium insufficient to reimburse its ultimate obligation on existing claims to member companies, our ability to obtain the 100% indemnification of ultimate loss could be impaired. This could have a material effect on our results of operations and financial condition.
Impacts from the Covered Agreement may involve changes in state insurance laws that may adversely affect our results of operations and financial condition
Existing laws in 15 states require some form of collateral to be posted for the benefit of the ceding insurer when an assuming reinsurer is not domiciled in the ceding company’s state of domicile. In the remaining states, laws governing reinsurance typically require an assuming reinsurer to post an amount of collateral, based on an independently determined financial strength rating and other factors including whether a particular reinsurer has achieved certified status. Under Dodd-Frank, a Covered Agreement may pre-empt state insurance laws that are inconsistent with its terms. The Covered Agreement signed by the U.S. and EU on September 22, 2017, provides states with five years to conform their laws with its terms to avoid preemption. The Covered Agreement between the U.S. and EU will eliminate the requirement for all EU reinsurers that meet certain minimum requirements to post collateral. The elimination of existing collateral requirements could adversely affect our results of operations and financial condition for reinsurance agreements recorded after the effective date of the Covered Agreement if reinsurers fail to pay our ceded reinsurance claims.
Strategic Risks
Our future growth and profitability are dependent in part on our ability to successfully operate in an industry that is highly competitive and that may be impacted by new or changing technologies
Many of our primary competitors have well-established national reputations and market similar products.
We have invested in growth strategies by utilizing unique customer value propositions and business models for each of our market facing businesses. If we are unsuccessful in generating new business, retaining a sufficient number of customers, retaining or acquiring key relationships or renewing contracts within our voluntary benefits or service businesses, our ability to maintain or increase premiums written or the ability to sell our products could be adversely impacted. In addition, if we experience unexpected increases in underlying costs, such as the frequency or severity of claims costs, it could result in decreases in profitability and lead to price increases. This, in turn, could negatively impact our competitive position leading to a decline in new and renewal business.
Further, technological advancements and innovation are occurring in distribution, underwriting and operations at a rapid pace. If we are unable to timely adapt to or bring such advancements and innovations to market, the quality of our products, our relationships with customers and agents, and our business prospects may be materially affected. The additional information that we obtain as a result of such advancements and innovation may require us to modify our assumptions, models, or reserves. Changes in technology related to collection and analysis of data regarding customers could, in these ways or others, expose us to regulatory or legal actions and may have
The Allstate Corporation 29
2018 Form 10-K Part I - Item 1A. Risk Factors and Other Disclosures
a material adverse effect on our business, reputation, results of operations, and financial condition. Many of our competitors are also using analytics to improve pricing accuracy, be more targeted in marketing, strengthen customer relationships and provide more customized services. They may obtain a competitive advantage if they are able to use analytics more effectively than us.
Our ability to adequately and effectively price our products and services is affected by, among other things, the evolving nature of consumer needs and preferences, pricing surcharges and discounts, market dynamics and the broader use of telematics-based rate segmentation and changes in consumer demand due to improvements in telematics technology. Also, our business could be affected by potential technological changes, such as autonomous or partially autonomous vehicles or technologies that facilitate ride, car or home sharing. Such changes could disrupt the demand for products from current customers, create coverage issues or impact the frequency or severity of losses, or reduce the size of the automobile insurance market, causing our auto insurance business to decline. Since auto insurance constitutes a significant portion of our overall business, we may be more sensitive than other insurers and more adversely affected by trends that could decrease auto insurance rates or reduce demand for auto insurance over time. Technological changes may also impact the ways in which we interact and do business with our customers. For example, changing customer preferences may drive a need to redesign our products or distribution model and the way we interact with customers. We may not be able to respond effectively to these changes, which could have a material effect on our results of operations and financial condition.
Because of the competitive nature of the markets in which we operate, there can be no assurance that we will continue to compete effectively within the industry, or that competitive pressures will not have a materially unfavorable effect on our business, results of operations or financial condition. This includes competition for producers such as exclusive and independent agents and their licensed sales professionals. Growth and retention may be materially affected if we are unable to attract and retain effective producers or if those producers are unable to attract and retain their licensed sales professionals or customers. Similarly, growth and retention may be impacted if customer preferences change, including customer demand for direct distribution channels or an increase in point-of-sale distribution channels. Furthermore, certain competitors operate using a different company structure and therefore may have dissimilar profitability and return targets.
Our ability to successfully operate may also be impaired if we are not effective in developing the talent and skills of our human resources, attracting and assimilating new executive talent into our organization, retaining experienced and qualified employees or deploying human resource talent consistently to achieve our business goals. Factors that affect our ability to attract and retain such employees include our
compensation and benefits and our reputation as a successful business with a culture of fairly hiring, training and promoting qualified employees.
Competition from within the insurance industry and from businesses outside the insurance industry, including the technology industry, for qualified employees has often been intense and we have experienced increased competition in hiring and retaining employees. The unexpected loss of key personnel in business units, control functions, information technology, operations or other areas could have a material adverse impact on our business because of the loss of their skills, knowledge of our products and offerings and years of industry experience and, in some cases, the difficulty of promptly finding qualified replacement personnel.
The potential benefits of our sophisticated risk segmentation process may not be fully realized
Sophisticated pricing and underwriting methods have allowed us to offer competitive pricing to attract and retain more customers while continuing to operate profitably. However, because many of our competitors seek to adopt underwriting criteria and sophisticated pricing models similar to those we use, our competitive advantage could decline or be lost. The review of such pricing models by regulators and special interest groups may require changes to such models. In addition, competitive pressures could force us to modify these sophisticated pricing models. We cannot be assured that these sophisticated pricing models will accurately reflect the level of losses that we will ultimately incur.
Acquisitions or divestitures of businesses may not produce anticipated benefits resulting in operating difficulties, unforeseen liabilities or asset impairments, which may adversely affect our results of operations and financial condition
The ability to achieve certain anticipated financial benefits from the acquisition of SquareTrade Holding Company, Inc., InfoArmor, Inc. or other businesses depends in part upon our ability to successfully grow the businesses consistent with our anticipated acquisition economics. Financial results could be adversely affected by unanticipated performance issues, unforeseen liabilities, transaction-related charges, diversion of management time and resources to acquisition integration challenges or growth strategies, loss of key employees, amortization of expenses related to intangibles, charges for impairment of long-term assets or goodwill and indemnifications. In addition, acquired businesses may not perform as projected, cost savings anticipated from the acquisition may not materialize, and costs associated with the integration may be greater than anticipated. As a result, if we do not manage these transitions effectively and bring innovations to market with the requisite speed, the quality of our products as well as our relationships with customers and agents may result in the company not achieving returns on its investment at the level projected at acquisition.
We also may divest businesses from time to time. These transactions may result in continued financial
Part I - Item 1A. Risk Factors and Other Disclosures 2018 Form 10-K
involvement in the divested businesses, such as through reinsurance, guarantees or other financial arrangements, following the transaction. Nonperformance or decline in the financial strength ratings by those divested businesses could affect our future financial results through an increase in policy lapses, decreased future premiums, additional payment obligations, higher costs or asset write-downs. We reinsure life insurance and payout annuity business from Lincoln Benefit Life Company (“LBL”). Premiums and contract charges assumed from LBL totaled $690 million in 2018. A decline in LBL’s financial strength ratings could adversely affect our results of operations by decreasing future premiums.
Reducing our concentration in spread-based business and exiting certain distribution channels may adversely affect annuity reported results
We have been reducing our concentration in spread-based business since 2008 and discontinued offering fixed annuities effective January 1, 2014. We also exited the independent master brokerage agencies and structured settlement annuity brokers distribution channels in 2013 and sold LBL on April 1, 2014. The reduction in sales of these products has and will continue to reduce investment portfolio levels. It may also affect the settlement of contract benefits, including sales of assets with unrealized capital losses and affect insurance reserves deficiency testing.
Item 1B. Unresolved Staff Comments
None.
Item 2. Properties
Our home office complex is owned and located in Northbrook, Illinois. As of December 31, 2018, the home office complex consists of several buildings totaling 1.9 million square feet of office space on a 186-acre site.
We also operate from approximately 500 administrative, data processing, claims handling and other support facilities in North America. In addition to our home office facilities, 825 thousand square feet are owned and 6.0 million square feet are leased. Outside North America, we own one and lease three properties in Northern Ireland comprising approximately 220,000 square feet. We also have two leased facilities in India for approximately 340,000 square feet and two leased facilities in London for 3,385 square feet.
The locations where Allstate exclusive agencies operate in the U.S. are normally leased by the agencies.
Item 3. Legal Proceedings
Information required for Item 3 is incorporated by reference to the discussion under the heading “Regulation and compliance” and under the heading “Legal and regulatory proceedings and inquiries” in Note 14 of the consolidated financial statements.
Item 4. Mine Safety Disclosures
Not applicable.
The Allstate Corporation 31
2018 Form 10-K
Part II
Item 5. Market for Registrant’s Common Equity, Related Stockholder Matters and Issuer Purchases of Equity Securities
As of January 31, 2019, there were 72,568 holders of record of The Allstate Corporation’s common stock. The principal market for the common stock is the New York Stock Exchange, where our common stock trades under the trading symbol “ALL”. Our common stock is also listed on the Chicago Stock Exchange.
Common stock performance graph
The following performance graph compares the cumulative total shareholder return on Allstate common stock for a five-year period (December 31, 2013 to December 31, 2018) with the cumulative total return of the S&P Property and Casualty Insurance Index (S&P P/C) and the S&P’s 500 stock index.
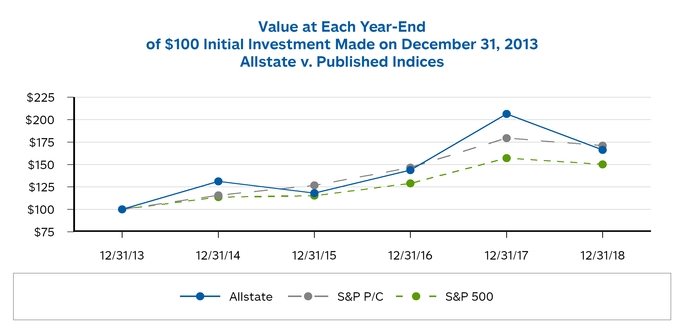
| Value at each year-end of $100 initial investment made on December 31, 2013 | ||||||||||||||||||||||||
| 12/31/2013 | 12/31/2014 | 12/31/2015 | 12/31/2016 | 12/31/2017 | 12/31/2018 | |||||||||||||||||||
| Allstate | $ | 100.00 | $ | 131.23 | $ | 118.15 | $ | 143.80 | $ | 206.52 | $ | 166.21 | ||||||||||||
| S&P P/C | $ | 100.00 | $ | 115.74 | $ | 126.77 | $ | 146.68 | $ | 179.52 | $ | 171.10 | ||||||||||||
| S&P 500 | $ | 100.00 | $ | 113.68 | $ | 115.24 | $ | 129.02 | $ | 157.17 | $ | 150.27 |
2018 Form 10-K
Issuer Purchases of Equity Securities
| Period | Total number of shares (or units) purchased (1) | Average price paid per share (or unit) | Total number of shares (or units) purchased as part of publicly announced plans or programs (3) | Maximum number (or approximate dollar value) of shares (or units) that may yet be purchased under the plans or programs (4) | ||||||||
| October 1, 2018 - October 31, 2018 | ||||||||||||
| Open Market Purchases | 1,155,602 | $ | 96.2500 | 1,147,998 | ||||||||
| November 1, 2018 - November 30, 2018 | ||||||||||||
| Open Market Purchases | 1,352,575 | $ | 89.5608 | 1,351,489 | ||||||||
| December 1, 2018 - December 31, 2018 | ||||||||||||
| ASR Agreement (2) | 10,718,789 | — | 10,718,789 | |||||||||
| Open Market Purchases | 218 | $ | 89.1900 | — | ||||||||
| Total | 13,227,184 | 13,218,276 | $2.07 billion |
| (1) | In accordance with the terms of its equity compensation plans, Allstate acquired the following shares in connection with the vesting of restricted stock units and performance stock awards and the exercise of stock options held by employees and/or directors. The shares were acquired in satisfaction of withholding taxes due upon exercise or vesting and in payment of the exercise price of the options. |
October: 7,604
November: 1,086
December: 218
| (2) | On December 14, 2018, Allstate entered into an accelerated share repurchase agreement (“ASR Agreement”) with Wells Fargo Bank, National Association (“Wells Fargo”), to purchase $1 billion of our outstanding shares of common stock. In exchange for an upfront payment of $1 billion, Wells Fargo initially delivered 10,718,789 shares to Allstate. The actual number of shares we repurchase under the ASR Agreement, and the average price paid per share, will be determined at the completion of the ASR Agreement based on the volume weighted average price of Allstate’s common stock during the period of Wells Fargo’s purchases, which will end on or before May 3, 2019. |
| (3) | From time to time, repurchases under our programs are executed under the terms of a pre-set trading plan meeting the requirements of Rule 10b5-1(c) of the Securities Exchange Act of 1934. |
| (4) | On August 1, 2017, we announced the approval of a new common share repurchase program for $2 billion, which was completed on November 13, 2018. On October 31, 2018, we announced the approval of a common share repurchase program for $3 billion, which is expected to be completed by April 2020. |
The Allstate Corporation 33
2018 Form 10-K
Item 6. Selected Financial Data
| 5-year summary of selected financial data | ||||||||||||||||||||
| ($ in millions, except per share data) | 2018 | 2017 | 2016 | 2015 | 2014 | |||||||||||||||
| Consolidated Operating Results | ||||||||||||||||||||
| Insurance premiums and contract charges | $ | 36,513 | $ | 34,678 | $ | 33,582 | $ | 32,467 | $ | 31,086 | ||||||||||
| Other revenue | 939 | 883 | 865 | 863 | 859 | |||||||||||||||
| Net investment income | 3,240 | 3,401 | 3,042 | 3,156 | 3,459 | |||||||||||||||
| Realized capital gains and losses | (877 | ) | 445 | (90 | ) | 30 | 694 | |||||||||||||
| Total revenues | 39,815 | 39,407 | 37,399 | 36,516 | 36,098 | |||||||||||||||
| Net income applicable to common shareholders | 2,104 | 3,073 | 1,761 | 2,055 | 2,746 | |||||||||||||||
| Net income applicable to common shareholders per common share: | ||||||||||||||||||||
| Net income applicable to common shareholders per common share - Basic | 6.05 | 8.49 | 4.72 | 5.12 | 6.37 | |||||||||||||||
| Net income applicable to common shareholders per common share - Diluted | 5.96 | 8.36 | 4.67 | 5.05 | 6.27 | |||||||||||||||
| Cash dividends declared per common share | 1.84 | 1.48 | 1.32 | 1.20 | 1.12 | |||||||||||||||
| Consolidated Financial Position | ||||||||||||||||||||
| Investments | $ | 81,260 | $ | 82,803 | $ | 81,799 | $ | 77,758 | $ | 81,113 | ||||||||||
| Total assets | 112,249 | 112,422 | 108,610 | 104,656 | 108,479 | |||||||||||||||
| Reserves for claims and claims expense, life-contingent contract benefits and contractholder funds | 58,002 | 58,308 | 57,749 | 57,411 | 57,832 | |||||||||||||||
| Long-term debt | 6,451 | 6,350 | 6,347 | 5,124 | 5,140 | |||||||||||||||
| Shareholders’ equity | 21,312 | 22,551 | 20,573 | 20,025 | 22,304 | |||||||||||||||
| Shareholders’ equity per diluted common share | 57.56 | 57.58 | 50.77 | 47.34 | 48.24 |
2018 Form 10-K
Item 7. Management’s Discussion and Analysis of Financial Condition and Results of Operations
| Page | |||
| Overview and 2018 Highlights | 36 | ||
| Consolidated Net Income | 40 | ||
| Property-Liability Operations | 41 | ||
| Allstate Protection | 44 | ||
| – Allstate brand | 51 | ||
| – Esurance brand | 56 | ||
| – Encompass brand | 60 | ||
| Discontinued Lines and Coverages | 64 | ||
| Service Businesses | 66 | ||
| Claims and Claims Expense Reserves | 68 | ||
| Allstate Life | 77 | ||
| Allstate Benefits | 82 | ||
| Allstate Annuities | 85 | ||
| Investments | 89 | ||
| Market Risk | 99 | ||
| Pension and Other Postretirement Plans | 103 | ||
| Capital Resources and Liquidity | 105 | ||
| Enterprise Risk and Return Management | 112 | ||
| Application of Critical Accounting Estimates | 114 | ||
| Regulation and Legal Proceedings | 127 | ||
| Pending Accounting Standards | 127 |
The Allstate Corporation 35
2018 Form 10-K
Overview
The following discussion highlights significant factors influencing the consolidated financial position and results of operations of The Allstate Corporation (referred to in this document as “we,” “our,” “us,” the “Company” or “Allstate”). It should be read in conjunction with the 5-year summary of selected financial data, consolidated financial statements and related notes found under Part II. Item 6. and Item 8. contained herein.
The most important factors we monitor to evaluate the financial condition and performance for our reportable segments and the Company include:
| • | Allstate Protection: premium, policies in force (“PIF”), new business sales, policy retention, price changes, claim frequency and severity, catastrophes, loss ratio, expenses, underwriting results, and relative competitive position. |
| • | Service Businesses: revenues, premium written, PIF, adjusted net income and net income. |
| • | Allstate Life: premiums and contract charges, new business sales, PIF, benefit spread, expenses, adjusted net income and net income. |
| • | Allstate Benefits: premiums, new business sales, PIF, benefit ratio, expenses, adjusted net income and net income. |
| • | Allstate Annuities: investment spread, asset-liability matching, contract benefits, expenses, adjusted net income, net income and invested assets. |
| • | Investments: exposure to market risk, asset allocation, credit quality/experience, total return, net investment income, cash flows, realized capital gains and losses, unrealized capital gains and losses, stability of long-term returns, and asset and liability duration. |
| • | Financial condition: liquidity, parent holding company deployable assets, financial strength ratings, operating leverage, debt levels, book value per share and return on equity. |
Measuring segment profit or loss
The measure of segment profit or loss used in evaluating performance is underwriting income for the Allstate Protection and Discontinued Lines and Coverages segments and adjusted net income for the Service Businesses, Allstate Life, Allstate Benefits, Allstate Annuities, and Corporate and Other segments.
Underwriting income is calculated as premiums earned and other revenue, less claims and claims expense (“losses”), amortization of deferred policy acquisition costs (“DAC”), operating costs and expenses and restructuring and related charges, as determined using accounting principles generally accepted in the United States of America (“GAAP”). We use this measure in our evaluation of results of operations to analyze the profitability of the Property-Liability insurance operations separately from investment results. Underwriting income is reconciled to net income applicable to common shareholders in the Property-Liability Operations section of Management’s Discussion and Analysis (“MD&A”).
Adjusted net income is net income applicable to common shareholders, excluding:
| • Realized capital gains and losses, after-tax, except for periodic settlements and accruals on non-hedge derivative instruments, which are reported with realized capital gains and losses but included in adjusted net income |
| • Valuation changes on embedded derivatives not hedged, after-tax |
| • Amortization of DAC and deferred sales inducement costs (“DSI”), to the extent they resulted from the recognition of certain realized capital gains and losses or valuation changes on embedded derivatives not hedged, after-tax |
| • Business combination expenses and the amortization of purchased intangible assets, after-tax |
| • Gain (loss) on disposition of operations, after-tax |
| • Adjustments for other significant non-recurring, infrequent or unusual items, when (a) the nature of the charge or gain is such that it is reasonably unlikely to recur within two years, or (b) there has been no similar charge or gain within the prior two years |
Adjusted net income is reconciled to net income applicable to common shareholders in the Service Businesses, Allstate Life, Allstate Benefits and Allstate Annuities Segment sections of MD&A.
2018 Form 10-K
2018 Highlights
| Allstate Delivered on 2018 Operating Priorities (1) | |||||
| Better Serve Customers | Net Promoter Score increased for all major businesses | ||||
| Renewal ratio improved across Allstate, Esurance and Encompass brands | |||||
| Achieve Target Economic Returns on Capital | Return on common shareholders’ equity of 10.5% for 2018 | ||||
| Grow Customer Base | Policy growth accelerated in Allstate and Esurance brands | ||||
| SquareTrade PIF grew 29.9 million, or 77.1%, compared to 2017 | |||||
| Proactively Manage Investments | Net investment income of $3.2 billion in 2018 | ||||
| Total return on $81 billion investment portfolio of 0.8% | |||||
| Building Long-Term Growth Platforms | Expanded telematics offerings, Arity collecting 10 billion miles of data per month | ||||
| SquareTrade continued its rapid growth, adding a leading U.S. retailer during the year | |||||
| Acquired InfoArmor, a fast growing identity protection service provider |
| (1) | 2019 operating priorities will remain con |
Showing the first 8K of 472K characters. Open the full section
Item 7A. Quantitative and Qualitative Disclosures About Market Risk
Information required for Item 7A is incorporated by reference to the material under the caption “Market Risk” in Part II, Item 7 of this report.
The Allstate Corporation 127
2018 Form 10-K
Item 8. Financial Statements and Supplementary Data
| Consolidated Financial Statements | Page | ||
| Consolidated Statements of Operations | 129 | ||
| Consolidated Statements of Comprehensive Income | 130 | ||
| Consolidated Statements of Financial Position | 131 | ||
| Consolidated Statements of Shareholders’ Equity | 132 | ||
| Consolidated Statements of Cash Flows | 133 | ||
| Notes to Consolidated Financial Statements | |||
| Note 1 | General | 134 | |
| Note 2 | Summary of Significant Accounting Policies | 134 | |
| Note 3 | Acquisitions | 146 | |
| Note 4 | Reportable Segments | 146 | |
| Note 5 | Investments | 151 | |
| Note 6 | Fair Value of Assets and Liabilities | 159 | |
| Note 7 | Derivative Financial Instruments and Off-balance Sheet Financial Instruments | 170 | |
| Note 8 | Reserve for Property and Casualty Insurance Claims and Claims Expense | 176 | |
| Note 9 | Reserve for Life-Contingent Contract Benefits and Contractholder Funds | 181 | |
| Note 10 | Reinsurance and Indemnification | 185 | |
| Note 11 | Deferred Policy Acquisition and Sales Inducement Costs | 192 | |
| Note 12 | Capital Structure | 193 | |
| Note 13 | Company Restructuring | 196 | |
| Note 14 | Commitments, Guarantees and Contingent Liabilities | 197 | |
| Note 15 | Income Taxes | 203 | |
| Note 16 | Statutory Financial Information and Dividend Limitations | 205 | |
| Note 17 | Benefit Plans | 206 | |
| Note 18 | Equity Incentive Plans | 214 | |
| Note 19 | Supplemental Cash Flow Information | 216 | |
| Note 20 | Other Comprehensive Income | 216 | |
| Note 21 | Quarterly Results (unaudited) | 217 | |
| Report of Independent Registered Public Accounting Firm | 218 |
128 www.allstate.com
Financial Statements 2018 Form 10-K
The Allstate Corporation and Subsidiaries
Consolidated Statements of Operations
| Years Ended December 31, | ||||||||||||
| ($ in millions, except per share data) | 2018 | 2017 | 2016 | |||||||||
| Revenues | ||||||||||||
| Property and casualty insurance premiums (net of reinsurance ceded and indemnification programs of $1,016, $971 and $987) | $ | 34,048 | $ | 32,300 | $ | 31,307 | ||||||
| Life premiums and contract charges (net of reinsurance ceded of $290, $303 and $309) | 2,465 | 2,378 | 2,275 | |||||||||
| Other revenue | 939 | 883 | 865 | |||||||||
| Net investment income | 3,240 | 3,401 | 3,042 | |||||||||
| Realized capital gains and losses: | ||||||||||||
| Total other-than-temporary impairment (“OTTI”) losses | (13 | ) | (146 | ) | (313 | ) | ||||||
| OTTI losses reclassified (from) to other comprehensive income ("OCI") | (1 | ) | (4 | ) | 10 | |||||||
| Net OTTI losses recognized in earnings | (14 | ) | (150 | ) | (303 | ) | ||||||
| Sales and valuation changes on equity investments and derivatives | (863 | ) | 595 | 213 | ||||||||
| Total realized capital gains and losses | (877 | ) | 445 | (90 | ) | |||||||
| Total revenues | 39,815 | 39,407 | 37,399 | |||||||||
| Costs and expenses | ||||||||||||
| Property and casualty insurance claims and claims expense (net of reinsurance ceded and indemnification programs of $1,378, $1,807 and $1,116) | 22,839 | 21,929 | 22,221 | |||||||||
| Life contract benefits (net of reinsurance ceded of $240, $179 and $208) | 1,973 | 1,923 | 1,857 | |||||||||
| Interest credited to contractholder funds (net of reinsurance ceded of $24, $25 and $26) | 654 | 690 | 726 | |||||||||
| Amortization of deferred policy acquisition costs | 5,222 | 4,784 | 4,550 | |||||||||
| Operating costs and expenses | 5,869 | 5,442 | 4,939 | |||||||||
| Amortization of purchased intangible assets | 105 | 99 | 32 | |||||||||
| Restructuring and related charges | 83 | 109 | 30 | |||||||||
| Goodwill impairment | — | 125 | — | |||||||||
| Interest expense | 332 | 335 | 295 | |||||||||
| Total costs and expenses | 37,077 | 35,436 | 34,650 | |||||||||
| Gain on disposition of operations | 6 | 20 | 5 | |||||||||
| Income from operations before income tax expense | 2,744 | 3,991 | 2,754 | |||||||||
| Income tax expense | 492 | 802 | 877 | |||||||||
| Net income | 2,252 | 3,189 | 1,877 | |||||||||
| Preferred stock dividends | 148 | 116 | 116 | |||||||||
| Net income applicable to common shareholders | $ | 2,104 | $ | 3,073 | $ | 1,761 | ||||||
| Earnings per common share: | ||||||||||||
| Net income applicable to common shareholders per common share - Basic | $ | 6.05 | $ | 8.49 | $ | 4.72 | ||||||
| Weighted average common shares - Basic | 347.8 | 362.0 | 372.8 | |||||||||
| Net income applicable to common shareholders per common share - Diluted | $ | 5.96 | $ | 8.36 | $ | 4.67 | ||||||
| Weighted average common shares - Diluted | 353.2 | 367.8 | 377.3 |
See notes to consolidated financial statements.
The Allstate Corporation 129
2018 Form 10-K Financial Statements
The Allstate Corporation and Subsidiaries
Consolidated Statements of Comprehensive Income
| Years Ended December 31, | ||||||||||||
| ($ in millions) | 2018 | 2017 | 2016 | |||||||||
| Net income | $ | 2,252 | $ | 3,189 | $ | 1,877 | ||||||
| Other comprehensive (loss) income, after-tax |
Showing the first 8K of 482K characters. Open the full section
Item 9. Changes in and Disagreements with Accountants on Accounting and Financial Disclosure
None.
Item 9A. Controls and Procedures
Evaluation of Disclosure Controls and Procedures. We maintain disclosure controls and procedures as defined in Rule 13a-15(e) under the Securities Exchange Act of 1934. Under the supervision and with the participation of our management, including our principal executive officer and principal financial officer, we conducted an evaluation of the effectiveness of our disclosure controls and procedures as of the end of the period covered by this report. Based upon this evaluation, the principal executive officer and the principal financial officer concluded that our disclosure controls and procedures are effective in providing reasonable assurance that material information required to be disclosed in our reports filed with or submitted to the Securities and Exchange Commission under the Securities Exchange Act is recorded, processed, summarized and reported within the time periods specified by the Securities Exchange Act and made known to management, including the principal executive officer and the principal financial officer, as appropriate to allow timely decisions regarding required disclosure.
Management’s Report on Internal Control over Financial Reporting. Management is responsible for establishing and maintaining adequate internal control over financial reporting as defined in Rule 13a-15(f) under the Securities Exchange Act of 1934.
Under the supervision and with the participation of our management, including our principal executive officer and principal financial officer, we conducted an evaluation of the effectiveness of our internal control over financial reporting as of December 31, 2018 based on the criteria related to internal control over financial reporting described in “Internal Control – Integrated Framework (2013)” issued by the Committee of Sponsoring Organizations of the Treadway Commission. Based on our evaluation, management concluded that our internal control over financial reporting was effective as of December 31, 2018.
Deloitte & Touche LLP, the independent registered public accounting firm that audited the consolidated financial statements included in this Form 10-K, has issued their attestation report on the Company’s internal control over financial reporting, which is included herein.
Changes in Internal Control over Financial Reporting. During the fiscal quarter ended December 31, 2018, there have been no changes in our internal control over financial reporting that have materially affected, or are reasonably likely to materially affect, our internal control over financial reporting.
Item 9B. Other Information
Item 10. Directors, Executive Officers and Corporate Governance
Information regarding directors of The Allstate Corporation standing for election at the 2019 annual stockholders meeting is incorporated in this Item 10 by reference to the descriptions in the Proxy Statement under the captions “Corporate Governance – Director Nominees.”
Information regarding our audit committee and audit committee financial experts is incorporated in this Item 10 by reference to the information under the caption “Corporate Governance – Board Meetings and Committees” in the Proxy Statement.
Information regarding compliance with Section 16(a) of the Securities Exchange Act of 1934 is incorporated in this Item 10 by reference to “Stock Ownership Information – Section 16(a) Beneficial Ownership Reporting Compliance” in the Proxy Statement.
Information regarding executive officers of The Allstate Corporation is incorporated in this Item 10 by reference to Part I, Item 1 of this report under the caption “Executive Officers of the Registrant.”
We have adopted a Global Code of Business Conduct that applies to all of our directors and employees, including our principal executive officer, principal financial officer and controller and principal accounting officer. The text of our Global Code of Business Conduct is posted on our website, www.allstateinvestors.com. We intend to satisfy the disclosure requirements, regarding amendments to, and waiver from, the provisions of our Global Code of Business Conduct by posting such information on the same website pursuant to applicable NYSE and SEC rules.
Item 11. Executive Compensation
Information required for Item 11 is incorporated by reference to the sections of the Proxy Statement with the following captions:
| • | Corporate Governance – Director Compensation |
| • | Executive Compensation |
Item 12. Security Ownership of Certain Beneficial Owners and Management and Related Stockholder Matters
Information regarding security ownership of certain beneficial owners and management is incorporated in this Item 12 by reference to the sections of the Proxy Statement with the following captions:
| • | Equity Incentive Plan – Proposal 3. Approval of the 2019 Equity Incentive Plan |
| • | Stock Ownership Information – Security Ownership of Directors and Executive Officers |
| • | Stock Ownership Information – Security Ownership of Certain Beneficial Owners |
Asset managers, such as those that manage mutual funds and exchange traded funds, principally on behalf of third party investors, at times acquire sufficient voting ownership interests in Allstate to require disclosure. State Street Corp. manages an investment portfolio of $2.8 billion on behalf of participants in Allstate’s 401(k) Savings Plan and $1.8 billion on behalf of Allstate domestic qualified pension plans. The terms of these arrangements are customary and the aggregate related fees are not material.
Item 13. Certain Relationships and Related Transactions, and Director Independence
Information required for Item 13 is incorporated by reference to the material in the Proxy Statement under the captions “Corporate Governance – Board Independence and Related Person Transactions - Related Person Transactions," “Corporate Governance – Board Independence and Related Person Transactions - Nominee Independence Determinations” and “Other Information - Appendix B – Categorical Standards of Independence.”
Item 14. Principal Accounting Fees and Services
Information required for Item 14 is incorporated by reference to the material in the Proxy Statement under the caption “Audit Committee Matters – Proposal 4. Ratification of Deloitte & Touche LLP as the Independent Registered Public Accountant for 2019.”
The Allstate Corporation 221
2018 Form 10-K
Part IV
Item 15. (a) (1) Exhibits and Financial Statement Schedules.
The following consolidated financial statements, notes thereto and related information of The Allstate Corporation (the “Company”) are included in Item 8.
| • | Consolidated Statements of Operations |
| • | Consolidated Statements of Comprehensive Income |
| • | Consolidated Statements of Financial Position |
| • | Consolidated Statements of Shareholders’ Equity |
| • | Consolidated Statements of Cash Flows |
| • | Notes to the Consolidated Financial Statements |
| • | Report of Independent Registered Public Accounting Firm |
Item 15. (a) (2)
The following additional financial statement schedules are furnished herewith pursuant to the requirements of Form 10-K.
| The Allstate Corporation | Page | |||
| Schedules required to be filed under the provisions of Regulation S-X Article 7: | ||||
| Schedule I | Summary of Investments – Other than Investments in Related Parties | S-1 | ||
| Schedule II | Condensed Financial Information of Registrant (The Allstate Corporation) | S-2 | ||
| Schedule III | Supplementary Insurance Information | S-6 | ||
| Schedule IV | Reinsurance | S-7 | ||
| Schedule V | Valuation Allowances and Qualifying Accounts | S-8 |
All other schedules are omitted because they are not applicable, or not required, or because the required information is included in the Consolidated Financial Statements or in notes thereto.
Item 15. (a) (3)
The following is a list of the exhibits filed as part of this Form 10-K. The exhibit numbers followed by an asterisk (*) indicate exhibits that are management contracts or compensatory plans or arrangements. A dagger (†) indicates an award form first used under The Allstate Corporation 2001 Equity Incentive Plan, which was amended and restated as The Allstate Corporation 2009 Equity Incentive Plan. A plus (+) indicates an award form first used under The Allstate Corporation 2009 Equity Incentive Plan, which was amended and restated as The Allstate Corporation 2013 Equity Incentive Plan.
222 www.allstate.com
2018 Form 10-K
The Allstate Corporation 223
2018 Form 10-K
224 www.allstate.com
2018 Form 10-K
Item 15. (b)
The exhibits are listed in Item 15. (a)(3) above.
Item 15. (c)
The financial statement schedules are listed in Item 15. (a)(2) above.
Item 16. None.
None.
The Allstate Corporation 225
2018 Form 10-K
Signatures
Pursuant to the requirements of Section 13 or 15(d) of the Securities Exchange Act of 1934, the registrant has duly caused this report to be signed on its behalf by the undersigned, thereunto duly authorized.
| The Allstate Corporation (Registrant) | ||
| /s/ Eric K. Ferren | ||
| By: Eric K. Ferren Senior Vice President, Controller, and Chief Accounting Officer | ||
| February 15, 2019 |
Pursuant to the requirements of the Securities Exchange Act of 1934, this report has been signed below by the following persons on behalf of the registrant and in the capacities and on the dates indicated.
| Signature | Title | Date | ||
| /s/ Thomas J. Wilson | Chairman of the Board, President, Chief Executive Officer and a Director (Principal Executive Officer) | February 15, 2019 | ||
| Thomas J. Wilson | ||||
| /s/ Mario Rizzo | Executive Vice President and Chief Financial Officer (Principal Financial Officer) | February 15, 2019 | ||
| Mario Rizzo | ||||
| /s/ Eric K. Ferren | Senior Vice President, Controller, and Chief Accounting Officer (Principal Accounting Officer) | February 15, 2019 | ||
| Eric K. Ferren | ||||
| /s/ Kermit R. Crawford | Director | February 15, 2019 | ||
| Kermit R. Crawford | ||||
| /s/ Michael L. Eskew | Director | February 15, 2019 | ||
| Michael L. Eskew | ||||
| /s/ Margaret M. Keane | Director | February 15, 2019 | ||
| Margaret M. Keane | ||||
| /s/ Siddharth N. Mehta | Director | February 15, 2019 | ||
| Siddharth N. Mehta | ||||
| /s/ Jacques P. Perold | Director | February 15, 2019 | ||
| Jacques P. Perold | ||||
| /s/ Andrea Redmond | Director | February 15, 2019 | ||
| Andrea Redmond | ||||
| /s/ Gregg M. Sherrill | Director | February 15, 2019 | ||
| Gregg M. Sherrill | ||||
| /s/ Judith A. Sprieser | Lead Director | February 15, 2019 | ||
| Judith A. Sprieser | ||||
| /s/ Perry M. Traquina | Director | February 15, 2019 | ||
| Perry M. Traquina |
226 www.allstate.com
2018 Form 10-K
The Allstate Corporation and Subsidiaries
Schedule I — Summary of Investments Other than Investments in Related Parties
| As of December 31, 2018 | ||||||||||||
| ($ in millions) | Cost/amortized cost | Fair value (if applicable) | Amount shown in the Balance Sheet | |||||||||
| Type of investment | ||||||||||||
| Fixed maturities: | ||||||||||||
| Bonds: | ||||||||||||
| United States government, government agencies and authorities | $ | 5,386 | $ | 5,517 | $ | 5,517 | ||||||
| States, municipalities and political subdivisions | 8,963 | 9,169 | 9,169 | |||||||||
| Foreign governments | 739 | 747 | 747 | |||||||||
| Public utilities | 5,410 | 5,514 | 5,514 | |||||||||
| All other corporate bonds | 35,126 | 34,622 | 34,622 | |||||||||
| Asset-backed securities | 1,049 | 1,045 | 1,045 | |||||||||
| Residential mortgage-backed securities | 377 | 464 | 464 | |||||||||
| Commercial mortgage-backed securities | 63 | 70 | 70 | |||||||||
| Redeemable preferred stocks | 21 | 22 | 22 | |||||||||
| Total fixed maturities | 57,134 | $ | 57,170 | 57,170 | ||||||||
| Equity securities: | ||||||||||||
| Common stocks: | ||||||||||||
| Public utilities | 78 | 93 | 93 | |||||||||
| Banks, trusts and insurance companies | 452 | 525 | 525 | |||||||||
| Industrial, miscellaneous and all other | 3,737 | 4,159 | 4,159 | |||||||||
| Nonredeemable preferred stocks | 222 | 259 | 259 | |||||||||
| Total equity securities | 4,489 | $ | 5,036 | 5,036 | ||||||||
| Mortgage loans on real estate | 4,670 | 4,703 | 4,670 | |||||||||
| Real estate (none acquired in satisfaction of debt) | 624 | 624 | ||||||||||
| Policy loans | 891 | 891 | ||||||||||
| Derivative instruments | 117 | 117 | 117 | |||||||||
| Limited partnership interests | 7,505 | 7,505 | ||||||||||
| Other long-term investments | 2,220 | 2,220 | ||||||||||
| Short-term investments | 3,027 | 3,027 | 3,027 | |||||||||
| Total investments | $ | 80,677 | $ | 81,260 |
The Allstate Corporation S-1
2018 Form 10-K
The Allstate Corporation and Subsidiaries
Schedule II — Condensed Financial Information of Registrant Statement of Operations
| Year Ended December 31, | ||||||||||||
| ($ in millions) | 2018 | 2017 | 2016 | |||||||||
| Revenues | ||||||||||||
| Investment income, less investment expense | $ | 25 | $ | 10 | $ | 11 | ||||||
| Realized capital gains and losses | (10 | ) | (2 | ) | 2 | |||||||
| Other income | 3 | 36 | 55 | |||||||||
| 18 | 44 | 68 | ||||||||||
| Expenses | ||||||||||||
| Interest expense | 337 | 334 | 295 | |||||||||
| Pension and other postretirement benefit expense | 238 | 119 | 10 | |||||||||
| Other operating expenses | 50 | 50 | 28 | |||||||||
| 625 | 503 | 333 | ||||||||||
| Loss from operations before income tax benefit and equity in net income of subsidiaries | (607 | ) | (459 | ) | (265 | ) | ||||||
| Income tax benefit | (115 | ) | (92 | ) | (115 | ) | ||||||
| Loss before equity in net income of subsidiaries | (492 | ) | (367 | ) | (150 | ) | ||||||
| Equity in net income of subsidiaries | 2,744 | 3,556 | 2,027 | |||||||||
| Net income | 2,252 | 3,189 | 1,877 | |||||||||
| Preferred stock dividends | 148 | 116 | 116 | |||||||||
| Net income applicable to common shareholders | 2,104 | 3,073 | 1,761 | |||||||||
| Other comprehensive income (loss), after-tax | ||||||||||||
| Changes in: | ||||||||||||
| Unrealized net capital gains and losses | (754 | ) | 319 | 433 | ||||||||
| Unrealized foreign currency translation adjustments | (55 | ) | 47 | 10 | ||||||||
| Unrecognized pension and other postretirement benefit cost | (144 | ) | 307 | (104 | ) | |||||||
| Other comprehensive (loss) income, after-tax | (953 | ) | 673 | 339 | ||||||||
| Comprehensive income | $ | 1,299 | $ | 3,862 | $ | 2,216 |
See accompanying notes to condensed financial information and notes to consolidated financial statements.
S-2 www.allstate.com
2018 Form 10-K
The Allstate Corporation and Subsidiaries
Schedule II (Continued) — Condensed Financial Information of Registrant Statement of Financial Position
| ($ in millions, except par value data) | December 31, | |||||||
| 2018 | 2017 | |||||||
| Assets | ||||||||
| Investments in subsidiaries | $ | 29,301 | $ | 29,126 | ||||
| Fixed income securities, at fair value (amortized cost $355 and $361) | 356 | 362 | ||||||
| Short-term investments, at fair value (amortized cost $285 and $171) | 285 | 171 | ||||||
| Receivable from subsidiaries | 426 | 427 | ||||||
| Deferred income taxes | 225 | 124 | ||||||
| Other assets | 92 | 150 | ||||||
| Total assets | $ | 30,685 | $ | 30,360 | ||||
| Liabilities | ||||||||
| Long-term debt | $ | 6,451 | $ | 6,350 | ||||
| Pension and other postretirement benefit obligations | 1,050 | 675 | ||||||
| Deferred compensation | 281 | 297 | ||||||
| Payable to subsidiaries | 3 | — | ||||||
| Notes due to subsidiaries | 1,250 | 250 | ||||||
| Dividends payable to shareholders | 198 | 167 | ||||||
| Other liabilities | 140 | 70 | ||||||
| Total liabilities | 9,373 | 7,809 | ||||||
| Shareholders’ equity | ||||||||
| Preferred stock and additional capital paid-in, $1 par value, 25 million shares authorized, 79.8 thousand and 72.2 thousand shares issued and outstanding, $1,995 and $1,805 aggregate liquidation preference | 1,930 | 1,746 | ||||||
| Common stock, $.01 par value, 2.0 billion shares authorized and 900 million issued, 332 million and 355 million shares outstanding | 9 | 9 | ||||||
| Additional capital paid-in | 3,310 | 3,313 | ||||||
| Retained income | 45,708 | 43,162 | ||||||
| Deferred ESOP expense | (3 | ) | (3 | ) | ||||
| Treasury stock, at cost (568 million and 545 million shares) | (28,085 | ) | (25,982 | ) | ||||
| Accumulated other comprehensive income: | ||||||||
| Unrealized net capital gains and losses | (2 | ) | 1,662 | |||||
| Unrealized foreign currency translation adjustments | (64 | ) | (9 | ) | ||||
| Unrecognized pension and other postretirement benefit cost | (1,491 | ) | (1,347 | ) | ||||
| Total accumulated other comprehensive (loss) income | (1,557 | ) | 306 | |||||
| Total shareholders’ equity | 21,312 | 22,551 | ||||||
| Total liabilities and shareholders’ equity | $ | 30,685 | $ | 30,360 |
See accompanying notes to condensed financial information and notes to consolidated financial statements.
The Allstate Corporation S-3
2018 Form 10-K
The Allstate Corporation and Subsidiaries
Schedule II (Continued) — Condensed Financial Information of Registrant Statement of Cash Flows
| ($ in millions) | Years Ended December 31, | |||||||||||
| 2018 | 2017 | 2016 | ||||||||||
| Cash flows from operating activities | ||||||||||||
| Net income | $ | 2,252 | $ | 3,189 | $ | 1,877 | ||||||
| Adjustments to reconcile net income to net cash provided by operating activities: | ||||||||||||
| Equity in net income of subsidiaries | (2,744 | ) | (3,556 | ) | (2,027 | ) | ||||||
| Dividends received from subsidiaries | 2,059 | 1,671 | 1,874 | |||||||||
| Realized capital gains and losses | 10 | 2 | (2 | ) | ||||||||
| Changes in: | ||||||||||||
| Pension and other postretirement benefits | 238 | 119 | 10 | |||||||||
| Income taxes | (7 | ) | 35 | 13 | ||||||||
| Operating assets and liabilities | 160 | 56 | 43 | |||||||||
| Net cash provided by operating activities | 1,968 | 1,516 | 1,788 | |||||||||
| Cash flows from investing activities | ||||||||||||
| Proceeds from sales of investments | 1,370 | 880 | 389 | |||||||||
| Proceeds from sales of investments to subsidiaries | 390 | — | — | |||||||||
| Investment purchases | (1,037 | ) | (748 | ) | (243 | ) | ||||||
| Investment collections | 108 | 13 | 60 | |||||||||
| Capital contribution or return of capital from subsidiaries | (975 | ) | 42 | (1,500 | ) | |||||||
| Transfers to subsidiaries through intercompany loan agreement | — | — | (30 | ) | ||||||||
| Change in short-term investments, net | (115 | ) | 48 | 58 | ||||||||
| Net cash (used in) provided by investing activities | (259 | ) | 235 | (1,266 | ) | |||||||
| Cash flows from financing activities | ||||||||||||
| Proceeds from borrowings from subsidiaries | 1,250 | 300 | — | |||||||||
| Repayment of notes due to subsidiaries | (250 | ) | (50 | ) | — | |||||||
| Proceeds from issuance of long-term debt | 498 | — | 1,236 | |||||||||
| Redemption of preferred stock | (385 | ) | — | — | ||||||||
| Redemption and repayment of long-term debt | (400 | ) | — | (17 | ) | |||||||
| Proceeds from issuance of preferred stock | 557 | — | — | |||||||||
| Dividends paid on common stock | (614 | ) | (525 | ) | (486 | ) | ||||||
| Dividends paid on preferred stock | (134 | ) | (116 | ) | (116 | ) | ||||||
| Treasury stock purchases | (2,303 | ) | (1,495 | ) | (1,337 | ) | ||||||
| Shares reissued under equity incentive plans, net | 73 | 135 | 164 | |||||||||
| Excess tax benefits on share-based payment arrangements | — | — | 32 | |||||||||
| Other | (1 | ) | (2 | ) | — | |||||||
| Net cash used in financing activities | (1,709 | ) | (1,753 | ) | (524 | ) | ||||||
| Net decrease in cash | — | (2 | ) | (2 | ) | |||||||
| Cash at beginning of year | — | 2 | 4 | |||||||||
| Cash at end of year | $ | — | $ | — | $ | 2 |
See accompanying notes to condensed financial information and notes to consolidated financial statements.
S-4 www.allstate.com
2018 Form 10-K
The Allstate Corporation and Subsidiaries
Schedule II (Continued) — Condensed Financial Information of Registrant
Notes to Condensed Financial Information
- General
The financial statements of the Registrant should be read in conjunction with the consolidated financial statements and notes thereto included in Item 8. The long-term debt presented in Note 12 “Capital Structure” are direct obligations of the Registrant. A majority of the pension and other postretirement benefits plans presented in Note 17 “Benefit Plans” are direct obligations of the Registrant.
Participating subsidiaries fund the pension plans contributions under a master services cost sharing agreement. In addition, as a result of joint and several pension liability rules under the Internal Revenue Code and the Employee Retirement Income Security Act of 1974, as amended, many liabilities that arise in connection with pension plans are joint and several across all members of a controlled group of entities.
- Notes due to subsidiaries
On October 11, 2018 and December 18, 2018 the Registrant issued $250 million and $1.00 billion notes, with a rate of 2.49% and 3.03% due on April 11, 2019 and June 18, 2019 respectively, both to its wholly owned subsidiary Kennett Capital Inc. The proceeds of these issuances were used for cash management purposes.
On December 11, 2017, the Registrant issued $125 million and $175 million notes, each with a rate of 1.59% and due on June 11, 2018, to its wholly owned subsidiaries Kennett Capital Inc. and Allstate Non-Insurance Holdings Inc (“ANIHI”), respectively. The proceeds of these issuances were used for cash management purposes. On December 20, 2017, the Registrant repaid $50 million to ANIHI. On April 17, 2018, the Registrant repaid $125 million and $125 million to Kennett Capital Inc. and ANIHI, respectively.
- Supplemental Disclosures of Cash Flow Information
The Registrant paid $330 million, $331 million and $287 million of interest on debt in 2018, 2017 and 2016, respectively.
The Allstate Corporation S-5
2018 Form 10-K
The Allstate Corporation and Subsidiaries
Schedule III — Supplementary Insurance Information
| ($ in millions) | As of December 31, | For the years ended December 31, | ||||||||||||||||||||||||||||||||||
| Segment | Deferred policy acquisition costs | Reserves for claims and claims expense, contract benefits and contractholder funds | Unearned premiums | Premium revenue and contract charges | Net investment income (1) | Claims and claims expense, contract benefits and interest credited to contractholders | Amortization of deferred policy acquisition costs | Other operating costs and expenses | Premiums written (excluding life) | |||||||||||||||||||||||||||
| 2018 | ||||||||||||||||||||||||||||||||||||
| Property-Liability | ||||||||||||||||||||||||||||||||||||
| Allstate Protection | $ | 1,618 | $ | 25,495 | $ | 11,953 | $ | 32,950 | $ | 22,408 | $ | 4,475 | $ | 4,618 | $ | 33,555 | ||||||||||||||||||||
| Discontinued Lines and Coverages | — | 1,864 | — | — | 87 | — | 3 | — | ||||||||||||||||||||||||||||
| Total Property-Liability | 1,618 | 27,359 | 11,953 | 32,950 | $ | 1,464 | 22,495 | 4,475 | 4,621 | 33,555 | ||||||||||||||||||||||||||
| Service Businesses (2) | 1,290 | 64 | 2,546 | 1,220 | 27 | 351 | 463 | 609 | 1,431 | |||||||||||||||||||||||||||
| Allstate Life | 1,300 | 10,333 | 3 | 1,315 | 505 | 1,094 | 132 | 372 | — | |||||||||||||||||||||||||||
| Allstate Benefits | 549 | 1,905 | 8 | 1,135 | 77 | 630 | 145 | 285 | 980 | |||||||||||||||||||||||||||
| Allstate Annuities | 27 | 18,341 | — | 15 | 1,096 | 903 | 7 | 32 | — | |||||||||||||||||||||||||||
| Corporate and Other | — | — | — | — | 71 | — | — | 585 | — | |||||||||||||||||||||||||||
| Intersegment Eliminations (2) | — | — | — | (122 | ) | — | (7 | ) | — | (115 | ) | — | ||||||||||||||||||||||||
| Total | $ | 4,784 | $ | 58,002 | $ | 14,510 | $ | 36,513 | $ | 3,240 | $ | 25,466 | $ | 5,222 | $ | 6,389 | $ | 35,966 | ||||||||||||||||||
| 2017 | ||||||||||||||||||||||||||||||||||||
| Property-Liability | ||||||||||||||||||||||||||||||||||||
| Allstate Protection | $ | 1,510 | $ | 24,336 | $ | 11,409 | $ | 31,433 | $ | 21,470 | $ | 4,205 | $ | 4,350 | $ | 31,648 | ||||||||||||||||||||
| Discontinued Lines and Coverages | — | 1,893 | — | — | 96 | — | 3 | — | ||||||||||||||||||||||||||||
| Total Property-Liability | 1,510 | 26,229 | 11,409 | 31,433 | $ | 1,478 | 21,566 | 4,205 | 4,353 | 31,648 | ||||||||||||||||||||||||||
| Service Businesses (2) | 954 | 96 | 2,052 | 977 | 16 | 369 | 296 | 572 | 1,094 | |||||||||||||||||||||||||||
| Allstate Life | 1,152 | 10,244 | 4 | 1,280 | 489 | 1,047 | 134 | 354 | — | |||||||||||||||||||||||||||
| Allstate Benefits | 541 | 1,869 | 8 | 1,084 | 72 | 599 | 142 | 269 | 919 | |||||||||||||||||||||||||||
| Allstate Annuities | 34 | 19,870 | — | 14 | 1,305 | 967 | 7 | 35 | — | |||||||||||||||||||||||||||
| Corporate and Other | — | — | — | — | 41 | — | — | 631 | — | |||||||||||||||||||||||||||
| Intersegment Eliminations (2) | — | — | — | (110 | ) | — | (6 | ) | — | (104 | ) | — | ||||||||||||||||||||||||
| Total | $ | 4,191 | $ | 58,308 | $ | 13,473 | $ | 34,678 | $ | 3,401 | $ | 24,542 | $ | 4,784 | $ | 6,110 | $ | 33,661 | ||||||||||||||||||
| 2016 | ||||||||||||||||||||||||||||||||||||
| Property-Liability | ||||||||||||||||||||||||||||||||||||
| Allstate Protection | $ | 1,432 | $ | 23,263 | $ | 11,160 | $ | 30,727 | $ | 21,863 | $ | 4,053 | $ | 4,172 | $ | 30,888 | ||||||||||||||||||||
| Discontinued Lines and Coverages | — | 1,953 | — | — | 105 | — | 2 | 3 | ||||||||||||||||||||||||||||
| Total Property-Liability | 1,432 | 25,216 | 11,160 | 30,727 | $ | 1,253 | 21,968 | 4,053 | 4,174 | 30,891 | ||||||||||||||||||||||||||
| Service Businesses (2) | 756 | 34 | 1,411 | 685 | 13 | 258 | 214 | 287 | 709 | |||||||||||||||||||||||||||
| Allstate Life | 1,200 | 10,042 | 4 | 1,250 | 482 | 1,027 | 131 | 339 | — | |||||||||||||||||||||||||||
| Allstate Benefits | 526 | 1,821 | 8 | 1,011 | 71 | 545 | 145 | 240 | 855 | |||||||||||||||||||||||||||
| Allstate Annuities | 40 | 20,636 | — | 14 | 1,181 | 1,011 | 7 | 32 | — | |||||||||||||||||||||||||||
| Corporate and Other | — | — | — | — | 42 | — | — | 324 | — | |||||||||||||||||||||||||||
| Intersegment Eliminations (2) | — | — | — | (105 | ) | — | (5 | ) | — | (100 | ) | — | ||||||||||||||||||||||||
| Total | $ | 3,954 | $ | 57,749 | $ | 12,583 | $ | 33,582 | $ | 3,042 | $ | 24,804 | $ | 4,550 | $ | 5,296 | $ | 32,455 |
| (1) | A single investment portfolio supports both Allstate Protection and Discontinued Lines and Coverages segments. |
| (2) | Includes intersegment premiums and service fees and the related incurred losses and expenses that are eliminated in the consolidated financial statements. |
S-6 www.allstate.com
2018 Form 10-K
The Allstate Corporation and Subsidiaries
Schedule IV — Reinsurance
| ($ in millions) | Gross amount | Ceded to other companies (1) | Assumed from other companies | Net amount | Percentage of amount assumed to net | ||||||||||||||
| Year ended December 31, 2018 | |||||||||||||||||||
| Life insurance in force | $ | 207,434 | $ | 81,186 | $ | 243,161 | $ | 369,409 | 65.8 | % | |||||||||
| Premiums and contract charges: | |||||||||||||||||||
| Life insurance | $ | 994 | $ | 266 | $ | 754 | $ | 1,482 | 50.9 | % | |||||||||
| Accident and health insurance | 1,007 | 24 | — | 983 | — | % | |||||||||||||
| Property and casualty insurance | 34,977 | 1,016 | 87 | 34,048 | 0.3 | % | |||||||||||||
| Total premiums and contract charges | $ | 36,978 | $ | 1,306 | $ | 841 | $ | 36,513 | 2.3 | % | |||||||||
| Year ended December 31, 2017 | |||||||||||||||||||
| Life insurance in force | $ | 188,186 | $ | 86,642 | $ | 259,671 | $ | 361,215 | 71.9 | % | |||||||||
| Premiums and contract charges: | |||||||||||||||||||
| Life insurance | $ | 936 | $ | 276 | $ | 787 | $ | 1,447 | 54.4 | % | |||||||||
| Accident and health insurance | 958 | 27 | — | 931 | — | % | |||||||||||||
| Property and casualty insurance | 33,221 | 971 | 50 | 32,300 | 0.2 | % | |||||||||||||
| Total premiums and contract charges | $ | 35,115 | $ | 1,274 | $ | 837 | $ | 34,678 | 2.4 | % | |||||||||
| Year ended December 31, 2016 | |||||||||||||||||||
| Life insurance in force | $ | 167,355 | $ | 90,011 | $ | 275,008 | $ | 352,352 | 78.0 | % | |||||||||
| Premiums and contract charges: | |||||||||||||||||||
| Life insurance | $ | 877 | $ | 279 | $ | 818 | $ | 1,416 | 57.8 | % | |||||||||
| Accident and health insurance | 889 | 30 | — | 859 | — | % | |||||||||||||
| Property and casualty insurance | 32,249 | 987 | 45 | 31,307 | 0.1 | % | |||||||||||||
| Total premiums and contract charges | $ | 34,015 | $ | 1,296 | $ | 863 | $ | 33,582 | 2.6 | % |
| (1) | No reinsurance or coinsurance income was netted against premium ceded in 2018, 2017 or 2016. |
The Allstate Corporation S-7
2018 Form 10-K
The Allstate Corporation and Subsidiaries
Schedule V — Valuation Allowances and Qualifying Accounts
| ($ in millions) | Additions | |||||||||||||||||||
| Description | Balance as of beginning of period | Charged to costs and expenses | Other additions | Deductions | Balance as of end of period | |||||||||||||||
| Year ended December 31, 2018 | ||||||||||||||||||||
| Allowance for reinsurance recoverables | $ | 70 | $ | (5 | ) | $ | — | $ | — | $ | 65 | |||||||||
| Allowance for premium installment receivable | 77 | 118 | — | 118 | 77 | |||||||||||||||
| Allowance for deferred tax assets | — | — | — | — | — | |||||||||||||||
| Allowance for estimated losses on mortgage loans | 3 | — | — | — | 3 | |||||||||||||||
| Year ended December 31, 2017 | ||||||||||||||||||||
| Allowance for reinsurance recoverables | $ | 84 | $ | (10 | ) | $ | — | $ | 4 | $ | 70 | |||||||||
| Allowance for premium installment receivable | 84 | 109 | — | 116 | 77 | |||||||||||||||
| Allowance for deferred tax assets | — | — | — | — | — | |||||||||||||||
| Allowance for estimated losses on mortgage loans | 3 | 1 | — | 1 | 3 | |||||||||||||||
| Year ended December 31, 2016 | ||||||||||||||||||||
| Allowance for reinsurance recoverables | $ | 80 | $ | 5 | $ | — | $ | 1 | $ | 84 | ||||||||||
| Allowance for premium installment receivable | 90 | 107 | — | 113 | 84 | |||||||||||||||
| Allowance for deferred tax assets | — | — | — | — | — | |||||||||||||||
| Allowance for estimated losses on mortgage loans | 3 | — | — | — | 3 |
S-8 www.allstate.com