 filings.tools
Applied Materials (AMAT) 10-K risk factor changes: FY2019 vs FY2018
The 2019-10-27 10-K against the 2018-10-28 one, compared heading by heading and sentence by sentence. One of these filings carries no fiscal year tag, so its year is the calendar year of the period end.
Item 1A156 rewritten6 added229 removed118 unchanged
All filing items1,565 rewritten903 added1,065 removed842 unchanged
Summary
counted, not written
- Item 1A headings could not be compared: only 0 carried over between the two years, which usually means one filing was read wrongly, so none is reported as new or removed.
- Sentence by sentence, 903 added, 1,065 removed, 1,565 rewritten and 842 unchanged across 22 items that differ.
Sentences by item
22 items, with every count and a link to each item that changed
Underlined words on a shaded ground are new in FY2019; struck-through words were in FY2018. Sentences that are wholly new or wholly gone are labelled rather than marked.
Item 1A. Risk Factors
156 rewritten, 6 added, 229 removed, 118 unchanged
Read the full itemFY2019 item · filed December 13, 2019FY2018 item · filed December 13, 2018
[removed: The] [added: The] industries that Applied serves can be volatile and difficult to [removed: predict.][added: predict.]
As a supplier to the global semiconductor and display and related industries, Applied is subject to variable industry conditions, [removed: as] [added: since] demand for manufacturing equipment and services can change depending on several factors, including the nature and timing of technology inflections and advances in fabrication processes, the timing and requirements of new and emerging technologies and market drivers, production capacity relative to demand for chips and display technologies, end-user demand, customers’ capacity utilization, production volumes, access to affordable capital, consumer buying patterns and general economic conditions.
These changes can affect the timing and amounts of customer investments in technology and manufacturing [removed: equipment,] [added: equipment] and can have a significant impact on Applied’s net sales, operating expenses, gross margins and net income.
[removed: Applied] [added: Applied] is exposed to risks associated with an uncertain global [removed: economy.][added: economy.]
[removed: Applied] [added: Applied] is exposed to the risks of operating a global [removed: business.][added: business.]
Moreover, in fiscal [removed: 2018,] [added: 2019,] approximately [removed: 91] [added: 87] percent of Applied’s net sales were to customers in regions outside the United States.
[removed: | • |] [added: -] uncertain global economic and political business conditions and demands; [removed: |]
[removed: | • |] [added: -] political and social attitudes, laws, rules, regulations and policies within countries that favor domestic companies over non-domestic companies, including customer- or government-supported efforts to promote the development and growth of local competitors; [removed: |]
[removed: | • |] [added: -] global trade issues and changes in and uncertainties with respect to trade policies, including the ability to obtain required import and export licenses, trade sanctions, tariffs, and international trade disputes; [removed: |]
[removed: | • |] [added: -] customer- or government-supported efforts to influence Applied to conduct more of its operations and sourcing in a particular country, such as Korea and China; [removed: |]
[removed: | • |] [added: -] variations among, and changes in, local, regional, national or international laws and regulations, including contract, intellectual property, cybersecurity, data privacy, labor, tax, and import/export laws, and the interpretation and application of such laws and regulations; [removed: |]
[removed: | • |] [added: -] ineffective or inadequate legal protection of intellectual property rights in certain countries; [removed: |]
[removed: | • |] [added: -] positions taken by governmental agencies regarding possible national commercial and/or security issues posed by international business operations; [removed: |]
[removed: | • |] [added: -] fluctuating raw material, commodity, energy and shipping costs; [removed: |]
[removed: | • |] [added: -] delays or restrictions in shipping materials or finished products between countries; [removed: |]
[removed: | • |] [added: -] geographically diverse operations and projects, and our ability to maintain appropriate business processes, procedures and internal controls, and comply with environmental, health and safety, anti-corruption and other regulatory requirements; [removed: |]
[removed: | • |] [added: -] supply chain interruptions, and service interruptions from utilities, transportation, data hosting or telecommunications providers, or other events beyond our control; [removed: |]
[removed: | • |] [added: - failure to effectively manage] a diverse workforce with different experience levels, languages, cultures, customs, business practices and worker expectations, and differing employment practices and labor issues; [removed: |]
[removed: | • |] [added: -] variations in the ability to develop relationships with local customers, suppliers and governments; [removed: |]
[removed: | • |] [added: -] fluctuations in interest rates and currency exchange rates, including the relative strength or weakness of the U.S. dollar against the Japanese yen, [added: Israeli shekel,] euro, Taiwanese dollar, [removed: Israeli shekel,] [added: Singapore dollar,] Chinese yuan or [removed: Singapore dollar; |][added: Korean won;]
[removed: | • |] [added: -] the need to provide sufficient levels of technical support in different locations around the world; [removed: |]
[removed: | • |] [added: -] performance of third party providers of outsourced functions, including certain engineering, software development, manufacturing, information technology and other activities; [removed: |]
[removed: | • |] [added: -] political instability, natural disasters, pandemics, social unrest, terrorism or acts of war in locations where Applied has operations, suppliers or sales, or that may influence the value chain of the industries that Applied serves; [removed: |]
[removed: | • |] [added: -] challenges in hiring and integration of an increasing number of workers in new countries; [removed: |]
[removed: | • |] [added: -] the increasing need for a mobile workforce to work in or travel to different regions; and [removed: |]
[removed: | • |] [added: -] uncertainties with respect to economic growth rates in various countries, including for the manufacture and sale of semiconductors and displays in the developing economies of certain countries. [removed: |]
[removed: International] [added: International] trade disputes could result in increases in tariffs and other trade restrictions and protectionist measures that could have an adverse impact on our [removed: operations.][added: operations.]
We [removed: sell a significant majority of our products into countries outside of the United States and we] [added: also] purchase a significant portion of equipment and supplies from suppliers outside of the United States.
The United States and other countries have [added: imposed and may continue to impose trade restrictions, and have also] levied tariffs and taxes on certain goods.
Increases in tariffs, additional taxes or other trade restrictions and retaliatory measures may [added: increasingly] impact end-user demand and customer investment in manufacturing equipment, increase our manufacturing costs, decrease margins, reduce the competitiveness of our products, or inhibit our ability to sell products or purchase necessary equipment and supplies, which could have a material adverse effect on our business, results of operations, or financial condition.
Many of these challenges are present in China and Korea, markets that represent [added: a] significant [added: portion of Applied’s current business as well as] long-term growth [removed: opportunities for Applied businesses.][added: opportunities.]
[removed: Applied] [added: Applied] is exposed to risks as a result of ongoing changes in the various industries in which it [removed: operates.][added: operates.]
[removed: | • |] [added: -] the nature, timing and degree of visibility of changes in end demand for electronic products, including those related to fluctuations in consumer buying patterns tied to seasonality or the introduction of new products, and the effects of these changes on customers’ businesses and on demand for Applied’s products; [removed: |]
[removed: | • |] [added: -] increasing capital requirements for building and operating new fabrication plants and customers’ ability to raise the necessary capital; [removed: |]
[removed: | • |] [added: -] trade, regulatory or tax policies impacting the timing of customers’ investment in new or expanded fabrication plants; [removed: |]
[removed: | • |] [added: -] differences in growth rates among the semiconductor, display and other industries in which Applied operates; [removed: |]
[removed: | • |] [added: -] the increasing importance of establishing, improving and maintaining strong relationships with customers; [removed: |]
[removed: | • |] [added: -] the increasing cost and complexity for customers to move from product design to volume manufacturing, which may slow the adoption rate of new manufacturing technology; [removed: |]
[removed: | • |] [added: -] the need for customers to continually reduce the total cost of manufacturing system ownership; [removed: |]
[removed: | • |] [added: -] the heightened importance to customers of system reliability and productivity and the effect on demand for fabrication systems as a result of their increasing productivity, device yield and reliability; [removed: |]
We sell a significant majority of our products into countries outside of the United States including China, Taiwan and Korea.
- the growing importance of specialty markets (such as Internet of Things, communications, automotive, power and sensors) that use mature process technologies and have a low barrier to entry.
Applied continually assesses the strategic fit of its businesses and may from time to time seek to divest portions of its business that are not deemed to fit with its strategic plan.
Divestitures involve significant risks and uncertainties, such as ability to sell such businesses on satisfactory price and terms and in a timely manner (including long and costly sales processes and the possibility of lengthy and potentially unsuccessful attempts by a buyer to receive required regulatory approvals), or at all, disruption to other parts of the businesses and distraction of management, allocation of internal resources that would otherwise be devoted to completing strategic acquisitions, loss of key employees or customers, exposure to unanticipated liabilities (including, among other things, those arising from representations and warranties made to a buyer regarding the businesses) or ongoing obligations to support the businesses following such divestitures, and other adverse financial impacts.
As a result, Applied reversed a tax benefit of $96 million in the third quarter of fiscal 2019 that had been realized in the first half of fiscal 2019.
Applied also has in place a $1.5 billion revolving credit facility, and a $2.0 billion term loan facility to finance in part its planned acquisition of Kokusai Electric.
| | |
| --- | --- |
| | |
| --- | --- |
| | |
| --- | --- |
| | |
| --- | --- |
| | |
| --- | --- |
| | |
| --- | --- |
| | |
| --- | --- |
| | |
| --- | --- |
| | |
| --- | --- |
| | |
| --- | --- |
| | |
| --- | --- |
| | |
| --- | --- |
| | |
| --- | --- |
| | |
| --- | --- |
| | |
| --- | --- |
| | |
| --- | --- |
| | |
| --- | --- |
| | |
| --- | --- |
| | |
| --- | --- |
| | |
| --- | --- |
An excerpt. Shown here: 40 of 156 rewritten, all 6 added and 40 of 229 removed. The counts are complete. For every sentence, read Item 1A. Risk Factors in the FY2019 filing and the FY2018 filing.
Item 7. Management’s Discussion and Analysis of Financial Condition and Results of Operations
243 rewritten, 241 added, 201 removed, 194 unchanged
Read the full itemFY2019 item · filed December 13, 2019FY2018 item · filed December 13, 2018
[removed: Introduction][added: Introduction]
[removed: | • | Overview:] [added: - *Overview:*] a summary of Applied’s business and measurements [removed: |]
[removed: | • | Results] [added: - *Results] of [removed: Operations:] [added: Operations:*] a discussion of operating results [removed: |]
[removed: | • | Segment Information:] [added: - *Segment Information:*] a discussion of segment operating results [removed: |]
[removed: | • | Recent] [added: *•Recent] Accounting [removed: Pronouncements:] [added: Pronouncements:*] a discussion of new accounting pronouncements and its impact to Applied’s consolidated financial statements [removed: |]
[removed: | • | Financial] [added: - *Financial] Condition, Liquidity and Capital [removed: Resources:] [added: Resources:*] an analysis of cash flows, sources and uses of cash [removed: |]
[removed: | • | Off-Balance] [added: - *Off-Balance] Sheet Arrangements and Contractual [removed: Obligations |][added: Obligations*]
[removed: | • | Critical] [added: - *Critical] Accounting Policies and [removed: Estimates:] [added: Estimates:*] a discussion of critical accounting policies that require the exercise of judgments and estimates [removed: |]
[removed: | • | Non-GAAP] [added: - *Non-GAAP] Adjusted [removed: Results:] [added: Results:*] a presentation of results reconciling GAAP to non-GAAP adjusted measures [removed: |]
[removed: Overview][added: Overview]
A summary of financial information for each reportable segment is found in Note [removed: 15] [added: 16] of Notes to Consolidated Financial Statements.
Spending by semiconductor customers, which include companies that operate in the foundry, [removed: memory and] logic [added: and memory] markets, is driven by demand for advanced electronic products, including smartphones and other mobile devices, servers, personal computers, automotive devices, storage, and other products.
| | | | | | | | | | | | | | [removed: Change] | | | | | | | [added: | Change | | | | | | | | | | | | | | | | | | | | | | | | | | | | | | | | |]
| | [removed: 2018] | | [added: 2019] | | [removed: 2017] | | | | [removed: 2016] [added: 2018] | | | | [removed: 2018] [added: | | 2017 | | | | | | 2019] over [removed: 2017] [added: 2018] | | | | [removed: 2017] [added: | | 2018] over [removed: 2016] [added: 2017] | | | [added: | | | | | | | | | | | | | | | | | | | | | | | |]
| | [removed: (In] [added: | | (In] millions, except per share amounts and [removed: percentages)] [added: percentages)] | | | | | | | | | | | | | | | | | | | [added: | | | | | | | | | | | | | | | | | | | | | | | | | | | | | | | |]
Fiscal [added: 2019,] 2018 and 2017 [added: each] contained 52 [removed: weeks, and fiscal 2016 contained 53] weeks.
Fiscal 2018 included a one-time expense related to the enactment of [removed: recent] U.S. [added: income] tax [removed: legislation] [added: law] that reduced diluted earnings per share by $1.08.
[removed: Investment] [added: Customer investments] in semiconductor and display manufacturing equipment and services continued to be [removed: a strong driver] [added: the primary contributor] of revenue during fiscal [removed: 2018.][added: 2019.]
[removed: Results] [added: Results] of [removed: Operations][added: Operations]
[removed: Net Sales][added: Net Sales]
| | | | | | | | | | | | | | | | | | | | [removed: Change] | | | [added: | | | | | | | | | | | | | | | | | | | | | | | | | | | | | Change | | | | | | | | | | | | | | | | | | | | | | | | | | | | | | | | | | | | | | | | | | | | | | | | | | |]
| | [removed: 2018] | | [added: 2019] | | | | [removed: 2017] | | | | | | [removed: 2016] | | | | | | [removed: 2018] [added: | | | | | | | | 2018 | | | | | | | | | | | | | | | | | | | | | | | | 2017 | | | | | | | | | | | | | | | | | | 2019] over [removed: 2017] [added: 2018] | | [removed: 2017] [added: | | | | 2018] over [removed: 2016] [added: 2017] | [added: | | | | | | | | | | | | | | | | | | | | | | | | | |]
| | [removed: (In] [added: | | (In] millions, except [removed: percentages)] [added: percentages)] | | | | | | | | | | | | | | | | | | | | | [added: | | | | | | | | | | | | | | | | | | | | | | | | | | | | | | | | | | | | | | | | | | | | | | | | | | | | | | | | | | | | | | | | | | | | | | | | | | | | | |]
| Display and Adjacent Markets | [removed: 2,498] | | [added: 1,651] | | [added: | | | | 11% | | | | | | | | | | | | 2,298 | | | | | |] 14% | | [removed: 1,900] | | | | [removed: 13%] | | [removed: 1,206] | | | | [removed: 11%] [added: 2,042] | | [removed: 31%] | | [removed: 58%] | [added: | 14% | | | | | | (28) | | % | | | | 13 | | % | | | | | | | | | | | | | | | | | | | | | | | | | | | | | | | | | | | | | | | | | | |]
| Corporate and Other | [removed: 98] | | [added: 76] | | [added: | | | |] 1% | | [removed: 103] | | | | [added: | | | | | | 76 | | | | | |] 1% | | [removed: 157] | | | | [added: | | | | | | 98 | | | | | |] 1% | | [removed: (5)%] | | [removed: (34)%] | [added: | — | | % | | | | (22) | | % | | | | | | | | | | | | | | | | | | | | | | | | | | | | | | | | | | | | | | | | | | |]
The Semiconductor Systems segment continued to represent the largest contributor of net [removed: sales and to the increase in net] sales.
| | | | | | | | | | | | | | | | | | | | [removed: Change] | | | [added: | | | | | | | | | | | | | | | | | | | | | | | | | | | | | Change | | | | | | | | | | | | | | | | | | | | | | | | | | | | | | | | | | | | | | | | | | | | | | | | | | |]
| | [removed: 2018] | | [added: 2019] | | | | [removed: 2017] | | | | | | [removed: 2016] | | | | | | [removed: 2018] [added: | | | | | | | | 2018 | | | | | | | | | | | | | | | | | | | | | | | | 2017 | | | | | | | | | | | | | | | | | | 2019] over [removed: 2017] [added: 2018] | | [removed: 2017] [added: | | | | 2018] over [removed: 2016] [added: 2017] | [added: | | | | | | | | | | | | | | | | | | | | | | | | | |]
| | [removed: (In] [added: | | (In] millions, except [removed: percentages)] [added: percentages)] | | | | | | | | | | | | | | | | | | | | | [added: | | | | | | | | | | | | | | | | | | | | | | | | | | | | | | | | | | | | | | | | | | | | | | | | | | | | | | | | | | | | | | | | | | | | | | | | | | | | | |]
The changes in net sales [removed: from customers] in all regions [removed: for] [added: in] fiscal [removed: 2017] [added: 2019] compared to fiscal [removed: 2016] [added: 2018] primarily reflected [removed: increased investments in semiconductor equipment and] changes in semiconductor [added: and display manufacturing] equipment [added: spending and] customer [added: and product] mix.
[removed: Gross Margin][added: Gross Margin]
| | | | | | | | | | | [removed: Change] | | | [added: | | | | | | | | Change | | | | | | | | | | | | | | |]
| | [removed: 2018] | | [added: 2019] | [removed: 2017] | | | [removed: 2016] | | [added: 2018] | [removed: 2018] [added: | | | | | 2017 | | | | | | 2019] over [removed: 2017] [added: 2018] | | [removed: 2017] [added: | | | | 2018] over [removed: 2016] [added: 2017] | [added: | | | | | | | |]
[removed: Gross margin] [added: Net sales increased] in fiscal 2018 [removed: increased slightly] compared to fiscal [removed: 2017,] [added: 2017] primarily due to higher [removed: net sales] [added: customer spending for spares] and [removed: materials cost savings.][added: services.]
Gross margin during fiscal [removed: 2018, 2017] [added: 2019, 2018] and [removed: 2016] [added: 2017] included [removed: $87] [added: $89] million, [removed: $69] [added: $87] million and [removed: $62] [added: $69] million, respectively, of share-based compensation expense.
[removed: Research,] [added: Research,] Development and [removed: Engineering][added: Engineering]
| | | | | | | | | | | | | | [removed: Change] | | | | | | | [added: | Change | | | | | | | | | | | | | | | | | | | | | | | | | | | | | | | | |]
| | [removed: 2018] | | [added: 2019] | | [removed: 2017] | | | | [removed: 2016] [added: 2018] | | | | [removed: 2018] [added: | | 2017 | | | | | | 2019] over [removed: 2017] [added: 2018] | | | | [removed: 2017] [added: | | 2018] over [removed: 2016] [added: 2017] | | | [added: | | | | | | | | | | | | | | | | | | | | | | | |]
| | [removed: (In millions)] | | [added: (In millions)] | | | | | | | | | | | | | | | | | [added: | | | | | | | | | | | | | | | | | | | | | | | | | | | | | | | | | |]
RD&E expenses increased [added: slightly] in fiscal [removed: 2018] [added: 2019] compared to the prior year and [removed: also] [added: increased] in fiscal [removed: 2017] [added: 2018] compared to fiscal [removed: 2016,] [added: 2017,] primarily due to additional headcount and increased research and development spending in Semiconductor Systems and Display and Adjacent Market segments.
| | | | | | | | | | | | | | | | | | | | | | | | | | | | | | | | | | | | | | | | | | | | | | | | | | | | | | |
| --- | --- | --- | --- | --- | --- | --- | --- | --- | --- | --- | --- | --- | --- | --- | --- | --- | --- | --- | --- | --- | --- | --- | --- | --- | --- | --- | --- | --- | --- | --- | --- | --- | --- | --- | --- | --- | --- | --- | --- | --- | --- | --- | --- | --- | --- | --- | --- | --- | --- | --- | --- | --- | --- |
| | | | | | | | | | | | | | | | | | | | | | | | | | | | | | | | | | | | | | | | | | | | | | | | | | | | | | |
| | | | | | | | | | | | | | | | | | | | | | | | | | | | | | | | | | | | | | | | | | | | | | | | | | | | | | |
| Net sales | | | $ | 14,608 | | | | | $ | 16,705 | | | | | $ | 14,698 | | | | | $ | (2,097) | | | | | $ | 2,007 | | | | | | | | | | | | | | | | | | | | | | | | | |
| | | | | | | | | | | | | | | | | | | | | | | | | | | | | | | | | | | | | | | | | | | | | | | | | | | | | | |
| Gross margin | | | 43.7 | | % | | | | 45.0 | | % | | | | 45.0 | | % | | | | (1.3) points | | | | | | — points | | | | | | | | | | | | | | | | | | | | | | | | | | |
| Operating income | | | $ | 3,350 | | | | | $ | 4,491 | | | | | $ | 3,936 | | | | | $ | (1,141) | | | | | $ | 555 | | | | | | | | | | | | | | | | | | | | | | | | | |
| Operating margin | | | 22.9 | | % | | | | 26.9 | | % | | | | 26.8 | | % | | | | (4.0) points | | | | | | 0.1 points | | | | | | | | | | | | | | | | | | | | | | | | | | |
| Net income | | | $ | 2,706 | | | | | $ | 3,038 | | | | | $ | 3,519 | | | | | $ | (332) | | | | | $ | (481) | | | | | | | | | | | | | | | | | | | | | | | | | |
| Earnings per diluted share | | | $ | 2.86 | | | | | $ | 2.96 | | | | | $ | 3.25 | | | | | $ | (0.10) | | | | | $ | (0.29) | | | | | | | | | | | | | | | | | | | | | | | | | |
| | | | | | | | | | | | | | | | | | | | | | | | | | | | | | | | | | | | | | | | | | | | | | | | | | | | | | |
| | | | | | | | | | | | | | | | | | | | | | | | | | | | | | | | | | | | | | | | | | | | | | | | | | | | | | |
| | | | | | | | | | | | | | | | | | | | | | | | | | | | | | | | | | | | | | | | | | | | | | | | | | | | | | |
| | | | | | | | | | | | | | | | | | | | | | | | | | | | | | | | | | | | | | | | | | | | | | | | | | | | | | |
| | | | | | | | | | | | | | | | | | | | | | | | | | | | | | | | | | | | | | | | | | | | | | | | | | | | | | |
| | | | | | | | | | | | | | | | | | | | | | | | | | | | | | | | | | | | | | | | | | | | | | | | | | | | | | |
| | | | | | | | | | | | | | | | | | | | | | | | | | | | | | | | | | | | | | | | | | | | | | | | | | | | | | |
Semiconductor equipment customers continued to make strategic investments in new technology transitions.
Spending by memory customers, compared to fiscal 2018, was lower as they delayed new capacity additions and lowered their fab utilization rates in response to excess industry supply and inventory levels.
Foundry and logic spending increased year-over-year led by customer investments in both advanced and mature foundry-logic nodes.
Overall semiconductor systems revenue for fiscal 2019 decreased as compared to the prior year.
Despite the overall wafer fab equipment market being down in 2019, Applied saw modest growth in its services business as compared to the prior year.
This was driven by an increase in the installed base of equipment and continued growth in revenues from long-term service agreements, offset by a weaker demand for transactional spares due to lower memory fab utilization.
Applied’s display and adjacent markets revenue declined during fiscal 2019 due to weak demand for display manufacturing equipment for mobile products and TVs.
| | | | | | | | | | | | | | | | | | | | | | | | | | | | | | | | | | | | | | | | | | | | | | | | | | | | | | | | | | | | | | | | | | | | | | | | | | | | | | | | | | | | | | | | | | | | | | | | | | | | | | |
| --- | --- | --- | --- | --- | --- | --- | --- | --- | --- | --- | --- | --- | --- | --- | --- | --- | --- | --- | --- | --- | --- | --- | --- | --- | --- | --- | --- | --- | --- | --- | --- | --- | --- | --- | --- | --- | --- | --- | --- | --- | --- | --- | --- | --- | --- | --- | --- | --- | --- | --- | --- | --- | --- | --- | --- | --- | --- | --- | --- | --- | --- | --- | --- | --- | --- | --- | --- | --- | --- | --- | --- | --- | --- | --- | --- | --- | --- | --- | --- | --- | --- | --- | --- | --- | --- | --- | --- | --- | --- | --- | --- | --- | --- | --- | --- | --- | --- | --- | --- | --- | --- |
| | | | | | | | | | | | | | | | | | | | | | | | | | | | | | | | | | | | | | | | | | | | | | | | | | | | | | | | | | | | | | | | | | | | | | | | | | | | | | | | | | | | | | | | | | | | | | | | | | | | | | |
| Semiconductor Systems | | | $ | 9,027 | | | | | 62% | | | | | | | | | | | | $ | 10,577 | | | | | 63% | | | | | | | | | | | | 9,544 | | | | | | 65% | | | | | | (15) | | % | | | | 11 | | % | | | | | | | | | | | | | | | | | | | | | | | | | | | | | | | | | | | | | | | | | | |
| Applied Global Services | | | 3,854 | | | | | | 26% | | | | | | | | | | | | 3,754 | | | | | | 22% | | | | | | | | | | | | 3,014 | | | | | | 20% | | | | | | 3 | | % | | | | 25 | | % | | | | | | | | | | | | | | | | | | | | | | | | | | | | | | | | | | | | | | | | | | |
| Total | | | $ | 14,608 | | | | | 100% | | | | | | | | | | | | $ | 16,705 | | | | | 100% | | | | | | | | | | | | $ | 14,698 | | | | | 100% | | | | | | (13) | | % | | | | 14 | | % | | | | | | | | | | | | | | | | | | | | | | | | | | | | | | | | | | | | | | | | | | |
Net sales in fiscal 2019 compared to fiscal 2018 decreased primarily due to decreased customer investments in semiconductor and display manufacturing equipment.
| | | | | | | | | | | | | | | | | | | | | | | | | | | | | | | | | | | | | | | | | | | | | | | | | | | | | | | | | | | | | | | | | | | | | | | | | | | | | | | | | | | | | | | | | | | | | | | | | | | | | | |
| --- | --- | --- | --- | --- | --- | --- | --- | --- | --- | --- | --- | --- | --- | --- | --- | --- | --- | --- | --- | --- | --- | --- | --- | --- | --- | --- | --- | --- | --- | --- | --- | --- | --- | --- | --- | --- | --- | --- | --- | --- | --- | --- | --- | --- | --- | --- | --- | --- | --- | --- | --- | --- | --- | --- | --- | --- | --- | --- | --- | --- | --- | --- | --- | --- | --- | --- | --- | --- | --- | --- | --- | --- | --- | --- | --- | --- | --- | --- | --- | --- | --- | --- | --- | --- | --- | --- | --- | --- | --- | --- | --- | --- | --- | --- | --- | --- | --- | --- | --- | --- | --- |
| | | | | | | | | | | | | | | | | | | | | | | | | | | | | | | | | | | | | | | | | | | | | | | | | | | | | | | | | | | | | | | | | | | | | | | | | | | | | | | | | | | | | | | | | | | | | | | | | | | | | | |
| China | | | $ | 4,277 | | | | | 29% | | | | | | | | | | | | $ | 5,047 | | | | | 30% | | | | | | | | | | | | $ | 2,758 | | | | | 19% | | | | | | (15) | | % | | | | 83 | | % | | | | | | | | | | | | | | | | | | | | | | | | | | | | | | | | | | | | | | | | | | |
| Korea | | | 1,929 | | | | | | 13% | | | | | | | | | | | | 3,539 | | | | | | 21% | | | | | | | | | | | | 4,087 | | | | | | 28% | | | | | | (45) | | % | | | | (13) | | % | | | | | | | | | | | | | | | | | | | | | | | | | | | | | | | | | | | | | | | | | | |
| Taiwan | | | 2,965 | | | | | | 20% | | | | | | | | | | | | 2,504 | | | | | | 15% | | | | | | | | | | | | 3,369 | | | | | | 23% | | | | | | 18 | | % | | | | (26) | | % | | | | | | | | | | | | | | | | | | | | | | | | | | | | | | | | | | | | | | | | | | |
| Japan | | | 2,198 | | | | | | 15% | | | | | | | | | | | | 2,396 | | | | | | 14% | | | | | | | | | | | | 1,519 | | | | | | 10% | | | | | | (8) | | % | | | | 58 | | % | | | | | | | | | | | | | | | | | | | | | | | | | | | | | | | | | | | | | | | | | | |
| Southeast Asia | | | 548 | | | | | | 4% | | | | | | | | | | | | 797 | | | | | | 5% | | | | | | | | | | | | 625 | | | | | | 4% | | | | | | (31) | | % | | | | 28 | | % | | | | | | | | | | | | | | | | | | | | | | | | | | | | | | | | | | | | | | | | | | |
| | |
| --- | --- |
| | |
| --- | --- |
| | |
| --- | --- |
| | |
| --- | --- |
| | |
| --- | --- |
| | |
| --- | --- |
| | |
| --- | --- |
| | |
| --- | --- |
| | | | | | | | | | | | | | | | | | | | |
| --- | --- | --- | --- | --- | --- | --- | --- | --- | --- | --- | --- | --- | --- | --- | --- | --- | --- | --- | --- |
| | | | | | | | | | | | | | | | | | | | |
| | | | | | | | | | | | | | | | | | | | |
| Net sales | $ | 17,253 | | | $ | 14,537 | | | $ | 10,825 | | | $ | 2,716 | | | $ | 3,712 | |
| Gross margin | 45.3 | | % | | 44.9 | | % | | 41.7 | | % | | 0.4 points | | | | 3.2 points | | |
| Operating income | $ | 4,796 | | | $ | 3,868 | | | $ | 2,152 | | | $ | 928 | | | $ | 1,716 | |
| Operating margin | 27.8 | | % | | 26.6 | | % | | 19.9 | | % | | 1.2 points | | | | 6.7 points | | |
| Net income | $ | 3,313 | | | $ | 3,434 | | | $ | 1,721 | | | $ | (121 | ) | | $ | 1,713 | |
| Earnings per diluted share | $ | 3.23 | | | $ | 3.17 | | | $ | 1.54 | | | $ | 0.06 | | | $ | 1.63 | |
Semiconductor equipment customers made investments in new capacity and technology transitions, and Applied’s overall semiconductor systems revenue increased as compared to the prior year.
Demand for dynamic random-access memory (DRAM) and NAND increased in fiscal 2018 although overall spending by memory customers was lower towards the second half of the year.
Logic customers’ spending remained strong while foundry customers’ spending decreased compared to the prior year and Applied continues to see these customers optimize existing capacity and re-prioritize their capital spending plans on longer lead-time equipment not in Applied’s product portfolio.
Display equipment spending during fiscal 2018 reflected continued investment in new technology and manufacturing equipment for producing larger LCD TVs and in new equipment for mobile devices.
Applied also continued to see strong growth in demand for spares and services from customers as compared to the prior year.
While Applied anticipates major technology trends to continue driving long-term growth in the semiconductor industry, the trends characterizing the second half of 2018 are likely to continue into early fiscal 2019, with lower spending by memory customers, and foundry customers prioritizing spending on longer lead-time equipment not in Applied’s product portfolio.
Applied also expects lower spending for display manufacturing equipment in fiscal 2019, although long-term demand drivers remain in place.
Applied anticipates continued growth in semiconductor spares and services spending in fiscal 2019.
| | | | | | | | | | | | | | | | | | | | | | |
| --- | --- | --- | --- | --- | --- | --- | --- | --- | --- | --- | --- | --- | --- | --- | --- | --- | --- | --- | --- | --- | --- |
| | | | | | | | | | | | | | | | | | | | | | |
| | | | | | | | | | | | | | | | | | | | | | |
| Semiconductor Systems | $ | 10,903 | | | 63% | | $ | 9,517 | | | 65% | | $ | 6,873 | | | 64% | | 15% | | 38% |
| Applied Global Services | 3,754 | | | | 22% | | 3,017 | | | | 21% | | 2,589 | | | | 24% | | 24% | | 17% |
An excerpt. Shown here: 40 of 243 rewritten, 40 of 241 added and 40 of 201 removed. The counts are complete. For every sentence, read Item 7. Management’s Discussion and Analysis of Financial Condition and Results of Operations in the FY2019 filing and the FY2018 filing.
Item 7A. Quantitative and Qualitative Disclosures About Market Risk
5 rewritten, 0 added, 2 removed, 7 unchanged
Read the full itemFY2019 item · filed December 13, 2019FY2018 item · filed December 13, 2018
Applied’s investment portfolio includes fixed-income securities with a fair value of approximately $2.0 billion at October [removed: 28, 2018.][added: 27, 2019.]
Based on Applied’s investment portfolio at October [removed: 28, 2018,] [added: 27, 2019,] an immediate 100 basis point increase in interest rates would result in a decrease in the fair value of the portfolio of approximately [removed: $26] [added: $29] million.
At October [removed: 28, 2018,] [added: 27, 2019,] the aggregate principal [removed: and estimated fair values amounts] of long-term debt issued by Applied [removed: were both $5.4] [added: was $4.8 billion with an estimated fair values of $5.5] billion.
A hypothetical decrease in interest rates of 100 basis points would result in an increase in the fair value of Applied’s long-term debt issuances of approximately [removed: $497] [added: $549] million at October [removed: 28, 2018.][added: 27, 2019.]
Certain operations of Applied are conducted in foreign currencies, such as Japanese yen, [removed: euro,] Israeli [removed: shekel] [added: shekel, euro] and Taiwanese dollar.
| | |
| --- | --- |
Item 1. Business
84 rewritten, 33 added, 51 removed, 96 unchanged
Read the full itemFY2019 item · filed December 13, 2019FY2018 item · filed December 13, 2018
A summary of financial information for each reportable segment is found in Note [removed: 15] [added: 16] of Notes to Consolidated Financial Statements.
[removed: Semiconductor Systems][added: Semiconductor Systems]
| [removed: Technologies] [added: Technologies] | | [removed: Product(s)] | [added: | | | Product(s) | | |]
| [removed: Epitaxy] [added: Epitaxy] Epitaxy (or epi) is a technique for growing silicon (e.g. silicon with another element) as a uniform crystalline structure on a wafer to form high quality material for the device circuity. Epi technology is used in device transistors to enhance chip speed. | | [added: | | | |] Centura RP Epi | [added: | |]
| [removed: Ion Implant] [added: Ion Implant] Ion implantation is a key technology for forming transistors and is used many times during chip fabrication. During ion implantation, wafers are bombarded by a beam of electrically-charged ions, called dopants, which can change the electrical properties of the exposed semiconductor material. | | [added: | | | |] VIISta Systems | [added: | |]
| [removed: Oxidation/Nitridation] [added: Oxidation/Nitridation] Applied’s systems provide critical oxidation steps - like memory gate oxide, shallow trench isolation and liner oxide - for advanced device scaling. | | [added: | | | |] Vantage, Radiance and Centura Systems | [added: | |]
| [removed: Rapid] [added: Rapid] Thermal Processing [removed: (RTP)] [added: (RTP)] RTP is used primarily for annealing, which modifies the properties of deposited films. Applied’s single-wafer RTP systems are also used for growing high quality oxide and oxynitride films. | | [added: | | | |] Vantage Systems | [added: | |]
| [removed: Physical] [added: Physical] Vapor Deposition [removed: (PVD)] [added: (PVD)] PVD is used to deposit high quality metal films. Applications include metal gate, silicides, contact liner/barrier, interconnect copper barrier seed and metal hard mask. | | [added: | | | |] Endura Systems | [added: | |]
| [removed: Chemical] [added: Chemical] Vapor Deposition [removed: (CVD)] [added: (CVD)] CVD is used to deposit dielectric and metal films on a wafer. During the CVD process, gases that contain atoms of the material to be deposited react on the wafer surface, forming a thin film of solid material. | | [added: | | | |] Endura, Centura and Producer Systems | [added: | |]
| [removed: Chemical] [added: Chemical] Mechanical Planarization [removed: (CMP)] [added: (CMP)] CMP is used to planarize a wafer surface, a process that allows subsequent photolithography patterning and material deposition steps to occur with greater accuracy, resulting in more uniform film layers with minimal thickness variations. | | [added: | | | |] Reflexion Systems | [added: | |]
| [removed: Electrochemical] [added: Electrochemical] Deposition [removed: (ECD)] [added: (ECD)] ECD is a process by which metal atoms from a chemical fluid (an electrolyte) are deposited on the surface of an immersed object. | | [added: | | | |] Raider and Nokota Platforms | [added: | |]
| [removed: Atomic] [added: Atomic] Layer Deposition [removed: (ALD)] [added: (ALD)] ALD technology enables ultra thin film growth of either a conducting or insulating material with uniform coverage in nanometer-sized structures. | | [added: | | | |] Olympia System | [added: | |]
| [removed: Etch] [added: Etch] Etching is used many times throughout the IC manufacturing process to selectively remove material from the surface of a wafer. Applied offers systems for etching dielectric, metal, and silicon films to meet the requirements of advanced processing. | | [added: | | | |] Centris and Producer Systems | [added: | |]
| [removed: Selective Removal] [added: Selective Removal] Selective removal is a new etch technology intended to remove a material of a particular composition without damaging materials of different composition that coexist on the wafer. | | [added: | | | |] Producer Systems | [added: | |]
| [removed: Metrology] [added: Metrology] and [removed: Inspection] [added: Inspection] Metrology and inspection tools are used to locate, measure, and analyze defects and features on the wafer during various stages of the fabrication processes. Applied enables customers to characterize and control critical dimension (CD) and defect issues, especially at advanced generation technology nodes. | | [added: | | | |] SEMVision G7 Defect Analysis PROVision eBeam Inspection UVision 8 Inspection VeritySEM 5i Metrology Aera4 Mask Inspection | [added: | |]
[removed: Applied] [added: Applied] Global [removed: Services][added: Services]
Customer demand for products and services is fulfilled through a global distribution system [removed: with 93] [added: more than 100] locations and trained service engineers located in close proximity to customer sites in more than a dozen countries to support over [removed: 40,000] [added: 42,500] installed Applied semiconductor, display and other manufacturing systems worldwide.
| [removed: AGS] [added: AGS] Solutions and [removed: Technology] [added: Technology] | [added: | |]
| [removed: Technology-enabled Services] [added: Technology-enabled Services] A comprehensive service product portfolio that combines service technology and tool specific performance commitments in order to optimize customer factory productivity. | [added: | |]
| [removed: Fab Consulting] [added: Fab Consulting] Experts using advanced analytical tools to solve production problems that have the greatest impact on customer fab productivity. | [added: | |]
| [removed: Supply] [added: Supply] Chain Assurance [removed: Programs] [added: Programs] Spare parts product portfolio offers options to balance inventory, cost and risk to efficiently meet fab requirements. | [added: | |]
| [removed: Subfab Equipment] [added: Subfab Equipment] Applied SubFab solutions lower costs, save energy, reduce environmental impact, and meet Environmental Protection Agency reporting regulations for greenhouse gas emissions. | [added: | |]
| [removed: Legacy Equipment] [added: Legacy Equipment] Comprehensive 200mm equipment and upgrades portfolio to address a full spectrum of production needs and extend tool lifetime. Applied 200mm equipment supports market inflections and new technology for a broad variety of devices including analog, power, and MEMS. | [added: | |]
| [removed: Automation Software] [added: Automation Software] Applied SmartFactory automation software portfolio coordinates and streamlines every aspect of a factory-the processes, equipment and people-to provide competitive advantage to customers. | [added: | |]
[removed: Display] [added: Display] and Adjacent [removed: Markets][added: Markets]
Display and Adjacent Markets industry growth depends primarily on consumer demand for increasingly larger and more advanced TVs and high resolution displays for mobile devices as well as new form factors, including thin, [removed: light and] [added: light,] curved [added: and flexible] displays, and new applications such as [added: augmented and] virtual reality.
| [removed: Display] [added: Display] and Adjacent Markets [removed: Technologies] [added: Technologies] | | [removed: Product(s)] | [added: | | | Product(s) | | |]
| [removed: Array Test] [added: Array Test] LCD display substrates are inspected at many stages of production to maximize yield, minimize scrap, optimize equipment utilization, and monitor manufacturing processes. At the completion of the array stage, the performance of the millions of individual pixels on each display is tested. | | [added: | | | |] Electron Beam Array Tester | [added: | |]
| [removed: Defect Review] [added: Defect Review] Defects are identified during inspection steps and reviewed by a scanning electron microscope and other analyses to determine defect root cause and composition. | | [added: | | | |] Electron Beam Review (EBR) | [added: | |]
| [removed: Chemical] [added: Chemical] Vapor Deposition [removed: (CVD)] [added: (CVD)] During CVD processing, gases containing atoms or molecules are introduced into the process chamber. The gases form reactive radicals or ions, which undergo chemical reactions to form thin films on the heated substrate. | | [added: | | | |] AKT PECVD Systems | [added: | |]
| [removed: Physical] [added: Physical] Vapor Deposition [removed: (PVD)] [added: (PVD)] PVD is used to deposit high quality films of metals, alloys, transparent conductors and semiconductors. In Display, these films are used for contact, interconnect, transparent electrodes and transistor materials in TFT-LCD and OLED display backplanes, as well as for transparent electrodes in color filters and touch panels. | | [added: | | | |] AKT Aristo and PiVot Systems | [added: | |]
| [removed: Flexible Technologies] [added: Flexible Technologies] Flexible coating systems utilize physical vapor deposition, thermal evaporation, chemical vapor deposition, and e-beam technology to deposit thin layers of metal onto flexible substrates. | | [added: | | | |] TopBeam, [removed: TopMet] [added: TopMet, TopCoil] and SmartWeb Systems | [added: | |]
[removed: Backlog][added: Backlog]
Backlog [removed: as of October 29, 2017] consisted of: (1) orders for which written authorizations have been [removed: accepted and assigned shipment dates are within the next 12 months,] [added: accepted,] or shipment has occurred but revenue has not been recognized; and (2) contractual service revenue and maintenance [removed: fees to be earned within the next 12 months.][added: fees.]
Backlog by reportable segment as of October [removed: 29, 2017] [added: 27, 2019 and October 28, 2018] was as follows:
| | [removed: (In] [added: | | | | | | | | | | | | | | | | | (In] millions, except [removed: percentages)] [added: percentages)] | | | | | | [added: | | | | | | | | | | | | | | | | | | | | | | | | | | | | | | | | |]
| Semiconductor Systems | [added: | | | | | | | | | | | | | | | | |] $ | [removed: 2,991] [added: 2,925] | | | [removed: 49] | [added: | 45 | |] % | [added: | | | $ | 2,479 | | | | | 41 | | % | | | | | | | | | | | | | | | | | | |]
| Applied Global Services | [removed: 1,130] | | | | [removed: 19] | [added: | | | | | | | | | | | | 2,073 | | | | | | 32 | |] % | [added: | | | 1,751 | | | | | | 29 | | % | | | | | | | | | | | | | | | | | | |]
| Display and Adjacent Markets | [removed: 1,847] | | | | [removed: 31] | [added: | | | | | | | | | | | | 1,453 | | | | | | 23 | |] % | [added: | | | 1,836 | | | | | | 30 | | % | | | | | | | | | | | | | | | | | | |]
| Corporate and Other | [removed: 63] | | | | [removed: 1] | [added: | | | | | | | | | | | | 22 | | | | | | — | |] % | [added: | | | 26 | | | | | | — | | % | | | | | | | | | | | | | | | | | | |]
| | | | | | | | | |
| --- | --- | --- | --- | --- | --- | --- | --- | --- |
| | | | | | | | | |
| --- | --- | --- | --- | --- | --- | --- | --- | --- |
| | | | | | | | | | | | | | | | | | | | | | | | | | | | | | | | | | | | | | | | | | | | | | | | | | | | | | | | | |
| --- | --- | --- | --- | --- | --- | --- | --- | --- | --- | --- | --- | --- | --- | --- | --- | --- | --- | --- | --- | --- | --- | --- | --- | --- | --- | --- | --- | --- | --- | --- | --- | --- | --- | --- | --- | --- | --- | --- | --- | --- | --- | --- | --- | --- | --- | --- | --- | --- | --- | --- | --- | --- | --- | --- | --- | --- |
| | | | | | | | | | | | | | | | | | | | | | | | | | | | | | | | | | | | | | | | | | | | | | | | | | | | | | | | | |
Applied uses qualified vendors, including contract manufacturers, to supply parts, services and product support.
| | | | | | | | | | | | | | | | | | |
| --- | --- | --- | --- | --- | --- | --- | --- | --- | --- | --- | --- | --- | --- | --- | --- | --- | --- |
| | | | | | | | | | | | | | | | | | |
(1)Mr. Dickerson, age 62, was named President of Applied in June 2012 and appointed Chief Executive Officer and a member of the Board of Directors in September 2013.
Before joining Applied, he served as Chief Executive Officer and a director of Varian Semiconductor Equipment Associates, Inc. (Varian) from 2004 until its acquisition by Applied in November 2011.
Mr. Dickerson started his semiconductor career in manufacturing and engineering management at General Motors’ Delco Electronics Division and then AT&T Technologies.
(2)Dr. Addiego, age 60, has been Senior Vice President, Engineering, Operations and Quality since June 2015.
He served as Senior Vice President, Engineering from March 2014 to June 2015.
He previously worked at Applied from 1996 to 2005, leading various product groups as well as global organizations, including Global Operations, Facilities and Real Estate, Foundation Engineering, and Information Technology.
From March 2011 to March 2014, Dr. Addiego was President and Chief Operating Officer of Ultra Clean Technology Corp., a public company listed on Nasdaq and a supplier of critical subsystems for the semiconductor capital equipment, medical device, energy, research, and flat panel industries.
(3)Mr. Durn, age 53, has been Senior Vice President and Chief Financial Officer of Applied since August 2017.
Previously, Mr. Durn was Executive Vice President and Chief Financial Officer of NXP Semiconductors N.V., a semiconductor manufacturer (NXP), from December 2015 to August 2017.
Prior to Freescale, Mr. Durn was Chief Financial Officer and Executive Vice President of Finance and Administration at GlobalFoundries, a semiconductor foundry, which he joined in December 2011.
(4)Mr. Ghanayem, age 54, has been Senior Vice President, New Markets and Alliances Group of Applied since November 2017.
(5)Mr. Larkins, age 58, has been Senior Vice President, General Counsel of Applied since November 2012 and was Corporate Secretary from November 2012 to March 2018.
Mr. Larkins served in various other positions at Honeywell (formerly AlliedSignal) after joining the company in 1997.
(6)Dr. Nalamasu, age 61, has been Senior Vice President, Chief Technology Officer since June 2013, and President of Applied Ventures, LLC, Applied’s venture capital arm, since November 2013.
He had served as Group Vice President, Chief Technology Officer from January 2012 to June 2013, and as Corporate Vice President, Chief Technology Officer from January 2011 to January 2012.
From 2002 to 2006, Dr. Nalamasu was a NYSTAR distinguished professor of Materials Science and Engineering at Rensselaer Polytechnic Institute, where he also served as Vice President of Research from 2005 to 2006.
Prior to Rensselaer, Dr. Nalamasu served in several leadership roles at Bell Laboratories.
(7)Dr. Raja, age 57, has been Senior Vice President, Semiconductor Products Group of Applied since November 2017.
(8)Mr. Salehpour, age 58, has been Senior Vice President, Services, Display and Flexible Technology since September 2013.
He previously served as Group Vice President, General Manager Energy and Environmental Solutions and Display Business Groups, since joining Applied in November 2012.
(9)Mr. Read, age 53, has been Corporate Vice President, Corporate Controller and Chief Accounting Officer of Applied since joining the Company in September 2013.
Prior to Brocade, Mr. Read worked at KPMG LLP, an audit, tax and advisory firm, from 1996 to 2002.
| | | |
| --- | --- | --- |
| | | |
| |
| --- |
| |
| | | |
| | | | | | | |
| --- | --- | --- | --- | --- | --- | --- |
| | | | | | | |
| | 2017 | | | | | |
| | | | | | | |
In anticipation of the adoption of the new revenue recognition standard in the first quarter of fiscal 2019, Applied has removed the 12 month threshold in relation to backlog in order to more closely align backlog to performance obligations as defined under the new revenue recognition standard.
As such, backlog as of October 28, 2018 consists of: (1) orders for which written authorizations have been accepted, or shipment has occurred but revenue has not been recognized; and (2) contractual service revenue and maintenance fees.
Backlog by reportable segment as of October 28, 2018 was as follows:
| | | | | | | |
| --- | --- | --- | --- | --- | --- | --- |
| | | | | | | |
| | | | | | | |
| | (In millions, except percentages) | | | | | |
| Semiconductor Systems | $ | 2,479 | | | 41 | % |
| Applied Global Services | 1,751 | | | | 29 | % |
| Display and Adjacent Markets | 1,836 | | | | 30 | % |
| Corporate and Other | 26 | | | | — | % |
| Total | $ | 6,092 | | | 100 | % |
Applied uses numerous vendors, including contract manufacturers, to supply parts and assembly services for the manufacture and support of its products, including some systems being completed at customer sites.
| | | | | | |
| Micron Technology, Inc. | * | | * | | 11% |
| | |
| --- | --- |
| | |
| | |
| --- | --- |
| | |
| --- | --- |
| | |
| --- | --- |
| | |
| --- | --- |
| | |
An excerpt. Shown here: 40 of 84 rewritten, all 33 added and 40 of 51 removed. The counts are complete. For every sentence, read Item 1. Business in the FY2019 filing and the FY2018 filing.
Item 3. Legal Proceedings
1 rewritten, 0 added, 2 removed, 0 unchanged
Read the full itemFY2019 item · filed December 13, 2019FY2018 item · filed December 13, 2018
The information set forth under “Legal Matters” in Note [removed: 14] [added: 15] of Notes to Consolidated Financial Statements is incorporated herein by reference.
| | |
| --- | --- |
Cover and table of contents
64 rewritten, 21 added, 28 removed, 15 unchanged
Read the full itemFY2019 item · filed December 13, 2019FY2018 item · filed December 13, 2018
[removed: UNITED] [added: UNITED] STATES SECURITIES AND EXCHANGE [removed: COMMISSION][added: COMMISSION]
[removed: Washington,] [added: Washington,] D.C. [removed: 20549][added: 20549]
[removed: Form 10-K][added: Form 10-K]
| [removed: þ] [added: ☑] | [removed: ANNUAL] [added: | | ANNUAL] REPORT PURSUANT TO SECTION 13 OR 15(d) OF THE SECURITIES EXCHANGE ACT OF [removed: 1934] [added: 1934] | [added: | |]
[removed: For] [added: For] the fiscal year ended October [removed: 28, 2018][added: 27, 2019]
| [removed: ¨] [added: ☐] | [removed: TRANSITION] [added: | | TRANSITION] REPORT PURSUANT TO SECTION 13 OR 15(d) OF THE SECURITIES EXCHANGE ACT OF [removed: 1934] [added: 1934] | [added: | |]
[removed: For] [added: For] the transition period from [removed: to][added: to]
[removed: Commission] [added: Commission] file number [removed: 000-06920][added: 000-06920]
[removed: Applied] [added: Applied] Materials, [removed: Inc.][added: Inc.]
[removed: (Exact] [added: *(Exact] name of registrant as specified in its [removed: charter)][added: charter)*]
| [removed: Delaware] [added: Delaware] | [removed: 94-1655526] | [added: | 94-1655526 | | |]
| [removed: (State] [added: *(State] or other jurisdiction of incorporation or [removed: organization)] [added: organization)*] | [removed: (I.R.S.] [added: | | *(I.R.S.] Employer Identification [removed: No.)] [added: No.)*] | [added: | |]
[removed: | (Address] [added: *(Address] of principal executive [removed: offices) | |][added: offices)*]
[removed: Registrant’s] [added: *(Registrant’s] telephone number, including area [removed: code:][added: code)*]
[removed: (408) 727-5555][added: (408) 727-5555]
[removed: Securities] [added: Securities] registered pursuant to Section 12(b) of the [removed: Act:][added: Act:]
| [removed: Title] [added: Title] of Each [removed: Class] [added: Class] | [removed: Name] [added: | | Trading Symbol | | | Name] of Each Exchange on Which [removed: Registered] [added: Registered] | [added: | |]
| Common Stock, par value $.01 per share | [added: | | AMAT | | |] The NASDAQ Stock Market LLC | [added: | |]
[removed: Securities] [added: Securities] registered pursuant to Section 12(g) of the Act: [removed: None][added: None]
Yes [removed: þ] [added: ☑] No [removed: ¨][added: ☐]
Yes [removed: ¨] [added: ☐] No [removed: þ][added: ☑]
Yes [removed: þ] [added: ☑] No [removed: ¨][added: ☐]
Yes [removed: þ] [added: ☑] No [removed: ¨][added: ☐]
| Large accelerated filer [removed: þ] | | [added: | ☑ | | | | | |] Accelerated filer [removed: ¨] | [added: | | ☐ | | |]
| Non-accelerated filer [removed: ¨] | | [added: | ☐ | | | | | |] Smaller reporting company [removed: ¨] | [added: | | ☐ | | |]
| | | [added: | | | | | | |] Emerging growth company [removed: ¨] | [added: | | ☐ | | |]
Yes [removed: ¨] [added: ☐] No [removed: þ][added: ☑]
Aggregate market value of the voting stock held by non-affiliates of the registrant as of April [removed: 29, 2018,] [added: 28, 2019,] based upon the closing sale price reported by the NASDAQ Global Select Market on that date: [removed: $49,674,881,854][added: 41677858958]
Number of shares outstanding of the registrant’s Common Stock, $.01 par value, as of December [removed: 7, 2018: 958,606,093][added: 6, 2019: 915,304,098]
[removed: DOCUMENTS] [added: DOCUMENTS] INCORPORATED BY [removed: REFERENCE:][added: REFERENCE:]
Portions of Part III will be provided in accordance with Instruction G(3) to Form 10-K no later than February [removed: 25, 2019.][added: 24, 2020.]
[removed: Caution] [added: Caution] Regarding Forward-Looking [removed: Statements][added: Statements]
Examples of forward-looking statements include those regarding Applied’s future financial or operating results, customer demand and spending, end-use demand, market and industry trends and outlooks, cash flows and cash deployment strategies, declaration of dividends, share repurchases, business strategies and priorities, costs and cost controls, products, competitive positions, management’s plans and objectives for future operations, research and development, strategic acquisitions and investments, [added: including the proposed acquisition of Kokusai Electric Corporation (Kokusai Electric),] growth opportunities, restructuring activities, backlog, working capital, liquidity, investment portfolio and policies, taxes, supply chain, manufacturing, properties, legal proceedings and claims, and other statements that are not historical facts, as well as their underlying assumptions.
Forward-looking statements may contain words such as “may,” “will,” “should,” “could,” “would,” “expect,” “plan,” “anticipate,” “believe,” “estimate,” [added: “intend,”] “potential” and “continue,” the negative of these terms, or other comparable terminology.
[removed: APPLIED] [added: APPLIED] MATERIALS, [removed: INC.][added: INC.]
[removed: FORM] [added: FORM] 10-K FOR THE FISCAL YEAR ENDED OCTOBER [removed: 28, 2018][added: 27, 2019]
[removed: TABLE] [added: TABLE] OF [removed: CONTENTS][added: CONTENTS]
| | | [removed: Page] | [added: | | | Page | | |]
| | [removed: PART I] | | [added: PART I | | | | | |]
| Item 1: | [removed: [Business](#s171908510EBA547D95742765020AE637)] | [removed: [4](#s171908510EBA547D95742765020AE637)] | [added: [Business](#i_0_16) | | | [4](#i_0_16) | | |]
| | | | | | |
| --- | --- | --- | --- | --- | --- |
or
| | | | | | |
| --- | --- | --- | --- | --- | --- |
| | | | | | |
| --- | --- | --- | --- | --- | --- |
3050 Bowers Avenue
P.O. Box 58039
Santa Clara, California 95052-8039
| | | | | | | | | |
| --- | --- | --- | --- | --- | --- | --- | --- | --- |
| | | | | | | | | | | | | | | |
| --- | --- | --- | --- | --- | --- | --- | --- | --- | --- | --- | --- | --- | --- | --- |
| | | | | | | | | |
| --- | --- | --- | --- | --- | --- | --- | --- | --- |
| | | | | | | | | |
| | | | | | | | | |
| | | | | | | | | |
| | | | | | | | | |
| | | | [Signatures](#i_0_214) | | | [109](#i_0_214) | | |
10-K 1 amat1028201810-kq42018.htm AMAT FY'18 10-K
| | |
| --- | --- |
| | |
or
| | |
| --- | --- |
| | |
| | |
| --- | --- |
| | |
| 3050 Bowers Avenue, P.O. Box 58039 Santa Clara, California | 95052-8039 (Zip Code) |
| | |
| --- | --- |
| | |
| | | |
| --- | --- | --- |
| | | |
| | | |
| --- | --- | --- |
| | | |
| | | |
| | | |
| | | |
| | | |
| | [Signatures](#s3F255A8B4EAD5C0EB7874C34A782F81B) | [102](#s3F255A8B4EAD5C0EB7874C34A782F81B) |
| | |
| --- | --- |
An excerpt. Shown here: 40 of 64 rewritten, all 21 added and all 28 removed. The counts are complete. For every sentence, read Cover and table of contents in the FY2019 filing and the FY2018 filing.
Item 1B. Unresolved Staff Comments
0 rewritten, 0 added, 2 removed, 1 unchanged
Read the full itemFY2019 item · filed December 13, 2019FY2018 item · filed December 13, 2018
| | |
| --- | --- |
Item 2. Properties
1 rewritten, 5 added, 8 removed, 12 unchanged
Read the full itemFY2019 item · filed December 13, 2019FY2018 item · filed December 13, 2018
| [removed: (Square] [added: (Square] feet in [removed: thousands)] [added: thousands)] | [removed: United States] | | [removed: Other Countries] [added: United States] | | [removed: Total] | [added: | | | Other Countries | | | | | | Total | | |]
| | | | | | | | | | | | | | | | | | |
| --- | --- | --- | --- | --- | --- | --- | --- | --- | --- | --- | --- | --- | --- | --- | --- | --- | --- |
| Owned | | | 4,317 | | | | | | 2,470 | | | | | | 6,787 | | |
| Leased | | | 1,222 | | | | | | 1,527 | | | | | | 2,749 | | |
| Total | | | 5,539 | | | | | | 3,997 | | | | | | 9,536 | | |
| | | | | | |
| --- | --- | --- | --- | --- | --- |
| | | | | | |
| Owned | 4,530 | | 2,417 | | 6,947 |
| Leased | 1,037 | | 1,341 | | 2,378 |
| Total | 5,567 | | 3,758 | | 9,325 |
| | |
| --- | --- |
Item 4. Mine Safety Disclosures
1 rewritten, 0 added, 2 removed, 1 unchanged
Read the full itemFY2019 item · filed December 13, 2019FY2018 item · filed December 13, 2018
[removed: PART II][added: PART II]
| | |
| --- | --- |
Item 5. Market for Registrant’s Common Equity, Related Stockholder Matters and Issuer Purchases of Equity Securities
20 rewritten, 15 added, 16 removed, 5 unchanged
Read the full itemFY2019 item · filed December 13, 2019FY2018 item · filed December 13, 2018
[removed: Market Information][added: Market Information]
As of December [removed: 7, 2018,] [added: 6, 2019,] there were [removed: 2,854] [added: 2,859] registered holders of Applied common stock.
[removed: Performance Graph][added: Performance Graph]
The performance graph below shows the five-year cumulative total stockholder return on Applied common stock during the period from October [removed: 27, 2013] [added: 26, 2014] through October [removed: 28, 2018.][added: 27, 2019.]
This is compared with the cumulative total return of the Standard & Poor’s 500 Stock [removed: Index and] [added: Index,] the RDG Semiconductor Composite Index [added: and the PHLX Semiconductor Index] over the same period.
The comparison assumes $100 was invested on October [removed: 27, 2013] [added: 26, 2014] in Applied common stock and in each of the foregoing indices and assumes reinvestment of dividends, if any.
[removed: COMPARISON] [added: COMPARISON] OF 5 YEAR CUMULATIVE TOTAL [removed: RETURN*][added: RETURN*]
Among Applied Materials, Inc., the S&P 500 [removed: Index][added: Index,]
[removed: and] the RDG Semiconductor Composite Index [added: and the PHLX Semiconductor Index]
[removed: 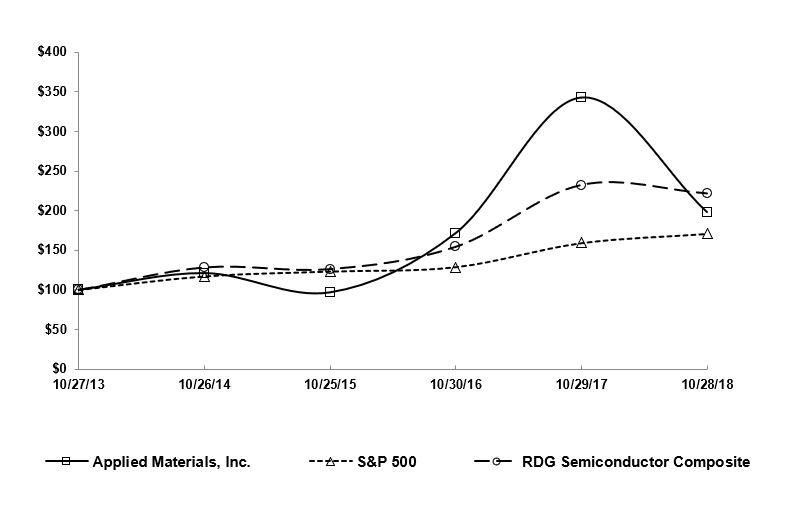][added: ]
*Assumes $100 invested on [removed: 10/27/13] [added: 10/26/14] in stock or [removed: 10/31/13] [added: 10/31/14] in index, including reinvestment of dividends.
Copyright© [removed: 2018] [added: 2019] Standard & Poor’s, a division of S&P global.
| | [removed: 10/27/2013] | | [added: 10/26/2014] | [removed: 10/26/2014] | | | [removed: 10/25/2015] | | [added: 10/25/2015] | [removed: 10/30/2016] | | | [removed: 10/29/2017] | | [added: 10/30/2016] | [removed: 10/28/2018] | | [added: | | | 10/29/2017 | | | | | | 10/28/2018 | | | | | | 10/27/2019 | | |]
[removed: Issuer] [added: Issuer] Purchases of Equity [removed: Securities][added: Securities]
The following table provides information as of October [removed: 28, 2018] [added: 27, 2019] with respect to the shares of common stock repurchased by Applied during the fourth quarter of fiscal [removed: 2018] [added: 2019] pursuant to a publicly announced stock repurchase program approved by the Board of Directors in February 2018, which authorized up to an aggregate of $6.0 billion in repurchases.
| [removed: Period] [added: Period] | [removed: Total] [added: | | Total] Number of Shares [removed: Purchased] [added: Purchased] | | | [removed: Average] [added: | | | Average] Price Paid per [removed: Share] [added: Share] | | | | [removed: Aggregate] [added: | | Aggregate] Price [removed: Paid] [added: Paid] | | | | [removed: Total] [added: | | Total] Number of Shares Purchased as Part of Publicly Announced [removed: Programs *] [added: Programs] | | | [removed: Maximum] [added: | | | Maximum] Dollar Value of Shares That May Yet be Purchased Under the [removed: Programs] [added: Programs] | | | [added: | | | | | | | | | | | | | | | | | | | | | | | |]
| | [removed: (In] [added: | | (In] millions, except per share [removed: amounts)] [added: amounts)] | | | | | | | | | | | | | | | | | [added: | | | | | | | | | | | | | | | | | | | | | | | | | | | | | | | | | |]
| Month #1 | | | | | | | | | | | | | | | | | | [added: | | | | | | | | | | | | | | | | | | | | | | | | | | | | | | | | | | | |]
| Month #2 | | | | | | | | | | | | | | | | | | [added: | | | | | | | | | | | | | | | | | | | | | | | | | | | | | | | | | | | |]
| Month #3 | | | | | | | | | | | | | | | | | | [added: | | | | | | | | | | | | | | | | | | | | | | | | | | | | | | | | | | | |]
Information regarding quarterly cash dividends declared on Applied Materials’s common stock during fiscal 2019, 2018 and 2017 may be found under “Management’s Discussion and Analysis of Financial Condition and Results of Operations - Financial Condition, Liquidity and Capital Resources”.
In addition to the RDG Semiconductor Composite Index, Applied has added the PHLX Semiconductor Index, which Applied believes better represents overall semiconductor industry performance.
| | | | | | | | | | | | | | | | | | | | | | | | | | | | | | | | | | | | |
| --- | --- | --- | --- | --- | --- | --- | --- | --- | --- | --- | --- | --- | --- | --- | --- | --- | --- | --- | --- | --- | --- | --- | --- | --- | --- | --- | --- | --- | --- | --- | --- | --- | --- | --- | --- |
| Applied Materials | | | 100.00 | | | | | | 79.87 | | | | | | 141.85 | | | | | | 283.52 | | | | | | 163.81 | | | | | | 287.88 | | |
| S&P 500 Index | | | 100.00 | | | | | | 105.20 | | | | | | 109.94 | | | | | | 135.93 | | | | | | 145.91 | | | | | | 166.81 | | |
| RDG Semiconductor Composite Index | | | 100.00 | | | | | | 97.22 | | | | | | 119.39 | | | | | | 179.70 | | | | | | 171.36 | | | | | | 222.46 | | |
| PHLX Semiconductor Index | | | 100.00 | | | | | | 105.26 | | | | | | 133.38 | | | | | | 210.24 | | | | | | 201.66 | | | | | | 282.62 | | |
| | | | | | | | | | | | | | | | | | | | | | | | | | | | | | | | | | | | | | | | | | | | | | | | | | | | | | |
| --- | --- | --- | --- | --- | --- | --- | --- | --- | --- | --- | --- | --- | --- | --- | --- | --- | --- | --- | --- | --- | --- | --- | --- | --- | --- | --- | --- | --- | --- | --- | --- | --- | --- | --- | --- | --- | --- | --- | --- | --- | --- | --- | --- | --- | --- | --- | --- | --- | --- | --- | --- | --- | --- |
| | | | | | | | | | | | | | | | | | | | | | | | | | | | | | | | | | | | | | | | | | | | | | | | | | | | | | |
| (July 29, 2019 to August 25, 2019) | | | 2.5 | | | | | | $ | 47.33 | | | | | $ | 119 | | | | | 2.5 | | | | | | $ | 2,305 | | | | | | | | | | | | | | | | | | | | | | | | | |
| (August 26, 2019 to September 22, 2019) | | | 3.3 | | | | | | $ | 49.47 | | | | | 166 | | | | | | 3.3 | | | | | | $ | 2,139 | | | | | | | | | | | | | | | | | | | | | | | | | |
| (September 23, 2019 to October 27, 2019) | | | 4.2 | | | | | | $ | 51.45 | | | | | 215 | | | | | | 4.2 | | | | | | $ | 1,924 | | | | | | | | | | | | | | | | | | | | | | | | | |
| Total | | | 10.0 | | | | | | $ | 49.76 | | | | | $ | 500 | | | | | 10.0 | | | | | | | | | | | | | | | | | | | | | | | | | | | | | | | | |
| | | | | | | | | | | | | | | | | | |
| --- | --- | --- | --- | --- | --- | --- | --- | --- | --- | --- | --- | --- | --- | --- | --- | --- | --- |
| | | | | | | | | | | | | | | | | | |
| Applied Materials | 100.00 | | | 121.04 | | | 96.67 | | | 171.69 | | | 343.16 | | | 198.27 | |
| S&P 500 Index | 100.00 | | | 117.27 | | | 123.37 | | | 128.93 | | | 159.40 | | | 171.11 | |
| RDG Semiconductor Composite Index | 100.00 | | | 128.42 | | | 126.26 | | | 154.41 | | | 232.29 | | | 221.61 | |
| | | | | | | | | | | | | | | | | | |
| --- | --- | --- | --- | --- | --- | --- | --- | --- | --- | --- | --- | --- | --- | --- | --- | --- | --- |
| | | | | | | | | | | | | | | | | | |
| | | | | | | | | | | | | | | | | | |
| (July 30, 2018 to August 26, 2018) | 7.9 | | | $ | 46.69 | | | $ | 369 | | | 7.9 | | | $ | 4,709 | |
| (August 27, 2018 to September 23, 2018) | 3.7 | | | $ | 40.13 | | | 148 | | | | 3.7 | | | $ | 4,561 | |
| (September 24, 2018 to October 28, 2018) | 6.5 | | | $ | 35.78 | | | 234 | | | | 6.5 | | | $ | 4,327 | |
| Total | 18.1 | | | $ | 41.43 | | | $ | 751 | | | 18.1 | | | | | |
| | |
| --- | --- |
Item 6. Selected Financial Data
14 rewritten, 19 added, 9 removed, 1 unchanged
Read the full itemFY2019 item · filed December 13, 2019FY2018 item · filed December 13, 2018
| [removed: Fiscal Year(1)] [added: Fiscal Year(1)] | [removed: 2018] | | [added: 2019] | | [removed: 2017] | | | | [removed: 2016] [added: 2018] | | | | [removed: 2015] | | [added: 2017] | | [removed: 2014] | | | [added: | 2016 | | | | | | 2015 | | | | | | | | | | | | | | | | | | | | | | | | | | |]
| | [removed: (In] [added: | | (In] millions, except percentages and per share [removed: amounts)] [added: amounts)] | | | | | | | | | | | | | | | | | | | [added: | | | | | | | | | | | | | | | | | | | | | | | | | | | | | | | |]
| Net sales | [added: | |] $ | [removed: 17,253] [added: 14,608] | | | [added: | |] $ | [removed: 14,537] [added: 16,705] | | | [added: | |] $ | [added: 14,698 | | | | | $ |] 10,825 | | | [added: | |] $ | 9,659 | | | [removed: $] | [removed: 9,072] | | [added: | | | | | | | | | | | | | | | | | | | |]
| Gross profit | [added: | |] $ | [removed: 7,817] [added: 6,386] | | | [added: | |] $ | [removed: 6,532] [added: 7,517] | | | [added: | |] $ | [added: 6,612 | | | | | $ |] 4,511 | | | [added: | |] $ | 3,952 | | | [removed: $] | [removed: 3,843] | | [added: | | | | | | | | | | | | | | | | | | | |]
| Gross margin | [removed: 45.3] | | [added: 43.7 | |] % | | [removed: 44.9] | | [added: 45.0 | |] % | | [added: | | 45.0 | | % | | | |] 41.7 | | % | | [added: | |] 40.9 | | % | | [removed: 42.4] | | [removed: %] | [added: | | | | | | | | | | | | | | | | | | | |]
| Research, development and engineering | [added: | |] $ | [removed: 2,019] [added: 2,054] | | | [added: | |] $ | [removed: 1,774] [added: 2,022] | | | [added: | |] $ | [added: 1,781 | | | | | $ |] 1,540 | | | [added: | |] $ | 1,451 | | | [removed: $] | [removed: 1,428] | | [added: | | | | | | | | | | | | | | | | | | | |]
| Operating income | [added: | |] $ | [removed: 4,796] [added: 3,350] | | | [added: | |] $ | [removed: 3,868] [added: 4,491] | | | [added: | |] $ | [added: 3,936 | | | | | $ |] 2,152 | | | [added: | |] $ | 1,693 | | | [removed: $] | [removed: 1,520] | | [added: | | | | | | | | | | | | | | | | | | | |]
| Operating margin | [removed: 27.8] | | [added: 22.9 | |] % | | [removed: 26.6] | | [added: 26.9 | |] % | | [added: | | 26.8 | | % | | | |] 19.9 | | % | | [added: | |] 17.5 | | % | | [removed: 16.8] | | [removed: %] | [added: | | | | | | | | | | | | | | | | | | | |]
| Income before income taxes | [added: | |] $ | [removed: 4,694] [added: 3,269] | | | [added: | |] $ | [removed: 3,731] [added: 4,396] | | | [added: | |] $ | [added: 3,816 | | | | | $ |] 2,013 | | | [added: | |] $ | 1,598 | | | [removed: $] | [removed: 1,448] | | [added: | | | | | | | | | | | | | | | | | | | |]
| Net income | [added: | |] $ | [removed: 3,313] [added: 2,706] | | | [added: | |] $ | [removed: 3,434] [added: 3,038] | | | [added: | |] $ | [added: 3,519 | | | | | $ |] 1,721 | | | [added: | |] $ | 1,377 | | | [removed: $] | [removed: 1,072] | | [added: | | | | | | | | | | | | | | | | | | | |]
| Earnings per diluted share | [added: | |] $ | [removed: 3.23] [added: 2.86] | | | [added: | |] $ | [removed: 3.17] [added: 2.96] | | | [added: | |] $ | [added: 3.25 | | | | | $ |] 1.54 | | | [added: | |] $ | 1.12 | | | [removed: $] | [removed: 0.87] | | [added: | | | | | | | | | | | | | | | | | | | |]
| Long-term debt | [added: | |] $ | [added: 4,713 | | | | | $ |] 5,309 | | | [added: | |] $ | 5,304 | | | [added: | |] $ | [removed: 3,143] [added: 3,125] | | | [added: | |] $ | 3,342 | | | [removed: $] | [removed: 1,947] | | [added: | | | | | | | | | | | | | | | | | | | |]
| Cash dividends declared per common share | [added: | |] $ | [removed: 0.70] [added: 0.83] | | | [added: | |] $ | [removed: 0.40] [added: 0.70] | | | [added: | |] $ | 0.40 | | | [added: | |] $ | 0.40 | | | [added: | |] $ | 0.40 | | [added: | | | | | | | | | | | | | | | | | | | | | | | |]
[removed: | (1) | Each fiscal year ended on the last Sunday in October.] Fiscal [added: 2019,] 2018, 2017, [removed: 2015,] and [removed: 2014] [added: 2015] each contained 52 weeks, and fiscal 2016 contained 53 weeks. [removed: |]
Applied adopted the authoritative guidance related to revenue recognition in the first quarter of fiscal 2019 using the full retrospective method.
Applied also adopted authoritative guidance related to retirement benefits in the first quarter of fiscal 2019 using the retrospective method.
The adoption of these guidance required restating fiscal years 2018 and 2017 results as presented below.
| | | | | | | | | | | | | | | | | | | | | | | | | | | | | | | | | | | | | | | | | | | | | | | | | | | | | | |
| --- | --- | --- | --- | --- | --- | --- | --- | --- | --- | --- | --- | --- | --- | --- | --- | --- | --- | --- | --- | --- | --- | --- | --- | --- | --- | --- | --- | --- | --- | --- | --- | --- | --- | --- | --- | --- | --- | --- | --- | --- | --- | --- | --- | --- | --- | --- | --- | --- | --- | --- | --- | --- | --- |
| | | | | | | | | | | | | | | | | | | | | | | | | | | | | | | | | | | | | | | | | | | | | | | | | | | | | | |
| | | | | | | | | | | | | | | | | | | | | | | | | | | | | | | | | | | | | | | | | | | | | | | | | | | | | | |
| | | | | | | | | | | | | | | | | | | | | | | | | | | | | | | | | | | | | | | | | | | | | | | | | | | | | | |
| | | | | | | | | | | | | | | | | | | | | | | | | | | | | | | | | | | | | | | | | | | | | | | | | | | | | | |
| | | | | | | | | | | | | | | | | | | | | | | | | | | | | | | | | | | | | | | | | | | | | | | | | | | | | | |
| | | | | | | | | | | | | | | | | | | | | | | | | | | | | | | | | | | | | | | | | | | | | | | | | | | | | | |
| | | | | | | | | | | | | | | | | | | | | | | | | | | | | | | | | | | | | | | | | | | | | | | | | | | | | | |
| | | | | | | | | | | | | | | | | | | | | | | | | | | | | | | | | | | | | | | | | | | | | | | | | | | | | | |
| | | | | | | | | | | | | | | | | | | | | | | | | | | | | | | | | | | | | | | | | | | | | | | | | | | | | | |
| Total assets | | | $ | 19,024 | | | | | $ | 17,633 | | | | | $ | 19,190 | | | | | $ | 14,570 | | | | | $ | 15,308 | | | | | | | | | | | | | | | | | | | | | | | | | |
| | | | | | | | | | | | | | | | | | | | | | | | | | | | | | | | | | | | | | | | | | | | | | | | | | | | | | |
| | | | | | | | | | | | | | | | | | | | | | | | | | | | | | | | | | | | | | | | | | | | | | | | | | | | | | |
| | | | | | | | | | | | | | | | | | | | | | | | | | | | | | | | | | | | | | | | | | | | | | | | | | | | | | |
(1)Each fiscal year ended on the last Sunday in October.
| | | | | | | | | | | | | | | | | | | | |
| --- | --- | --- | --- | --- | --- | --- | --- | --- | --- | --- | --- | --- | --- | --- | --- | --- | --- | --- | --- |
| | | | | | | | | | | | | | | | | | | | |
| | | | | | | | | | | | | | | | | | | | |
| Total assets | $ | 17,773 | | | $ | 19,419 | | | $ | 14,588 | | | $ | 15,308 | | | $ | 13,174 | |
| | |
| --- | --- |
| | |
| --- | --- |
Item 8. Financial Statements and Supplementary Data
0 rewritten, 0 added, 2 removed, 1 unchanged
Read the full itemFY2019 item · filed December 13, 2019FY2018 item · filed December 13, 2018
| | |
| --- | --- |
Item 9. Changes in and Disagreements with Accountants on Accounting and Financial Disclosure
0 rewritten, 0 added, 2 removed, 1 unchanged
Read the full itemFY2019 item · filed December 13, 2019FY2018 item · filed December 13, 2018
| | |
| --- | --- |
Item 9A. Controls and Procedures
7 rewritten, 0 added, 2 removed, 6 unchanged
Read the full itemFY2019 item · filed December 13, 2019FY2018 item · filed December 13, 2018
[removed: Disclosure] [added: Disclosure] Controls and [removed: Procedures][added: Procedures]
[removed: Management’s] [added: Management’s] Report on Internal Control over Financial [removed: Reporting][added: Reporting]
Based on that evaluation, Applied’s management concluded that Applied’s internal control over financial reporting was effective as of October [removed: 28, 2018.][added: 27, 2019.]
KPMG LLP, an independent registered public accounting firm, has audited the consolidated financial statements included in this Form 10-K and, as part of the audit, has issued a report, included herein, on the effectiveness of Applied’s internal control over financial reporting as of October [removed: 28, 2018.][added: 27, 2019.]
[removed: Changes] [added: Changes] in Internal Control over Financial [removed: Reporting][added: Reporting]
During the fourth quarter of fiscal [removed: 2018,] [added: 2019,] there were no changes in the internal control over financial reporting that materially affected, or are reasonably likely to materially affect, Applied’s internal control over financial reporting.
[removed: Inherent] [added: Inherent] Limitations of Disclosure Controls and Procedures and Internal Control over Financial [removed: Reporting][added: Reporting]
| | |
| --- | --- |
Item 9B. Other Information
1 rewritten, 0 added, 2 removed, 1 unchanged
Read the full itemFY2019 item · filed December 13, 2019FY2018 item · filed December 13, 2018
[removed: PART III][added: PART III]
| | |
| --- | --- |
Item 10. Directors, Executive Officers and Corporate Governance
2 rewritten, 0 added, 3 removed, 3 unchanged
Read the full itemFY2019 item · filed December 13, 2019FY2018 item · filed December 13, 2018
Except for the information regarding executive officers required by Item 401 of Regulation S-K (which is included in Part I, Item 1 of this Annual Report on Form 10-K, under “Executive Officers of the Registrant”) and code of ethics (which is set forth below), the information required by this item will be provided in accordance with Instruction G(3) to Form 10-K no later than February [removed: 25, 2019.][added: 24, 2020.]
The above information, including the Standards of Business Conduct, is available on Applied’s website under the Corporate Governance section at [removed: http://www.appliedmaterials.com/company/investor-relations/governance.][added: *http://www.appliedmaterials.com/company/investor-relations/governance.* This website address is intended to be an inactive, textual reference only.]
This website address is intended to be an inactive, textual reference only.
| | |
| --- | --- |
Item 11. Executive Compensation
1 rewritten, 0 added, 2 removed, 0 unchanged
Read the full itemFY2019 item · filed December 13, 2019FY2018 item · filed December 13, 2018
The information required by this Item will be provided in accordance with Instruction G(3) to Form 10-K no later than February [removed: 25, 2019.][added: 24, 2020.]
| | |
| --- | --- |
Item 12. Security Ownership of Certain Beneficial Owners and Management and Related Stockholder Matters
13 rewritten, 6 added, 19 removed, 8 unchanged
Read the full itemFY2019 item · filed December 13, 2019FY2018 item · filed December 13, 2018
Except for the information regarding securities authorized for issuance under equity compensation plans (which is set forth below), the information required by this Item will be provided in accordance with Instruction G(3) to Form 10-K no later than February [removed: 25, 2019.][added: 24, 2020.]
The following table summarizes information with respect to equity awards under Applied’s equity compensation plans as of October [removed: 28, 2018:][added: 27, 2019:]
[removed: Equity] [added: Equity] Compensation Plan [removed: Information][added: Information]
| [removed: Plan Category] [added: Plan Category] | [removed: (a)] [added: | | (a)] Number of Securities to be Issued Upon Exercise of Outstanding Options, Warrants and [removed: Rights(1)] [added: Rights(1)] | | | | [removed: (b)] [added: | | | | | (b)] Weighted Average Exercise Price of Outstanding Options, Warrants and [removed: Rights(2)] [added: Rights(2)] | | | | [removed: (c)] [added: | | (c)] Number of Securities Available for Future Issuance Under Equity Compensation Plans (Excluding Securities Reflected in [removed: Column(a))] [added: Column(a))] | | | [added: | | | | | | | | | | | | | | | | | |]
| | [removed: (In] [added: | | (In] millions, except [removed: prices)] [added: prices)] | | | | | | | | | | | [added: | | | | | | | | | | | | | | | | | | | | | | | | |]
| Equity compensation plans approved by security holders | [removed: 20] | | [added: 19] | | [added: | | | | | | |] $ | 15.06 | | | [removed: 94] | | [added: 77 | | |] (3) | [added: | | | | | | | | | | | | | | | | |]
| Equity compensation plans not approved by security holders | [added: | |] — | | [removed: (4)] | | [added: | | | | |] $ | [removed: 7.27] [added: —] | | | [removed: 4] | | [removed: (5)] [added: 2] | [added: | | (4) | | | | | | | | | | | | | | | | | |]
[removed: | (1) | Includes] [added: (1)Includes] only options, restricted stock units and performance shares outstanding under Applied’s equity compensation plans, as no stock warrants or other rights were outstanding as of October [removed: 28, 2018. |][added: 27, 2019.]
[removed: | (2) | The] [added: (2)The] weighted average exercise price calculation does not take into account any restricted stock units or performance shares. [removed: |]
[removed: | (3) | Includes 13] [added: (3)Includes 11] million shares of Applied common stock available for future issuance under the Applied Materials, Inc. Employees’ Stock Purchase Plan. [removed: Of these 13 million shares, 1 million are subject to purchase during the purchase period in effect as of October 28, 2018. |]
[removed: | (5) | Includes 4] [added: (4)Includes 2] million shares of Applied common stock available for future issuance under the Applied Materials, Inc. Stock Purchase Plan for Offshore Employees. [removed: Of these 4 million shares, 1 million are subject to purchase during the purchase period in effect as of October 28, 2018. |]
[added: *Stock Purchase Plan for Offshore Employees.*] The Stock Purchase Plan for Offshore Employees (the Offshore ESPP) was adopted effective as of October 16, 1995 for the benefit of employees of Applied’s participating affiliates.
As of October [removed: 28, 2018,] [added: 27, 2019,] a total of 36 million shares have been authorized for issuance under the Offshore ESPP, and [removed: 4] [added: 2] million shares remain available for issuance.
| | | | | | | | | | | | | | | | | | | | | | | | | | | | | | | | | | | | | | | |
| --- | --- | --- | --- | --- | --- | --- | --- | --- | --- | --- | --- | --- | --- | --- | --- | --- | --- | --- | --- | --- | --- | --- | --- | --- | --- | --- | --- | --- | --- | --- | --- | --- | --- | --- | --- | --- | --- | --- |
| | | | | | | | | | | | | | | | | | | | | | | | | | | | | | | | | | | | | | | |
| Total | | | 19 | | | | | | | | | $ | 15.06 | | | | | 79 | | | | | | | | | | | | | | | | | | | | |
Of these 11 million shares, 1 million are subject to purchase during the purchase period in effect as of October 27, 2019.
Of these 2 million shares, 1 million are subject to purchase during the purchase period in effect as of October 27, 2019.
| | | | | | | | | | | | |
| --- | --- | --- | --- | --- | --- | --- | --- | --- | --- | --- | --- |
| | | | | | | | | | | | |
| | | | | | | | | | | | |
| Total | 20 | | | | $ | 15.02 | | | 98 | | |
| | |
| --- | --- |
| | |
| --- | --- |
| | |
| --- | --- |
| | |
| --- | --- |
| (4) | Includes options to purchase 5 thousand shares of Applied common stock assumed through various mergers and acquisitions, after giving effect to the applicable exchange ratios. The assumed options had a weighted average exercise price of $7.27 per share. No further shares are available for issuance under the plans under which these assumed awards were granted. |
| | |
| --- | --- |
Stock Purchase Plan for Offshore Employees.
| | |
| --- | --- |
Item 13. Certain Relationships and Related Transactions, and Director Independence
1 rewritten, 0 added, 2 removed, 0 unchanged
Read the full itemFY2019 item · filed December 13, 2019FY2018 item · filed December 13, 2018
The information required by this Item will be provided in accordance with Instruction G(3) to Form 10-K no later than February [removed: 25, 2019.][added: 24, 2020.]
| | |
| --- | --- |
Item 14. Principal Accounting Fees and Services
2 rewritten, 0 added, 2 removed, 0 unchanged
Read the full itemFY2019 item · filed December 13, 2019FY2018 item · filed December 13, 2018
The information required by this Item will be provided in accordance with Instruction G(3) to Form 10-K no later than February [removed: 25, 2019.][added: 24, 2020.]
[removed: PART IV][added: PART IV]
| | |
| --- | --- |
Item 15. Exhibits, Financial Statement Schedules
11 rewritten, 12 added, 15 removed, 2 unchanged
Read the full itemFY2019 item · filed December 13, 2019FY2018 item · filed December 13, 2018
| | | [removed: Page Number] | [added: | | | Page Number | | |]
| (1) | [added: | |] Financial Statements: | | [added: | | | |]
| | [added: | |] [Reports of Independent Registered Public Accounting [removed: Firm](#sADDD11F55793569CA1674B60B434ED5C)] [added: Firm](#i_0_106)] | [removed: [54](#sADDD11F55793569CA1674B60B434ED5C)] | [added: | [58](#i_0_106) | | |]
| | [added: | |] [Consolidated Statements of [removed: Operations](#s5223855EE2CB588D82D69D4D55E1DE79)] [added: Operations](#i_0_112)] | [removed: [56](#s5223855EE2CB588D82D69D4D55E1DE79)] | [added: | [61](#i_0_112) | | |]
| | [added: | |] [Consolidated Statements of Comprehensive [removed: Income](#s0C2E9F7BCB755FECBEF0BA38C13FA49F)] [added: Income](#i_0_115)] | [removed: [57](#s0C2E9F7BCB755FECBEF0BA38C13FA49F)] | [added: | [62](#i_0_115) | | |]
| | [added: | |] [Consolidated Balance [removed: Sheets](#s386D831184E6502DB04CEA39A3359E97)] [added: Sheets](#i_0_118)] | [removed: [58](#s386D831184E6502DB04CEA39A3359E97)] | [added: | [63](#i_0_118) | | |]
| | [added: | |] [Consolidated Statements of Stockholders’ [removed: Equity](#sB692FD76FD545F988D2263EBD56D6CF7)] [added: Equity](#i_0_124)] | [removed: [59](#sB692FD76FD545F988D2263EBD56D6CF7)] | [added: | [64](#i_0_124) | | |]
| | [added: | |] [Consolidated Statements of Cash [removed: Flows](#s2FADD01F0E5B5C3889A5D5AC54C657A2)] [added: Flows](#i_0_130)] | [removed: [60](#s2FADD01F0E5B5C3889A5D5AC54C657A2)] | [added: | [65](#i_0_130) | | |]
| | [added: | |] [Notes to Consolidated Financial [removed: Statements](#sA6CA1D7B37265F569981E48E4CF5F3A0)] [added: Statements](#i_0_133)] | [removed: [61](#sA6CA1D7B37265F569981E48E4CF5F3A0)] | [added: | [66](#i_0_133) | | |]
| (2) | [added: | |] Exhibits: | | [added: | | | |]
| | [added: | |] [The exhibits listed in the accompanying Index to Exhibits are filed or incorporated by reference as part of this Annual Report on Form [removed: 10-K](#s76C4D782685658C48BFF5452813D8975)] [added: 10-K](#i_0_211)] | [removed: [99](#s76C4D782685658C48BFF5452813D8975)] | [added: | [106](#i_0_211) | | |]
| | | | | | | | | |
| --- | --- | --- | --- | --- | --- | --- | --- | --- |
| | | | | | | | | |
| | | | | | | | | |
| | | | | | | | | |
| | | | | | | | | |
| | | | | | | | | |
| | | | | | | | | |
| | | | | | | | | |
| | | | | | | | | |
| | | | | | | | | |
| | | | | | | | | |
| | | |
| --- | --- | --- |
| | | |
| | | |
| | | |
| | | |
| | | |
| | | |
| | | |
| | | |
| | | |
| | | |
| | | |
| | |
| --- | --- |
Item 16. Form 10-K Summary
938 rewritten, 545 added, 464 removed, 370 unchanged
Read the full itemFY2019 item · filed December 13, 2019FY2018 item · filed December 13, 2018
[removed: REPORT] [added: REPORT] OF INDEPENDENT REGISTERED PUBLIC ACCOUNTING [removed: FIRM][added: FIRM]
[removed: Opinion] [added: *Opinion] on the [removed: Consolidated Financial Statements][added: Consolidated* *Financial Statements*]
We have audited the accompanying consolidated balance sheets of Applied Materials, Inc. and subsidiaries (the Company) as of October [removed: 28, 2018] [added: 27, 2019] and October [removed: 29, 2017,] [added: 28, 2018,] the related consolidated statements of operations, comprehensive income, stockholders’ equity, and cash flows for each of the years in the three-year period ended October [removed: 28, 2018,] [added: 27, 2019,] and the related notes (collectively, the consolidated financial statements).
In our opinion, the consolidated financial statements present fairly, in all material respects, the financial position of the Company as of October [removed: 28, 2018] [added: 27, 2019] and October [removed: 29, 2017,] [added: 28, 2018,] and the results of its operations and its cash flows for each of the years in the three-year period ended October [removed: 28, 2018,] [added: 27, 2019,] in conformity with U.S. generally accepted accounting principles.
We also have audited, in accordance with the standards of the Public Company Accounting Oversight Board (United States) (PCAOB), the Company’s internal control over financial reporting as of October [removed: 28, 2018,] [added: 27, 2019,] based on criteria established in [removed: Internal] [added: *Internal] Control - Integrated Framework [removed: (2013)] [added: (2013)*] issued by the Committee of Sponsoring Organizations of the Treadway Commission, and our report dated December 13, [removed: 2018] [added: 2019] expressed an unqualified opinion on the effectiveness of the Company’s internal control over financial reporting.
[removed: Basis] [added: *Basis] for [removed: Opinion][added: Opinion*]
| /S/ KPMG LLP | [added: | |]
| KPMG LLP | [added: | |]
[removed: December 13, 2018][added: | 2018 | | | | | | | | | | | | | | | | | | | | | | | | | | | | | | | | | | | | | | | | | | | | | | | | | | | | | |]
[removed: REPORT] [added: REPORT] OF INDEPENDENT REGISTERED PUBLIC ACCOUNTING [removed: FIRM][added: FIRM]
[removed: Opinion] [added: *Opinion] on Internal Control Over Financial [removed: Reporting][added: Reporting*]
We have audited Applied Materials, Inc. and [removed: subsidiaries] [added: subsidiaries'] (the Company) internal control over financial reporting as of October [removed: 28, 2018,] [added: 27, 2019,] based on criteria established in [removed: Internal] [added: *Internal] Control - Integrated Framework [removed: (2013)] [added: (2013)*] issued by the Committee of Sponsoring Organizations of the Treadway Commission.
In our opinion, the Company maintained, in all material respects, effective internal control over financial reporting as of October [removed: 28, 2018,] [added: 27, 2019,] based on criteria established in [removed: Internal] [added: *Internal] Control - Integrated Framework [removed: (2013)] [added: (2013)*] issued by the Committee of Sponsoring Organizations of the Treadway Commission.
We also have audited, in accordance with the standards of the Public Company Accounting Oversight Board (United States) (PCAOB), the consolidated balance sheets of the Company as of October [removed: 28, 2018] [added: 27, 2019] and October [removed: 29, 2017,] [added: 28, 2018,] the related consolidated statements of operations, comprehensive income, stockholders’ equity, and cash flows for each of the years in the three-year period ended October [removed: 28, 2018,] [added: 27, 2019,] and the related notes (collectively, the consolidated financial statements), and our report dated December 13, [removed: 2018] [added: 2019] expressed an unqualified opinion on those consolidated financial statements.
[removed: Basis] [added: *Basis] for [removed: Opinion][added: Opinion*]
[removed: Definition] [added: *Definition] and Limitations of Internal Control Over Financial [removed: Reporting][added: Reporting*]
| /s/ KPMG LLP | [added: | |]
| KPMG LLP | [added: | |]
[removed: APPLIED] [added: APPLIED] MATERIALS, [removed: INC.][added: INC.]
[removed: CONSOLIDATED] [added: CONSOLIDATED] STATEMENTS OF [removed: OPERATIONS][added: OPERATIONS]
[removed: (In] [added: (In] millions, except per share [removed: amounts)][added: amounts)]
| [removed: Fiscal Year] [added: Fiscal Year] | [removed: 2018] | | [added: 2019] | | [removed: 2017] | | | | [removed: 2016] [added: 2018] | | | [added: | | | 2017 | | |]
| Net sales | [added: | |] $ | 17,253 | | [added: $] | [added: (548) | |] $ | [added: — | | $ | 16,705 | | | | | $ |] 14,537 | | [added: $] | [added: 161 | |] $ | [removed: 10,825] [added: —] | | [added: $ | 14,698 | | | | | | | | | | | | | | | | | | | | | | | | | |]
| Cost of products sold | [added: | | $ |] 9,436 | | [added: $] | [added: (250)] | [added: | $ | 2 | | $ | 9,188 | | | | | $ |] 8,005 | | [added: $] | [added: 76] | [removed: 6,314] | [added: $] | [added: 5] | [added: | $ | 8,086 | | | | | | | | | | | | | | | | | | | | | | | | | |]
| Gross profit | [added: | | $ |] 7,817 | | [added: $] | [added: (298)] | [added: | $ | (2) | | $ | 7,517 | | | | | $ |] 6,532 | | [added: $] | [added: 85] | [removed: 4,511] | [added: $] | [added: (5)] | [added: | $ | 6,612 | | | | | | | | | | | | | | | | | | | | | | | | | |]
| Operating expenses: | | | | | | | | | | | | [added: | | | | | |]
| Research, development and engineering | [added: | | $ |] 2,019 | | [added: $] | [added: —] | [added: | $ | 3 | | $ | 2,022 | | | | | $ |] 1,774 | | [added: $] | [added: —] | [removed: 1,540] | [added: $] | [added: 7] | [added: | $ | 1,781 | | | | | | | | | | | | | | | | | | | | | | | | | |]
| Marketing and selling | [added: | | $ |] 521 | | [added: $] | [added: —] | [added: | $ | — | | $ | 521 | | | | | $ |] 456 | | [added: $] | [added: —] | [removed: 429] | [added: $] | [added: 1] | [added: | $ | 457 | | | | | | | | | | | | | | | | | | | | | | | | | |]
| General and administrative | [added: | | $ |] 481 | | [added: $] | [added: —] | [added: | $ | 2 | | $ | 483 | | | | | $ |] 434 | | [added: $] | [added: —] | [removed: 390] | [added: $] | [added: 4] | [added: | $ | 438 | | | | | | | | | | | | | | | | | | | | | | | | | |]
| Interest expense | [removed: 234] | | [added: 237] | | [removed: 198] | | | | [removed: 155] [added: 234] | | | [added: | | | 198 | | |]
| Interest and other income, net | [added: | | $ |] 132 | | [added: $] | [added: —] | [added: | $ | 7 | | $ | 139 | | | | | $ |] 61 | | [added: $] | [added: —] | [removed: 16] | [added: $] | [added: 17] | [added: | $ | 78 | | | | | | | | | | | | | | | | | | | | | | | | | |]
| Income before income taxes | [added: | | $ |] 4,694 | | [added: $] | [added: (298)] | [added: | $ | — | | $ | 4,396 | | | | | $ |] 3,731 | | [added: $] | [added: 85] | [removed: 2,013] | [added: $] | [added: —] | [added: | $ | 3,816 | | | | | | | | | | | | | | | | | | | | | | | | | |]
| Provision for income taxes | [added: | | $ |] 1,381 | | [added: $] | [added: (23)] | [added: | $ | — | | $ | 1,358 | | | | | $ |] 297 | | [added: $] | [added: —] | [removed: 292] | [added: $] | [added: —] | [added: | $ | 297 | | | | | | | | | | | | | | | | | | | | | | | | | |]
| Net income | [added: | |] $ | 3,313 | | [added: $] | [added: (275) | |] $ | [added: — | | $ | 3,038 | | | | | $ |] 3,434 | | [added: $] | [added: 85 | |] $ | [removed: 1,721] [added: —] | | [added: $ | 3,519 | | | | | | | | | | | | | | | | | | | | | | | | | |]
| Earnings per share: | | | | | | | | | | | | [added: | | | | | |]
| Weighted average number of shares: | | | | | | | | | | | | [added: | | | | | |]
| Basic | [removed: 1,013] | | [added: 937] | | [removed: 1,073] | | | | [removed: 1,107] [added: 1,013] | | | [added: | | | 1,073 | | |]
| Diluted | [removed: 1,026] | | [added: 945] | | [removed: 1,084] | | | | [removed: 1,116] [added: 1,026] | | | [added: | | | 1,084 | | |]
[removed: APPLIED] [added: APPLIED] MATERIALS, [removed: INC.][added: INC.]
[removed: CONSOLIDATED] [added: CONSOLIDATED] STATEMENTS OF COMPREHENSIVE [removed: INCOME][added: INCOME]
*Change in Accounting Principle*
As discussed in note 1 to the consolidated financial statements, in 2019, the Company has changed its method of accounting for revenue due to the adoption of Financial Accounting Standards Board Accounting Standards Codification Topic 606, *Revenue from Contracts with Customers*, and its method of accounting for intra-entity transfer of assets other than inventory due to the adoption of the Accounting Standards Update (ASU) No. 2016-16, *Income Taxes: Intra-Entity Transfers of Assets Other Than Inventory*.
*Critical Audit Matters*
The critical audit matters communicated below are matters arising from the current period audit of the consolidated financial statements that were communicated or required to be communicated to the audit committee and that: (1) relate to accounts or disclosures that are material to the consolidated financial statements and (2) involved our especially challenging, subjective, or complex judgments.
The communication of critical audit matters does not alter in any way our opinion on the consolidated financial statements, taken as a whole, and we are not, by communicating the critical audit matters below, providing separate opinions on the critical audit matters or on the accounts or disclosures to which they relate.
*Evaluation of net realizable value adjustments to inventories for excess or obsolescence*
As discussed in notes 1 and 8 to the consolidated financial statements, the Company has inventories with a carrying value of $3,474 million as of October 27, 2019.
The Company adjusts inventory carrying value for estimated excess or obsolescence equal to the difference between cost of inventory and the estimated net realizable value based upon assumptions about future demand and market conditions.
If actual demand were to be substantially lower than estimated, there could be a significant adverse impact on the carrying value of inventories and results of operations.
We identified the evaluation of net realizable value adjustments to inventories for excess or obsolescence as a critical audit matter.
Evaluation of the Company’s estimates regarding forecasted sales and inventory consumption involved a high degree of auditor judgment.
The primary procedures we performed to address this critical audit matter included the following.
We tested certain internal controls over the Company’s process for determining net realizable value adjustments for inventory excess or obsolescence, including estimating forecasted sales and inventory consumption.
We evaluated certain inventories for excess or obsolescence by comparing the Company’s sales and inventory consumption forecast to historical sales, historical inventory usage, known customer orders, and industry outlook reports.
In addition, for certain inventories, we compared the Company’s historical estimates of net realizable value adjustments for excess and obsolescence to the actual physical inventory disposals to evaluate the Company’s ability to accurately estimate the net realizable value adjustments.
*Evaluation of the fair value of the underlying intangible assets utilized to record the deferred tax asset*
As discussed in note 1 to the consolidated financial statements, the Company adopted ASU No. 2016-16 in the current year and upon adoption recorded a deferred tax asset of $1.6 billion related to the estimated income tax effects of an intra-entity transfer of intangible assets.
The recorded deferred tax asset involves significant judgment in estimating the fair value of the underlying intangible assets that are subject to amortization for tax purposes.
We identified the evaluation of the fair value of the underlying intangible assets utilized to record the deferred tax asset as a critical audit matter.
There was a high degree of subjectivity in evaluating the valuation methodology and assumptions utilized by the Company in estimating the fair value of the underlying intangible assets utilized to record the deferred tax asset.
These assumptions included the fair value of the Company’s operating assets, discount rate and comparable company benchmark ratios utilized to calculate the portion of market value attributable to the intangible assets.
The primary procedures we performed to address this critical audit matter included the following.
We tested certain internal controls over the Company’s process to develop the assumptions used in the valuation, including the fair value of the Company’s operating assets, the discount rate, and comparable company benchmark ratios.
We evaluated the fair value of the Company’s operating assets by comparing it to the Company’s market capitalization, adjusted for the fair value of the Company’s nonoperating assets and debt.
We evaluated the comparable company benchmark rate by assessing comparable companies used by the Company in developing the assumption and testing the benchmark rate based on observable market information.
We involved valuation professionals with specialized skills and knowledge, who assisted in:
- Evaluating the valuation methodology utilized by the Company
- Evaluating the discount rate by comparing it to a discount rate that was independently developed using observable market information.
| --- | --- | --- |
December 13, 2019
| | | | | | | | | | | | | | | | | | |
| --- | --- | --- | --- | --- | --- | --- | --- | --- | --- | --- | --- | --- | --- | --- | --- | --- | --- |
| | | | | | | | | | | | | | | | | | |
| Net sales | | | $ | 14,608 | | | | | $ | 16,705 | | | | | $ | 14,698 | |
| Cost of products sold | | | 8,222 | | | | | | 9,188 | | | | | | 8,086 | | |
| Gross profit | | | 6,386 | | | | | | 7,517 | | | | | | 6,612 | | |
| Research, development and engineering | | | 2,054 | | | | | | 2,022 | | | | | | 1,781 | | |
| Marketing and selling | | | 521 | | | | | | 521 | | | | | | 457 | | |
| General and administrative | | | 461 | | | | | | 483 | | | | | | 438 | | |
| | | | | | | | | | | | | | | | | | |
| |
| --- |
| |
| |
| --- |
| |
December 13, 2018
| | | | | | | | | | | | |
| --- | --- | --- | --- | --- | --- | --- | --- | --- | --- | --- | --- |
| | | | | | | | | | | | |
| | | | | | | | | | | | |
| Total operating expenses | 3,021 | | | | 2,664 | | | | 2,359 | | |
| Income from operations | 4,796 | | | | 3,868 | | | | 2,152 | | |
| Basic | $ | 3.27 | | | $ | 3.20 | | | $ | 1.56 | |
| Diluted | $ | 3.23 | | | $ | 3.17 | | | $ | 1.54 | |
| | | | | | | | | | | | |
| --- | --- | --- | --- | --- | --- | --- | --- | --- | --- | --- | --- |
| | | | | | | | | | | | |
| | | | | | | | | | | | |
| Comprehensive income | $ | 3,249 | | | $ | 3,485 | | | $ | 1,698 | |
| | | | | | | | |
| --- | --- | --- | --- | --- | --- | --- | --- |
| | | | | | | | |
| | | | | | | | |
| Total assets | $ | 17,773 | | | $ | 19,419 | |
| | | | | | | | |
| Total liabilities | 10,934 | | | | 10,070 | | |
| Balance at October 25, 2015 | 1,160 | | | $ | 11 | | | $ | 6,575 | | | $ | 13,967 | | | 793 | | | $ | (12,848 | ) | | $ | (92 | ) | | $ | 7,613 | |
| | | | | | | | | | | | |
| --- | --- | --- | --- | --- | --- | --- | --- | --- | --- | --- | --- |
| | | | | | | | | | | | |
| | | | | | | | | | | | |
| Net income | $ | 3,313 | | | $ | 3,434 | | | $ | 1,721 | |
| Customer deposits and deferred revenue | (318 | | ) | | 289 | | | | 611 | | |
| Common stock repurchases | (5,283 | | ) | | (1,172 | | ) | | (1,892 | | ) |
| | |
| --- | --- |
The first fiscal quarter of 2016 contained 14 weeks, while the second, third and fourth quarters of fiscal 2016 contained 13 weeks.
Investments classified as available-for-sale are recorded at fair value based upon quoted market prices, and any temporary difference between the cost and fair value of an investment is presented as a separate component of accumulated other comprehensive income (loss).
The specific identification method is used to determine the gains and losses on investments.
An excerpt. Shown here: 40 of 938 rewritten, 40 of 545 added and 40 of 464 removed. The counts are complete. For every sentence, read Item 16. Form 10-K Summary in the FY2019 filing and the FY2018 filing.