 filings.tools
Item 5. MARKET FOR REGISTRANT’S COMMON EQUITY, RELATED STOCKHOLDER MATTERS AND ISSUER PURCHASES OF EQUITY SECURITIES
12K characters. Original on sec.gov · Markdown
Item 5. MARKET FOR REGISTRANT’S COMMON EQUITY, RELATED STOCKHOLDER MATTERS AND ISSUER PURCHASES OF EQUITY SECURITIES
The following table presents reported quarterly high and low per share sale prices of our common stock on the NYSE for the years 2017 and 2016.
| 2017 | High | Low | ||||||
| Quarter ended March 31 | $121.85 | $102.51 | ||||||
| Quarter ended June 30 | 137.12 | 120.44 | ||||||
| Quarter ended September 30 | 148.71 | 130.82 | ||||||
| Quarter ended December 31 | 155.28 | 135.66 | ||||||
| 2016 | High | Low | ||||||
| Quarter ended March 31 | $102.93 | $83.07 | ||||||
| Quarter ended June 30 | 113.63 | 101.87 | ||||||
| Quarter ended September 30 | 118.26 | 107.57 | ||||||
| Quarter ended December 31 | 118.09 | 99.72 |
On February 20, 2018, the closing price of our common stock was $139.24 per share as reported on the NYSE. As of February 20, 2018, we had 440,851,771 outstanding shares of common stock and 150 registered holders.
Dividends
As a REIT, we must annually distribute to our stockholders an amount equal to at least 90% of our REIT taxable income (determined before the deduction for distributed earnings and excluding any net capital gain). Generally, we have distributed and expect to continue to distribute all or substantially all of our REIT taxable income after taking into consideration our utilization of net operating losses (“NOLs”).
We had two series of preferred stock, the 5.25% Mandatory Convertible Preferred Stock, Series A (the “Series A Preferred Stock”), issued in May 2014, with a dividend rate of 5.25%, and the 5.50% Mandatory Convertible Preferred Stock, Series B (the “Series B Preferred Stock”), issued in March 2015, with a dividend rate of 5.50%. Dividends were payable quarterly in arrears, subject to declaration by our Board of Directors.
As of May 15, 2017, all shares of the Series A Preferred Stock converted into shares of our common stock. On May 15, 2017, we paid the final dividend of $7.9 million to holders of record of the Series A Preferred Stock at the close of business on May 1, 2017. As of February 15, 2018, all shares of the Series B Preferred Stock converted into shares of our common stock. On February 15, 2018, we paid the final dividend of $18.9 million to holders of record of the Series B Preferred Stock at the close of business on February 1, 2018.
The amount, timing and frequency of future distributions will be at the sole discretion of our Board of Directors and will depend upon various factors, a number of which may be beyond our control, including our financial condition and operating cash flows, the amount required to maintain our qualification for taxation as a REIT and reduce any income and excise taxes that we otherwise would be required to pay, limitations on distributions in our existing and future debt and preferred equity instruments, our ability to utilize NOLs to offset our distribution requirements, limitations on our ability to fund distributions using cash generated through our TRSs and other factors that our Board of Directors may deem relevant.
We have distributed an aggregate of approximately $4.3 billion to our common stockholders, including the dividend paid in January 2018.
During the year ended December 31, 2017, we declared the following cash distributions:
| Declaration Date | Payment Date | Record Date | Distribution per share | Aggregate Payment Amount (in millions) (1) | ||||||||
| Common Stock | ||||||||||||
| March 9, 2017 | April 28, 2017 | April 12, 2017 | $ | 0.62 | $ | 264.3 | ||||||
| June 1, 2017 | July 14, 2017 | June 19, 2017 | $ | 0.64 | $ | 274.7 | ||||||
| September 11, 2017 | October 17, 2017 | September 29, 2017 | $ | 0.66 | $ | 283.3 | ||||||
| December 6, 2017 | January 16, 2018 | December 28, 2017 | $ | 0.70 | $ | 300.2 | ||||||
| Series A Preferred Stock | ||||||||||||
| January 13, 2017 | February 15, 2017 | February 1, 2017 | $ | 1.3125 | $ | 7.9 | ||||||
| April 13, 2017 | May 15, 2017 | May 1, 2017 | $ | 1.3125 | $ | 7.9 | ||||||
| Series B Preferred Stock | ||||||||||||
| January 13, 2017 | February 15, 2017 | February 1, 2017 | $ | 13.75 | $ | 18.9 | ||||||
| April 13, 2017 | May 15, 2017 | May 1, 2017 | $ | 13.75 | $ | 18.9 | ||||||
| July 14, 2017 | August 15, 2017 | August 1, 2017 | $ | 13.75 | $ | 18.9 | ||||||
| October 19, 2017 | November 15, 2017 | November 1, 2017 | $ | 13.75 | $ | 18.9 |
(1) For common stock, aggregate payment does not include amounts accrued for distributions payable related to unvested restricted stock units.
During the year ended December 31, 2016, we declared the following cash distributions:
| Declaration Date | Payment Date | Record Date | Distribution per share | Aggregate Payment Amount (in millions) (1) | ||||||||
| Common Stock | ||||||||||||
| March 9, 2016 | April 28, 2016 | April 12, 2016 | $ | 0.51 | $ | 216.5 | ||||||
| June 2, 2016 | July 15, 2016 | June 17, 2016 | 0.53 | 225.4 | ||||||||
| September 16, 2016 | October 17, 2016 | September 30, 2016 | 0.55 | 234.1 | ||||||||
| December 14, 2016 | January 13, 2017 | December 28, 2016 | 0.58 | 247.7 | ||||||||
| Series A Preferred Stock | ||||||||||||
| January 14, 2016 | February 16, 2016 | February 1, 2016 | $ | 1.3125 | $ | 7.9 | ||||||
| April 16, 2016 | May 16, 2016 | May 1, 2016 | 1.3125 | 7.9 | ||||||||
| July 22, 2016 | August 15, 2016 | August 1, 2016 | 1.3125 | 7.9 | ||||||||
| October 15, 2016 | November 15, 2016 | November 1, 2016 | 1.3125 | 7.9 | ||||||||
| Series B Preferred Stock | ||||||||||||
| January 14, 2016 | February 16, 2016 | February 1, 2016 | $ | 13.75 | $ | 18.9 | ||||||
| April 16, 2016 | May 16, 2016 | May 1, 2016 | 13.75 | 18.9 | ||||||||
| July 22, 2016 | August 15, 2016 | August 1, 2016 | 13.75 | 18.9 | ||||||||
| October 15, 2016 | November 15, 2016 | November 1, 2016 | 13.75 | 18.9 |
(1) For common stock, aggregate payment does not include amounts accrued for distributions payable related to unvested restricted stock units.
Performance Graph
This performance graph is furnished and shall not be deemed ‘‘filed’’ with the SEC or subject to Section 18 of the Exchange Act, nor shall it be deemed incorporated by reference in any of our filings under the Securities Act of 1933, as amended.
The following graph compares the cumulative total stockholder return on our common stock with the cumulative total return of the S&P 500 Index, the Dow Jones U.S. Telecommunications Equipment Index and the FTSE Nareit All Equity REITs Index. The performance graph assumes that on December 31, 2012, $100 was invested in each of our common stock, the S&P 500 Index, the Dow Jones U.S. Telecommunications Equipment Index and the FTSE Nareit All Equity REITs Index. The
cumulative return shown in the graph assumes reinvestment of all dividends. The performance of our common stock reflected below is not necessarily indicative of future performance.
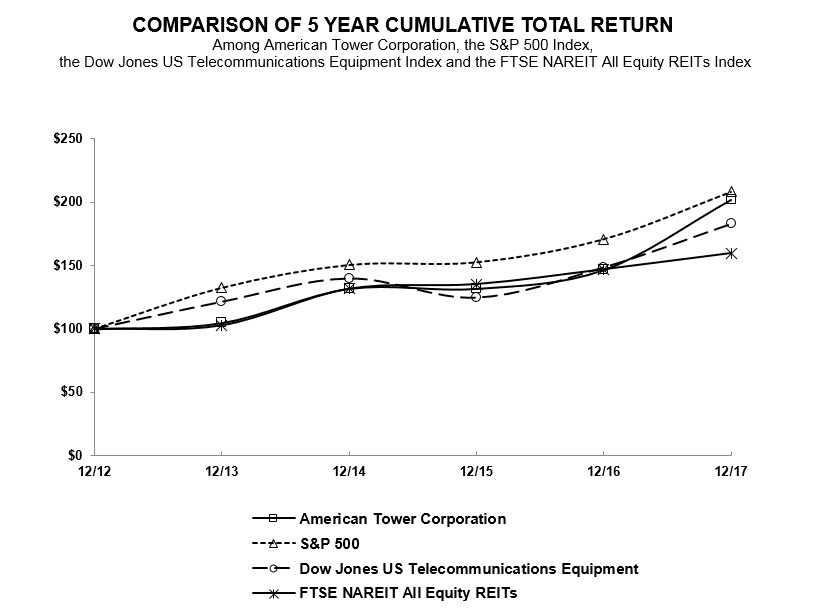
| Cumulative Total Returns | ||||||||||||||||||||||||
| 12/12 | 12/13 | 12/14 | 12/15 | 12/16 | 12/17 | |||||||||||||||||||
| American Tower Corporation | $ | 100.00 | $ | 104.79 | $ | 131.78 | $ | 131.78 | $ | 146.56 | $ | 201.79 | ||||||||||||
| S&P 500 Index | 100.00 | 132.39 | 150.51 | 152.59 | 170.84 | 208.14 | ||||||||||||||||||
| Dow Jones U.S. Telecommunications Equipment Index | 100.00 | 121.43 | 139.90 | 124.79 | 148.67 | 182.95 | ||||||||||||||||||
| FTSE Nareit All Equity REITs Index | 100.00 | 102.86 | 131.68 | 135.40 | 147.09 | 159.85 |
Issuer Purchases of Equity Securities
In March 2011, our Board of Directors approved a stock repurchase program, pursuant to which we are authorized to repurchase up to $1.5 billion of our common stock (the “2011 Buyback”). In addition to the 2011 Buyback, in December 2017, our Board of Directors approved an additional stock repurchase program, pursuant to which we are authorized to repurchase up to $2.0 billion of our common stock (the “2017 Buyback”).
During the three months ended December 31, 2017, we repurchased a total of 642,612 shares of our common stock for an aggregate of $89.4 million, including commissions and fees, pursuant to the 2011 Buyback. We had no repurchases under the 2017 Buyback. The table below sets forth details of our repurchases under the 2011 Buyback during the three months ended December 31, 2017.
| Period | Total Number of Shares Purchased (1) | Average Price Paid per Share (2) | Total Number of Shares Purchased as Part of Publicly Announced Plans or Programs | Approximate Dollar Value of Shares that May Yet be Purchased Under the Plans or Programs | ||||||||||
| (in millions) | ||||||||||||||
| October 1, 2017 - October 31, 2017 | 568,712 | $ | 138.67 | 568,712 | $ | 355.3 | ||||||||
| November 1, 2017 - November 30, 2017 | 73,900 | $ | 141.92 | 73,900 | $ | 344.8 | ||||||||
| December 1, 2017 - December 31, 2017 | — | $ | — | — | $ | 344.8 | ||||||||
| Total Fourth Quarter | 642,612 | $ | 139.04 | 642,612 | $ | 344.8 |
| (1) | Repurchases made pursuant to the 2011 Buyback. Under this program, our management is authorized to purchase shares from time to time through open market purchases or privately negotiated transactions at prevailing prices as permitted by securities laws and other legal requirements, and subject to market conditions and other factors. To facilitate repurchases, we make purchases pursuant to trading plans under Rule 10b5-1 of the Exchange Act, which allows us to repurchase shares during periods when we otherwise might be prevented from doing so under insider trading laws or because of self-imposed trading blackout periods. This program may be discontinued at any time. |
| (2) | Average price paid per share is a weighted average calculation using the aggregate price, excluding commissions and fees. |
We have repurchased a total of 12.4 million shares of our common stock under the 2011 Buyback for an aggregate of $1.2 billion, including commissions and fees. We expect to continue to manage the pacing of the remaining $344.8 million under the 2011 Buyback in response to general market conditions and other relevant factors. We expect to fund any further repurchases of our common stock through a combination of cash on hand, cash generated by operations and borrowings under our credit facilities. Purchases under the 2011 Buyback are subject to our having available cash to fund repurchases.
Previous: Item 4. MINE SAFETY DISCLOSURES · Next: Item 6. SELECTED FINANCIAL DATA