 filings.tools
A. O. Smith (AOS) 10-K risk factor changes: FY2015 vs FY2014
The 2015-12-31 10-K against the 2014-12-31 one, compared heading by heading and sentence by sentence. One of these filings carries no fiscal year tag, so its year is the calendar year of the period end.
Item 1A29 rewritten5 added11 removed121 unchanged
All filing items745 rewritten277 added308 removed1,346 unchanged
Summary
counted, not written
- Item 1A headings could not be compared: only 0 carried over between the two years, which usually means one filing was read wrongly, so none is reported as new or removed.
- Sentence by sentence, 277 added, 308 removed, 745 rewritten and 1,346 unchanged across 18 items that differ.
Sentences by item
21 items, with every count and a link to each item that changed
Underlined words on a shaded ground are new in FY2015; struck-through words were in FY2014. Sentences that are wholly new or wholly gone are labelled rather than marked.
Item 1A. RISK FACTORS
29 rewritten, 5 added, 11 removed, 121 unchanged
| _•_ | | _A portion of our business could be affected by a [removed: slowing] [added: slowdown in the transition of the] Chinese [removed: economy_] [added: economy to a consumer driven ecomony_] |
Our sales growth in China has averaged approximately [removed: 20] [added: 19] percent per year over the past three years and we anticipate sales growth of approximately [removed: two times the rate of China’s gross domestic product growth] [added: 15 percent] in [removed: 2015.][added: local currency in 2016.]
We continue to expand capacity [added: for water heating and water treatment products] in China to meet local demand.
If [removed: the growth rate of] [added: a slowdown in] the [removed: Chinese economy were] [added: transition] to [removed: experience] a [removed: significant slowdown] [added: more consumer driven economy] or [added: the rate] urbanization was to stall, it could adversely affect our financial condition, results of operations and cash flows.
Net sales to our five largest customers represented approximately [removed: 35] [added: 38] percent of our sales in [removed: 2014.][added: 2015.]
Our [removed: dependence on] [added: concentration of] sales to a relatively small number of customers makes our relationship with each of these customers important to our business.
Some of our customers may shift their purchases [removed: of products] to our competitors in the future.
| _•_ | | [removed: _Our Lochinvar-branded sales’] [added: _Sales] growth [added: of our Lochinvar-branded products] could stall resulting in lower than expected [removed: sales] [added: revenues] and earnings_ |
The compound annual growth rate of [removed: Lochinvar-branded] revenues [added: of our Lochinvar-branded products] has been [removed: over] [added: approximately] ten percent per year since our acquisition of Lochinvar, largely due to the transition in the boiler industry in the U.S. from lower efficiency, non-condensing boilers to higher efficiency, condensing boilers as well as new product introductions.
In 2003, approximately five percent of the boilers sold in the U.S. were condensing boilers and by 2013, the percentage had grown to approximately 40 [removed: percent and our Lochinvar brand is a leader in residential and commercial condensing boilers.][added: percent.]
[added: We expect the transition to continue, which we] believe would result in approximately ten percent [added: sales] growth in Lochinvar-branded [removed: sales] [added: products] in [removed: 2015] [added: 2016] and annually for the foreseeable future after [removed: 2015] [added: 2016] in conjunction with new product introductions.
The recovery in residential and commercial construction activity in North America remains fragile and construction could decline again after showing improvements in [removed: 2014.][added: 2015.]
We believe that the majority of the [removed: business] [added: market] we serve is for replacement of existing products and replacement related volume growth was strong in 2013 and [removed: 2014.][added: 2014 before declining in 2015.]
| _•_ | | _A failure in our implementation of a new enterprise resource planning [removed: system_] [added: system could disrupt our business_] |
We are in the [removed: process] [added: midst] of implementing a global enterprise resource planning system that is core to our efforts to redesign and deploy new processes and migrate to a common information system across our plants over a period of several years.
Approximately [removed: 38] [added: 40] percent of our net sales in [removed: 2014] [added: 2015] were attributable to products sold outside of the U.S., primarily in China and Canada and to a lesser extent in Europe and India.
Approximately [removed: 7,100] [added: 8,100] of our [removed: 12,400 total] [added: 13,400] employees as of December 31, [removed: 2014] [added: 2015] were located in China.
At December 31, [removed: 2014,] [added: 2015,] approximately [removed: $355] [added: $458] million of our cash and marketable securities balances were located in China.
Unfavorable changes in the political, regulatory, and business climate could have a material adverse effect on our financial condition, results of operations and cash flows or our ability to repatriate funds to the U.S. As of December 31, [removed: 2014,] [added: 2015,] approximately [removed: $542] [added: $645] million of cash, cash equivalents and marketable securities were held by our foreign subsidiaries.
| _•_ | | _Because we participate in markets that are highly competitive, our revenues [added: and earnings] could decline as we respond to competition_ |
Some of our competitors may have greater financial, marketing, manufacturing, research and development and distribution resources than we [removed: have.][added: have, and some are increasingly expanding beyond their existing manufacturing or geographic footprints.]
As a result, an increase in the value of the U.S. dollar relative to the local currencies of our foreign markets [removed: could] [added: has had and would continue to] have a negative effect on our profitability.
While we believe our products are currently efficient, safe and environment-friendly, a significant change to regulatory requirements, whether federal, foreign, state or local, or [removed: otherwise] to industry standards, could substantially increase manufacturing costs, impact the size and timing of demand for our products, or put us at a competitive disadvantage, any of which could harm our business and have a material adverse effect on our financial condition, results of operations and cash flow.
Due to the significant negative investment returns in [removed: 2008] [added: 2008, flat returns in 2015] and falling interest rates in recent years, the projected benefit obligations of our defined benefit pension plans exceeded the fair value of the plan assets by approximately [removed: $133] [added: $134] million at December 31, [removed: 2014.][added: 2015.]
We are forecasting that we will not be required to make a contribution to the plan in [removed: 2015,] [added: 2016,] and we do not plan to make any voluntary contributions.
[added: If future operating performance at our businesses] does not meet expectations, we may be required to reflect non-cash charges to operating results for goodwill or indefinite-lived intangible asset impairments.
See “Management’s Discussion and Analysis of Financial Condition and Results of Operations – Critical Accounting [removed: Policies – Goodwill] [added: Policies—Goodwill] and Indefinite-lived Intangible Assets” included in Item 7 of this Annual Report on Form 10-K.
As of December 31, [removed: 2014] [added: 2015,] these members of the Smith Family own approximately 61.0 percent of the total voting power of our outstanding shares of Class A Common Stock and Common Stock, taken together as a single class, and approximately 95.6 percent of the voting power of the outstanding shares of our Class A Common Stock, as a separate class.
The voting trust agreement provides [removed: that] [added: that,] in the event one of the parties to the voting trust agreement wants to withdraw from the trust or transfer any of its shares of our Class A Common Stock, such shares of our Class A Common Stock are automatically exchanged for shares of our Common Stock held by the trust to the extent available in the trust.
Our Lochinvar brand is a leader in residential and commercial condensing boilers.
We would incur a cost to repatriate these funds to the U.S. and have recorded a liability of approximately $48 million associated with the repatriation of a portion of those funds.
Consumer purchasing behavior may shift to distribution channels, including e-commerce, which is a rapidly developing area.
Development of a successful e-commerce strategy involves significant time, investment and resources.
The majority of our foreign currency transaction risk is a result of our Canadian water heater operations.
| --- | --- | --- |
| _•_ | | _An energy efficiency regulatory change, enacted as an amendment to the National Energy Conservation Act (NAECA III), will become effective on April 16, 2015 and could negatively impact our North American business_ |
NAECA III increases the energy efficiency standards for U.S. residential water heaters and impacts approximately 80 percent of our U.S. residential products.
Residential water heaters manufactured after April 15, 2015 must meet the new standards, however, our customers may continue to sell non-compliant water heaters after the NAECA III effective date.
As a result of the breadth of this new standard, the changeover to the new compliant products extensively impacts our engineering, manufacturing, logistics operations and procurement activities.
The new compliant products are more expensive to manufacture, and we have announced a price increase to our customers.
We may experience operating inefficiencies and one-time costs as a result of the changeover to NAECA III compliant products that could materially impact our financial position, results of operations and cash flows.
In addition we may not be able to recover all of our costs incurred in ensuring that our products are compliant with the NAECA III regulation due to uncertainty over pricing actions.
We expect the transition to continue, which we
We would incur a cost to repatriate these funds to the U.S.
If future operating performance at our businesses
Item 7. MANAGEMENT’S DISCUSSION AND ANALYSIS OF FINANCIAL CONDITION AND RESULTS OF OPERATIONS
84 rewritten, 62 added, 137 removed, 111 unchanged
[removed: Our] [added: Primarily for Asia, our] Rest of World segment also manufactures and markets water treatment [removed: products, primarily for Asia.][added: products.]
In [removed: 2014] [added: 2015,] our North America segment sales were [removed: $1,621.7] [added: $1,703.0] million and our Rest of World segment sales were [removed: $768.3] [added: $866.1] million.
Sales of our products in China grew significantly in [added: 2015, increasing 13.7 percent over] 2014.
We expect sales in [removed: 2015] [added: 2016] in China to grow at [removed: the] [added: a] rate of approximately [removed: two times the rate of China’s gross domestic product (GDP) growth,] [added: 15 percent in local currency,] as we believe overall water heater market growth, geographic expansion, market share gains, growth in water treatment [added: products] and [added: air purification products and] improved product mix will contribute to our growth.
Lochinvar-branded products contributed [removed: $275] [added: $296.0] million to our net sales in [removed: 2014,] [added: 2015,] and we expect ten percent sales growth of Lochinvar-branded products in [removed: 2015,] [added: 2016,] driven by [removed: sales of] [added: the U.S. industry transition to] higher efficiency products and [removed: the] [added: our] introduction of new [removed: products] [added: products;] particularly condensing boilers.
Approximately 40 percent of Lochinvar-branded [added: product] sales consist of residential and commercial water heaters while the remaining 60 percent of Lochinvar-branded [added: product] sales consist primarily of boilers and related parts.
We will also continue to look for opportunities to add to our existing operations in the high growth regions of China and [removed: India.][added: India demonstrated by our introduction of air purification products in China in 2015.]
In 2013, approximately 40 percent of boilers sold in the U.S. were condensing boilers, compared with five percent [removed: ten years ago.][added: in 2003.]
Our sales in 2014 were [removed: a record $2,356.0 million surpassing] [added: higher than] 2013 sales of $2,153.8 million by 9.4 percent.
The increase in [added: 2014 in] sales was [removed: due] [added: attributable] to higher volumes of water heaters and boilers in the [removed: U.S as well as an 18.4 percent increase in] [added: U.S. and higher] sales [removed: to $694.0 million] of water heaters and water treatment products in China.
Our gross profit margin in [removed: 2014] [added: 2015] increased to [removed: 36.5] [added: 39.8] percent from [removed: 35.9] [added: 36.5] percent in [removed: 2013.][added: 2014.]
[removed: The impact of] [added: Our gross profit margin in 2014] increased [removed: sales] [added: slightly from 35.9 percent in 2013, primarily due to higher] volumes of water heaters and boilers in the U.S., partially offset by higher material costs in the U.S., as well as higher volumes of water heaters and water treatment products in [removed: China contributed to higher gross profit margins in 2014.][added: the China.]
[removed: The higher gross profit margin] [added: Higher operating earnings and margins] in [added: 2014 as compared to] 2013 [removed: was primarily] [added: were] due to [removed: the contribution from increased sales volumes of water heaters and boilers in the U.S., lower material costs in the U.S., and] higher sales of water heaters and water treatment products in China as well as [added: a] higher priced product mix as a result of product introductions with higher value features [added: which was partially offset by larger losses] in [removed: China.][added: India.]
Selling, general and administrative (SG&A) expenses were [removed: $47.6] [added: $38.6] million higher in [removed: 2014] [added: 2015] than in [removed: 2013.][added: 2014.]
[removed: The increase] [added: lower pension costs] in [added: the U.S.] SG&A expenses [added: were $47.6 million higher] in 2014 [removed: to $572.1 million was] [added: than in 2013] primarily due to higher selling and advertising costs in support of increased volumes in North America and China and approximately $9 million of incremental [removed: planned] enterprise resource planning system (ERP) implementation costs.
Pension expense in [removed: 2014] [added: 2015] was [removed: $28.6] [added: $0.1] million compared to [removed: $27.9] [added: $28.6] million in [removed: 2013] [added: 2014] and [removed: $13.8] [added: $27.9] million in [removed: 2012.][added: 2013.]
Interest expense in [removed: 2012] [added: 2013] was [removed: $9.2] [added: also $5.7] million.
Other income was [removed: $5.2] [added: $10.8] million in [removed: 2014] [added: 2015] compared to [added: $5.2 million in 2014 and] $3.8 million in 2013.
The [removed: increase] [added: increases] in other income in [added: 2015 and] 2014 [removed: is] [added: were] primarily due to higher interest [removed: income.][added: income compared to the preceding year.]
Our effective tax rate was [removed: 27.5] [added: 29.7] percent in [removed: 2014,] [added: 2015,] compared with [removed: 28.2] [added: 27.5] percent in [removed: 2013] [added: 2014] and [removed: 30.4] [added: 28.2] percent in [removed: 2012.][added: 2013.]
[removed: Our North America segment sales were $1,621.7 million] [added: Sales] in 2014 [removed: or] [added: were] $101.7 million higher than sales of $1,520.0 million in 2013.
The sales increase in 2014 [removed: benefitted from] [added: was primarily due to] higher volumes of water heaters and boilers in the [removed: U.S.] [added: U.S.,] which were partially offset by lower water [removed: heater] [added: heaters] sales in Canada, primarily due to a decline in the value of the Canadian dollar of approximately seven percent versus the U.S. dollar.
North America operating earnings were [removed: $238.7] [added: $339.9] million in [removed: 2014 as] [added: 2015] compared to operating earnings of [removed: $211.9] [added: $238.7] million and [removed: $199.8] [added: $211.9] million in [removed: 2013] [added: 2014] and [removed: 2012,] [added: 2013,] respectively.
[removed: Adjusted segment] [added: Rest of World] operating earnings were [removed: $253.4] [added: $113.0] million in [removed: 2014 as] [added: 2015] compared to [removed: adjusted segment] operating earnings of [removed: $237.7] [added: $106.7] million and [removed: $197.0] [added: $88.0] million in [removed: 2013] [added: 2014] and [removed: 2012,] [added: 2013,] respectively.
[removed: Higher] [added: The significantly higher] operating earnings and [removed: adjusted] operating [added: margin in 2015 were primarily due to higher prices in the U.S. and Canada, higher sales of Lochinvar-branded products and commercial water heaters in the U.S., lower steel costs and lower pension costs which more than offset lower residential water heater volumes in the U.S. Higher operating] earnings in 2014 [added: compared to 2013] were primarily due to higher volumes in the U.S. which were partially offset by higher material costs and approximately $9 million of incremental [removed: planned] ERP implementation costs.
Operating margins were [added: 20.0 percent,] 14.7 percent [removed: in 2014] and 13.9 percent in [removed: 2013.][added: 2015, 2014 and 2013, respectively.]
Sales for our Rest of World segment in 2014 were [removed: $768.3 million or] $100.3 million higher than sales of $668.0 million in 2013 due to an 18.4 percent increase in sales in China, driven by increased demand for water heaters and water treatment products and [added: a] higher priced product mix that was partially offset by lower sales in India resulting from weakness in the housing market and the termination of a co-branding relationship with our largest distributor.
Segment operating margins were [removed: 13.9] [added: 13.0] percent in [removed: 2014] [added: 2015] as compared to [removed: 13.2] [added: 13.9] percent and [removed: 11.0] [added: 13.2] percent in [removed: 2013] [added: 2014] and [removed: 2012,] [added: 2013,] respectively.
Losses in India were $7.5 million in 2014, including approximately $1 million of product development and advertising expenses [removed: related to] [added: in advance of] our [removed: planned] 2015 launch of water treatment products.
Our working capital was [removed: $713.8] [added: $802.1] million at December 31, [removed: 2014] [added: 2015] compared with [removed: $614.7] [added: $713.8] million and [removed: $608.3] [added: $614.7] million at December 31, [removed: 2013] [added: 2014] and December 31, [removed: 2012] [added: 2013,] respectively.
Cash generated [removed: by our business] in China and sales-related increases in accounts receivable and inventory levels explain the majority of the increase in [added: both 2015 and] 2014.
As of December 31, [removed: 2014,] [added: 2015, essentially] all of the [removed: $541.9] [added: $645.2] million of cash, cash equivalents and marketable securities [removed: was] [added: were] held by our foreign subsidiaries.
We would incur a cost to repatriate these funds to the U.S. and have an accrual of [removed: $50.7] [added: $47.9] million for the repatriation of a portion of these funds.
[removed: Operating cash] [added: Cash] provided by [removed: continuing operations] [added: operating activities] during [removed: 2014] [added: 2015] was [removed: $265.7] [added: $344.4] million compared with [removed: $282.2] [added: $263.9] million during [removed: 2013] [added: 2014] and [removed: $171.8] [added: $279.6] million during [removed: 2012.][added: 2013.]
The improvement in cash flows in [removed: 2013] [added: 2015] was primarily due to higher earnings from operations and lower outlays for working [removed: capital.][added: capital driven primarily by increases in accounts payable balances in China.]
We expect cash provided by operating activities in [removed: 2015] [added: 2016] to be [removed: between $270 and $280] [added: approximately $320] million.
Our capital expenditures were [removed: $86.1] [added: $72.7] million in [removed: 2014, $97.7] [added: 2015, $86.1] million in [removed: 2013] [added: 2014] and [removed: $69.9] [added: $97.7] million in [removed: 2012.][added: 2013.]
Included in 2014 capital expenditures was approximately [removed: $32] [added: $31] million related to our ERP implementation.
[removed: Approximately $19 million of expenditures] [added: Also included] in 2013 [added: capital expenditures was approximately $19 million] related to the [removed: implementation of our new] ERP [removed: system.][added: implementation.]
We [removed: are projecting 2015] [added: project 2016] capital expenditures [removed: of] [added: will be] between [removed: $100] [added: $120] and [removed: $110] [added: $130] million and [removed: 2015] depreciation and amortization [removed: of] [added: expense in 2016 will be] approximately [removed: $66] [added: $70] million.
We also market in-home air purification products in China.
Excluding the impact from the strengthening U.S. dollar, sales in China increased 16.1 percent in 2015.
Price increases for residential and commercial water heaters and higher volumes of commercial water heaters and condensing commercial boilers contributed to 2015 sales increases in our North America segment.
Partially offsetting these factors was a decline in residential water heater volumes in the U.S. The 13 percent decline in the value of the Canadian dollar against the U.S. dollar during 2015 also negatively impacted sales.
We expect North America residential and commercial water heater industry unit to show modest growth in 2016.
Our sales in 2015 were a record $2,536.5 million surpassing 2014 sales of $2,356.0 million by 7.7 percent.
Excluding the impact from the strengthening U.S. dollar against the Canadian and Chinese currencies, our sales grew over nine percent in 2015.
The increase in sales was due to higher prices in North America, higher sales of Lochinvar-branded products and commercial water heaters in the U.S., as well as continued demand for our water heating and water treatment products in China.
Sales in China grew 13.7 percent in 2015.
Excluding the impact from the stronger U.S. dollar, China sales increased 16.1 percent in 2015.
Sales of water heaters and water treatment products in China grew 18.4 percent to $694.0 million in 2014 compared to 2013.
The higher margin in 2015 was due to price increases in the U.S. and Canada, higher U.S. sales of commercial boilers and commercial water heaters which have higher margins, lower steel costs and a reduction in pension-related costs.
The increase in SG&A expenses in 2015 to $610.7 million was primarily due to higher selling and engineering costs in support of increased volumes in China as well as higher costs associated with the 2015 launch of air purification products in China which more than offset
The significant decrease in pension expense in 2015 compared to prior years was due to the sunset of our pension plan for the majority of our employees on December 31, 2014.
In 2015, we began making additional Company contributions to a defined contribution plan in lieu of benefits earned in our pension plan.
Interest expense was $7.4 million in 2015 compared to $5.7 million in 2014.
The higher interest expense in 2015 was primarily related to interest rates on term notes in the amount of $75 million issued in January 2015 that were higher than the interest rate on the revolving credit facility that it replaced as well as higher overall debt levels related to share repurchases.
The higher effective tax rate in 2015 was primarily due to a change in geographic earnings mix as compared to the prior year.
Our North America segment sales were $1,703.0 million in 2015 or $81.3 million higher than sales of $1,621.7 million in 2014.
The sales increase in 2015 resulted from higher prices in the U.S. and Canada and higher volumes of commercial water heaters and condensing commercial boilers in the U.S., partially offset by lower residential volumes in the U.S. and an unfavorable currency impact in Canada.
Sales in our Rest of World segment in 2015 were $866.1 million or $97.8 million higher than sales of $768.3 million in 2014.
Sales in China increased approximately $95 million due to higher demand for water heaters, approximately $35 million of incremental sales of water treatment products and approximately $9 million in sales of our newly launched in-home air purification products.
Sales in China grew 13.7 percent in 2015.
Excluding the impact from the stronger U.S. dollar, China sales increased 16.1 percent in 2015.
Higher operating earnings in 2015 were primarily due to higher sales in China and lower steel costs that were partially offset by lower sales of highly profitable commercial water heaters in China, increased SG&A expenses and approximately $1.5 million of higher losses in India as compared to 2014.
China earnings were reduced by approximately $2.5 million due to currency translation.
Higher selling and engineering costs in China as well as higher
SG&A costs associated with the 2015 launch of air purification products were the primary drivers for the decreased operating margin in 2015 as compared to 2014.
We expect capital spending in 2016 to include approximately $8 million related to our ERP implementation and approximately $40 million related to the initial phase of a new water treatment manufacturing facility in China as we will outgrow capacity in a leased facility in the next few years.
In January 2015, we issued $75 million of fixed rate term notes to an insurance company.
Principal payments commence in 2020 and the notes mature in 2030.
The notes have an interest rate of 3.52 percent.
We used proceeds of the notes to pay down borrowings under our revolving credit facility.
At December 31,
| Long-term debt | | $ | 249.0 | | | $ | 12.9 | | | $ | 161.1 | | | $ | 6.8 | | | $ | 68.2 | |
| Fixed rate interest | | | 25.6 | | | | 3.8 | | | | 6.0 | | | | 5.0 | | | | 10.8 | |
| Operating leases | | | 39.5 | | | | 19.7 | | | | 8.1 | | | | 4.5 | | | | 7.2 | |
| Purchase obligations | | | 98.0 | | | | 97.2 | | | | 0.8 | | | | — | | | | — | |
| Pension and post-retirement obligations | | | 72.1 | | | | 2.2 | | | | 8.7 | | | | 8.1 | | | | 53.1 | |
| Total | | $ | 484.2 | | | $ | 135.8 | | | $ | 184.7 | | | $ | 24.4 | | | $ | 139.3 | |
On August 22, 2011, we sold our electrical products business (EPC) to Regal Beloit Corporation (RBC) for approximately $760 million in cash and approximately 2.83 million shares of RBC common stock valued at $140.6 million as of that date.
Due to the sale, EPC has been reflected as a discontinued operation in the accompanying financial statements for all periods presented.
The residential replacement market contributed significantly to 2014 sales in our North America segment.
Our 2014 North America residential unit sales grew mid-single digits compared to the prior year and commercial sales showed similar unit growth.
We expect both North America residential and commercial water heater industry unit growth to be flat or show modest growth in 2015, due to growth the industry experienced in 2014 in excess of the growth rate of the U.S. GDP and the 2014 fourth quarter pre-buy we believe occurred in advance of a regulatory change requiring increased energy efficiency from residential water heaters.
Our sales in 2013 were higher than 2012 sales of $1,939.3 million by 11.1 percent.
The 2013 increase in sales was attributable to higher sales in China and higher volumes of residential and commercial water heaters and boilers in the U.S. Sales of water heaters and water treatment products in China grew 25.3 percent to $586.3 million in 2013 as compared to 2012.
Our gross profit margin in 2013 increased 2.3 percent from 33.6 percent in 2012.
SG&A expenses were $74.0 million higher in 2013 than in 2012 primarily due to higher selling and advertising expenses in support of increased volumes in North America and China and higher pension expenses in North America.
##### [Table of Contents](#toc)
These activities are reflected in the “Restructuring, impairment and settlement expenses (income) net” line in the accompanying financial statements.
Operating earnings in 2012 included a pre-tax gain of $3.9 million associated with a legal settlement with a component supplier for our Canadian operations.
These gains are also reflected in the “Restructuring, impairment and settlement expenses (income) net” line in the accompanying financial statements.
Also included in 2012 operating earnings is a $3.3 million favorable adjustment related to the finalization of an earn-out obligation from our acquisition of Lochinvar.
The earn-out adjustment is reflected as “Contingent consideration adjustment” in the accompanying financial statements.
The increases in pension expense in 2014 and 2013 were primarily due to increases in the amortization of unrecognized net actuarial losses in these years in addition to decreases in the expected rate of return on plan assets.
Interest expense was $5.7 million in 2014, unchanged from 2013.
The higher interest expense in 2012 was due to higher debt levels as a result of the Lochinvar acquisition in 2011.
In addition, in 2011 we sold EPC to RBC and received 2.83 million shares of RBC common stock.
During 2012 we sold all of our shares of RBC common stock, the net proceeds of which were used to pay down debt in 2012.
Other income of $34.3 million in 2012 was primarily comprised of $27.2 million of pre-tax gains on the sale of the shares of RBC common stock received in the sale of EPC, net of the impact of the RBC share collar described below with most of the remainder of 2012 net other income resulting from interest income on investments resulting from the sale of EPC.
We received the RBC common stock in August 2011 under an agreement that we executed in December 2010.
The RBC share price appreciated in 2011 during which we entered into an equity collar contract for 50 percent of the shares that we expected to receive to protect a portion of the appreciation.
The collar did not qualify for hedge accounting and therefore was adjusted to fair value through earnings from continuing operations.
The rate decline from 2012 to 2013 is primarily due to increased profits in jurisdictions with lower enacted income tax rates than the U.S., principally China.
Our 2012 net earnings include discontinued operations after-tax losses of $3.9 million, or $.04 per diluted share, related to the sale of EPC which occurred in 2011.
Included in discontinued operations in 2012 was $6.4 million of expense representing the correction of an error primarily due to our calculation of taxes due upon repatriation of undistributed foreign earnings.
Sales in 2013 were $89.2 million higher than sales of $1,430.8 million in 2012.
The sales increase in 2013 was primarily due to higher sales of residential and commercial water heaters and boilers in the U.S.
Adjusted segment operating margins were 15.6 percent in both 2014 and 2013.
In 2012, operating margins were 14.0 percent and adjusted operating margins were 13.8 percent.
Higher adjusted segment operating margins in 2013 as compared to 2012 were primarily due to higher incremental margins associated with increased volumes of water heaters and boilers in the U.S. as well as lower material costs.
Adjusted segment operating earnings in 2014 exclude $14.7 million of pre-tax non-operating pension costs.
Adjusted segment operating earnings in 2013 exclude $22.0 million of pre-tax restructuring and impairment charges associated with the transfer of production from Fergus, Ontario, an $11.0 million pre-tax gain on the settlement with a former supplier and $14.8 million of pre-tax non-operating pension costs.
Adjusted segment operating earnings in 2012 exclude a pre-tax gain of $3.9 million associated with a legal settlement with a component supplier for our Canadian operations, a $3.3 million favorable adjustment to our estimate of the Lochinvar earn-out obligation and $4.4 million of pre-tax non-operating pension costs.
In order to provide improved transparency into the operating results of our business, we are providing non-GAAP measures (adjusted earnings, adjusted earnings per share, adjusted segment operating earnings and adjusted segment operating margins) that exclude certain items as well as non-operating pension costs consisting of interest cost, expected return on plan assets, amortization of actuarial gains (losses) and curtailments.
Prior year results are provided on a comparable basis.
Reconciliations to measures on a GAAP basis are provided later in this section.
We do not plan to provide non-GAAP measures in 2015.
Sales for our Rest of World segment in 2013 were $125.5 million higher than sales of $542.5 million in 2012 due to increased demand for water heaters and water treatment products in China and market acceptance of our newer, higher value A. O. Smith branded products in China.
An excerpt. Shown here: 40 of 84 rewritten, 40 of 62 added and 40 of 137 removed. The counts are complete. For every sentence, read Item 7. MANAGEMENT’S DISCUSSION AND ANALYSIS OF FINANCIAL CONDITION AND RESULTS OF OPERATIONS in the FY2015 filing and the FY2014 filing.
Item 1. BUSINESS
33 rewritten, 7 added, 5 removed, 65 unchanged
Both segments manufacture and market comprehensive lines of residential [added: and commercial] gas, gas tankless and electric water heaters.
Both segments primarily [removed: serve] [added: manufacture and market in] their respective regions of the world.
Our North America segment also manufactures and [added: globally] markets specialty commercial water heating equipment, condensing and non-condensing boilers and water systems tanks.
[removed: Our] [added: Primarily for Asia, our] Rest of World segment also manufactures and markets water treatment [removed: products, primarily for Asia.][added: products.]
Due to the sale, EPC has been reflected as a discontinued operation in the accompanying financial [removed: statements] [added: information] for all periods presented.
| | | [removed: 2014] [added: 2015] | | | | [removed: 2013] [added: 2014] | | | | [removed: 2012] [added: 2013] | | | | [removed: 2011] [added: 2012] | | | | [removed: 2010] [added: 2011] | | |
| North America | | $ | [removed: 1,621.7] [added: 1,703.0] | | | $ | [removed: 1,520.0] [added: 1,621.7] | | | $ | [removed: 1,430.8] [added: 1,520.0] | | | $ | [removed: 1,289.5] [added: 1,430.8] | | | $ | [removed: 1,155.4] [added: 1,289.5] | |
| Rest of World | | | [removed: 768.3] [added: 866.1] | | | | [removed: 668.0] [added: 768.3] | | | | [removed: 542.5] [added: 668.0] | | | | [removed: 455.6] [added: 542.5] | | | | [removed: 368.9] [added: 455.6] | |
| Inter-segment | | | [removed: (34.0] [added: (32.6] | ) | | | [removed: (34.2] [added: (34.0] | ) | | | [removed: (34.0] [added: (34.2] | ) | | | [removed: (34.6] [added: (34.0] | ) | | | [removed: (35.0] [added: (34.6] | ) |
| Total Sales | | $ | [removed: 2,356.0] [added: 2,536.5] | | | $ | [removed: 2,153.8] [added: 2,356.0] | | | $ | [removed: 1,939.3] [added: 2,153.8] | | | $ | [removed: 1,710.5] [added: 1,939.3] | | | $ | [removed: 1,489.3] [added: 1,710.5] | |
Sales in our North America segment increased [removed: 6.7] [added: 5.0] percent or [removed: $101.7] [added: $81.3] million in [removed: 2014] [added: 2015] compared with the prior year.
The sales increase in [removed: 2014 benefitted from] [added: 2015 was the result of price increases in the U.S. and Canada for residential and commercial water heaters and] higher volumes of [added: commercial] water heaters and [added: condensing commercial] boilers in the [removed: U.S., which were partially offset by] [added: U.S. Lower volumes of U.S. residential water heaters and] lower water heater sales in Canada, primarily due to a decline in the value of the Canadian dollar of approximately [removed: seven] [added: thirteen] percent versus the U.S. [removed: dollar.][added: dollar, partially offset these favorable factors.]
Our North American residential water heater sales in [removed: 2014] [added: 2015] were approximately [removed: $1] [added: $1.1] billion or 62 percent of North America sales.
Typical applications for our water heaters include residences, restaurants, hotels and motels, [added: office buildings,] laundries, car washes and small businesses.
[removed: In the commercial market, we believe our comprehensive product line including boilers] and our high-efficiency products give us a competitive advantage in this portion of the water heating industry.
Our wholesale distribution channel includes more than 1,200 independent wholesale plumbing distributors with more than 4,400 selling [added: locations serving residential and commercial end markets.]
Our Lochinvar brand is one of the leading brands of residential and commercial boilers in the [removed: United States (U.S.).][added: U.S.]
Our energy efficient product offerings continue to be a sales driver [removed: of] [added: for] our business.
We compete in each of our targeted market segments based on product design, [added: reliability,] quality of products and services, [removed: performance] [added: advanced technologies, product performance, maintenance costs] and price.
Our principal water heating and boiler competitors in North America include Rheem, Bradford White, [removed: Rinnai] [added: Rinnai, Aerco] and [removed: Aerco.][added: Navien.]
Sales in our Rest of World segment increased [removed: 15.0] [added: 12.7] percent, or [removed: $100.3] [added: $97.8] million, in [removed: 2014] [added: 2015] compared with the prior year.
[removed: An 18.4] [added: A 13.7] percent increase in sales in China to [removed: $694.0] [added: $789.2] million was the primary source of the increase.
We have operated in China for [removed: almost] 20 years.
[removed: We] [added: Primarily for Asia, we] also manufacture and market water treatment [removed: products primarily for the residential market.][added: products.]
We sell water heaters in more than [removed: 7,000] [added: 8,000] retail outlets in China, of which over [removed: 1,600] [added: 2,000] exclusively sell our products.
[removed: In addition, our] [added: Our] water treatment products [added: and air purification products] are sold in [removed: 4,500] [added: over 5,500 and 1,200] retail outlets in [removed: China.][added: China, respectively.]
[removed: Online] [added: Our online] sales continue to grow in China and in [removed: 2014 exceeded $50] [added: 2015 reached $140] million.
Our primary competitor in China is Haier Appliances, a Chinese company, but we also compete with Midea in the electric water heater [removed: market] and [added: water treatment markets and] Rinnai and Noritz in the gas tankless and solar water heater markets.
In addition, we sell water heaters [removed: to] [added: in] the European and Middle Eastern markets and water treatment products in Turkey, all of which [added: combined] comprised [removed: approximately] [added: less than] seven percent of total Rest of World sales in [removed: 2014.][added: 2015.]
To improve [added: our] competitiveness by generating new products and processes, we conduct research and development at our Corporate Technology Center in Milwaukee, Wisconsin, at our Global Engineering Center in Nanjing, China, and at our operating locations.
[removed: Total] [added: Our total] expenditures for research and development in [removed: 2014, 2013] [added: 2015, 2014] and [removed: 2012] [added: 2013] were [removed: $67.9] [added: $73.7] million, [removed: $57.8] [added: $67.9] million and [removed: $51.7] [added: $57.8] million, respectively.
[removed: Our operations] [added: We] employed approximately [removed: 12,400] [added: 13,400] employees as of December 31, [removed: 2014,] [added: 2015,] primarily non-union.
Due to the short-cycle nature of our businesses, none of our operations [removed: sustain] [added: sustains] significant backlogs.
We also market in-home air purification products in China.
In the commercial market, we believe our comprehensive product line including boilers
Excluding the impact from the stronger U.S. dollar, China sales increased 16.1 percent in 2015.
We also market air purification products primarily for the residential market in China.
Our sales in India were $15.9 million in 2015 compared with $15.1 million in 2014.
In India, we compete in the water heater and water treatment markets.
We compete with Bajaj and MTS-Racold in the water heater market and Eureka Forbes and Kent in the water treatment market.
For further information about EPC, see Note 2 to the Consolidated Financial Statements.
locations serving residential and commercial end markets.
We acquired Lochinvar in 2011 for approximately $435 million including an earn-out provision that resulted in a payment of $13.5 million in December 2012.
Our sales in India were $15.1 million in 2014, lower than in 2013 resulting from the weakness in the housing market and the termination of a co-branding relationship with our largest distributor.
In India, we compete with Bajaj, MTS-Racold, Venus, Haier, Havells and numerous other companies.
Item 3. LEGAL PROCEEDINGS
1 rewritten, 0 added, 0 removed, 2 unchanged
A more detailed discussion of certain of these matters [removed: appear] [added: appears] in Note [removed: 15] [added: 14] of Notes to Consolidated Financial Statements.
Cover and table of contents
32 rewritten, 23 added, 3 removed, 56 unchanged
For the fiscal year ended December 31, [removed: 2014][added: 2015]
| (State of Incorporation) | | (I.R.S. [removed: Employer Identification] [added: Employer Identification] No.) |
| Title of Each Class | | Shares of Stock Outstanding February 10, [removed: 2015] [added: 2016] | | Name of Each Exchange on Which Registered |
| Class A Common Stock (par value $5.00 per share) | | [removed: 13,154,884] [added: 13,121,508] | | Not listed |
| Common Stock (par value $1.00 per share) | | [removed: 76,210,645] [added: 74,677,900] | | New York Stock Exchange |
The aggregate market value of voting stock held by non-affiliates of the registrant was [removed: $32,788,741] [added: $41,422,906] for Class A Common Stock and [removed: $3,975,224,843] [added: $5,322,129,940] for Common Stock as of June 30, [removed: 2014.][added: 2015.]
| [added: |] 1. | Portions of the company’s definitive Proxy Statement for the [removed: 2015] [added: 2016] Annual Meeting of Stockholders (to be filed with the Securities and Exchange Commission under Regulation 14A within 120 days after the end of the registrant’s fiscal year and, upon such filing, to be incorporated by reference in Part III). |
Year Ended December 31, [removed: 2014][added: 2015]
| [removed: [Part I](#tx838160_1)] [added: Part I] | | | | | | |
| Item 1. | | [removed: [Business](#tx838160_2)] [added: [Business](#tx104769_1)] | | | 3 | |
| Item 1A. | | [Risk [removed: Factors](#tx838160_3)] [added: Factors](#tx104769_2)] | | | 6 | |
| Item 1B. | | [Unresolved Staff [removed: Comments](#tx838160_4)] [added: Comments](#tx104769_3)] | | | 11 | |
| Item 2. | | [removed: [Properties](#tx838160_5)] [added: [Properties](#tx104769_4)] | | | 11 | |
| Item 3. | | [Legal [removed: Proceedings](#tx838160_6)] [added: Proceedings](#tx104769_5)] | | | 11 | |
| Item 4. | | [Mine Safety [removed: Disclosures](#tx838160_7)] [added: Disclosures](#tx104769_6)] | | | 11 | |
| [removed: [Part II](#tx838160_8)] [added: Part II] | | | | | | |
| Item 5. | | [Market for Registrant’s Common Equity, Related Stockholder Matters and Issuer Purchases of Equity [removed: Securities](#tx838160_9)] [added: Securities](#tx104769_7)] | | | 15 | |
| Item 6. | | [Selected Financial [removed: Data](#tx838160_10)] [added: Data](#tx104769_8)] | | | 17 | |
| Item 7. | | [Management’s Discussion and Analysis of Financial Condition and Results of [removed: Operations](#tx838160_11)] [added: Operations](#tx104769_9)] | | | 18 | |
| Item 7A. | | [Quantitative and Qualitative Disclosures About Market [removed: Risk](#tx838160_12)] [added: Risk](#tx104769_10)] | | | [removed: 27] [added: 24] | |
| Item 8. | | [Financial Statements and Supplementary [removed: Data](#tx838160_13)] [added: Data](#tx104769_11)] | | | [removed: 28] [added: 25] | |
| Item 9. | | [Changes in and Disagreements with Accountants on Accounting and Financial [removed: Disclosure](#tx838160_14)] [added: Disclosure](#tx104769_12)] | | | [removed: 57] [added: 53] | |
| Item 9A. | | [Controls and [removed: Procedures](#tx838160_15)] [added: Procedures](#tx104769_13)] | | | [removed: 57] [added: 53] | |
| Item 9B. | | [Other [removed: Information](#tx838160_16)] [added: Information](#tx104769_14)] | | | [removed: 58] [added: 54] | |
| [removed: [Part III](#tx838160_17)] [added: Part III] | | | | | | |
| Item 10. | | [Directors, Executive Officers and Corporate [removed: Governance](#tx838160_18)] [added: Governance](#tx104769_15)] | | | [removed: 60] [added: 56] | |
| Item 11. | | [Executive [removed: Compensation](#tx838160_19)] [added: Compensation](#tx104769_16)] | | | [removed: 60] [added: 56] | |
| Item 12. | | [Security Ownership of Certain Beneficial Owners and Management and Related Stockholder [removed: Matters](#tx838160_20)] [added: Matters](#tx104769_17)] | | | [removed: 60] [added: 56] | |
| Item 13. | | [Certain Relationships and Related Transactions and Director [removed: Independence](#tx838160_21)] [added: Independence](#tx104769_18)] | | | [removed: 61] [added: 57] | |
| Item 14. | | [Principal Accounting Fees and [removed: Services](#tx838160_22)] [added: Services](#tx104769_19)] | | | [removed: 61] [added: 57] | |
| [removed: [Part IV](#tx838160_23)] [added: Part IV] | | | | | | |
| Item 15. | | [Exhibits, Financial Statement [removed: Schedules](#tx838160_24)] [added: Schedules](#tx104769_20)] | | | [removed: 62] [added: 58] | |
10-K 1 d104769d10k.htm FORM 10-K
| --- | --- | --- |
| --- | --- | --- |
| | | | | | | |
| | | | | | | |
| | | | | | | |
| | | | | | | |
| | | | | | | |
| | | | | | | |
| | | | | | | |
| | | | | | | |
| | | | | | | |
| | | | | | | |
| | | | | | | |
| | | | | | | |
| | | | | | | |
| | | | | | | |
| | | | | | | |
| | | | | | | |
| | | | | | | |
| | | | | | | |
| | | | | | | |
| | | | | | | |
10-K 1 d838160d10k.htm 10-K
| --- | --- |
| | | | | |
Item 2. PROPERTIES
5 rewritten, 0 added, 0 removed, 7 unchanged
Properties utilized by us at December 31, [removed: 2014] [added: 2015] were as follows:
The terms of leases in effect at December 31, [removed: 2014 expire in] 2015 [added: expire between 2016] and [removed: 2016.][added: 2025.]
In this segment we have [removed: seven] [added: six] manufacturing plants located in four non-U.S. countries, of which three are owned directly by us or our subsidiaries and [removed: four] [added: three] are leased from outside parties.
Initial lease terms generally provide for minimum terms of one to [removed: 20] [added: six] years and have one or more renewal options.
The terms of leases in effect at December 31, [removed: 2014] [added: 2015] expire between [removed: 2015] [added: 2016] and [removed: 2027.][added: 2020.]
Item 4. MINE SAFETY DISCLOSURES
13 rewritten, 9 added, 3 removed, 105 unchanged
Pursuant to General Instruction of G(3) of Form 10-K, the following is a list of the executive officers which is included as an unnumbered Item in Part I of this report in lieu of being included in our Proxy Statement for our [removed: 2015] [added: 2016] Annual Meeting of Stockholders.
| Randall S. Bednar [removed: (62)] [added: (63)] | | Senior Vice President – Chief Information Officer | | 2007 to Present |
| [removed: Wilfridus M. Brouwer (56)] [added: Wei Ding (53)] | | Senior Vice President | | 2013 to Present |
| [removed: Wei Ding (52)] [added: Kevin J. Wheeler (56)] | | Senior Vice President | | 2013 to Present |
| | | President – [removed: A.O.] [added: A. O.] Smith (China) Investment Co., Ltd.; General Manager – [removed: A.O.] [added: A. O.] Smith (China) Water Heater Co., Ltd. and [removed: A.O.] [added: A. O.] Smith (Shanghai) Water Treatment Products Co. Ltd. | | 2013 to Present |
| Robert J. Heideman [removed: (48)] [added: (49)] | | Senior Vice President – Chief Technology Officer | | 2013 to Present |
| John J. Kita [removed: (59)] [added: (60)] | | Executive Vice President and Chief Financial Officer | | 2011 to Present |
| Charles T. Lauber [removed: (52)] [added: (53)] | | Senior Vice President, Strategy and Corporate Development | | 2013 to Present |
| Mark A. Petrarca [removed: (51)] [added: (52)] | | Senior Vice President – Human Resources and Public Affairs | | 2006 to Present |
| Ajita G. Rajendra [removed: (63)] [added: (64)] | | Chairman, President and Chief Executive Officer | | 2014 to Present |
| James F. Stern [removed: (52)] [added: (53)] | | Executive Vice President, General Counsel and Secretary | | 2007 to Present |
| William L. Vallett Jr. [removed: (55)] [added: (56)] | | Senior Vice President | | 2013 to Present |
| [removed: Kevin J. Wheeler (55)] | | Senior Vice President | | 2013 to [removed: Present] [added: 2014] |
| Wilfridus M. Brouwer (57) | | Senior Vice President – Asia Corporate Development | | 2015 to Present |
| Paul R. Dana (53) | | Senior Vice President – Global Manufacturing | | 2016 to Present |
| | | Vice President – Global Manufacturing | | 2015 |
| | | President – APCOM, a division of State Industries, Inc., a subsidiary of the Company | | 2011 to Present |
| | | Vice President – Product Engineering | | 2006 to 2010 |
| | | Plant Manager – Productos de Agua, S. de R.L. de C.V. | | 1998 to 2005 |
| | | | | |
| | | | | |
| | | | | |
| Stephen S. Anderson (66) | | Senior Vice President – Manufacturing and Supply Chain | | 2011 to Present |
| | | Senior Vice President – Manufacturing and Supply Chain – A. O. Smith Water Products Company | | 2004 to 2011 |
| | | Senior Vice President – Industrial Products Group, Kennametal Inc. | | 1998 to 2004 |
Item 5. MARKET FOR REGISTRANT’S COMMON EQUITY, RELATED STOCKHOLDER MATTERS AND ISSUER PURCHASES OF EQUITY SECURITIES
7 rewritten, 12 added, 10 removed, 28 unchanged
| [removed: 2013] [added: 2015] | | 1st Qtr. | | | | 2nd Qtr. | | | | 3rd Qtr. | | | | 4th Qtr. | | |
| (b) | Holders. As of January 31, [removed: 2015,] [added: 2016,] the approximate number of stockholders of record of Common Stock and Class A Common Stock were [removed: 720] [added: 680] and [removed: 220,] [added: 200,] respectively. |
| (c) | Dividends. Dividends declared on the common stock are shown in Note [removed: 17] [added: 16] of Notes to Consolidated Financial Statements appearing elsewhere herein. |
| (d) | Stock Repurchases. In [removed: 2007,] [added: 2013,] our [removed: board of directors authorized the purchase] [added: Board] of [removed: up to 3,000,000] [added: Directors approved adding 2,000,000] shares [removed: (split adjusted), and in December 2010, our board] of [removed: directors ratified that authorization.] [added: Common Stock to an existing discretionary share repurchase authority.] In [removed: 2013,] [added: 2014,] our board of directors authorized the purchase of an additional [removed: 2,000,000] [added: 3,500,000] shares of our [removed: common stock.] [added: Common Stock.] In [removed: 2014,] [added: 2015,] our [removed: board] [added: Board] of [removed: directors] [added: Directors] authorized the purchase of an additional [removed: 3,500,000] [added: 2,000,000] shares of our [removed: common stock.] [added: Common Stock.] Under the share repurchase program, our [removed: common stock] [added: Common Stock] may be purchased through a combination of Rule 10b5-1 automatic trading plan and discretionary purchases in accordance with applicable securities laws. The number of shares purchased and the timing of the purchase will depend on a number of factors, including share price, trading volume and general market conditions, as well as on working capital requirements, general business conditions and other factors, including alternative investment opportunities. The stock repurchase authorization remains effective until terminated by our [removed: board] [added: Board] of [removed: directors] [added: Directors] which may occur at any time, subject to the parameters of any Rule 10b5-1 automatic trading plan that we may then have in effect. In [removed: 2014,] [added: 2015,] we repurchased [removed: 2,154,783] [added: 1,908,237] shares at an average price of [removed: $48.19] [added: $67.14] per share and at a total cost of [removed: $103.8] [added: $128.1] million. As of December 31, [removed: 2014,] [added: 2015,] there were [removed: 2,497,993] [added: 2,589,756] shares remaining on the existing repurchase authorization. |
The following table sets forth the number of shares of common stock we repurchased during the fourth quarter of [removed: 2014:][added: 2015:]
[removed: 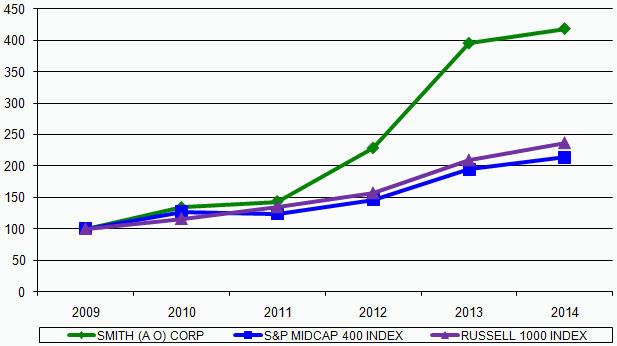][added: 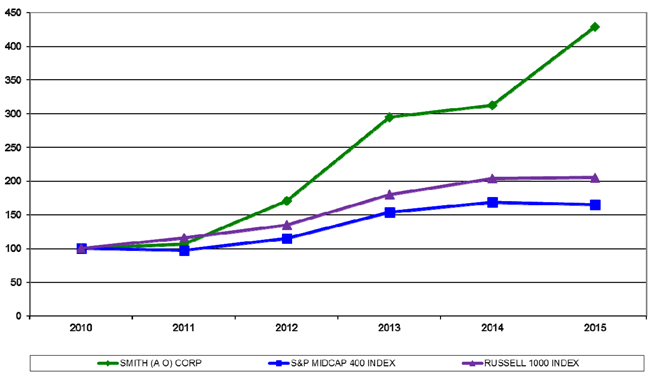]
| Company/Index | | [removed: 12/31/09 | | | |] 12/31/10 | | | | 12/31/11 | | | | 12/31/12 | | | | 12/31/13 | | | | 12/31/14 | | | [added: | 12/31/15 | | |]
| High | | $ | 65.99 | | | $ | 74.40 | | | $ | 77.43 | | | $ | 81.15 | |
| Low | | | 53.49 | | | | 63.53 | | | | 50.09 | | | | 64.23 | |
| October 1 – October 31, 2015 | | | 192,320 | | | $ | 69.10 | | | | 192,320 | | | | 726,446 | |
| November 1 – November 30, 2015 | | | 136,690 | | | | 76.98 | | | | 136,690 | | | | 589,756 | |
| December 1 – December 31, 2015 | | | — | | | | — | | | | — | | | | 2,589,756 | |
From December 31, 2010 to December 31, 2015
| | | | | | | | | | | | | | | | | | | | | | | | | |
| A. O. Smith Corporation | | | 100.0 | | | | 107.0 | | | | 170.7 | | | | 295.1 | | | | 312.5 | | | | 429.0 | |
| | | | | | | | | | | | | | | | | | | | | | | | | |
| S&P Mid Cap 400 Index | | | 100.0 | | | | 97.8 | | | | 115.2 | | | | 153.8 | | | | 168.9 | | | | 165.2 | |
| | | | | | | | | | | | | | | | | | | | | | | | | |
| Russell 1000 Index | | | 100.0 | | | | 116.1 | | | | 135.2 | | | | 179.9 | | | | 203.7 | | | | 205.5 | |
| --- | --- | --- | --- | --- | --- | --- | --- | --- | --- | --- | --- | --- | --- | --- | --- | --- |
| High | | $ | 37.43 | | | $ | 40.36 | | | $ | 46.09 | | | $ | 55.18 | |
| Low | | | 31.01 | | | | 33.35 | | | | 36.32 | | | | 42.72 | |
| October 1 - October 31, 2014 | | | 191,200 | | | $ | 47.50 | | | | 191,260 | | | | 650,093 | |
| November 1 - November 30, 2014 | | | 83,500 | | | | 53.25 | | | | 83,500 | | | | 566,593 | |
| December 1 - December 31, 2014 | | | 68,600 | | | | 54.17 | | | | 68,600 | | | | 2,497,993 | |
From December 31, 2009 to December 31, 2014
| A. O. SMITH CORP | | | 100.0 | | | | 133.8 | | | | 143.2 | | | | 228.3 | | | | 394.82 | | | | 417.95 | |
| S&P MID CAP 400 INDEX | | | 100.0 | | | | 126.7 | | | | 124.0 | | | | 146.0 | | | | 194.9 | | | | 214.0 | |
| RUSSELL 1000 INDEX | | | 100.0 | | | | 116.1 | | | | 134.8 | | | | 156.9 | | | | 208.9 | | | | 236.5 | |
Item 6. SELECTED FINANCIAL DATA
19 rewritten, 0 added, 7 removed, 25 unchanged
| | | [removed: 2014] [added: 2015] | | | | [removed: 2013(1)] [added: 2014] | | | | [removed: 2012] [added: 2013(1)] | | | | [removed: 2011(2),(3)] [added: 2012] | | | | [removed: 2010(4)] [added: 2011(2)(3)] | | |
| Net sales [removed: -] [added: –] continuing operations | | $ | [removed: 2,356.0] [added: 2,536.5] | | | $ | [removed: 2,153.8] [added: 2,356.0] | | | $ | [removed: 1,939.3] [added: 2,153.8] | | | $ | [removed: 1,710.5] [added: 1,939.3] | | | $ | [removed: 1,489.3] [added: 1,710.5] | |
| Continuing operations | | | [removed: 207.8] [added: 282.9] | | | | [removed: 169.7] [added: 207.8] | | | | [removed: 162.6] [added: 169.7] | | | | [removed: 111.2] [added: 162.6] | | | | [removed: 57.1] [added: 111.2] | |
| Discontinued operations | | | — | | | | — | | | | [removed: (3.9] [added: —] | [removed: )] | | | [removed: 194.5] [added: (3.9] | [added: )] | | | [removed: 54.4] [added: 194.5] | |
| Net earnings | | [added: $] | [removed: 207.8] [added: 282.9] | | | [added: $] | [removed: 169.7] [added: 207.8] | | | [added: $] | [removed: 158.7] [added: 169.7] | | | [added: $] | [removed: 305.7] [added: 158.7] | | | [added: $] | [removed: 111.5] [added: 305.7] | |
| Basic earnings (loss) per share of common [removed: stock(1),(4)] [added: stock(1)] | | | | | | | | | | | | | | | | | | | | |
| Continuing operations | | $ | [removed: 2.30] [added: 3.19] | | | $ | [removed: 1.84] [added: 2.30] | | | $ | [removed: 1.76] [added: 1.84] | | | $ | [removed: 1.20] [added: 1.76] | | | $ | [removed: 0.63] [added: 1.20] | |
| Discontinued operations | | | — | | | | — | | | | [removed: (0.04] [added: —] | [removed: )] | | | [removed: 2.11] [added: (0.04] | [added: )] | | | [removed: 0.59] [added: 2.11] | |
| Net earnings | | $ | [removed: 2.30] [added: 3.19] | | | $ | [removed: 1.84] [added: 2.30] | | | $ | [removed: 1.72] [added: 1.84] | | | $ | [removed: 3.31] [added: 1.72] | | | $ | [removed: 1.22] [added: 3.31] | |
| Diluted earnings (loss) per share of common [removed: stock(1),(4)] [added: stock(1)] | | | | | | | | | | | | | | | | | | | | |
| Continuing operations | | $ | [removed: 2.28] [added: 3.16] | | | $ | [removed: 1.83] [added: 2.28] | | | $ | [removed: 1.75] [added: 1.83] | | | $ | [removed: 1.19] [added: 1.75] | | | $ | [removed: 0.62] [added: 1.19] | |
| Discontinued operations | | | — | | | | — | | | | [removed: (0.04] [added: —] | [removed: )] | | | [removed: 2.09] [added: (0.04] | [added: )] | | | [removed: 0.59] [added: 2.09] | |
| Net earnings | | $ | [removed: 2.28] [added: 3.16] | | | $ | [removed: 1.83] [added: 2.28] | | | $ | [removed: 1.71] [added: 1.83] | | | $ | [removed: 3.28] [added: 1.71] | | | $ | [removed: 1.21] [added: 3.28] | |
| Cash dividends per common [removed: share(1),(4)] [added: share(1)] | | $ | [removed: 0.60] [added: 0.76] | | | $ | [removed: 0.46] [added: 0.60] | | | $ | [removed: 0.36] [added: 0.46] | | | $ | [removed: 0.30] [added: 0.36] | | | $ | [removed: 0.27] [added: 0.30] | |
| | | [removed: 2014] [added: 2015] | | | | [removed: 2013] [added: 2014] | | | | [removed: 2012] [added: 2013] | | | | [removed: 2011] [added: 2012] | | | | [removed: 2010] [added: 2011] | | |
| Total assets | | $ | [removed: 2,515.3] [added: 2,646.5] | | | $ | [removed: 2,391.5] [added: 2,515.3] | | | $ | [removed: 2,278.8] [added: 2,391.5] | | | $ | [removed: 2,349.0] [added: 2,278.8] | | | $ | [removed: 2,110.6] [added: 2,349.0] | |
| Long-term [removed: debt(5)] [added: debt(4)] | | | [removed: 210.1] [added: 236.1] | | | | [removed: 177.7] [added: 210.1] | | | | [removed: 225.1] [added: 177.7] | | | | [removed: 443.0] [added: 225.1] | | | | [removed: 242.4] [added: 443.0] | |
| Total stockholders’ equity | | | [removed: 1,381.3] [added: 1,442.3] | | | | [removed: 1,328.7] [added: 1,381.3] | | | | [removed: 1,194.1] [added: 1,328.7] | | | | [removed: 1,085.8] [added: 1,194.1] | | | | [removed: 881.4] [added: 1,085.8] | |
| [removed: (5)] [added: (4)] | Excludes the current portion of long-term debt. |
| | | | | | | | | | | | | | | | | | | | | |
| --- | --- | --- | --- | --- | --- | --- | --- | --- | --- | --- | --- | --- | --- | --- | --- | --- | --- | --- | --- | --- |
| Net loss attributable to noncontrolling interest: | | | | | | | | | | | | | | | | | | | | |
| Continuing operations | | | — | | | | — | | | | — | | | | — | | | | 0.2 | |
| Net earnings attributable to A. O. Smith Corporation | | $ | 207.8 | | | $ | 169.7 | | | $ | 158.7 | | | $ | 305.7 | | | $ | 111.7 | |
| --- | --- |
| (4) | In October 2010, we declared a 50 percent stock dividend to holders of Common Stock and Class A Common Stock which is not included in cash dividends. Basic and diluted earnings per share are calculated using the weighted average shares outstanding which were restated for all periods presented to reflect the stock dividend. |
Item 8. FINANCIAL STATEMENTS AND SUPPLEMENTARY DATA
450 rewritten, 133 added, 121 removed, 678 unchanged
We have audited the accompanying consolidated balance sheets of A. O. Smith Corporation as of December 31, [removed: 2014] [added: 2015] and [removed: 2013,] [added: 2014,] and the related consolidated statements of earnings, comprehensive earnings, stockholders’ equity and cash flows for each of the three years in the period ended December 31, [removed: 2014.][added: 2015.]
In our opinion, the financial statements referred to above present fairly, in all material respects, the consolidated financial position of A. O. Smith Corporation at December 31, [removed: 2014] [added: 2015] and [removed: 2013,] [added: 2014,] and the consolidated results of its operations and its cash flows for each of the three years in the period ended December 31, [removed: 2014,] [added: 2015,] in conformity with U.S. generally accepted accounting principles.
We also have audited, in accordance with the standards of the Public Company Accounting Oversight Board (United States), A. O. Smith Corporation’s internal control over financial reporting as of December 31, [removed: 2014,] [added: 2015,] based on criteria established in Internal Control [removed: –] [added: -] Integrated Framework issued by the Committee of Sponsoring Organizations of the Treadway Commission (2013 framework) and our report dated February 17, [removed: 2015] [added: 2016] expressed an unqualified opinion thereon.
[added: |] Ernst & Young LLP [added: |]
| | | [added: 2015 | | | |] 2014 | | | | 2013 | | |
| Cash and cash equivalents | | $ | [removed: 319.4] [added: 323.6] | | | $ | [removed: 380.7] [added: 319.4] | |
| Marketable securities | | | [removed: 222.5] [added: 321.6] | | | | [removed: 105.3] [added: 222.5] | |
| Receivables | | | [removed: 475.4] [added: 501.4] | | | | [removed: 458.7] [added: 475.4] | |
| Inventories | | | [removed: 208.3] [added: 222.9] | | | | [removed: 193.4] [added: 208.3] | |
| Deferred income taxes | | | [removed: 40.5] [added: 39.9] | | | | [removed: 40.1] [added: 40.5] | |
| Other current assets | | | [removed: 52.9] [added: 45.9] | | | | [removed: 27.4] [added: 52.9] | |
| Total Current Assets | | | [removed: 1,319.0] [added: 1,455.3] | | | | [removed: 1,205.6] [added: 1,319.0] | |
| Net property, plant and equipment | | | [removed: 427.7] [added: 442.7] | | | | [removed: 391.3] [added: 427.7] | |
| Goodwill | | | [removed: 428.8] [added: 420.9] | | | | [removed: 433.5] [added: 428.8] | |
| Other intangibles | | | [removed: 308.5] [added: 291.0] | | | | [removed: 324.8] [added: 308.5] | |
| Other assets | | | [removed: 31.3] [added: 36.6] | | | | [removed: 36.3] [added: 31.3] | |
| Total Assets | | $ | [removed: 2,515.3] [added: 2,646.5] | | | $ | [removed: 2,391.5] [added: 2,515.3] | |
| Trade payables | | $ | [removed: 393.8] [added: 424.9] | | | $ | [removed: 387.1] [added: 393.8] | |
| Accrued payroll and benefits | | | [removed: 70.3] [added: 81.5] | | | | [removed: 61.7] [added: 70.3] | |
| Accrued liabilities | | | [removed: 85.1] [added: 90.2] | | | | [removed: 81.2] [added: 85.1] | |
| Product warranties | | | [removed: 42.3] [added: 43.7] | | | | [removed: 46.7] [added: 42.3] | |
| Long-term debt due within one year | | | [removed: 13.7] [added: 12.9] | | | | [removed: 14.2] [added: 13.7] | |
| Total Current Liabilities | | | [removed: 605.2] [added: 653.2] | | | | [removed: 590.9] [added: 605.2] | |
| Long-term debt | | | [removed: 210.1] [added: 236.1] | | | | [removed: 177.7] [added: 210.1] | |
| Deferred income taxes | | | [removed: 21.4] [added: 21.3] | | | | [removed: 21.0] [added: 21.4] | |
| Product warranties | | | [removed: 93.9] [added: 95.6] | | | | [removed: 89.9] [added: 93.9] | |
| Post-retirement benefit obligation | | | [removed: 9.6] [added: 6.2] | | | | [removed: 10.0] [added: 9.6] | |
| Pension liabilities | | | [removed: 133.1] [added: 134.2] | | | | [removed: 110.7] [added: 133.1] | |
| Other liabilities | | | [removed: 60.7] [added: 57.6] | | | | [removed: 62.6] [added: 60.7] | |
| Total Liabilities | | | [removed: 1,134.0] [added: 1,204.2] | | | | [removed: 1,062.8] [added: 1,134.0] | |
| Class A Common Stock (shares issued [removed: 13,220,470] [added: 13,186,698] and [removed: 13,288,516)] [added: 13,220,470)] | | | [removed: 66.1] [added: 65.9] | | | | [removed: 66.4] [added: 66.1] | |
| Common Stock (shares issued [removed: 82,133,326] [added: 82,167,098] and [removed: 82,065,280)] [added: 82,133,326)] | | | [removed: 82.1] [added: 82.2] | | | | 82.1 | |
| Capital in excess of par value | | | [removed: 600.1] [added: 617.4] | | | | [removed: 589.7] [added: 600.1] | |
| Retained earnings | | | [removed: 1,135.5] [added: 1,350.7] | | | | [removed: 982.2] [added: 1,135.5] | |
| Accumulated other comprehensive loss | | | [removed: (272.0] [added: (313.4] | ) | | | [removed: (259.1] [added: (272.0] | ) |
| Treasury stock at cost | | | [removed: (230.5] [added: (360.5] | ) | | | [removed: (132.6] [added: (230.5] | ) |
| Total Stockholders’ Equity | | [added: $] | [added: 1,442.3 | | | $ |] 1,381.3 | | | [added: $] | 1,328.7 | |
| Total Liabilities and Stockholders’ Equity | | $ | [removed: 2,515.3] [added: 2,646.5] | | | $ | [removed: 2,391.5] [added: 2,515.3] | |
| | | [removed: 2014] [added: 2015] | | | | [removed: 2013] [added: 2014] | | | | [removed: 2012] [added: 2013] | | |
| Net sales | | $ | [removed: 2,356.0] [added: 2,536.5] | | | $ | [removed: 2,153.8] [added: 2,356.0] | | | $ | [removed: 1,939.3] [added: 2,153.8] | |
| |
| --- |
February 17, 2016
| | | 2015 | | | | 2014 | | |
| Stock based compensation expense | | | 8.8 | | | | 10.8 | | | | 10.5 | |
| Acquisition of business | | | — | | | | — | | | | (4.0 | ) |
| Net earnings | | | 282.9 | | | | 207.8 | | | | 169.7 | |
| Foreign currency translation adjustments | | | (42.7 | ) | | | (16.6 | ) | | | 0.4 | |
| Unrealized net gain (loss) on cash flow derivative instruments, less related income tax (provision) benefit of $(0.2) in 2015, $0.1 in 2014 and $(0.2) in 2013 | | | 0.3 | | | | (0.1 | ) | | | 0.3 | |
| Change in pension liability less related income tax provision of $(0.5) in 2015, $(1.0) in 2014 and $(39.7) in 2013 | | | 1.0 | | | | 3.8 | | | | 60.7 | |
The Company also markets in-home air purification products in China.
Derivative instruments. The Company utilizes certain derivative instruments to enhance its ability to manage currency as well as raw materials price risk.
The fair values of all derivatives are recorded in the consolidated balance sheets.
The change in a derivative’s fair value is recorded each period in current earnings or accumulated other comprehensive loss (AOCI), depending on whether the derivative is designated as part of a hedge transaction and if so, the type of hedge transaction.
See Note 12, “Derivative Instruments” of the notes to consolidated financial statements for disclosure of the Company’s derivative instruments and hedging activities.
Income taxes. The provision for income taxes is computed using the asset and liability method, in accordance with ASC 740 _Income Taxes_, under which deferred tax assets and liabilities are recognized for the expected future tax consequences of temporary differences between the financial reporting and tax bases of assets and liabilities and for operating losses and tax credit carryforwards.
Deferred tax assets and liabilities are measured using the currently enacted tax rates that apply to taxable income in effect for the years in which those tax assets are expected to be realized or settled.
The Company records a valuation allowance to reduce deferred tax assets to the amount that is believed more likely than not to be realized.
The Company recognizes the tax benefit from an uncertain tax position only if it is more likely than not the tax position will be sustained on examination by the taxing authorities, based on the technical merits of the position.
The tax benefits recognized in the financial statements from such positions are then measured based on the largest benefit that has a greater than 50 percent likelihood of being realized upon settlement.
In November 2015, the Financial Accounting Standards Board (FASB) amended Accounting Standard Codification (ASC) 740, _Income Taxes_ (issued under Accounting Standards No. (ASN) 2015-17).
This amendment requires that deferred tax assets and liabilities be classified as noncurrent in the statement of financial position.
The amendment is effective for periods beginning January 1, 2016 and allows for either prospective adoption or retrospective adoption.
The Company expects the adoption of amended ASC 740 to impact the classification of deferred taxes on the Company’s consolidated balance sheet.
In April 2015, the FASB amended ASC 835-30, _Interest - Imputation of Interest_ (issued under ASN 2015-03).
This amendment to ASC 835-30 requires that debt issuance costs related to a recognized debt liability be presented in the balance sheet as a direct deduction from the carrying amount of that debt liability, consistent with debt discounts.
The recognition and measurement guidance for debt issuance costs is not affected by this amendment.
The amendment is effective for periods beginning January 1, 2016 and requires using a retrospective approach.
The Company does not expect the adoption of amended ASC 835-30 to have a material impact on the Company’s consolidated balance sheet.
On July 9, 2015, the FASB approved a one year deferral of the effective date, with application permitted as of the original effective date, or periods beginning January 1, 2017.
| 2. | Acquisition |
| 2. | Acquisition (continued) |
| | | $ | 222.9 | | | $ | 208.3 | |
| | | | 866.8 | | | | 815.9 | |
| | | $ | 442.7 | | | $ | 427.7 | |
| Currency translation adjustment | | | (7.5 | ) | | | (0.4 | ) | | | (7.9 | ) |
| Balance at December 31, 2015 | | $ | 361.0 | | | $ | 59.9 | | | $ | 420.9 | |
| | | 2015 | | | | | | | | | | | | 2014 | | | | | | | | | | |
| December 31 (dollars in millions) | | 2015 | | | | 2014 | | |
| | | | 249.0 | | | | 223.8 | |
February 17, 2015
##### [Table of Contents](#toc)
| | | | | | | | | |
| --- | --- | --- | --- | --- | --- | --- | --- | --- |
| | | | | | | | | | | | | |
| --- | --- | --- | --- | --- | --- | --- | --- | --- | --- | --- | --- | --- |
| Contingent consideration adjustment | | | — | | | | — | | | | (3.3 | ) |
| Discontinued Operations | | | | | | | | | | | | |
| Loss on sale of discontinued EPC operations, including tax provision of $6.4 in 2012 | | | — | | | | — | | | | (3.9 | ) |
| Continuing operations | | $ | 2.30 | | | $ | 1.84 | | | $ | 1.76 | |
| Discontinued operations | | | — | | | | — | | | | (0.04 | ) |
| Net Earnings | | $ | 2.30 | | | $ | 1.84 | | | $ | 1.72 | |
| Continuing operations | | $ | 2.28 | | | $ | 1.83 | | | $ | 1.75 | |
| Net Earnings | | $ | 2.28 | | | $ | 1.83 | | | $ | 1.71 | |
| Unrealized loss on investments less related income tax benefit of $0.7 in 2012 | | | — | | | | — | | | | (1.2 | ) |
| Operating Activities | | | | | | | | | | | | |
| Loss from discontinued operations | | | — | | | | — | | | | 3.9 | |
| Unrealized gain on investment | | | — | | | | — | | | | (27.2 | ) |
| Acquisitions of businesses | | | — | | | | (4.0 | ) | | | (13.5 | ) |
| Unrealized loss on investments less related income tax provision of $0.7 in 2012 | | | — | | | | — | | | | (1.2 | ) |
| --- | --- |
On August 22, 2011, the company sold its Electrical Products business (EPC) to Regal Beloit Corporation (RBC) for approximately $760 million in cash and approximately 2.83 million shares of RBC common stock.
Due to the sale, EPC has been reported separately as a discontinued operation.
See Note 2 Discontinued Operations.
| 1. | Organization and Significant Accounting Policies (continued) |
| --- | --- | --- | --- | --- | --- | --- | --- | --- | --- | --- | --- | --- | --- | --- | --- | --- |
Additionally steel futures contracts are purchased on the New York Metals Exchange (NYMEX).
With NYMEX, the company is required to make cash deposits on unrealized losses on steel derivative contracts.
The steel contracts do not qualify for hedge accounting and are adjusted to fair value on a quarterly basis through earnings.
| | | $ | 3.4 | | | $ | 3.1 | | | | | $ | 3.4 | | | $ | 2.5 | | | | | $ | — | | | $ | — | |
ASC 606-10 is effective for the year beginning January 1, 2017.
| 2. | Discontinued Operations |
On August 22, 2011, the company completed the sale of EPC to RBC for $759.9 million in cash and approximately 2.83 million shares of RBC common stock.
Included in the $759.9 million of cash is a final working capital adjustment of $7.4 million which was paid to the company by RBC in January 2012.
The value of the RBC shares on the date of the closing of the sale was $140.6 million.
See Note 13 for further discussion regarding the company’s investment in RBC stock.
In 2012, the company paid $31.2 million in income taxes and $3.6 million of payments related to the sale of EPC.
In the fourth quarter of 2012, the company recorded expense of $3.9 million on the gain on sale of EPC which included $6.4 million of expense representing the correction of an error primarily due to the company’s calculation of taxes due upon repatriation of undistributed foreign earnings.
The correction was not material to any previously reported financial period or to the year ended December 31, 2012 and as a result has been reported as the correction of the error in the year ended December 31, 2012.
This correction was offset by a change in estimate related to other reserves associated with EPC of $2.5 million.
An excerpt. Shown here: 40 of 450 rewritten, 40 of 133 added and 40 of 121 removed. The counts are complete. For every sentence, read Item 8. FINANCIAL STATEMENTS AND SUPPLEMENTARY DATA in the FY2015 filing and the FY2014 filing.
Item 9A. CONTROLS AND PROCEDURES
5 rewritten, 0 added, 0 removed, 11 unchanged
Based on this evaluation, our management has concluded that, as of December 31, [removed: 2014,] [added: 2015,] our internal control over financial reporting was effective.
Ernst & Young LLP, an independent registered public accounting firm, has audited our consolidated financial statements and the effectiveness of internal controls over financial reporting as of December 31, [removed: 2014] [added: 2015] as stated in their report which is included herein.
In [removed: the third quarter of 2014,] [added: 2015,] we [removed: began] [added: continued] the implementation of a new global enterprise resource planning system.
We are testing internal controls over financial reporting for design effectiveness prior to the implementation of each phase, and we have monitoring controls in place over the implementation of these [removed: changes.][added: changes]
Except as described above, there have been no [removed: other] changes in our internal control over financial reporting (as such term is defined in Rules 13a-15(f) and 15d-15(f) under the Securities and Exchange Act) during the year ended December 31, [removed: 2014] [added: 2015] that have materially affected, or are reasonably likely to materially affect, our internal control over financial reporting.
Item 9B. OTHER INFORMATION
4 rewritten, 3 added, 1 removed, 18 unchanged
We have audited A. O. Smith Corporation’s internal control over financial reporting as of December 31, [removed: 2014,] [added: 2015,] based on criteria established in Internal [removed: Control – Integrated] [added: Control—Integrated] Framework issued by the Committee of Sponsoring Organizations of the Treadway Commission (2013 framework) (the COSO criteria).
In our opinion, A. O. Smith Corporation maintained, in all material respects, effective internal control over financial reporting as of December 31, [removed: 2014,] [added: 2015,] based on the COSO criteria.
We also have audited, in accordance with the standards of the Public Company Accounting Oversight Board (United States), the consolidated balance sheets of A. O. Smith Corporation as of December 31, [removed: 2014] [added: 2015] and [removed: 2013,] [added: 2014,] and the related consolidated statements of earnings, comprehensive earnings, stockholders’ equity, and cash flows for each of the three years in the period ended December 31, [removed: 2014,] [added: 2015,] and our report dated February 17, [removed: 2015] [added: 2016] expressed an unqualified opinion thereon.
[added: |] Ernst & Young LLP [added: |]
| |
| --- |
February 17, 2016
February 17, 2015
Item 10. DIRECTORS, EXECUTIVE OFFICERS AND CORPORATE GOVERNANCE
2 rewritten, 0 added, 0 removed, 15 unchanged
The information included under the headings “Election of Directors” and “Board Committees” in our definitive Proxy Statement for the [removed: 2015] [added: 2016] Annual Meeting of Stockholders (to be filed with the Securities and Exchange Commission under Regulation 14A within 120 days after the end of the registrant’s fiscal year) is incorporated herein by reference.
The information included under the heading “Compliance with Section 16(a) of the Securities Exchange Act” in our definitive Proxy Statement for the [removed: 2015] [added: 2016] Annual Meeting of Stockholders (to be filed with the Securities and Exchange Commission under Regulation 14A within 120 days after the end of the registrant’s fiscal year) is incorporated herein by reference.
Item 11. EXECUTIVE COMPENSATION
1 rewritten, 0 added, 0 removed, 0 unchanged
The information included under the headings “Executive Compensation,” “Director Compensation,” “Report of the Personnel and Compensation Committee” and “Compensation Committee Interlocks and Insider Participation” in the company’s definitive Proxy Statement for the [removed: 2015] [added: 2016] Annual Meeting of Stockholders (to be filed with the Securities and Exchange Commission under Regulation 14A within 120 days after the end of the registrant’s fiscal year) is incorporated herein by reference.
Item 12. SECURITY OWNERSHIP OF CERTAIN BENEFICIAL OWNERS AND MANAGEMENT AND RELATED STOCKHOLDER MATTERS
3 rewritten, 2 added, 2 removed, 14 unchanged
The information included under the headings “Principal Stockholders” and “Security Ownership of Directors and Management” in our definitive Proxy Statement for the [removed: 2015] [added: 2016] Annual Meeting of Stockholders (to be filed with the Securities and Exchange Commission under Regulation 14A within 120 days after the end of the registrant’s fiscal year) is incorporated herein by reference.
The following table provides information about our equity compensation plans as of December 31, [removed: 2014.][added: 2015.]
| (1) | Consists of [removed: 1,577,003] [added: 1,326,779] shares subject to stock options, [removed: 416,289] [added: 329,262] shares subject to employee share units and [removed: 159,604] [added: 161,918] shares subject to director share units. |
| Equity compensation plans approved by security holders | | | 1,817,959 | (1) | | $ | 36.05 | (2) | | | 1,994,172 | (3) |
| Total | | | 1,817,959 | | | $ | 36.05 | | | | 1,994,172 | |
| Equity compensation plans approved by security holders | | | 2,152,896 | (1) | | $ | 27.50 | (2) | | | 2,321,174 | (3) |
| Total | | | 2,152,896 | | | $ | 27.50 | | | | 2,321,174 | |
Item 13. CERTAIN RELATIONSHIPS, RELATED TRANSACTIONS AND DIRECTOR INDEPENDENCE
1 rewritten, 0 added, 0 removed, 0 unchanged
The information included under the headings “Director Independence and Financial Literacy”, “Compensation Committee Interlocks and Insider Participation” and “Procedure for Review of Related Party Transactions” in our definitive Proxy Statement for the [removed: 2015] [added: 2016] Annual Meeting of Stockholders (to be filed with the Securities and Exchange Commission under Regulation 14A within 120 days after the end of the registrant’s fiscal year) is incorporated herein by reference.
Item 14. PRINCIPAL ACCOUNTANT FEES AND SERVICES
1 rewritten, 0 added, 0 removed, 2 unchanged
The information included under the heading “Report of the Audit Committee” in our definitive Proxy Statement for the [removed: 2014] [added: 2016] Annual Meeting of Stockholders (to be filed with the Securities and Exchange Commission under Regulation 14A within 120 days after the end of the registrant’s fiscal year) required by this Item 14 is incorporated herein by reference.
Item 15. EXHIBITS, FINANCIAL STATEMENT SCHEDULES
55 rewritten, 21 added, 8 removed, 84 unchanged
[removed: | |] (a) [removed: |] The following documents are filed as part of this Annual Report on Form 10-K: [removed: |]
| | | [added: Form 10-K] Page Number | | |
| [removed: [Consolidated] [added: Consolidated] Balance Sheets at December 31, [removed: 2014] [added: 2015] and [removed: 2013](#tx838160_25)] [added: 2014] | | | [removed: 29] [added: 26] | |
| For each of the three years in the period ended December 31, [removed: 2014:] [added: 2015:] | | | | |
| [removed: [\-] [added: \-] Consolidated Statement of [removed: Earnings](#tx838160_26)] [added: Earnings] | | | [removed: 30] [added: 27] | |
| [removed: [\-] [added: \-] Consolidated Statement of Comprehensive [removed: Earnings](#tx838160_27)] [added: Earnings] | | | [removed: 30] [added: 27] | |
| [removed: [\-] [added: \-] Consolidated Statement of Cash [removed: Flows](#tx838160_28)] [added: Flows] | | | [removed: 31] [added: 28] | |
| [removed: [\-] [added: \-] Consolidated Statement of Stockholders’ [removed: Equity](#tx838160_29)] [added: Equity] | | | [removed: 32] [added: 29] | |
| [removed: [Notes] [added: Notes] to Consolidated Financial [removed: Statements](#tx838160_30)] [added: Statements] | | | [removed: 33] [added: 30] - [removed: 57] [added: 53] | |
| [removed: [Schedule] [added: | | Schedule] II - Valuation and Qualifying [removed: Accounts](#tx838160_31)] [added: Accounts] | | | [removed: 66] [added: 62] | |
[added: | | |] Schedules not included have been omitted because they are not applicable. [added: | | | | |]
| | 3. | Exhibits - see the Index to Exhibits on pages [removed: 64] [added: 60] - [removed: 65] [added: 61] of this report. Each management contract or compensatory plan or arrangement required to be filed as an exhibit to this report on Form 10-K are listed as Exhibits 10(a) through 10(m) in the Index to Exhibits. |
| Date: February 17, [removed: 2015] [added: 2016] | | | | By: | | /s/ Ajita G. Rajendra |
| | | | | | | [removed: Executive Chairman of] the Board of Directors |
Pursuant to the requirements of the Securities Exchange Act of 1934, this report has been signed below as of February 17, [removed: 2015] [added: 2016] by the following persons on behalf of the registrant and in the capacities and on the dates indicated.
| _Name and Title_ | | [removed: | |] _Signature_ |
| AJITA G. RAJENDRA | | [removed: | |] /s/ Ajita G. Rajendra |
| Chairman of the Board, President and Chief Executive Officer | | [removed: | |] Ajita G. Rajendra |
| JOHN J. KITA | | [removed: | |] /s/ John J. Kita |
| Executive Vice President and Chief Financial Officer | | [removed: | |] John J. Kita |
| DANIEL L. KEMPKEN | | [removed: | |] /s/ Daniel L. Kempken |
| Vice President and Controller | | [removed: | |] Daniel L. Kempken |
| RONALD D. BROWN | | [removed: | |] /s/ Ronald D. Brown |
| Director | | [removed: | |] Ronald D. Brown |
| GLOSTER B. CURRENT, Jr. | | [removed: | |] /s/ Gloster B. Current, Jr. |
| Director | | [removed: | |] Gloster B. Current, Jr. |
| WILLIAM P. GREUBEL | | [removed: | |] /s/ William P. Greubel |
| Director | | [removed: | |] William P. Greubel |
| PAUL W. JONES | | [removed: | |] /s/ Paul W. Jones |
| Director | | [removed: | |] Paul W. Jones |
| MATHIAS F. SANDOVAL | | [removed: | |] /s/ Mathias F. Sandoval |
| Director | | [removed: | |] Mathias F. Sandoval |
| BRUCE M. SMITH | | [removed: | |] /s/ Bruce M. Smith |
| Director | | [removed: | |] Bruce M. Smith |
| MARK D. SMITH | | [removed: | |] /s/ Mark D. Smith |
| Director | | [removed: | |] Mark D. Smith |
| IDELLE K. WOLF | | [removed: | |] /s/ Idelle K. Wolf |
| Director | | [removed: | |] Idelle K. Wolf |
| GENE C. WULF | | [removed: | |] /s/ Gene C. Wulf |
| Director | | [removed: | |] Gene C. Wulf |
| | | | | | | |
| --- | --- | --- | --- | --- | --- | --- |
| | | | | | | |
| | | | | | | Executive Chairman of |
| | | |
| | | |
| | | |
| | | |
| | | |
| | | |
| | | |
| | | |
| | | |
| | | |
| | | |
| | | |
| | | |
| | | (f) | | A. O. Smith Corporation Executive Incentive Compensation Award Agreement, incorporated by reference to the quarterly report on Form 10-Q for the quarter ended March 31, 2012. |
| | | (i) | | Amendment to Offer Letter to Ajita G. Rajendra dated December 10, 2015. |
| 2015: | | | | | | | | | | | | | | | | |
| | | | | | | | | | | | | | | | | |
| | | | | |
| --- | --- | --- | --- | --- |
| | | Form 10-K | | |
| | | (h) | | Amendment to Offer Letter to Ajita G. Rajendra Dated February 25, 2009, incorporated by reference to the annual report on Form 10-K for the fiscal year ended December 31, 2008. |
| 2012: | | | | | | | | | | | | | | | | |
| 1 | Provision based upon estimated collection |
| --- | --- |
| 2 | Uncollectible amounts/expenditures or adjustments recorded against the reserve |
An excerpt. Shown here: 40 of 55 rewritten, all 21 added and all 8 removed. The counts are complete. For every sentence, read Item 15. EXHIBITS, FINANCIAL STATEMENT SCHEDULES in the FY2015 filing and the FY2014 filing.