 filings.tools
A. O. Smith 10-K 2018-12-31
Filed 2019-02-15. 20 sections, 252K characters. Original on sec.gov · Markdown · JSON
Cover and table of contents
10-K 1 d678397d10k.htm FORM 10-K
Table of Contents
UNITED STATES
SECURITIES AND EXCHANGE COMMISSION
Washington, D.C. 20549
FORM 10-K
| ☒ | ANNUAL REPORT PURSUANT TO SECTION 13 OR 15(d) OF THE SECURITIES EXCHANGE ACT OF 1934 |
|---|
For the fiscal year ended December 31, 2018
OR
| ☐ | TRANSITION REPORT PURSUANT TO SECTION 13 OR 15(d) OF THE SECURITIES EXCHANGE ACT OF 1934 |
|---|
For the transition period from to
Commission File Number 1-475
A. O. Smith Corporation
(Exact name of registrant as specified in its charter)
| Delaware | 39-0619790 | |
| (State of Incorporation) | (I.R.S. Employer Identification No.) | |
| 11270 West Park Place, Milwaukee, Wisconsin | 53224-9508 | |
| (Address of Principal Executive Office) | (Zip Code) | |
| (414) 359-4000 | ||
| Registrant’s telephone number, including area code |
Securities registered pursuant to Section 12(b) of the Act:
| Title of Each Class | Shares of Stock Outstanding January 31, 2019 | Name of Each Exchange on Which Registered | ||
| Class A Common Stock (par value $5.00 per share) | 26,059,903 | Not listed | ||
| Common Stock (par value $1.00 per share) | 141,852,744 | New York Stock Exchange |
Securities registered pursuant to Section 12(g) of the Act: None.
Indicate by check mark if the registrant is a well-known seasoned issuer, as defined in Rule 405 of the Securities Act. ☒ Yes ☐ No
Indicate by check mark if the registrant is not required to file reports pursuant to Section 13 or Section 15(d) of the Act. ☐ Yes ☒ No
Indicate by check mark whether the registrant (1) has filed all reports required to be filed by Section 13 or 15(d) of the Securities Exchange Act of 1934 during the preceding 12 months (or for such shorter period that the registrant was required to file such reports), and (2) has been subject to such filing requirements for the past 90 days. ☒ Yes ☐ No.
Indicate by check mark whether the registrant has submitted every Interactive Data File required to be submitted pursuant to Rule 405 of Regulation S-T (§232.405 of this chapter) during the preceding 12 months (or for such shorter period that the registrant was required to submit such files). ☒ Yes ☐ No
Indicate by check mark if disclosure of delinquent filers pursuant to Item 405 of Regulation S-K (§229.405 of this chapter) is not contained herein, and will not be contained, to the best of registrant’s knowledge, in definitive proxy or information statements incorporated by reference in Part III of this Form 10-K or any amendment to this Form 10-K. ☒
Indicate by check mark whether the registrant is a large accelerated filer, an accelerated filer, a non-accelerated filer or a smaller reporting company, or emerging growth company. See the definitions of “large accelerated filer,” “accelerated filer,” “smaller reporting company,” and “emerging growth company” in Rule 12b-2 of the Exchange Act.
| Large accelerated filer | ☒ | Accelerated filer | ☐ | |||
| Non-accelerated filer | ☐ | Smaller reporting company | ☐ | |||
| Emerging growth company | ☐ |
If an emerging growth company, indicate by check mark if the registrant has elected not to use the extended transition period for complying with any new or revised financial accounting standards provided pursuant to Section 13(a) of the Exchange Act. ☐
Indicate by check mark whether the registrant is a shell company (as defined in Rule 12b-2 of the Act.) ☐ Yes ☒ No
The aggregate market value of voting stock held by non-affiliates of the registrant was $54,612,426 for Class A Common Stock and $8,368,308,653 for Common Stock as of June 30, 2018.
DOCUMENTS INCORPORATED BY REFERENCE
| 1. | Portions of the company’s definitive Proxy Statement for the 2019 Annual Meeting of Stockholders (to be filed with the Securities and Exchange Commission under Regulation 14A within 120 days after the end of the registrant’s fiscal year and, upon such filing, to be incorporated by reference in Part III). |
|---|
Table of Contents
Table of Contents
A. O. Smith Corporation
Index to Form 10-K
Year Ended December 31, 2018
Table of Contents
PART 1
Item 1. - BUSINESS
Our company is comprised of two reporting segments: North America and Rest of World. Our Rest of World segment is primarily comprised of China, Europe and India. Both segments manufacture and market comprehensive lines of residential and commercial gas and electric water heaters, boilers, tanks and water treatment products. Both segments primarily manufacture and market in their respective regions of the world. Our Rest of World segment also manufactures and markets in-home air purification products in China.
NORTH AMERICA
We serve residential and commercial end markets in North America with a broad range of products including:
Water heaters. Our residential and commercial water heaters come in sizes ranging from 2.5 gallon (point-of-use) models to 4,000 gallon products with varying efficiency ranges. We offer electric, natural gas and liquid propane tank-type models as well as tankless (gas and electric), heat pump and solar tank units. Typical applications for our water heaters include residences, restaurants, hotels and motels, office buildings, laundries, car washes and small businesses.
Boilers. Our residential and commercial boilers range in size from 40,000 British Thermal Units (BTUs) to 6.0 million BTUs. Our commercial boilers are primarily used in space heating applications for hospitals, schools, hotels and other large commercial buildings.
Water treatment products. With the acquisition of Aquasana, Inc. (Aquasana) in 2016 and Hague Quality Water International (Hague) in 2017, we entered the North American water treatment market. Our water treatment products range from on-the-go filtration bottles and point-of-use carbon and reverse osmosis products to point-of-entry water softeners and whole-home water filtrations products. We also offer a complete line of food and beverage filtration products. Typical applications for our water treatment products include residences, restaurants, hotels and offices. A portion of our sales of water treatment products is comprised of replacement filters.
Other. In our North America segment, we also manufacture expansion tanks, commercial solar water heating systems, swimming pool and spa heaters, related products and parts.
A significant portion of our North America sales is derived from the replacement of existing products.
We believe we are the largest manufacturer and marketer of water heaters in North America with a leading share in both the residential and commercial markets. In the commercial markets for both water heating and space heating, we believe our comprehensive product lines and our high-efficiency products give us a competitive advantage in these portions of the markets. Our wholesale distribution channel, where we sell our products primarily under the A. O. Smith and State brands, includes more than 1,300 independent wholesale plumbing distributors serving residential and commercial end markets. We also sell our residential water heaters through the retail and maintenance, repair and operations (MRO) channels. In the retail channel, our customers include four of the six largest national hardware and home center chains, including a long-standing exclusive relationship with Lowe’s where we sell A. O. Smith branded products.
Our Lochinvar brand is one of the leading residential and commercial boiler brands in the U.S. Approximately 40 percent of Lochinvar branded sales consist of residential and commercial water heaters while the remaining 60 percent of Lochinvar-branded sales consist primarily of boilers and related parts. Our commercial boiler distribution channel is primarily comprised of manufacturer representative firms, the remainder of our Lochinvar branded products are distributed through wholesale channels.
We sell our Aquasana branded products primarily directly to consumers through e-commerce as well as on-line retailers including Amazon and through other retail chains. Our water softener products are sold through water quality dealers and home center retail chains. Our A. O. Smith branded water treatment products are sold through Lowe’s.
Our energy efficient product offerings continue to be a sales driver for our business. Our commercial water heaters and our condensing boilers continue to be an option for commercial customers looking for high efficiency water and space heating with a short payback period through energy savings. We offer residential heat pump, condensing tank-type and tankless water heaters in North America, as well as other higher efficiency water heating solutions to round out our energy efficient product offerings.
Table of Contents
We sell our water heating products in highly competitive markets. We compete in each of our targeted market segments based on product design, reliability, quality of products and services, advanced technologies, energy efficiency, maintenance costs and price. Our principal water heating and boiler competitors in North America include Rheem, Bradford White, Rinnai, Aerco and Navien. Numerous other manufacturing companies also compete. Our principal water treatment competitors in the U.S. are Brita, Culligan, Kinetico, Pentair and Ecowater as well as numerous regional assemblers.
REST OF WORLD
We have operated in China for more than 20 years. In that time, we have been aggressively expanding our presence while building A. O. Smith brand recognition in the residential and commercial markets. The Chinese water heater market is predominantly comprised of electric wall-hung, gas tankless, combi-boiler, heat pump and solar water heaters. We believe we are one of the leading suppliers of water heaters to the residential market in China in dollar terms. We manufacture and market water treatment products, primarily residential reverse osmosis products. We also manufacture and market air purification products in China.
We sell water heaters in more than 9,000 retail outlets in China, of which over 2,800 exclusively sell our products. Our water treatment products and air purification products are sold in over 7,500 and 3,500 retail outlets in China, respectively.
In 2008, we established a sales office in India and began importing products specifically designed for India. We began manufacturing water heaters in India in 2010 and water treatment products in 2015.
Our primary competitors in China in the electric water heater market segment are Haier and Midea, which are Chinese companies. We compete with Rinnai and Noritz in the gas tankless water heater market segment. Our principal competitors in the water treatment market are Qinyuan, Angel, Midea and Xiaomi. Our principal competitors in the China air purification market are Phillips, Panasonic and Sharp. In India, we compete with Bajaj and Havels in the water heater market and Eureka Forbes, Kent and Hindustan Unilever in the water treatment market.
In addition, we sell water heaters in the European and Middle Eastern markets and water treatment products in Hong Kong, Turkey and Vietnam, all of which combined comprised less than six percent of total Rest of World sales in 2018.
Table of Contents
RAW MATERIALS
Raw materials for our manufacturing operations, primarily consisting of steel, are generally available in adequate quantities. A portion of our customers are contractually obligated to accept price changes based on fluctuations in steel prices. There has been volatility in steel costs over the last several years.
RESEARCH AND DEVELOPMENT
To improve our competitiveness by generating new products and processes, we conduct research and development at our newly constructed Corporate Technology Center in Milwaukee, Wisconsin, at our Global Engineering Center in Nanjing, China, and at our operating locations. Our total expenditures for research and development in 2018, 2017 and 2016 were $94.0 million, $86.4 million and $80.1 million, respectively.
PATENTS AND TRADEMARKS
We own and use in our businesses various trademarks, trade names, patents, trade secrets and licenses. We do not believe that our business as a whole is materially dependent upon any such trademark, trade name, patent, trade secret or license. However, our trade name is important with respect to our products, particularly in China, India and the U.S.
EMPLOYEES
We employed approximately 16,300 employees as of December 31, 2018, primarily non-union.
BACKLOG
Due to the short-cycle nature of our businesses, none of our operations sustain significant backlogs.
ENVIRONMENTAL LAWS
Our operations are governed by a variety of federal, foreign, state and local laws intended to protect the environment. Compliance with environmental laws has not had and is not expected to have a material effect upon the capital expenditures, earnings, or competitive position of our company. See Item 3.
AVAILABLE INFORMATION
We maintain a website with the address www.aosmith.com. The information contained on our website is not included as a part of, or incorporated by reference into, this Annual Report on Form 10-K. Other than an investor’s own internet access charges, we make available free of charge through our website our Annual Report on Form 10-K, quarterly reports on Form 10-Q, current reports on Form 8-K and amendments to these reports as soon as reasonably practical after we have electronically filed such material with, or furnished such material to, the Securities and Exchange Commission (SEC). All reports we file with the SEC are also available free of charge via EDGAR through the SEC’s website at www.sec.gov.
We are committed to sound corporate governance and have documented our corporate governance practices by adopting the A. O. Smith Corporate Governance Guidelines. The Corporate Governance Guidelines, Criteria for Selection of Directors, Financial Code of Ethics, the A. O. Smith Guiding Principles, as well as the charters for the Audit, Personnel and Compensation, Nominating and Governance and the Investment Policy Committees of the Board of Directors and other corporate governance materials, may be viewed on the company’s website. Any waiver of or amendments to the Financial Code of Conduct or the A. O. Smith Guiding Principles also would be posted on this website; to date there have been none. Copies of these documents will be sent to stockholders free of charge upon written request of the corporate secretary at the address shown on the cover page of this Annual Report on Form 10-K.
We are also committed to growing our business in a sustainable and socially responsible manner consistent with our Guiding Principles. This commitment has driven us to design, engineer, and manufacture highly innovative and efficient products in an environmentally responsible manner that help reduce energy consumption, conserve water, and improve drinking water quality and public health. Consistent with this commitment, we issued our first Corporate Responsibility & Sustainability (CRS) report in 2018 detailing our company’s historic and current CRS efforts. Our CRS report is available on our website, www.aosmith.com. To further demonstrate our commitment, our company recently appointed Patricia K. Ackerman, Senior Vice President, Investor Relations, Treasurer, and Corporate Responsibility and Sustainability with specific responsibility for our CRS efforts.
Table of Contents
| ITEM 1A – | RISK FACTORS |
|---|
You should carefully consider the risk factors set forth below and all other information contained in this Annual Report on Form 10-K, including the documents incorporated by reference, before making an investment decision regarding our common stock. If any of the events contemplated by the following risks actually occurs, then our business, financial condition, or results of operations could be materially adversely affected. As a result, the trading price of our common stock could decline, and you may lose all or part of your investment. The risks and uncertainties below are not the only risks facing our company.
| • | The effects of a global economic downturn could have a material adverse effect on our business |
|---|
Global economic growth remains uneven and could stall or reverse course. If this were to occur it could adversely affect consumer confidence and spending patterns which could result in decreased demand for the products we sell, a delay in purchases, increased price competition, or slower adoption of energy efficient water heaters and boilers, or high quality water treatment products, which could negatively impact our profitability and cash flows. In addition, a deterioration in current economic conditions, including credit market conditions, could negatively impact our vendors and customers, which could result in an increase in bad debt expense, customer and vendor bankruptcies, interruption or delay in supply of materials, or increased material prices, which could negatively impact our ability to distribute, market and sell our products and our financial condition, results of operations and cash flows.
| • | We increasingly sell our products and operate outside the U.S., and to a lesser extent, rely on imports and exports, which may present additional risks to our business |
|---|
Approximately 43 percent of our net sales in 2018 were attributable to products sold outside of the U.S., primarily in China and Canada, and to a lesser extent in Europe and India. We also have operations and business relationships outside the U.S. that comprise a portion of our manufacturing, supply, and distribution. Approximately 10,000 of our 16,300 employees as of December 31, 2018 were located in China. At December 31, 2018, approximately $644 million of cash was held by our foreign subsidiaries, substantially all of which was located in China. International operations generally are subject to various risks, including: political, religious, and economic instability; local labor market conditions; new or increased tariffs or other trade restrictions, or changes to trade agreements; the impact of foreign government regulations, actions or policies; the effects of income taxes; governmental expropriation; the imposition or increases in withholding and other taxes on remittances and other payments by foreign subsidiaries; labor relations problems; the imposition of environmental or employment laws, or other restrictions or actions by foreign governments; and differences in business practices. Unfavorable changes in the political, regulatory, or trade climate, diplomatic relations, or government policies, particularly in relation to countries where we have a presence, including Canada, China, India and Mexico, could have a material adverse effect on our financial condition, results of operations and cash flows or our ability to repatriate funds to the U.S.
| • | A portion of our business could be affected by further weakening of the Chinese economy |
|---|
Approximately 34 percent of our net sales in 2018 were attributable to China. Our sales growth in China decreased in 2018. We believe that decrease was due to weakness in the housing market in China, weakening consumer sentiment in part associated with concerns about the trade tensions between China and the U.S. and a weakening Chinese economy. We derive a substantial portion of our sales in China from premium-tier products and weakening consumer confidence and sentiment as well as economic uncertainty may prompt consumers there to choose lower-priced alternatives or lengthen the cycle of replacement purchases. Further deterioration in the Chinese economy could adversely affect our financial condition, results of operations and cash flows.
| • | A material loss, cancellation, reduction, or delay in purchases by one or more of our largest customers could harm our business |
|---|
Net sales to our five largest customers represented approximately 39 percent of our sales in 2018. We expect that our customer concentration will continue for the foreseeable future. Our concentration of sales to a relatively small number of customers makes our relationship with each of these customers important to our business. We cannot assure that we will be able to retain our largest customers. Some of our customers may shift their purchases to our competitors in the future. The loss of one or more of our largest customers, any material reduction or delay in sales to these customers, or our inability to successfully develop relationships with additional customers could have a material adverse effect on our financial position, results of operations and cash flows.
Table of Contents
| • | Our international operations are subject to risks related to foreign currencies |
|---|
We have significant operations outside of the U.S., primarily in China and Canada and to a lesser extent Europe and India, and therefore, hold assets, including $539 million of cash denominated in local currency in China, incur liabilities, earn revenues and pay expenses in a variety of currencies other than the U.S. dollar. The financial statements of our foreign subsidiaries are translated into U.S. dollars in our consolidated financial statements. As a result, we are subject to risks associated with operating in foreign countries including fluctuations in currency exchange rates and interest rates, hyperinflation in some foreign countries or global exchange rate instability or volatility that strengthens the U.S. dollar against foreign currencies. Furthermore, typically our products are priced in foreign countries in local currencies. As a result, an increase in the value of the U.S. dollar relative to the local currencies of our foreign markets has had and would continue to have a negative effect on our profitability. In addition to currency translation risks, we incur a currency transaction risk whenever one of our subsidiaries enters into either a purchase or sale transaction using a currency different from the operating subsidiaries’ functional currency. The majority of our foreign currency transaction risk results from sales of our products in Canada which we manufacture in the U.S. These risks may hurt our reported sales and profits in the future or negatively impact revenues and earnings translated from foreign currencies into U.S. dollars.
| • | A portion of our business could be adversely affected by a decline in North American new residential and commercial construction or a decline in replacement related volume |
|---|
Residential and commercial construction activity in North America has shown modest growth and activity could decline again in the future. We believe that the majority of the markets we serve are for replacement of existing products and replacement related volume growth was strong in 2018. Changes in replacement volume and in the construction market could negatively affect us.
| • | Because we participate in markets that are highly competitive, our revenues and earnings could decline as we respond to competition |
|---|
We sell all of our products in highly competitive and evolving markets. We compete in each of our targeted markets based on product design, reliability, quality of products and services, advanced technologies, product performance, maintenance costs and price. Some of our competitors may have greater financial, marketing, manufacturing, research and development and distribution resources than we have, and some are increasingly expanding beyond their existing manufacturing or geographic footprints. Consumer purchasing behavior may shift the product mix in the market or result in a shift to new distribution channels, including e-commerce, which is a rapidly developing area. Development of a successful e-commerce strategy involves significant time, investment and resources. In North America, the tankless portion of the water heating market has for many years increased as a percentage of the overall market. While we have many tankless products, our market share for tankless products is lower than our market share for the remainder of the water heating market. Further acceleration of the tankless portion of the North America market, which we believe was less than eight percent of the market in 2018, could have an impact on our operating results. We cannot assure that our products will continue to compete successfully with those of our competitors, there could be new market participants that change the dynamics of those markets and it is possible that we will not be able to retain our customer base or improve or maintain our profit margins on sales to our customers, all of which could materially and adversely affect our financial condition, results of operations and cash flows.
| • | If we are unable to develop product innovations and improve our technology and expertise, we could lose customers or market share |
|---|
Our success may depend on our ability to adapt to technological changes in the water heating, boiler, water treatment and air purifier industries. If we are unable to timely develop and introduce new products, or enhance existing products, in response to changing market conditions or customer requirements or demands, our competitiveness could be materially and adversely affected. Our ability to develop and successfully market new products and to develop, acquire, and retain necessary intellectual property rights is essential to our continued success, but cannot reasonably be assured.
| • | Changes in regulations or standards could adversely affect our business |
|---|
Our products are subject to a wide variety of statutory, regulatory and industry standards and requirements related to, among other items, energy and water efficiency, environmental emissions, labeling and safety. While we believe our products are currently efficient, safe and environment-friendly, a significant change to regulatory requirements (whether federal, foreign, state or local) such as electrification as a replacement for gas combustion, or to industry standards, could substantially increase
Table of Contents
manufacturing costs, impact the size and timing of demand for our products, affect the types of products we are able to offer, or put us at a competitive disadvantage, any of which could harm our business and have a material adverse effect on our financial condition, results of operations and cash flow.
| • | Our business may be adversely impacted by product defects |
|---|
Product defects can occur through our own product development, design and manufacturing processes or through our reliance on third parties for component design and manufacturing activities. We may incur various expenses related to product defects, including product warranty costs, product liability and recall or retrofit costs. While we maintain a reserve for product warranty costs based on certain estimates and our knowledge of current events and actions, our actual warranty costs may exceed our reserve, resulting in current period expenses and a need to increase our reserves for warranty charges. In addition, product defects and recalls may diminish the reputation of our brand. Further, our inability to cure a product defect could result in the failure of a product line or the temporary or permanent withdrawal from a product or market. Any of these events may have a material adverse impact on our financial condition, results of operations and cash flows.
| • | Our operations could be adversely impacted by material price volatility and supplier concentration |
|---|
The market prices for certain raw materials we purchase, primarily steel, have been volatile. Significant increases in the cost of any of the key materials we purchase could increase our cost of doing business and ultimately could lead to lower operating earnings if we are not able to recover these cost increases through price increases to our customers. Historically, there has been a lag in our ability to recover increased material costs from customers, and that lag could negatively impact our profitability. In addition, in some cases we are dependent on a limited number of suppliers for some of the raw materials and components we require in the manufacture of our products. A significant disruption or termination of the supply from one of these suppliers could delay sales or increase costs which could result in a material adverse effect on our financial condition, results of operations and cash flows.
| • | An inability to adequately maintain our information systems and their security and cybersecurity, as well as to protect data and other confidential information, could adversely affect our business and reputation |
|---|
In the ordinary course of business, we utilize information systems for day-to-day operations, to collect and store sensitive data and information, including our proprietary and regulated business information and personally identifiable information of our customers, suppliers and business partners, as well as personally identifiable information about our employees. Our information systems, like those of other companies, are susceptible to outages due to system failures, cybersecurity threats, failures on the part of third-party information system providers, natural disasters, power loss, telecommunications failures, viruses, fraud, theft, malicious insiders or breaches of security. We continue to take steps to maintain and improve data security and address these risks and uncertainties by implementing and improving internal controls, security technologies, insurance programs, network and data center resiliency and recovery processes. However, any operations failure or breach of security from increasingly sophisticated cyber threats could lead to disruptions of our business activities, the loss or disclosure of both our and our customers’ financial, product and other confidential information and could result in regulatory actions and have a material adverse effect on our financial condition, results of operations and cash flows and our reputation.
| • | We are subject to U.S. and global laws and regulations covering our domestic and international operations that could adversely affect our business and results of operations |
|---|
Due to our global operations, we are subject to many laws governing international relations, including those that prohibit improper payments to government officials and restrict where we can do business, what information or products we can supply to certain countries and what information we can provide to a non-U.S. government, including but not limited to the Foreign Corrupt Practices Act and the U.S. Export Administration Act. Violations of these laws may result in criminal penalties or sanctions that could have a material adverse effect on our financial condition, results of operations and cash flows.
| • | Our results of operations may be negatively impacted by product liability lawsuits and claims |
|---|
Our products expose us to potential product liability risks that are inherent in the design, manufacture, sale and use of our products. While we currently maintain what we believe to be suitable product liability insurance, we cannot be certain that we will be able to maintain this insurance on acceptable terms, that this insurance will provide adequate protection against potential liabilities or that our insurance providers will be able to ultimately pay all insured losses. In addition, we self-insure a portion of product liability claims. A series of successful claims against us could materially and adversely affect our reputation and our financial condition, results of operations and cash flows.
Table of Contents
| • | Our success is dependent on developing and retaining highly qualified personnel |
|---|
Attracting and retaining talented employees is important to the continued success and growth of our business. Failure to retain key personnel, particularly on the leadership team, could have a material effect on our business and our ability to execute our business strategies in a timely and effective manner.
| • | Sales growth of our boilers could stall resulting in lower than expected revenues and earnings |
|---|
The compound annual growth rate of our boiler sales has been approximately ten percent per year since our acquisition of Lochinvar in 2011, largely due to the transition in the boiler industry in the U.S. from lower efficiency, non-condensing boilers to higher efficiency, higher priced, condensing boilers, as well as new product introductions. We expect the transition to condensing boilers to continue, but if the transition to higher efficiency, higher priced, condensing boilers stalls as a result of lower energy costs, a U.S. recession occurs, or our competitors’ technologies surpass our technology, our growth rate could be lower than expected.
| • | Potential acquisitions could use a significant portion of our capital and we may not successfully integrate future acquisitions or operate them profitably or achieve strategic objectives |
|---|
We will continue to evaluate potential acquisitions, and we could use a significant portion of our available capital to fund future acquisitions. If we complete any future acquisitions, we may not be able to successfully integrate the acquired businesses or operate them profitably or accomplish our strategic objectives for those acquisitions. If we complete any future acquisitions in new geographies, our unfamiliarity with local regulations and market customs may impact our ability to operate them profitably or achieve our strategic objectives for those acquisitions. Our level of indebtedness may increase in the future if we finance acquisitions with debt, which would cause us to incur additional interest expense and could increase our vulnerability to general adverse economic and industry conditions and limit our ability to service our debt or obtain additional financing. The impact of future acquisitions may have a material adverse effect on our financial condition, results of operations and cash flows.
| • | Our pension plans may require future pension contributions which could limit our flexibility in managing our company |
|---|
The projected benefit obligation liability of our defined benefit pension plans of $834 million exceeded the fair value of the plan assets of $778 million by approximately $56 million at December 31, 2018. U.S. employees hired after January 1, 2010 have not participated in our defined benefit plan, and benefit accruals for the majority of current salaried and hourly employees ended on December 31, 2014. We are forecasting that we will not be required to make a contribution to the plan in 2019, and we do not plan to make any voluntary contributions. However, we cannot provide any assurance that contributions will not be required in the future. Among the key assumptions inherent in our actuarially calculated pension plan obligation and pension plan expense are the discount rate and the expected rate of return on plan assets. If interest rates and actual rates of return on invested plan assets were to decrease significantly, our pension plan obligations could increase materially. The size of future required pension contributions could result in us dedicating a significant portion of our cash flows from operations to making the contributions which could negatively impact our flexibility in managing the company.
| • | We have significant goodwill and indefinite-lived intangible assets and an impairment of our goodwill or indefinite-lived intangible assets could cause a decline in our net worth |
|---|
Our total assets include significant goodwill and indefinite-lived intangible assets. Our goodwill results from our acquisitions, representing the excess of the purchase prices we paid over the fair value of the net tangible and intangible assets we acquired. We assess whether there have been impairments in the value of our goodwill or indefinite-lived intangible assets during the fourth quarter of each calendar year or sooner if triggering events warrant. If future operating performance at our businesses does not meet expectations, we may be required to reflect non-cash charges to operating results for goodwill or indefinite-lived intangible asset impairments. The recognition of an impairment of a significant portion of goodwill or indefinite-lived intangible assets would negatively affect our results of operations and total capitalization, the effect of which could be material. A significant reduction in our stockholders’ equity due to an impairment of goodwill or indefinite-lived intangible assets may affect our ability to maintain the debt-to-capital ratio required under our existing debt arrangements. We have identified the valuation of goodwill and indefinite-lived intangible assets as a critical accounting policy. See “Management’s Discussion and Analysis of Financial Condition and Results of Operations – Critical Accounting Policies—Goodwill and Indefinite-lived Intangible Assets” included in Item 7 of this Annual Report on Form 10-K.
Table of Contents
| • | Certain members of the founding family of our company and trusts for their benefit have the ability to influence all matters requiring stockholder approval |
|---|
We have two classes of common equity: our Common Stock and our Class A Common Stock. The holders of Common Stock currently are entitled, as a class, to elect only one-third of our board of directors. The holders of Class A Common Stock are entitled, as a class, to elect the remaining directors. Certain members of the founding family of our company and trusts for their benefit (Smith Family) have entered into a voting trust agreement with respect to shares of our Class A Common Stock and shares of our Common Stock they own. As of December 31, 2018, through the voting trust, these members of the Smith Family own approximately 62.9 percent of the total voting power of our outstanding shares of Class A Common Stock and Common Stock, taken together as a single class, and approximately 96.5 percent of the voting power of the outstanding shares of our Class A Common Stock, as a separate class. Due to the differences in the voting rights between shares of our Common Stock (one-tenth of one vote per share) and shares of our Class A Common Stock (one vote per share), the Smith Family voting trust is in a position to control to a large extent the outcome of matters requiring a stockholder vote, including the adoption of amendments to our certificate of incorporation or bylaws or approval of transactions involving a change of control. This ownership position may increase if other members of the Smith Family enter into the voting trust agreement, and the voting power relating to this ownership position may increase if shares of our Class A Common Stock held by stockholders who are not parties to the voting trust agreement are converted into shares of our Common Stock. The voting trust agreement provides that, in the event one of the parties to the voting trust agreement wants to withdraw from the trust or transfer any of its shares of our Class A Common Stock, such shares of our Class A Common Stock are automatically exchanged for shares of our Common Stock held by the trust to the extent available in the trust. In addition, the trust will have the right to purchase the shares of our Class A Common Stock and our Common Stock proposed to be withdrawn or transferred from the trust. As a result, the Smith Family members that are parties to the voting trust agreement have the ability to maintain their collective voting rights in our company even if certain members of the Smith Family decide to transfer their shares.
Table of Contents
Item 1B. UNRESOLVED STAFF COMMENTS
None.
Item 2. PROPERTIES
Properties utilized by us at December 31, 2018 were as follows:
North America
In this segment, we have 14 manufacturing plants located in six states and two non-U.S. countries, of which 12 are owned directly by us or our subsidiaries and two are leased from outside parties. The terms of leases in effect at December 31, 2018 expire between 2019 and 2025.
Rest of World
In this segment, we have six manufacturing plants located in four non-U.S. countries, of which four are owned directly by us or our subsidiaries and two are leased from outside parties. The terms of leases in effect at December 31, 2018 expire between 2020 and 2022.
Corporate and General
We consider our plants and other physical properties to be suitable, adequate, and of sufficient productive capacity to meet the requirements of our business. The manufacturing plants operate at varying levels of utilization depending on the type of operation and market conditions. The executive offices of the company, which are leased, are located in Milwaukee, Wisconsin.
Item 3. LEGAL PROCEEDINGS
We are involved in various unresolved legal actions, administrative proceedings and claims in the ordinary course of our business involving product liability, property damage, insurance coverage, exposure to asbestos and other substances, patents and environmental matters, including the disposal of hazardous waste. Although it is not possible to predict with certainty the outcome of these unresolved legal actions or the range of possible loss or recovery, we believe, based on past experience, adequate reserves and insurance availability, that these unresolved legal actions will not have a material effect on our financial position or results of operations. A more detailed discussion of certain of these matters appears in Note 15 of Notes to Consolidated Financial Statements.
Item 4. MINE SAFETY DISCLOSURES
Not applicable.
Table of Contents
EXECUTIVE OFFICERS OF THE COMPANY
Pursuant to General Instruction of G(3) of Form 10-K, the following is a list of our executive officers which is included as an unnumbered Item in Part I of this report in lieu of being included in our Proxy Statement for our 2019 Annual Meeting of Stockholders.
| ** Name (Age)** | Positions Held | Period Position Was Held | ||
| Patricia K. Ackerman (58) | Senior Vice President – Investor Relations, Treasurer and Corporate Responsibility and Sustainability | 2019 to Present | ||
| Vice President – Investor Relations & Treasurer | 2008 to 2018 | |||
| Vice President and Treasurer | 2006 to 2008 | |||
| Assistant Treasurer | 1995 to 2006 | |||
| Paul R. Dana (56) | Senior Vice President – Global Operations | 2019 to Present | ||
| Senior Vice President – Global Manufacturing | 2016 to 2018 | |||
| Vice President – Global Manufacturing | 2015 | |||
| President – APCOM, a division of State Industries, LLC, a subsidiary of the Company | 2011 to 2017 | |||
| Vice President – Product Engineering | 2006 to 2010 | |||
| Plant Manager – Productos de Agua, S. de R.L. de C.V. | 1998 to 2005 | |||
| Anindadeb V. DasGupta (52) | Senior Vice President | 2018 to Present | ||
| President – A. O. Smith Holdings (Barbados) SRL | 2018 to Present | |||
| Vice President, Global Head Strategic Marketing; Global Head e-commerce; Global GM Flex & Signage Business Lines – OSRAM GmbH, Munich and Hong Kong | 2014 to 2018 | |||
| Wei Ding (56) | Senior Vice President | 2013 to Present | ||
| President – A. O. Smith China | 2017 to Present | |||
| President – A. O. Smith (China) Investment Co., Ltd.; General Manager – A. O. Smith (China) Water Heater Co., Ltd. and A. O. Smith (Nanjing) Water Treatment Products Co. Ltd. | 2013 to 2017 | |||
| President and General Manager – A. O. Smith (China) Water Heater Co., Ltd. | 2013 | |||
| Senior Vice President – A. O. Smith Water Products Company | 2011 to 2012 | |||
| Vice President – China – A. O. Smith Water Products Company | 2006 to 2011 | |||
| General Manager – A. O. Smith (China) Water Heater Co., Ltd. | 1999 to 2012 | |||
| Wallace E. Goodwin (63) | Senior Vice President | 2018 to Present | ||
| President and General Manager – Lochinvar, LLC | 2018 to Present | |||
| Senior Vice President and General Manager – Lochinvar, LLC | 2011 to 2017 | |||
| President – APCOM, a division of State Industries, LLC | 1999 to 2011 |
Table of Contents
| ** Name (Age)** | Positions Held | Period Position Was Held | ||
| Robert J. Heideman (52) | Senior Vice President – Chief Technology Officer | 2013 to Present | ||
| Senior Vice President – Engineering & Technology | 2011 to 2012 | |||
| Senior Vice President – Corporate Technology | 2010 to 2011 | |||
| Vice President – Corporate Technology | 2007 to 2010 | |||
| Director – Materials | 2005 to 2007 | |||
| Section Manager | 2002 to 2005 | |||
| D. Samuel Karge (44) | Senior Vice President | 2018 to Present | ||
| President – North America Water Treatment | 2018 to Present | |||
| Vice President, Sales and Marketing – Zurn Industries | 2016 to 2018 | |||
| Vice President & Platform Leader – Pentair Residential Filtration | 2012 to 2016 | |||
| John J. Kita (63) | Executive Vice President and Chief Financial Officer | 2011 to Present | ||
| Senior Vice President, Corporate Finance and Controller | 2006 to 2011 | |||
| Vice President, Treasurer and Controller | 1996 to 2006 | |||
| Treasurer and Controller | 1995 to 1996 | |||
| Assistant Treasurer | 1988 to 1994 | |||
| Charles T. Lauber (56) | Senior Vice President, Strategy and Corporate Development | 2013 to Present | ||
| Senior Vice President – Chief Financial Officer – A. O. Smith Water Products Company | 2006 to 2012 | |||
| Vice President – Global Finance – A. O. Smith Electrical Products Company | 2004 to 2006 | |||
| Vice President and Controller – A. O. Smith Electrical Products Company | 2001 to 2004 | |||
| Director of Audit and Tax | 1999 to 2001 | |||
| Peter R. Martineau (64) | Senior Vice President – Chief Information Officer | 2016 to Present | ||
| Vice President – Business Transformation | 2013 to 2015 | |||
| Vice President – Customer Satisfaction | 2010 to 2012 | |||
| Mark A. Petrarca (55) | Senior Vice President – Human Resources and Public Affairs | 2006 to Present | ||
| Vice President – Human Resources and Public Affairs | 2005 to 2006 | |||
| Vice President – Human Resources – A. O. Smith Water Products Company | 1999 to 2004 | |||
| Ajita G. Rajendra (67) | Executive Chairman | 2018 to Present | ||
| Chairman and Chief Executive Officer | 2017 to 2018 | |||
| Chairman, President and Chief Executive Officer | 2014 to 2017 | |||
| President and Chief Executive Officer | 2013 to 2014 | |||
| President and Chief Operating Officer | 2011 to 2012 | |||
| Executive Vice President | 2006 to 2011 | |||
| President – A. O. Smith Water Products Company | 2005 to 2011 | |||
| Senior Vice President | 2005 to 2007 |
Table of Contents
| ** Name (Age)** | Positions Held | Period Position Was Held | ||
| James F. Stern (56) | Executive Vice President, General Counsel and Secretary | 2007 to Present | ||
| Partner – Foley & Lardner LLP | 1997 to 2007 | |||
| David R. Warren (55) | Senior Vice President | 2017 to Present | ||
| President and General Manager – North America Water Heater | 2017 to Present | |||
| Vice President – International | 2008 to 2017 | |||
| Managing Director – A.O. Smith Water Products Company B.V. | 2004 to 2008 | |||
| Director, Reliance Sales | 2002 to 2004 | |||
| Regional Sales Manager | 1999 to 2002 | |||
| District Sales Manager | 1990 to 1996 | |||
| Sales Coordinator | 1989 to 1990 | |||
| Kevin J. Wheeler (59) | President and Chief Executive Officer | 2018 to Present | ||
| President and Chief Operating Officer | 2017 to 2018 | |||
| Senior Vice President | 2013 to 2017 | |||
| President and General Manager – North America, India and Europe Water Heating | 2013 to 2017 | |||
| Senior Vice President and General Manager – North America, India and Europe – A. O. Smith Water Products Company | 2011 to 2012 | |||
| Senior Vice President and General Manager – U.S. Retail – A. O. Smith Water Products Company | 2007 to 2011 | |||
| Vice President – International – A. O. Smith Water Products Company | 2004 to 2007 | |||
| Managing Director – A. O. Smith Water Products Company B.V. | 1999 to 2004 |
Table of Contents
PART II
Item 5. - MARKET FOR REGISTRANT’S COMMON EQUITY, RELATED STOCKHOLDER MATTERS AND ISSUER PURCHASES OF EQUITY SECURITIES
| (a) | Market Information. Our Common Stock is listed on the New York Stock Exchange under the symbol AOS. Our Class A Common Stock is not listed. EQ Shareowner Services, P.O. Box 64874, St. Paul, Minnesota, 55164-0874 serves as the registrar, stock transfer agent and the dividend reinvestment agent for our Common Stock and Class A Common Stock. |
|---|
| (b) | Holders. As of January 31, 2019, the approximate number of stockholders of record of Common Stock and Class A Common Stock were 613 and 171, respectively. The actual number of stockholders is greater than this number of holders of record, and includes stockholders who are beneficial owners, but whose shares are held in street name by brokers and other nominees. This number of stockholders of record also does not include stockholders whose shares may be held in trust by other entities. |
|---|
| (c) | Dividends. Dividends declared on the common stock are shown in Note 17 of Notes to Consolidated Financial Statements appearing elsewhere herein. |
|---|
| (d) | Stock Repurchases. In the second quarter of 2018, our Board of Directors authorized adding 2,500,000 shares of Common Stock an existing discretionary share repurchase authority. In the fourth quarter of 2018, our Board of Directors authorized adding an additional 5,000,000 shares of Common Stock the existing discretionary share repurchase authority. Under the share repurchase program, we may purchase the Common Stock through a combination of Rule 10b5-1 automatic trading plan and discretionary purchases in accordance with applicable securities laws. The number of shares purchased and the timing of the purchases will depend on a number of factors, including share price, trading volume and general market conditions, as well as working capital requirements, general business conditions and other factors, including alternative investment opportunities. The stock repurchase authorization remains effective until terminated by our Board of Directors which may occur at any time, subject to the parameters of any Rule 10b5-1 automatic trading plan that we may then have in effect. In 2018, we repurchased 3,797,800 shares at an average price of $53.34 per share and at a total cost of $202.6 million. As of December 31, 2018, there were 6,075,253 shares remaining on the existing repurchase authorization. |
|---|
The following table sets forth the number of shares of common stock we repurchased during the fourth quarter of 2018:
| ISSUER PURCHASES OF EQUITY SECURITIES | ||||||||||||||||
| Period | Total Number of Shares Purchased | Average Price Paid per Share | Total Number of Shares Purchased as Part of Publicly Announced Plans or Programs | Maximum Number of Shares that may yet be Purchased Under the Plans or Programs | ||||||||||||
| October 1 – October 31, 2018 | 276,300 | $ | 48.75 | 276,300 | 7,881,253 | |||||||||||
| November 1 – November 30, 2018 | 1,257,200 | 46.53 | 1,257,200 | 6,624,053 | ||||||||||||
| December 1 – December 31, 2018 | 548,800 | 45.09 | 548,800 | 6,075,253 |
| (e) | Performance Graph. The following information in this Item 5 of this Annual Report on Form 10-K is not deemed to be “soliciting material” or to be “filed” with the SEC or subject to Regulation 14A or 14C under the Securities Exchange Act of 1934 or to the liabilities of Section 18 of the Securities Exchange Act of 1934, and will not be deemed to be incorporated by reference into any filing under the Securities Act of 1933 or the Securities Exchange Act of 1934, except to the extent we specifically incorporate it by reference into such a filing. |
|---|
Table of Contents
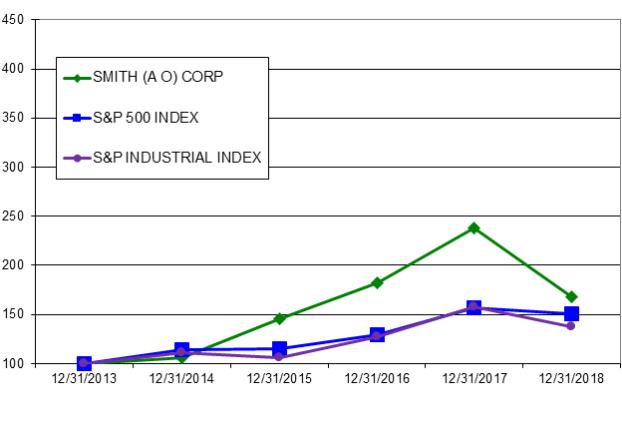
The graph below shows a five-year comparison of the cumulative shareholder return on our Common Stock with the cumulative total return of the Standard & Poor’s (S&P) 500 Index, S&P 500 Select Industrials Index, which are published indices.
Comparison of Five-Year Cumulative Total Return
From December 31, 2013 to December 31, 2018
Assumes $100 Invested with Reinvestment of Dividends
| Base Period | Indexed Returns | |||||||||||||||||||||||
| Company/Index | 12/31/13 | 12/31/14 | 12/31/15 | 12/31/16 | 12/31/17 | 12/31/18 | ||||||||||||||||||
| A. O. Smith Corporation | 100.0 | 105.9 | 145.4 | 181.8 | 237.7 | 167.9 | ||||||||||||||||||
| S&P 500 Index | 100.0 | 113.7 | 115.3 | 129.0 | 157.2 | 150.3 | ||||||||||||||||||
| S&P 500 Select Industrial Index | 100.0 | 110.7 | 106.1 | 127.4 | 158.1 | 137.1 |
Table of Contents
Item 6. SELECTED FINANCIAL DATA
| (dollars in millions, except per share amounts) | ||||||||||||||||||||
| Years ended December 31, | ||||||||||||||||||||
| 2018 | 2017(1) | 2016(2) | 2015 | 2014 | ||||||||||||||||
| Net sales | $ | 3,187.9 | $ | 2,996.7 | $ | 2,685.9 | $ | 2,536.5 | $ | 2,356.0 | ||||||||||
| Net earnings(1) | $ | 444.2 | $ | 296.5 | $ | 326.5 | $ | 282.9 | $ | 207.8 | ||||||||||
| Basic earnings per share of common stock(1,2) | ||||||||||||||||||||
| Net earnings | $ | 2.60 | $ | 1.72 | $ | 1.87 | $ | 1.59 | $ | 1.15 | ||||||||||
| Diluted earnings per share of common stock(1,2) | ||||||||||||||||||||
| Net earnings | $ | 2.58 | $ | 1.70 | $ | 1.85 | $ | 1.58 | $ | 1.14 | ||||||||||
| Cash dividends per common share(2) | $ | 0.76 | $ | 0.56 | $ | 0.48 | $ | 0.38 | $ | 0.30 | ||||||||||
| Years ended December 31 | ||||||||||||||||||||
| 2018 | 2017 | 2016 | 2015 | 2014 | ||||||||||||||||
| Total assets | $ | 3,071.5 | $ | 3,197.4 | $ | 2,891.0 | $ | 2,629.2 | $ | 2,498.1 | ||||||||||
| Long-term debt(3) | 221.4 | 402.9 | 316.4 | 236.1 | 210.1 | |||||||||||||||
| Total stockholders’ equity | 1,717.0 | 1,644.9 | 1,511.4 | 1,442.3 | 1,381.3 |
| (1) | Due to the enactment of the U.S. Tax Cuts & Jobs Act in December 2017, we recorded a one-time charge of $81.8 million in 2017, our estimate of the costs primarily associated with the repatriation of undistributed foreign earnings. These charges reduced 2017 earnings per share by $0.47. |
|---|
| (2) | In September 2016, we declared a 100 percent stock dividend to holders of Common Stock and Class A Common Stock which is not included in cash dividends. Basic and diluted earnings per share are calculated using the weighted average shares outstanding which were restated for all periods presented to reflect the stock dividend. |
|---|
| (3) | Excludes the current portion of long-term debt. |
|---|
Table of Contents
Item 7. MANAGEMENT’S DISCUSSION AND ANALYSIS OF FINANCIAL CONDITION AND RESULTS OF OPERATIONS
OVERVIEW
Our company is comprised of two reporting segments: North America and Rest of World. Our Rest of World segment is primarily comprised of China, Europe and India. Both segments manufacture and market comprehensive lines of residential and commercial gas and electric water heaters, boilers, tanks and water treatment products. Both segments primarily manufacture and market in their respective regions of the world. Our Rest of World segment also manufactures and markets in-home air purification products in China.
In our North America segment, we project our sales in the U.S. will grow in 2019 compared to 2018 due to higher residential water heater and boiler volumes resulting from expected industry-wide new construction growth and expansion of replacement demand. We expect the North America commercial water heater industry to be flat in 2019, after declining over five percent in 2018 following growth of 11 percent in 2017, partially due to an anticipated regulatory change. Our sales of boilers grew nine percent in 2018, and we expect ten percent sales growth in 2019, driven by the continuing U.S. industry transition to higher efficiency products and our introduction of new products. We continued to expand our North America water treatment platform in 2018 by being named exclusive supplier of water treatment products to Lowe’s, with sales commencing in August 2018. We expect sales of North America water treatment products to increase by 35 to 40 percent in 2019, compared to 2018, primarily due to volume growth and a full year of sales to Lowe’s.
In our Rest of World segment, we expect China sales to decline in 2019 at a rate of between seven and 10 percent in U.S. dollars and three to six percent in local currency, as we believe the Chinese economy will continue to be weak and the Chinese currency will depreciate compared to the U.S. dollar by approximately four percent in 2019 compared with 2018. In addition, we expect our sales in India to grow over 30 percent in 2019 from approximately $34 million in 2018.
Combining all of these factors, we expect our consolidated sales to grow one to 2.5 percent and between 2.5 to four percent in local currency terms in 2019.
Our stated acquisition strategy includes a number of our water-related strategic initiatives. We will seek to continue to grow our core residential and commercial water heating, boiler and water treatment businesses throughout the world. We will also continue to look for opportunities to add to our existing operations in high growth regions demonstrated by our introduction of water treatment products in India and Vietnam and air purification products in China in 2015.
RESULTS OF OPERATIONS
Our sales in 2018 were a Company record $3,188 million surpassing 2017 sales of $2,997 million by 6.4 percent. The increase in sales in 2018 was primarily due to pricing actions related to higher steel costs and higher sales of boilers and residential water heaters in the U.S. as well as higher sales of water treatment products in China. Our global water treatment sales grew to approximately $400 million in 2018. Sales in China grew four percent in 2018. Excluding the impact of the appreciation of the U.S. dollar against the Chinese currency, our sales in China increased almost two percent in 2018. Our sales in 2017 were higher than 2016 sales of $2,686 million by 11.6 percent, primarily due to higher sales in China as well as higher sales of water heaters and boilers in North America. Our sales in China grew 15.9 percent in 2017 to over $1 billion, and excluding the impact of the appreciation of the U.S dollar against the Chinese currency, sales in China grew 17.9 percent in 2017 compared to 2016.
Our gross profit margin in 2018 of 41.0 percent was essentially flat compared to our gross profit margin of 41.1 percent in 2017. Our gross profit margin in 2017 decreased from 41.5 percent in 2016. The slightly lower margin in 2017 compared to 2016 was due to significantly higher steel costs that more than offset pricing actions taken in 2017 in North America and China.
Selling, general and administrative (SG&A) expenses were $31.0 million higher in 2018 than in 2017. The increase in SG&A expenses in 2018 to $753.8 million was primarily due to higher advertising expenses related to brand building and higher product development engineering expenses in China. SG&A expenses were $60.3 million higher in 2017 than in 2016 primarily due to higher selling and advertising expenses to support increased volumes and brand building in our newer product categories.
On March 21, 2018, we announced a plan to close our Renton, Washington plant and transfer water heater, boiler and storage tank production to our other U.S. plants. The majority of the consolidation of operations occurred in the second quarter of 2018 and the Renton plant was fully closed in the third quarter of 2018. As a result of the relocation of production, we incurred pre-tax restructuring and impairment expenses of $6.7 million in the first quarter of 2018, primarily related to employee severance and compensation-related costs, building lease exit costs and the impairment of assets. These activities are reflected in “restructuring and impairment expenses” in the accompanying financial statements.
Table of Contents
We are providing non-GAAP measures (adjusted earnings, adjusted earnings per share (EPS), and adjusted segment earnings) that exclude Renton related restructuring and impairment expenses and one-time expenses associated with the U.S. Tax Cuts & Jobs Act (U.S. Tax Reform). Reconciliations to measures on a GAAP basis are provided later in this section.
Interest expense was $8.4 million in 2018 compared to $10.1 million in 2017 and $7.3 million in 2016. Higher interest rates in 2018 were offset by lower debt levels, primarily due to the repatriation of approximately $312 million of cash from outside of the U.S., which was primarily used to pay down floating rate debt, as well as, to fund our share repurchase activity and dividend payments. The higher interest expense in 2017 compared to 2016 was primarily related to higher interest rates as well as higher overall debt levels primarily due to increased share repurchases and acquisitions completed in 2016 and 2017.
Other income was $21.2 million in 2018 compared to $21.3 million in 2017 and $18.1 million in 2016. The increase in other income in 2017 compared to 2016 was primarily due to higher non-service cost related pension income and higher interest income.
Pension income in 2018 was $8.7 million compared to $9.1 million in 2017 and $6.9 million in 2016. The service cost component of our pension income is reflected in cost of products sold and SG&A expenses. All other components of our pension income are reflected in other income.
Our effective income tax rate was 20.4 percent in 2018, compared with 43.1 percent in 2017 and 29.4 percent in 2016. The significant increase in our effective income tax rate in 2017 compared to prior years was due to one-time charges associated with U.S. Tax Reform of $81.8 million, primarily related to the mandatory repatriation tax on undistributed foreign earnings that we are required to pay over eight years. Excluding the impact of the U.S. Tax Reform one-time charges, our adjusted effective income tax rate was 27.4 percent in 2017. Our effective income tax rate in 2018 was lower than our adjusted effective income tax rate in 2017 due to lower federal income taxes related to U.S. Tax Reform. Our adjusted effective income tax rate in 2017 was lower than our effective income tax rate in 2016 primarily due to lower U.S. state income taxes and higher deductions for share-based compensation. We estimate our annual effective income tax rate for the full year 2019 will be approximately 21.5 percent.
North America
Sales in our North America segment were $2,045 million in 2018 or $140 million higher than sales of $1,905 million in 2017. The increase in sales in 2018 compared to 2017 was primarily due to pricing actions related to higher steel costs and higher volumes of boilers and residential water heaters in the U.S. North America water treatment sales, including a full year of sales from Hague and the launch of products at Lowe’s commencing in August 2018, incrementally added approximately $29 million of sales in 2018. Sales in 2017 were $162 million higher than sales of $1,743 million in 2016. The increase in sales in 2017 compared to 2016 was primarily due to higher volumes of water heaters and boilers, price increases in the U.S. for water heaters largely related to steel cost increases as well as our customers’ pre-buy of commercial water heaters in advance of an anticipated 2018 regulatory change. North America water treatment sales, comprised of Hague, acquired in September 2017 and Aquasana, acquired in August 2016, incrementally added approximately $40 million of sales in 2017.
North America segment earnings were $464.1 million in 2018 compared to segment earnings of $428.6 million and $385.9 million in 2017 and 2016, respectively. Segment margins were 22.7 percent, 22.5 percent and 22.1 percent in 2018, 2017 and 2016, respectively. Adjusted segment earnings and segment margin in 2018, which exclude restructuring and impairment expenses, were $470.8 million and 23.0 percent, respectively. The higher adjusted segment earnings and adjusted segment margin in 2018 compared to 2017 were primarily due to the favorable impact from higher sales of residential water heaters and boilers and pricing actions in the U.S. that were partially offset by higher steel costs and one-time expenses associated with the launch of water treatment products at Lowe’s. The higher segment earnings and segment margin in 2017 compared to 2016 were primarily due to higher water heater and boiler volumes and pricing actions which were partially offset by higher steel costs. We estimate our 2019 North America segment margin will be between 23 and 23.5 percent.
Rest of World
Sales in our Rest of World segment in 2018 were $1,174 million or $58 million higher than sales of $1,116 million in 2017. Sales in China grew four percent in 2018 primarily due to higher sales of water treatment products, including consumables, which were partially offset by lower sales of electric water heaters and air purifiers. The appreciation of the U.S. dollar against the Chinese currency contributed approximately $23 million to segment sales in 2018. Excluding the benefit of the U.S. dollar appreciation, sales in China increased 1.9 percent in 2018. Water heater and water treatment sales in India increased $8 million, over 30 percent, in 2018 compared to 2017. Sales in our Rest of World segment in 2017 were $150 million higher than sales of $966 million in 2016. Sales in China grew 15.9 percent to over $1 billion in 2017 due to higher demand for our
Table of Contents
consumer products, led by water treatment and air purification products and pricing actions primarily due to higher steel and installation costs. Excluding the impact from the appreciation of the U.S. dollar in 2017, sales in China increased 17.9 percent. Water heater and water treatment sales in India increased $8 million, over 40 percent, in 2017 compared to 2016.
Rest of World segment earnings were $149.3 million in 2018 compared to segment earnings of $149.3 million and $129.1 million in 2017 and 2016, respectively. Segment margins were 12.7 percent in 2018 compared to 13.4 percent and 13.4 percent in 2017 and 2016, respectively. Segment earnings in 2018 were flat compared to 2017 primarily due to higher water treatment product sales and improved performance in India that were offset by lower sales of electric water heaters and air purifiers as well as higher SG&A expenses. Higher SG&A expenses in China were primarily due to higher advertising expenses related to brand building and higher product development engineering expenses. Segment margin declined in 2018 compared to 2017 as a result of the factors above. Higher segment earnings in 2017 compared to 2016 were primarily due to higher sales in China, which included a price increase, partially offset by higher steel costs, higher fees paid to installers and increased SG&A expenses. Higher SG&A expenses in China were primarily due to the expansion of water treatment and air purification product retail outlets in tier 2 and tier 3 cities, higher advertising expenses related to brand building in our newer product categories and higher water treatment product development engineering costs. We expect our 2019 Rest of World segment margin will be approximately 12 to 12.5 percent due to lower sales and profitability in China.
LIQUIDITY AND CAPITAL RESOURCES
Our working capital was $853.2 million at December 31, 2018 compared with $973.1 million and $791.2 million at December 31, 2017 and December 31, 2016, respectively. Approximately $312 million in foreign cash was repatriated in 2018 and utilized to repay floating rate debt, pay dividends and repurchase shares. The decline in cash, cash equivalents and marketable securities balances more than offset sales-related increases in accounts receivable, and explains the majority of the decline in working capital in 2018. Cash generation in China and sales-related increases in accounts receivable, and inventory levels led to the majority of the increase in working capital in 2017. As of December 31, 2018, essentially all of our $645.0 million of cash, cash equivalents and marketable securities was held by our foreign subsidiaries. We expect to repatriate approximately $150 million in the first half of 2019 and use the proceeds to repay floating rate debt.
Cash provided by operating activities during 2018 was $448.9 million compared with $326.4 million during 2017 and $446.6 million during 2016. The increase in cash flows in 2018 compared to 2017 was primarily due to higher earnings and lower outlays for working capital in 2018. The decline in cash flows in 2017 compared to 2016 was primarily due to higher outlays for working capital than the below normal levels experienced in 2016, which more than offset the impact of higher earnings in 2017.
Our capital expenditures were $85.2 million in 2018, $94.2 million in 2017 and $80.7 million in 2016. We broke ground in 2016 on the construction of a new water treatment and air purification products manufacturing facility in Nanjing, China, to support the expected growth of these products in China. The facility became operational in May 2018. Included in 2018 capital expenditures were approximately $13 million related to capacity expansion in China. Included in 2017 capital expenditures were approximately $24 million related to capacity expansion in China. Included in 2016 capital expenditures were approximately $13 million related to capacity expansion in China as well as approximately $11 million related to the continuation of our enterprise resource planning (ERP) system implementation. For 2019, we project approximately $85 million of capital expenditures and approximately $75 million of depreciation and amortization expense.
In November 2016, we issued $45 million of fixed rate term notes in two tranches to two insurance companies. Principal payments commence in 2023 and 2028 and the notes mature in 2029 and 2034, respectively. The notes carry interest rates of 2.87 and 3.10, respectively. We used proceeds of the notes to pay down borrowings under our revolving credit facility.
In December 2016, we completed a $500 million multi-currency five year revolving credit facility with a group of nine banks. The facility has an accordion provision which allows it to be increased up to $700 million if certain conditions (including lender approval) are satisfied. Borrowing rates under the facility are determined by our leverage ratio. The facility requires us to maintain two financial covenants, a leverage ratio test and an interest coverage test, and we were in compliance with the covenants as of December 31, 2018. The facility backs up commercial paper and credit line borrowings, and it expires on December 15, 2021. As a result of the long-term nature of this facility, the commercial paper and credit line borrowings as well as drawings under the facility are classified as long-term debt.
Table of Contents
At December 31, 2018, we had available borrowing capacity of $398.6 million under this facility. We believe that our combination of cash, available borrowing capacity and operating cash flow will provide sufficient funds to finance our existing operations for the foreseeable future.
Our total debt declined to $221.4 million at December 31, 2018 compared with $410.4 million at December 31, 2017. We repatriated approximately $312 million cash and paid down debt, which was partially offset by share repurchase activity exceeding cash generation in the U.S. As a result, our leverage, as measured by the ratio of total debt to total capitalization, was 11.4 percent at the end of 2018 compared with 19.9 percent at the end of 2017.
Our U.S. pension plan continues to meet all funding requirements under ERISA regulations. We were not required to make a contribution to our pension plan in 2018. We forecast that we will not be required to make a contribution to the plan in 2019, and we do not plan to make any voluntary contributions in 2019. For further information on our pension plans, see Note 12 of the Notes to Consolidated Financial Statements.
In 2018, we repurchased 3,797,800 shares at an average price of $53.34 per share and a total cost of $202.6 million. Our Board of Directors increased the number of shares we are authorized to repurchase by 2,500,000 shares and 5,000,000 shares at its July 2018 and December 2018 meetings, respectively. A total of 6,075,253 shares remained on the existing repurchase authorization at December 31, 2018. Depending on factors such as stock price, working capital requirements and alternative investment opportunities, such as acquisitions, we expect to spend approximately $200 million on share repurchase activity in 2019 using a combination of a 10b5-1 repurchase plan and opportunistic purchases.
We have paid dividends for 79 consecutive years with annual amounts increasing each of the last 27 years. We paid dividends of $0.76 per share in 2018 compared with $0.56 per share in 2017. We increased our dividend rate twice in 2018, and the five year compound annual growth rate of our dividend is approximately 30 percent.
Aggregate Contractual Obligations
A summary of our contractual obligations as of December 31, 2018, is as follows:
| (dollars in millions) | Payments due by period | |||||||||||||||||||
| Contractual Obligations | Total | Less Than 1 year | 1 - 2 Years | 3 - 5 Years | More than 5 years | |||||||||||||||
| Long-term debt | $ | 221.4 | $ | — | $ | 115.0 | $ | 16.9 | $ | 89.5 | ||||||||||
| Fixed rate interest | 30.0 | 4.0 | 7.2 | 6.3 | 12.5 | |||||||||||||||
| Operating leases | 69.1 | 14.8 | 20.0 | 11.0 | 23.3 | |||||||||||||||
| Purchase obligations | 144.0 | 143.6 | 0.4 | — | — | |||||||||||||||
| Pension and post-retirement obligations | 46.8 | 4.7 | 6.7 | 2.1 | 33.3 | |||||||||||||||
| Total | $ | 511.3 | $ | 167.1 | $ | 149.3 | $ | 36.3 | $ | 158.6 | ||||||||||
As of December 31, 2018, our liability for uncertain income tax positions was $8.3 million. Due to the high degree of uncertainty regarding timing of potential future cash flows associated with these liabilities, we are unable to make a reasonably reliable estimate of the amount and period in which these liabilities might be paid.
We utilize blanket purchase orders to communicate expected annual requirements to many of our suppliers. Requirements under blanket purchase orders generally do not become committed until several weeks prior to our scheduled unit production. The purchase obligation amount presented above represents the value of commitments that we consider firm.
Recent Accounting Pronouncements
Refer to Recent Accounting Pronouncements in Note 1 of Notes to Consolidated Financial Statements.
Table of Contents
Critical Accounting Policies
Our accounting policies are described in Note 1 of Notes to Consolidated Financial Statements. Also as disclosed in Note 1, the preparation of financial statements in conformity with accounting principles generally accepted in the U.S. requires the use of estimates and assumptions about future events that affect the amounts reported in the financial statements and accompanying notes. Future events and their effects cannot be determined with absolute certainty. Therefore, the determination of estimates requires the exercise of judgment. Actual results inevitably will differ from those estimates, and such differences may be material to the financial statements.
The most significant accounting estimates inherent in the preparation of our financial statements include estimates associated with the evaluation of the impairment of goodwill and indefinite-lived intangible assets, as well as significant estimates used in the determination of liabilities related to warranty activity, product liability and pensions. Various assumptions and other factors underlie the determination of these significant estimates. The process of determining significant estimates is fact-specific and takes into account factors such as historical experience and trends, and in some cases, actuarial techniques. We monitor these significant factors and adjustments are made as facts and circumstances dictate. Historically, actual results have not significantly deviated from those determined using the estimates described above.
Goodwill and Indefinite-lived Intangible Assets
In conformity with U.S. Generally Accepted Accounting Principles (GAAP), goodwill and indefinite-lived intangible assets are tested for impairment annually or more frequently if events or changes in circumstances indicate that the assets might be impaired. We perform impairment reviews for our reporting units using a fair-value method based on management’s judgments and assumptions. The fair value represents the estimated amount at which a reporting unit could be bought or sold in a current transaction between willing parties on an arm’s-length basis. The estimated fair value is then compared with the carrying amount of the reporting unit, including recorded goodwill. We are subject to financial statement risk to the extent that goodwill and indefinite-lived intangible assets become impaired. Any impairment review is, by its nature, highly judgmental as estimates of future sales, earnings and cash flows are utilized to determine fair values. However, we believe that we conduct thorough and competent annual valuations of goodwill and indefinite-lived intangible assets and that there has been no impairment in goodwill or indefinite-lived assets in 2018.
Product warranty
Our products carry warranties that generally range from one to ten years and are based on terms that are generally accepted in the market. We provide for the estimated cost of product warranty at the time of sale. The product warranty provision is estimated based upon warranty loss experience using actual historical failure rates and estimated costs of product replacement. The variables used in the calculation of the provision are reviewed at least annually. At times, warranty issues may arise which are beyond the scope of our historical experience. We provide for any such warranty issues as they become known and estimable. While our warranty costs have historically been within calculated estimates, it is possible that future warranty costs could differ significantly from those estimates. The allocation of the warranty liability between current and long-term is based on the expected warranty liability to be paid in the next year as determined by historical product failure rates. At December 31, 2018 and 2017, our reserve for product warranties was $139.3 million and $141.2 million, respectively.
Product liability
Due to the nature of our products, we are subject to product liability claims in the normal course of business. We maintain insurance to reduce our risk. Most insurance coverage includes self-insured retentions that vary by year. In 2018, we maintained a self-insured retention of $7.5 million per occurrence with an aggregate insurance limit of $125.0 million.
We establish product liability reserves for our self-insured retention portion of any known outstanding matters based on the likelihood of loss and our ability to reasonably estimate such loss. There is inherent uncertainty as to the eventual resolution of unsettled matters due to the unpredictable nature of litigation. We make estimates based on available information and our best judgment after consultation with appropriate advisors and experts. We periodically revise estimates based upon changes to facts or circumstances. We also utilize an actuary to calculate reserves required for estimated incurred but not reported claims as well as to estimate the effect of adverse development of claims over time. At December 31, 2018 and 2017, our reserve for product liability was $39.3 million and $40.1 million, respectively.
Table of Contents
Pensions
We have significant pension benefit costs that are developed from actuarial valuations. The valuations reflect key assumptions regarding, among other things, discount rates, expected return on plan assets, retirement ages, and years of service. Consideration is given to current market conditions, including changes in interest rates in making these assumptions. Our assumption for the expected return on plan assets was 7.15 percent in 2018 and 7.50 percent in 2017. The discount rate used to determine net periodic pension costs decreased to 3.65 percent in 2018 from 4.15 percent in 2017. For 2019, our expected return on plan assets is 7.15 percent and our discount rate is 4.32 percent.
In developing our expected return on plan assets, we evaluate our pension plan’s current and target asset allocation, the expected long-term rates of return of equity and bond indices and the actual historical returns of our pension plan. Our plan’s target allocation to equity managers is approximately 30 to 60 percent, with the remainder allocated primarily to bond managers, private equity managers and real estate managers. Our actual asset allocation as of December 31, 2018, was 40 percent to equity managers, 48 percent to bond managers, 10 percent to real estate managers, and two percent to private equity managers. We regularly review our actual asset allocation and periodically rebalance our investments to our targeted allocation when considered appropriate. Our pension plan’s historical ten-year and 25-year compounded annualized returns are 8.9 percent and 8.5 percent, respectively. We believe that with our target allocation and the expected long-term returns of equity and bond indices as well as our actual historical returns, our 7.15 percent expected return on plan assets for 2019 is reasonable.
The discount rate assumptions used to determine future pension obligations at December 31, 2018 and 2017 were based on the Aon AA Only Above Median yield curve, which was designed by Aon to provide a means for plan sponsors to value the liabilities of their postretirement benefit plans. The AA Only Above Median yield curve represents a series of annual discount rates from bonds with AA minimum average rating as rated by Moody’s Investor Service, Standard & Poor’s and Fitch Ratings. We will continue to evaluate our actuarial assumptions at least annually, and we will adjust the assumptions as necessary.
We recognized pension income of $8.7 million, $9.1 million, and $6.9 million in 2018, 2017, and 2016, respectively.
Costs associated with our replacement retirement plan in 2018 were approximately $6 million, consistent with 2017. We made changes to our pension plan including closing the plan to new entrants effective January 1, 2010, and the sunset of our plan for the majority of our employees on December 31, 2014. Lowering the expected return on plan assets by 25 basis points would decrease our net pension income for 2018 by approximately $2.0 million. Lowering the discount rate by 25 basis points would increase our 2018 net pension income by approximately $0.1 million.
Non-GAAP Measures
We provide non-GAAP measures (adjusted earnings, adjusted earnings per share (EPS) and adjusted segment earnings) that exclude restructuring and impairment expenses in 2018 and the impact of a one-time charge associated with U.S. Tax Reform in 2017.
We believe that the measures of adjusted earnings, adjusted EPS and adjusted segment earnings provide useful information to investors about our performance and allow management and our investors to better compare our performance year over year.
Table of Contents
A. O. SMITH CORPORATION
Adjusted Earnings and Adjusted EPS
(dollars in millions, except per share data)
(unaudited)
The following is a reconciliation of net earnings and diluted earnings per share (EPS) to adjusted earnings (non-GAAP) and adjusted EPS (non-GAAP):
| Years ended December 31, | ||||||||
| 2018 | 2017 | |||||||
| Net Earnings (GAAP) | $ | 444.2 | $ | 296.5 | ||||
| Restructuring and impairment expenses, before tax(1) | 6.7 | — | ||||||
| Tax effect of restructuring and impairment expenses | (1.7 | ) | — | |||||
| U.S. Tax Reform income tax expense(2) | — | 81.8 | ||||||
| Adjusted Earnings | $ | 449.2 | $ | 378.3 | ||||
| Diluted EPS (GAAP) | $ | 2.58 | $ | 1.70 | ||||
| Restructuring and impairment expenses per diluted share(1) | 0.4 | $ | — | |||||
| Tax effect of restructuring and impairment expenses per diluted share | (0.1 | ) | — | |||||
| U.S. Tax Reform income tax expense(2) | — | 0.47 | ||||||
| Adjusted EPS | $ | 2.61 | $ | 2.17 | ||||
The following is a reconciliation of reported segment earnings to adjusted segment earnings (non-GAAP):
| Years ended December 31, | ||||||||
| 2018 | 2017 | |||||||
| Segment Earnings (GAAP) | ||||||||
| North America | $ | 464.1 | $ | 428.6 | ||||
| Rest of World | 149.3 | 149.3 | ||||||
| Total Segment Earnings (GAAP) | $ | 613.4 | $ | 577.9 | ||||
| Adjustments | ||||||||
| North America (1) | $ | 6.7 | $ | — | ||||
| Rest of World | — | — | ||||||
| Total Adjustments | $ | 6.7 | $ | — | ||||
| Adjusted Segment Earnings | ||||||||
| North America | $ | 470.8 | $ | 428.6 | ||||
| Rest of World | 149.3 | 149.3 | ||||||
| Total Adjusted Segment Earnings | $ | 620.1 | $ | 577.9 | ||||
| (1) | We recognized $6.7 million of restructuring and impairment expenses in connection with the move of manufacturing operations from our Renton, Washington facility to other U.S. facilities. For additional information, see Note 4 of Notes to Consolidated Financial Statements. |
|---|
| (2) | Excluding the impact of one-time U.S. Tax Reform charges, our 2017 adjusted effective income tax rate was 27.4 percent as compared to our effective income tax rate of 43.1 percent in 2017. For additional information, see Note 14 of Notes to Consolidated Financial Statements. |
|---|
Outlook
We expect continued strong boiler and residential water heater sales in North America in 2019. We project that sales in China will decline by seven to ten percent in U.S. dollar terms and three to six percent in local currency in 2019. The decrease is due to our expectation of relatively flat consumer demand in China and without the increase of the channel inventory build in China that we experienced primarily in the first quarter of 2018 which we estimate was at least five percent of 2018 China sales. As a result, we expect our consolidated sales to grow one to 2.5 percent and between 2.5 to four percent in local currency terms in 2019. We expect to achieve full-year earnings of between $2.67 and $2.77 per share, which excludes the potential impact from future acquisitions.
Table of Contents
OTHER MATTERS
Environmental
Our operations are governed by a number of federal, foreign, state, local and environmental laws concerning the generation and management of hazardous materials, the discharge of pollutants into the environment and remediation of sites owned by the company or third parties. We have expended financial and managerial resources complying with such laws. Expenditures related to environmental matters were not material in 2018 and we do not expect them to be material in any single year. We have reserves associated with environmental obligations at various facilities and we believe these reserves together with available insurance coverage are sufficient to cover reasonably anticipated remediation costs. Although we believe that our operations are substantially in compliance with such laws and maintain procedures designed to maintain compliance, there are no assurances that substantial additional costs for compliance will not be incurred in the future. However, since the same laws govern our competitors, we should not be placed at a competitive disadvantage.
Market Risk
We are exposed to various types of market risks, primarily currency. We monitor our risks in such areas on a continuous basis and generally enter into forward contracts to minimize such exposures for periods of less than one year. We do not engage in speculation in our derivatives strategies. Further discussion regarding derivative instruments is contained in Note 1 of Notes to Consolidated Financial Statements.
We enter into foreign currency forward contracts to minimize the effect of fluctuating foreign currencies. At December 31, 2018, we had net foreign currency contracts outstanding with notional values of $210.9 million. Assuming a hypothetical ten percent movement in the respective currencies, the potential foreign exchange gain or loss associated with the change in exchange rates would amount to $21.1 million. However, gains and losses from our forward contracts will be offset by gains and losses in the underlying transactions being hedged.
Our earnings exposure related to movements in interest rates is primarily derived from outstanding floating-rate debt instruments that are determined by short-term money market rates. At December 31, 2018, we had $101.4 million in outstanding floating-rate debt with a weighted-average interest rate of 2.9 percent at year end. A hypothetical ten percent annual increase or decrease in the year-end average cost of our outstanding floating-rate debt would result in a change in annual pre-tax interest expense of approximately $0.3 million.
Forward-Looking Statements
This filing contains statements that we believe are “forward-looking statements” within the meaning of the Private Securities Litigation Reform Act of 1995. Forward-looking statements generally can be identified by the use of words such as “may,” “will,” “expect,” “intend,” “estimate,” “anticipate,” “believe,” “forecast,” “guidance” or words of similar meaning. All forward-looking statements are subject to risks and uncertainties that could cause actual results to differ materially from those anticipated as of the date of this filing. Important factors that could cause actual results to differ materially from these expectations include, among other things, the following: a further weakening of the Chinese economy and/or a further decline in the growth rate of consumer spending or housing sales in China; negative impact to our businesses from international tariffs and trade disputes; potential weakening in the high efficiency boiler segment in the U.S.; significant volatility in raw material prices; our inability to implement or maintain pricing actions; potential weakening in U.S. residential or commercial construction or instability in our replacement markets; foreign currency fluctuations; our inability to successfully integrate or achieve our strategic objectives resulting from acquisitions; competitive pressures on our businesses; the impacts of potential information technology or data security breaches; changes in government regulations or regulatory requirements; and adverse developments in general economic, political and business conditions in key regions of the world. Forward-looking statements included in this filing are made only as of the date of this filing, and we are under no obligation to update these statements to reflect subsequent events or circumstances. All subsequent written and oral forward-looking statements attributed to the Company, or persons acting on our behalf, are qualified entirely by these cautionary statements.
Item 7A. QUANTITATIVE AND QUALITATIVE DISCLOSURES ABOUT MARKET RISK
See “Market Risk” above.
Table of Contents
Item 8. FINANCIAL STATEMENTS AND SUPPLEMENTARY DATA
REPORT OF INDEPENDENT REGISTERED PUBLIC ACCOUNTING FIRM
The Board of Directors and Stockholders
A. O. Smith Corporation
Opinion on the Financial Statements
We have audited the accompanying consolidated balance sheets of A. O. Smith Corporation (the Company) as of December 31, 2018 and 2017, the related consolidated statements of earnings, comprehensive earnings, stockholders’ equity and cash flows for each of the three years in the period ended December 31, 2018, and the related notes and financial statement schedule listed in the index at Item 15(a) (collectively referred to as the “consolidated financial statements”). In our opinion, the consolidated financial statements present fairly, in all material respects, the financial position of the Company at December 31, 2018 and 2017, and the results of its operations and its cash flows for each of the three years in the period ended December 31, 2018, in conformity with U.S. generally accepted accounting principles.
We also have audited, in accordance with the standards of the Public Company Accounting Oversight Board (United States) (PCAOB), the Company’s internal control over financial reporting as of December 31, 2018, based on criteria established in Internal Control—Integrated Framework issued by the Committee of Sponsoring Organizations of the Treadway Commission (2013 framework) and our report dated February 15, 2019 expressed an unqualified opinion thereon.
Basis for Opinion
These financial statements are the responsibility of the Company’s management. Our responsibility is to express an opinion on the Company’s financial statements based on our audits. We are a public accounting firm registered with the PCAOB and are required to be independent with respect to the Company in accordance with the U.S. federal securities laws and the applicable rules and regulations of the Securities and Exchange Commission and the PCAOB.
We conducted our audits in accordance with the standards of the PCAOB. Those standards require that we plan and perform the audit to obtain reasonable assurance about whether the financial statements are free of material misstatement, whether due to error or fraud. Our audits included performing procedures to assess the risks of material misstatement of the financial statements, whether due to error or fraud, and performing procedures that respond to those risks. Such procedures include examining, on a test basis, evidence regarding the amounts and disclosures in the financial statements. Our audits also included evaluating the accounting principles used and significant estimates made by management, as well as evaluating the overall presentation of the financial statements. We believe that our audits provide a reasonable basis for our opinion.
/s/ Ernst & Young LLP
We have served as A. O. Smith Corporation’s auditor since 1917.
Milwaukee, Wisconsin
February 15, 2019
Table of Contents
CONSOLIDATED BALANCE SHEETS
| December 31 (dollars in millions) | ||||||||
| 2018 | 2017 | |||||||
| Assets | ||||||||
| Current Assets | ||||||||
| Cash and cash equivalents | $ | 259.7 | $ | 346.6 | ||||
| Marketable securities | 385.3 | 473.4 | ||||||
| Receivables | 647.3 | 592.7 | ||||||
| Inventories | 304.7 | 297.0 | ||||||
| Other current assets | 41.5 | 57.2 | ||||||
| Total Current Assets | 1,638.5 | 1,766.9 | ||||||
| Net property, plant and equipment | 540.0 | 528.9 | ||||||
| Goodwill | 513.0 | 516.7 | ||||||
| Other intangibles | 293.1 | 308.7 | ||||||
| Other assets | 86.9 | 76.2 | ||||||
| Total Assets | $ | 3,071.5 | $ | 3,197.4 | ||||
| Liabilities | ||||||||
| Current Liabilities | ||||||||
| Trade payables | $ | 543.8 | $ | 535.0 | ||||
| Accrued payroll and benefits | 79.4 | 90.8 | ||||||
| Accrued liabilities | 120.4 | 116.0 | ||||||
| Product warranties | 41.7 | 44.5 | ||||||
| Long-term debt due within one year | — | 7.5 | ||||||
| Total Current Liabilities | 785.3 | 793.8 | ||||||
| Long-term debt | 221.4 | 402.9 | ||||||
| Product warranties | 97.7 | 97.9 | ||||||
| Pension liabilities | 49.4 | 48.1 | ||||||
| Other liabilities | 200.7 | 209.8 | ||||||
| Total Liabilities | 1,354.5 | 1,552.5 | ||||||
| Commitments and contingencies | — | — | ||||||
| Stockholders’ Equity | ||||||||
| Preferred Stock | — | — | ||||||
| Class A Common Stock (shares issued 26,191,327 and 26,239,559) | 131.0 | 131.2 | ||||||
| Common Stock (shares issued 164,516,267 and 164,468,033) | 164.5 | 164.5 | ||||||
| Capital in excess of par value | 496.7 | 486.5 | ||||||
| Retained earnings | 2,102.8 | 1,788.7 | ||||||
| Accumulated other comprehensive loss | (350.8 | ) | (299.5 | ) | ||||
| Treasury stock at cost | (827.2 | ) | (626.5 | ) | ||||
| Total Stockholders’ Equity | 1,717.0 | 1,644.9 | ||||||
| Total Liabilities and Stockholders’ Equity | $ | 3,071.5 | $ | 3,197.4 | ||||
See accompanying notes which are an integral part of these statements.
Table of Contents
CONSOLIDATED STATEMENT OF EARNINGS
| Years ended December 31 (dollars in millions, except per share amounts) | ||||||||||||
| 2018 | 2017 | 2016 | ||||||||||
| Net sales | $ | 3,187.9 | $ | 2,996.7 | $ | 2,685.9 | ||||||
| Cost of products sold | 1,882.4 | 1,764.3 | 1,571.7 | |||||||||
| Gross profit | 1,305.5 | 1,232.4 | 1,114.2 | |||||||||
| Selling, general and administrative expenses | 753.8 | 722.8 | 662.5 | |||||||||
| Restructuring and impairment expenses | 6.7 | — | — | |||||||||
| Interest expense | 8.4 | 10.1 | 7.3 | |||||||||
| Other income - net | (21.2 | ) | (21.3 | ) | (18.1 | ) | ||||||
| Earnings before provision for income taxes | 557.8 | 520.8 | 462.5 | |||||||||
| Provision for income taxes | 113.6 | 224.3 | 136.0 | |||||||||
| Net Earnings | $ | 444.2 | $ | 296.5 | $ | 326.5 | ||||||
| Net Earnings Per Share of Common Stock | $ | 2.60 | $ | 1.72 | $ | 1.87 | ||||||
| Diluted Net Earnings Per Share of Common Stock | $ | 2.58 | $ | 1.70 | $ | 1.85 | ||||||
| CONSOLIDATED STATEMENT OF COMPREHENSIVE EARNINGS | ||||||||||||
| Years ended December 31 (dollars in millions) | ||||||||||||
| 2018 | 2017 | 2016 | ||||||||||
| Net Earnings | $ | 444.2 | $ | 296.5 | $ | 326.5 | ||||||
| Other comprehensive earnings (loss) | ||||||||||||
| Foreign currency translation adjustments | (38.4 | ) | 52.7 | (39.8 | ) | |||||||
| Unrealized net gain (loss) on cash flow derivative instruments, less related income tax |
Showing the first 8K of 125K characters. Open the full section
Item 9. CHANGES IN AND DISAGREEMENTS WITH ACCOUNTANTS ON ACCOUNTING AND FINANCIAL DISCLOSURE
None.
Item 9A. CONTROLS AND PROCEDURES
Evaluation of Disclosure Controls and Procedures
Our management, with the participation of our Chief Executive Officer and Chief Financial Officer, has evaluated the effectiveness of our disclosure controls and procedures (as such term is defined in Rules 13a-15(e) under the Securities Exchange Act of 1934, as amended (“the Exchange Act”) as of the end of the period covered by this report. Based on such evaluations, our Chief Executive Officer and Chief Financial Officer have concluded that, as of the end of such period our disclosure controls and procedures are effective in recording, processing, summarizing, and reporting, on a timely basis, information required to be disclosed by us in the reports that we file or submit under the Exchange Act, and that information is accumulated and communicated to the Chief Executive Officer and Chief Financial Officer, as appropriate, to allow timely discussions regarding required disclosure.
Management Report on Internal Control Over Financial Reporting
Our management is responsible for establishing and maintaining adequate internal control over financial reporting, as such term is defined in Exchange Act Rule 13a-15(f). Our management, with the participation of our Chief Executive Officer and Chief Financial Officer, has evaluated the effectiveness of our internal control over financial reporting based on the Internal Control-Integrated Framework issued by the Committee of Sponsoring Organizations of the Treadway Commission (2013 framework). Based on this evaluation, our management has concluded that, as of December 31, 2018, our internal control over financial reporting was effective.
Because of its inherent limitations, internal control over financial reporting may not prevent or detect misstatements. Also, projections of any evaluation of effectiveness to future periods are subject to risk that controls may become inadequate because of changes in conditions, or that the degree of compliance with the policies or procedures may deteriorate.
Ernst & Young LLP, an independent registered public accounting firm, has audited our consolidated financial statements and the effectiveness of internal controls over financial reporting as of December 31, 2018 as stated in their report which is included herein.
Changes in Internal Control Over Financial Reporting
There have not been any change in the company’s internal control over financial reporting (as such term is defined in Rules 13a-15(f) and 15d-15(f) under the Securities and Exchange Act) during the year ended December 31, 2018 that have materially affected, or are reasonably likely to materially affect, our internal control over financial reporting.
Item 9B. OTHER INFORMATION
None
Table of Contents
REPORT OF INDEPENDENT REGISTERED PUBLIC ACCOUNTING FIRM
The Board of Directors and Stockholders
A. O. Smith Corporation
Opinion on Internal Control over Financial Reporting
We have audited A. O. Smith Corporation’s internal control over financial reporting as of December 31, 2018, based on criteria established in Internal Control—Integrated Framework issued by the Committee of Sponsoring Organizations of the Treadway Commission (2013 framework) (the COSO criteria). In our opinion, A. O. Smith Corporation (the Company) maintained, in all material respects, effective internal control over financial reporting as of December 31, 2018, based on the COSO criteria.
We also have audited, in accordance with the standards of the Public Company Accounting Oversight Board (United States) (PCAOB), the consolidated balance sheets of A. O. Smith Corporation as of December 31, 2018 and 2017, and the related consolidated statements of earnings, comprehensive earnings, stockholders’ equity, and cash flows for each of the three years in the period ended December 31, 2018, and the related notes and financial statement schedule listed in the index at Item 15(a) and our report dated February 15, 2019 expressed an unqualified opinion thereon.
Basis for Opinion
The Company’s management is responsible for maintaining effective internal control over financial reporting and for its assessment of the effectiveness of internal control over financial reporting included in the accompanying Management Report on Internal Control over Financial Reporting. Our responsibility is to express an opinion on the Company’s internal control over financial reporting based on our audit. We are a public accounting firm registered with the PCAOB and are required to be independent with respect to the Company in accordance with the U.S. federal securities laws and the applicable rules and regulations of the Securities and Exchange Commission and the PCAOB.
We conducted our audit in accordance with the standards of the PCAOB. Those standards require that we plan and perform the audit to obtain reasonable assurance about whether effective internal control over financial reporting was maintained in all material respects.
Our audit included obtaining an understanding of internal control over financial reporting, assessing the risk that a material weakness exists, testing and evaluating the design and operating effectiveness of internal control based on the assessed risk, and performing such other procedures as we considered necessary in the circumstances. We believe that our audit provides a reasonable basis for our opinion.
Definition and Limitations of Internal Control Over Financial Reporting
A company’s internal control over financial reporting is a process designed to provide reasonable assurance regarding the reliability of financial reporting and the preparation of financial statements for external purposes in accordance with generally accepted accounting principles. A company’s internal control over financial reporting includes those policies and procedures that (1) pertain to the maintenance of records that, in reasonable detail, accurately and fairly reflect the transactions and dispositions of the assets of the company; (2) provide reasonable assurance that transactions are recorded as necessary to permit preparation of financial statements in accordance with generally accepted accounting principles, and that receipts and expenditures of the company are being made only in accordance with authorizations of management and directors of the company; and (3) provide reasonable assurance regarding prevention or timely detection of unauthorized acquisition, use, or disposition of the company’s assets that could have a material effect on the financial statements.
Because of its inherent limitations, internal control over financial reporting may not prevent or detect misstatements. Also, projections of any evaluation of effectiveness to future periods are subject to the risk that controls may become inadequate because of changes in conditions, or that the degree of compliance with the policies or procedures may deteriorate.
/s/ Ernst & Young LLP
Milwaukee, Wisconsin
February 15, 2019
Table of Contents
PART III
Item 10. DIRECTORS, EXECUTIVE OFFICERS AND CORPORATE GOVERNANCE
The information included under the headings “Election of Directors” and “Board Committees” in our definitive Proxy Statement for the 2019 Annual Meeting of Stockholders (to be filed with the Securities and Exchange Commission (SEC) under Regulation 14A within 120 days after the end of the registrant’s fiscal year) is incorporated herein by reference. The information required regarding Executive Officers of the company is included in Part I of this Annual Report on Form 10-K under the caption “Executive Officers of the Company.”
We have a separately designated Audit Committee on which Gene C. Wulf, Dr. Ilham Kadri, Mark D. Smith and Idelle K. Wolf serve, with Mr. Wulf, as Chairperson. All members are independent under applicable SEC and New York Stock Exchange rules; the Board of Directors of the company has concluded that Ms. Wolf and Mr. Wulf are “audit committee financial experts” in accordance with SEC rules.
We have adopted a Financial Code of Ethics applicable to our principal executive officer, principal financial officer and principal accounting officer. As a best practice, this code has been executed by key financial and accounting personnel as well. In addition, we have adopted a general code of business conduct for our directors, officers and all employees, which is known as the A. O. Smith Guiding Principles. The Financial Code of Ethics, the A. O. Smith Guiding Principles and other company corporate governance matters are available on our website at www.aosmith.com. We are not including the information contained on our website as a part of or incorporating it by reference into, this Form 10-K. We intend to disclose on this website any amendments to, or waivers from, the Financial Code of Ethics or the A. O. Smith Guiding Principles that are required to be disclosed pursuant to SEC rules. There have been no waivers of the Financial Code of Ethics or the A. O. Smith Guiding Principles. Stockholders may obtain copies of any of these corporate governance documents free of charge by writing to the Corporate Secretary at the address on the cover page of this Form 10-K.
The information included under the heading “Compliance with Section 16(a) of the Securities Exchange Act” in our definitive Proxy Statement for the 2019 Annual Meeting of Stockholders (to be filed with the SEC under Regulation 14A within 120 days after the end of the registrant’s fiscal year) is incorporated herein by reference.
Item 11. EXECUTIVE COMPENSATION
The information included under the headings “Executive Compensation,” “Director Compensation,” “Report of the Personnel and Compensation Committee” and “Compensation Committee Interlocks and Insider Participation” in the company’s definitive Proxy Statement for the 2019 Annual Meeting of Stockholders (to be filed with the SEC under Regulation 14A within 120 days after the end of the registrant’s fiscal year) is incorporated herein by reference.
Item 12. SECURITY OWNERSHIP OF CERTAIN BENEFICIAL OWNERS AND MANAGEMENT AND RELATED STOCKHOLDER MATTERS
The information included under the headings “Principal Stockholders” and “Security Ownership of Directors and Management” in our definitive Proxy Statement for the 2019 Annual Meeting of Stockholders (to be filed with the SEC under Regulation 14A within 120 days after the end of the registrant’s fiscal year) is incorporated herein by reference.
Table of Contents
Equity Compensation Plan Information
The following table provides information about our equity compensation plans as of December 31, 2018.
| Plan Category | Number of securities to be issued upon the exercise of outstanding options, warrants and rights | Weighted-average exercise price of outstanding options, warrants and rights | Number of securities remaining available for future issuance under equity compensation plans (excluding securities reflected in the first column) | |||||||||
| Equity compensation plans approved by security holders | 3,043,065 | (1) | $ | 33.05 | (2) | 2,490,644 | (3) | |||||
| Equity compensation plans not approved by security holders | — | — | — | |||||||||
| Total | 3,043,065 | $ | 33.05 | 2,490,644 | ||||||||
| (1) | Consists of 2,432,689 shares subject to stock options, 325,778 shares subject to employee share units and 284,598 shares subject to director share units. |
|---|
| (2) | Represents the weighted average exercise price of outstanding options and does not take into account outstanding share units. |
|---|
| (3) | Represents securities remaining available for issuance under the A. O. Smith Combined Incentive Compensation Plan. If any awards lapse, expire, terminate or are cancelled without issuance of shares, or shares are forfeited under any award, then such shares will become available for issuance under the A. O. Smith Combined Incentive Compensation Plan, hereby increasing the number of securities remaining available. |
|---|
Item 13. CERTAIN RELATIONSHIPS, RELATED TRANSACTIONS AND DIRECTOR INDEPENDENCE
The information included under the headings “Director Independence and Financial Literacy”, “Compensation Committee Interlocks and Insider Participation” and “Procedure for Review of Related Party Transactions” in our definitive Proxy Statement for the 2019 Annual Meeting of Stockholders (to be filed with the SEC under Regulation 14A within 120 days after the end of the registrant’s fiscal year) is incorporated herein by reference.
Item 14. PRINCIPAL ACCOUNTANT FEES AND SERVICES
The information included under the heading “Report of the Audit Committee” in our definitive Proxy Statement for the 2019 Annual Meeting of Stockholders (to be filed with the SEC under Regulation 14A within 120 days after the end of the registrant’s fiscal year) required by this Item 14 is incorporated herein by reference.
Table of Contents
PART IV
Item 15. - EXHIBITS, FINANCIAL STATEMENT SCHEDULES
| (a) | The following documents are filed as part of this Annual Report on Form 10-K: |
|---|
- Financial Statements of the Company
Form 10-K
Page Number
The following consolidated financial statements of A. O. Smith Corporation are included in Item 8:
| Consolidated Balance Sheets at December 31, 2018 and 2017 | 27 | |||
| For each of the three years in the period ended December 31, 2018: - Consolidated Statement of Earnings | 28 | |||
| - Consolidated Statement of Comprehensive Earnings | 28 | |||
| - Consolidated Statement of Cash Flows | 29 | |||
| - Consolidated Statement of Stockholders’ Equity | 30 | |||
| Notes to Consolidated Financial Statements | 31 - 57 | |||
| 2. | Financial Statement Schedules | |||
| Schedule II - Valuation and Qualifying Accounts | 66 | |||
| Schedules not included have been omitted because they are not applicable. |
| 3. | Exhibits - see the Index to Exhibits on pages 63 - 64 of this report. Each management contract or compensatory plan or arrangement required to be filed as an exhibit to this report on Form 10-K are listed as Exhibits 10(a) through 10(m) in the Index to Exhibits. |
|---|
Pursuant to the requirements of Rule 14a-3(b)(10) of the Securities Exchange Act of 1934, as amended, we will, upon request and upon payment of a reasonable fee not to exceed the rate at which such copies are available from the SEC, furnish copies to our security holders of any exhibits listed in the Index to Exhibits.
Table of Contents
INDEX TO EXHIBITS
Table of Contents
INDEX TO EXHIBITS (continued)
Table of Contents
SIGNATURES
Pursuant to the requirements of Section 13 or 15(d) of the Securities Exchange Act of 1934, the registrant has duly caused this report to be signed on behalf of the undersigned, thereunto duly authorized.
| A. O. SMITH CORPORATION | ||||||
| Date: February 15, 2019 | By: | /s/ Ajita G. Rajendra | ||||
| Ajita G. Rajendra | ||||||
| Executive Chairman of the Board of Directors |
Pursuant to the requirements of the Securities Exchange Act of 1934, this report has been signed below as of February 15, 2019 by the following persons on behalf of the registrant and in the capacities and on the dates indicated.
| Name and Title | Signature | |||
| AJITA G. RAJENDRA | /s/ Ajita G. Rajendra | |||
| Executive Chairman of the Board of Directors | Ajita G. Rajendra | |||
| KEVIN J. WHEELER | /s/ Kevin J. Wheeler | |||
| Director | Kevin J. Wheeler | |||
| President and Chief Executive Officer | ||||
| JOHN J. KITA | /s/ John J. Kita | |||
| Executive Vice President and Chief Financial Officer | John J. Kita | |||
| DANIEL L. KEMPKEN | /s/ Daniel L. Kempken | |||
| Vice President and Controller | Daniel L. Kempken | |||
| RONALD D. BROWN | /s/ Ronald D. Brown | |||
| Director | Ronald D. Brown | |||
| WILLIAM P. GREUBEL | /s/ William P. Greubel | |||
| Director | William P. Greubel | |||
| PAUL W. JONES | /s/ Paul W. Jones | |||
| Director | Paul W. Jones | |||
| DR. ILHAM KADRI | /s/ Dr. Ilham Kadri | |||
| Director | Dr. Ilham Kadri | |||
| BRUCE M. SMITH | /s/ Bruce M. Smith | |||
| Director | Bruce M. Smith | |||
| MARK D. SMITH | /s/ Mark D. Smith | |||
| Director | Mark D. Smith | |||
| IDELLE K. WOLF | /s/ Idelle K. Wolf | |||
| Director | Idelle K. Wolf | |||
| GENE C. WULF | /s/ Gene C. Wulf | |||
| Director | Gene C. Wulf |
Table of Contents
A. O. SMITH CORPORATION
SCHEDULE II - VALUATION AND QUALIFYING ACCOUNTS
(Dollars in millions)
Years ended December 31, 2018, 2017 and 2016
| Description | Balance at Beginning of Year | Charged to Costs and Expenses | Acquisition of Businesses | Deductions | Balance at End of Year | |||||||||||||||
| 2018: | ||||||||||||||||||||
| Valuation allowance for trade and notes receivable | $ | 5.3 | $ | 1.5 | $ | — | $ | (0.4 | ) | $ | 6.4 | |||||||||
| Valuation allowance for deferred tax assets | 15.0 | — | — | (1.9 | ) | 13.1 | ||||||||||||||
| 2017: | ||||||||||||||||||||
| Valuation allowance for trade and notes receivable | $ | 6.3 | $ | — | $ | 0.2 | $ | (1.2 | ) | $ | 5.3 | |||||||||
| Valuation allowance for deferred tax assets | 13.1 | 1.9 | — | — | 15.0 | |||||||||||||||
| 2016: | ||||||||||||||||||||
| Valuation allowance for trade and notes receivable | $ | 6.0 | $ | 1.1 | $ | 0.2 | $ | (1.0 | ) | $ | 6.3 | |||||||||
| Valuation allowance for deferred tax assets | 11.0 | 2.1 | — | — | 13.1 |