 filings.tools
Amphenol 10-K 2017-12-31
Filed 2018-02-21. 22 sections, 336K characters. Original on sec.gov · Markdown · JSON
Cover and table of contents
10-K 1 aph-20171231x10k.htm 10-K
UNITED STATES
SECURITIES AND EXCHANGE COMMISSION
Washington, D.C. 20549
FORM 10-K
(Mark One)
☒ANNUAL REPORT PURSUANT TO SECTION 13 OR 15(d) OF THE SECURITIES EXCHANGE ACT OF 1934
For the Fiscal Year Ended December 31, 2017
or
☐TRANSITION REPORT PURSUANT TO SECTION 13 OR 15(d) OF THE SECURITIES EXCHANGE ACT OF 1934
For the transition period from to
Commission file number 1-10879

AMPHENOL CORPORATION
(Exact Name of Registrant as Specified in its Charter)
| Delaware (State of Incorporation) | 22-2785165 (I.R.S. Employer Identification No.) |
358 Hall Avenue, Wallingford, Connecticut 06492
203-265-8900
Securities registered pursuant to Section 12(b) of the Act:
| Class A Common Stock, $.001 par value | New York Stock Exchange | |
| (Title of each class) | (Name of each exchange on which registered) |
Securities registered pursuant to Section 12(g) of the Act: None
Indicate by check mark if the registrant is a well-known seasoned issuer, as defined in Rule 405 of the Securities Act. Yes ☒ No ☐
Indicate by check mark if the registrant is not required to file reports pursuant to Section 13 or Section 15(d) of the Act. Yes ☐ No ☒
Indicate by check mark whether the registrant (1) has filed all reports required to be filed by Section 13 or 15(d) of the Securities Exchange Act of 1934 during the preceding 12 months (or for such shorter period that the registrant was required to file such reports), and (2) has been subject to such filing requirements for the past 90 days. Yes ☒ No ☐
Indicate by check mark whether the registrant has submitted electronically and posted on its corporate Web site, if any, every Interactive Data File required to be submitted and posted pursuant to Rule 405 of Regulation S-T (§232.405 of this chapter) during the preceding 12 months (or for such shorter period that the registrant was required to submit and post such files). Yes ☒ No ☐
Indicate by check mark if disclosure of delinquent filers pursuant to Item 405 of Regulation S-K (§229.405) is not contained herein, and will not be contained, to the best of registrant’s knowledge, in definitive proxy or information statements incorporated by reference in Part III of this Form 10-K or any amendment to this Form 10-K. ☒
Indicate by check mark whether the registrant is a large accelerated filer, an accelerated filer, a non-accelerated filer, a smaller reporting company, or an emerging growth company. See the definitions of “large accelerated filer”, “accelerated filer”, “smaller reporting company,” and “emerging growth company” in Rule 12b-2 of the Exchange Act (Check one):
| Large accelerated filer ☒ | Accelerated filer ☐ | |
| Non-accelerated filer ☐ | Smaller reporting company ☐ Emerging growth company ☐ |
If an emerging growth company, indicate by check mark if the registrant has elected not to use the extended transition period for complying with any new or revised financial accounting standards provided pursuant to Section 13(a) of the Exchange Act. ☐
Indicate by check mark whether the registrant is a shell company (as defined in rule 12b-2 of the Act). Yes ☐ No ☒
The aggregate market value of Amphenol Corporation Class A Common Stock, $.001 par value, held by non-affiliates was approximately $17,320 million based on the reported last sale price of such stock on the New York Stock Exchange on June 30, 2017.
As of January 31, 2018, the total number of shares outstanding of Registrant’s Class A Common Stock was 305,483,780.
DOCUMENTS INCORPORATED BY REFERENCE
Portions of the Registrant’s definitive proxy statement, which is expected to be filed within 120 days following the end of the fiscal year covered by this report, are incorporated by reference into Part III hereof.
Cautionary Note Regarding Forward-Looking Statements
This Annual Report on Form 10-K contains certain statements made by the Company (as defined below) that are intended to be “forward-looking statements” within the meaning of Section 27A of the Securities Act of 1933, as amended, and Section 21E of the Securities Exchange Act of 1934, as amended. All statements, other than statements of historical facts, that address activities, events or developments that the Company expects or anticipates will or may occur in the future, are forward-looking statements. Forward-looking statements may be identified through the use of terms such as “expect”, “may”, “will”, “should”, “intend”, “plan”, “guidance” and other similar expressions generally intended to identify forward-looking statements. Forward-looking statements are based on our management’s current beliefs, expectations and assumptions and on information currently available to our management. Such forward-looking statements are not guarantees of future performance and involve risks and uncertainties, and actual results may differ materially from those projected in the forward-looking statements described in this Annual Report on Form 10-K. Significant risk factors or uncertainties that might cause or contribute to a material difference and may affect our operating and financial performance are described below under the caption “Risk Factors” in Part I, Item 1A and elsewhere in this Annual Report on Form 10-K for the year ended December 31, 2017, and other Company filings with the Securities and Exchange Commission including Quarterly Reports on Form 10-Q and Current Reports on Form 8-K. There may be other risks and uncertainties that we are unable to predict at this time or that we currently do not expect to cause actual results to differ materially from those contained in any forward-looking statements we may make and affect our operating and financial performance. Given these risks and uncertainties, readers are cautioned not to place undue reliance on such forward-looking statements. Forward-looking statements set forth in this Annual Report on Form 10-K speak only as of the date hereof and the Company does not undertake any obligations to revise or update these statements whether as a result of new information, future events or otherwise, except as required by law.
PART I
Item 1. Business
General
Amphenol Corporation (together with its subsidiaries, “Amphenol”, the “Company”, “we”, “our”, or “us”) is one of the world’s largest designers, manufacturers and marketers of electrical, electronic and fiber optic connectors, interconnect systems, antennas, sensors and sensor-based products and coaxial and high-speed specialty cable. The Company estimates, based on reports of industry analysts, that worldwide sales of interconnect and sensor-related products were approximately $150 billion in 2017.
Certain predecessor businesses of the Company were founded in 1932 and the Company was incorporated under the laws of the State of Delaware in 1987. The Company’s Class A Common Stock began trading on the New York Stock Exchange in 1991.
The Company’s strategy is to provide our customers with comprehensive design capabilities, a broad selection of products and a high level of service on a worldwide basis while maintaining continuing programs of productivity improvement and cost control. The Company operates through two reporting segments: (i) Interconnect Products and Assemblies and (ii) Cable Products and Solutions. The Interconnect Products and Assemblies segment primarily designs, manufactures and markets a broad range of connector and connector systems, value-add products and other products, including antennas and sensors, used in a broad range of applications in a diverse set of end markets. Interconnect products include connectors, which when attached to an electrical, electronic or fiber optic cable, a printed circuit board or other device, facilitate transmission of power or signals. Value-add systems generally consist of a system of cable, flexible circuits or printed circuit boards and connectors for linking electronic equipment. The Cable Products and Solutions segment primarily designs, manufactures and markets cable, value-add products and components for use primarily in the broadband communications and information technology markets as well as certain applications in other markets.
The table below provides a summary of our reporting segments, the 2017 net sales contribution of each segment, the primary industry and end markets that we service and our key products:
| Reporting Segment | Interconnect Products and Assemblies | Cable Products and Solutions | ||
| % of 2017 Net Sales: | 94% | 6% | ||
| Primary End Markets | Automotive Broadband Communications Commercial Aerospace Industrial Information Technology and Data Communications Military Mobile Devices Mobile Networks | Automotive Broadband Communications Industrial Information Technology and Data Communications Mobile Networks | ||
| Key Products | Connector and Connector Systems: fiber optic interconnect products harsh environment interconnect products high-speed interconnect products power interconnect products, busbars and distribution systems radio frequency interconnect products and antennas other connectors Value-Add Products: backplane interconnect systems cable assemblies and harnesses cable management products Other: antennas flexible and rigid printed circuit boards hinges molded parts production-related products sensors and sensor-based products switches | Cable: coaxial cable power cable specialty cable Value-Add Products: cable assemblies Components: combiner/splitter products connector and connector systems fiber optic components |
Information regarding the Company’s operations and assets by reporting segment, as well as the Company’s net sales and long-lived assets by geographic area, appears in Note 11 of the Notes to the Consolidated Financial Statements.
Our Strategy
The Company’s overall strategy is to provide its customers with comprehensive design capabilities, a broad selection of products and a high level of service on a worldwide basis while maintaining continuing programs of productivity improvement and cost control. Specifically, our business strategy is as follows:
| · | Pursue broad diversification - The Company constantly drives to increase its diversity of markets, customers, applications and products. Due to the tremendous variety of opportunities in the electronics industry, management believes that it is important to ensure participation wherever significant growth opportunities are available. This diversification positions us to proliferate our technologies across the broadest array of opportunities and reduces our exposure to any particular market, thereby reducing the variability of our financial performance. An overview of the Company’s market and product participation is described under “Markets”. |
|---|
| · | Develop performance-enhancing interconnect solutions - The Company seeks to expand the scope and number of its preferred supplier relationships. The Company works closely with its customers at the design stage to create and manufacture innovative solutions. These products generally have higher value-added content than other interconnect products and have been developed across the Company’s markets. The Company is focused on technology leadership in the interconnect areas of radio frequency, power, harsh environment, high-speed and fiber optics, as well as sensors, as it views these technology areas to be of particular importance to our global customer base. |
|---|
| · | Expand global presence - The Company intends to further expand its global manufacturing, engineering, sales and service operations to better serve its existing customer base, penetrate developing markets and establish new customer relationships. As the Company’s global customers expand their international operations to access developing world markets and lower manufacturing costs in certain regions, the Company is continuing to expand its international footprint in order to provide real-time capabilities to these customers. The majority of the Company’s international operations have broad capabilities including new product development. The Company is also able to take advantage of the lower manufacturing costs in some regions, and has established low-cost manufacturing and assembly facilities in the Americas, Europe/Africa and Asia. |
|---|
| · | Control costs - The Company recognizes the importance in today’s global marketplace of maintaining a competitive cost structure. Innovation, product quality and comprehensive customer service are not mutually exclusive with controlling costs. Controlling costs is part of a mindset. It is having the discipline to invest in programs that have a good return, maintaining a cost structure as flexible as possible to respond to changes in the marketplace, dealing with suppliers and vendors in a fair but prudent way to ensure a reasonable cost for materials and services and creating a mindset where managers manage the Company’s assets as if they were their own. |
|---|
| · | Pursue strategic acquisitions and investments - The Company believes that the interconnect and sensor industry is highly fragmented and continues to provide significant opportunities for strategic acquisitions. Accordingly, we continue to pursue acquisitions of high-growth potential companies with strong management teams that complement our existing business while further expanding our product lines, technological capabilities and geographic presence. Furthermore, we seek to enhance the performance of acquired companies by leveraging Amphenol’s business strategy and access to low-cost manufacturing around the world. In 2017, the Company invested approximately $266 million to fund five acquisitions comprising seven businesses, and in 2016, the Company invested approximately $1.3 billion to fund five acquisitions, including the acquisition of FCI Asia Pte. Ltd. (“FCI”), the largest acquisition in our history (“FCI acquisition”), for an aggregate purchase price of approximately $1.2 billion, net of cash acquired. Our acquisitions in 2017 and 2016 strengthened our customer base and product offerings in many of our end markets. |
|---|
| · | Foster collaborative, entrepreneurial management - Amphenol’s management system is designed to provide clear income statement and balance sheet responsibility in a flat organizational structure. Each general manager is incented to grow and develop his or her business and to think entrepreneurially in providing innovative, timely and cost-effective solutions to customer needs. In addition, Amphenol’s general managers have access to the resources of the larger organization and are encouraged to work collaboratively with other general managers to meet the needs of the expanding marketplace and to achieve common goals. |
|---|
Markets
The Company sells products to customers in a diversified set of end markets.
Automotive - Amphenol is a leading supplier of advanced interconnect systems, sensors and antennas for a growing array of automotive applications. In addition, Amphenol has developed advanced technology solutions for hybrid-electric vehicles and is working with leading global customers to proliferate these advanced interconnect products into next-generation automobiles. Sales into the automotive market represented approximately 19% of the Company’s net sales in 2017 with sales into the following primary end applications:
| · | engine management and control |
|---|
| · | exhaust monitoring and cleaning |
|---|
| · | hybrid-electric vehicles |
|---|
| · | infotainment and communications |
|---|
| · | lighting |
|---|
| · | safety and security systems |
|---|
| · | telematics systems |
|---|
Broadband Communications - Amphenol is a world leader in broadband communication products for cable, satellite and telco video and data networks, with industry-leading engineering, design and manufacturing expertise. The Company offers a wide range of products to service the broadband market, from customer premises cables and interconnect devices to distribution cable and fiber optic components, as well as interconnect products integrated into headend equipment. Sales into the broadband communications market represented approximately 6% of the Company’s net sales in 2017 with sales into the following primary end applications:
| · | cable modems |
|---|
| · | cable, satellite and telco networks |
|---|
| · | high-speed internet hardware |
|---|
| · | network switching equipment |
|---|
| · | satellite interface devices |
|---|
| · | set top boxes |
|---|
Commercial Aerospace - Amphenol is a leading provider of high-performance interconnect systems and components to the commercial aerospace market. In addition to connector and interconnect assembly products, the Company also provides rigid and flexible printed circuits as well as high-technology cable management products. All of Amphenol’s products are specifically designed to operate in the harsh environments of commercial aerospace while also providing substantial weight reduction, simplified installation and minimal maintenance. Sales into the commercial aerospace market represented approximately 4% of the Company’s net sales in 2017 with sales into the following primary end applications:
| · | aircraft and airframe power distribution |
|---|
| · | avionics |
|---|
| · | controls and instrumentation |
|---|
| · | engines |
|---|
| · | in-flight entertainment |
|---|
| · | lighting and control systems |
|---|
| · | wire bundling and cable management |
|---|
Industrial - Amphenol is a technology leader in the design, manufacture and supply of high-performance interconnect systems, sensors and antennas for a broad range of industrial applications. Amphenol’s core competencies include application-specific industrial interconnect solutions utilizing integrated assemblies, including with both cable and flexible printed circuits, as well as high-power interconnects requiring advanced engineering and system integration. In particular, our innovative solutions facilitate the increasing demands of embedded computing and power distribution.
Sales into the industrial market represented approximately 19% of the Company’s net sales in 2017 with sales into the following primary end applications:
| · | alternative and traditional energy generation |
|---|
| · | batteries and hybrid drive systems |
|---|
| · | factory and machine tool automation |
|---|
| · | heavy equipment |
|---|
| · | instrumentation |
|---|
| · | internet of things |
|---|
| · | LED lighting |
|---|
| · | marine |
|---|
| · | medical equipment |
|---|
| · | oil and gas |
|---|
| · | power distribution |
|---|
| · | rail mass transit |
|---|
Information Technology and Data Communications - Amphenol is a global provider of interconnect solutions to designers, manufacturers and operators of internet-enabling systems. With our industry-leading high-speed, power and fiber optic technologies, together with superior simulation and testing capability and cost effectiveness, Amphenol is a market leader in interconnect development for the information technology (“IT”) and datacom market. Whether industry standard or application-specific designs are required, Amphenol provides customers with products that enable performance at the leading edge of next-generation, high-speed, power and fiber optic technologies. Sales into the IT and datacom market represented approximately 20% of the Company’s net sales in 2017 with sales into the following primary end applications:
| · | cloud computing and data centers |
|---|
| · | consumer electronics |
|---|
| · | internet appliances |
|---|
| · | optical and copper networking equipment |
|---|
| · | servers |
|---|
| · | storage systems |
|---|
| · | transmission |
|---|
Military - Amphenol is a world leader in the design, manufacture and supply of high-performance interconnect systems for harsh environment military applications. Such products require superior performance and reliability under conditions of stress and in hostile environments such as vibration, pressure, humidity, nuclear radiation and rapid and severe temperature changes. Amphenol provides an unparalleled product breadth, from military specification connectors to customized high-speed board level interconnects; from flexible to rigid printed circuit boards; and from backplane systems to completely integrated assemblies. Amphenol is a technology leader, participating in major programs from the earliest inception across each phase of the production cycle. Sales into the military market represented approximately 10% of the Company’s net sales in 2017 with sales into the following primary end applications:
| · | avionics |
|---|
| · | communications |
|---|
| · | engines |
|---|
| · | ground vehicles and tanks |
|---|
| · | homeland security |
|---|
| · | naval |
|---|
| · | ordnance and missile systems |
|---|
| · | radar systems |
|---|
| · | rotorcraft |
|---|
| · | satellite and space programs |
|---|
| · | unmanned aerial vehicles |
|---|
Mobile Devices - Amphenol designs and manufactures an extensive range of interconnect products, antennas and electromechanical components found in a wide array of mobile computing devices. Amphenol’s capability for high-volume production of these technically demanding, miniaturized products, combined with our speed of new product introduction, are critical drivers of the Company’s long-term success in this market. Sales into the mobile devices market represented approximately 14% of the Company’s net sales in 2017 with sales into the following primary end applications:
| · | mobile and smart phones, including accessories |
|---|
| · | mobile computing devices, including laptops, tablets, ultrabooks and e-readers |
|---|
| · | production-related products |
|---|
| · | wearable and hearable devices |
|---|
Mobile Networks - Amphenol is a leading global interconnect solutions provider to the mobile networks market. The Company offers a wide product portfolio. The Company’s products are used in virtually every current and next generation wireless communications standards. In addition, the Company works with service providers around the world to offer an array of antennas and installation-related site solution interconnect products. Sales into the mobile networks market represented approximately 8% of the Company’s net sales in 2017 with sales into the following primary end applications:
| · | cell site antenna systems |
|---|
| · | cellular base stations |
|---|
| · | combiners, filters and amplifiers |
|---|
| · | core network controllers |
|---|
| · | distributed antenna systems (DAS) |
|---|
| · | mobile switches |
|---|
| · | radio links |
|---|
| · | small cells |
|---|
| · | wireless routers |
|---|
Customers and Geographies
The Company manufactures and sells a broad portfolio of products on a global basis to customers in various industries. Our customers include many of the leaders in their respective industries, and our relationships with them typically date back many years. We believe that our diversified customer base provides us an opportunity to leverage our skills and experience across markets and reduces our exposure to particular end markets. Additionally, we believe that the diversity of our customer base is an important strength of the Company.
There has been a trend on the part of customers to consolidate their lists of qualified suppliers to companies that have the ability to meet certain technical, quality, delivery and other standards while maintaining competitive prices. The Company has positioned its global resources to compete effectively in this environment. As an industry leader, the Company has established close working relationships with many of its customers on a global basis. These relationships allow the Company to better anticipate and respond to these customer needs when designing new products and new technical solutions. By working with customers in developing new products and technologies, the Company is able to identify and act on trends and leverage knowledge about next-generation technology across our portfolio of products. In addition, the Company has concentrated its efforts on service, procurement and manufacturing improvements designed to increase product quality and lower product lead-time and cost. For a discussion of certain risks related to the Company’s sales, refer to the risk factor titled “The Company is dependent on the communications industry, including information technology and data communications, wireless communications and broadband communications” in Part I, Item 1A herein.
The Company’s products are sold to thousands of original equipment manufacturers (“OEMs”) in approximately 70 countries throughout the world. The Company also sells certain products to electronic manufacturing services (“EMS”) companies, to original design manufacturers (“ODMs”) and to communication network operators. No single customer accounted for 10% or more of the Company’s net sales for the years ended December 31, 2017 and 2016. During the year ended December 31, 2015, aggregate sales to Apple Inc., including sales of products to EMS companies and subcontractors that the Company believes are manufacturing products on their behalf, accounted for approximately 11% of our net sales.
The Company sells its products through its own global sales force, independent representatives and a global network of electronics distributors. The Company’s sales to distributors represented approximately 15% of the Company’s net sales in 2017. In addition to product design teams and collaborative initiatives with customers, the Company uses key account managers to manage customer relationships on a global basis such that it can bring to bear its total resources to meet the worldwide needs of its multinational customers.
Manufacturing
The Company is a global manufacturer employing advanced manufacturing processes including molding, stamping, plating, turning, CNC machining, extruding, die casting and assembly operations and proprietary process technology for specialty and coaxial cable production and sensor fabrication. Outsourcing of certain manufacturing processes is used when cost-effective. Substantially all of the Company’s manufacturing facilities are certified to the ISO9000 series of quality standards, and many of the Company’s manufacturing facilities are certified to other quality standards, including QS9000, ISO14000, TS16949 and TS16469.
The Company’s manufacturing facilities are generally vertically integrated operations from the initial design stage through final design and manufacturing. The Company has an established manufacturing presence in approximately 30 countries. Our global coverage positions us near many of our customers’ locations and allows us to assist them in consolidating their supply base and lowering their production and logistics costs. In addition, the Company generally relies on local general management in every region, which we believe creates a strong degree of organizational stability and deeper understanding of local markets. We believe our balanced geographic distribution lowers our exposure to any particular geography. The Company designs, manufactures and assembles its products at facilities in the Americas, Europe, Asia, Australia and Africa. The Company believes that its global presence is an important competitive advantage, as it allows the Company to provide quality products on a timely and worldwide basis to its multinational customers.
The Company employs a global manufacturing strategy to lower its production and logistics costs and to improve service to customers. The Company’s strategy is to maintain strong cost controls in its manufacturing and assembly operations. The Company is continually evaluating and adjusting its expense levels and workforce to reflect current business conditions and maximize the return on capital investments. The Company sources its products on a worldwide basis. To better serve certain high-volume customers, the Company has established certain facilities near these major customers. The Company seeks to position its manufacturing and assembly facilities in order to serve local markets while coordinating as appropriate product design and manufacturing responsibility with the Company’s other operations around the world. For a discussion of certain risks attendant to the Company’s foreign operations, refer to the risk factor titled “Non-U.S. markets form a substantial portion of the Company’s business and as a result, the Company is more exposed to political, economic, military, natural disaster and other risks in countries outside the United States” in Part I, Item 1A herein.
Net sales by geographic area as a percentage of the Company’s total net sales for the years ended December 31, 2017, 2016 and 2015 were as follows:
| 2017 | 2016 | 2015 | ||||
| United States | 28% | 28% | 30% | |||
| China | 30% | 30% | 30% | |||
| Other international locations | 42% | 42% | 40% | |||
| Total | 100% | 100% | 100% |
Net sales by geographic area are based on the customer location to which the product is shipped. For additional information regarding net sales by geographic area, refer to Note 11 of the Notes to the Consolidated Financial Statements in Item 8 of this Annual Report on Form 10-K.
Research and Development
The Company generally implements its product development strategy through product design teams and collaborative initiatives with customers, which often results in the Company obtaining approved vendor status for its customers’ new products and programs. The Company focuses its research and development efforts primarily on those
product areas that it believes have the potential for broad market applications and significant sales within a one- to three-year period. The Company seeks to have its products become widely accepted within the industry for similar applications and products manufactured by other potential customers, which the Company believes will provide additional sources of future revenue. By developing application specific products, the Company is able to decrease its exposure to standard products, which are more likely to experience greater pricing pressure.
At the end of 2017, our research, development, and engineering efforts were supported by approximately 2,700 employees and were performed primarily by individual operating units focused on specific markets and product technologies. The Company’s research and development expenses for the creation of new and improved products and processes were $193.7 million, $166.1 million and $124.7 million for 2017, 2016 and 2015, respectively, which are classified as selling, general and administrative expenses in our Consolidated Financial Statements.
Intellectual Property
Patents and other proprietary rights are important to our business. We own a large portfolio of patents that principally relate to electrical, optical, electronic, antenna and sensor products. We also own a portfolio of trademarks and are a licensee of various patents and trademarks. Patents for individual products extend for varying periods according to the date of patent filing or grant and the legal term of patents in the various countries where patent protection is obtained. Trademark rights may potentially extend for longer periods of time and are dependent upon the laws of various jurisdictions and the use of the trademarks.
We also rely upon trade secrets, manufacturing know-how, continuing technological innovations, and licensing opportunities to maintain and improve our competitive position. We review third-party proprietary rights, including patents and patent applications, as available, in an effort to develop an effective intellectual property strategy, avoid infringement of third-party proprietary rights, identify licensing opportunities, and monitor the intellectual property claims of others.
From time to time, the Company is involved in disputes with third parties regarding the Company’s or such third party’s intellectual property assets, particularly patents. While we consider our patents and trademarks to be valued assets, we do not believe that our competitive position or our operations are dependent upon or would be materially impacted by the loss of any single patent or group of related patents, or by a third party’s successful enforcement of its patents against us or any of our products.
Raw Materials
The Company purchases a wide variety of raw materials for the manufacture of its products, including (i) precious metals such as gold and silver used in plating, (ii) aluminum, steel, copper, titanium and metal alloy products used for cable, contacts and connector shells, (iii) certain rare earth metals used in sensors and (iv) plastic materials used for cable and connector bodies and inserts and other molded parts. Such raw materials are generally available throughout the world and are purchased locally from a variety of suppliers. The Company is generally not dependent upon any one source for raw materials or, if one source is used, the Company attempts to protect itself through long-term supply agreements. The Company does not anticipate any difficulties in obtaining raw materials necessary for production. Information regarding our purchasing obligations related to commitments to purchase certain goods and services is disclosed in Note 13 of the Notes to the Consolidated Financial Statements. For a discussion of certain risks related to raw materials, refer to the risk factor titled “The Company may experience difficulties in obtaining a consistent supply of materials at stable pricing levels” in Part I, Item 1A herein.
Competition
The Company encounters competition in substantially all areas of its business. The Company competes primarily on the basis of technology innovation, product quality, price, customer service and delivery time. Primary competitors within the Interconnect Products and Assemblies segment include Carlisle, Delphi, Esterline, Foxconn, Hirose, Huber & Suhner, ICT Luxshare, JAE, Jonhon, JST, Molex, Radiall, Rosenberger, Sensata, TE Connectivity, Yazaki and 3M, among others. Primary competitors within the Cable Products and Solutions segment include Commscope and Belden, among others. In addition, the Company competes with a large number of smaller companies who compete in specific geographies, markets or products. For a discussion of certain risks related to competition, refer to the risk factor titled “The Company encounters competition in substantially all areas of its business” in Part I, Item 1A herein.
Backlog
The Company estimates that its backlog of unfilled firm orders as of December 31, 2017 was approximately $1.610 billion compared with backlog of approximately $1.319 billion as of December 31, 2016. Orders typically fluctuate from quarter to quarter based on customer demand and general business conditions. Unfilled orders may generally be cancelled prior to shipment of goods. It is expected that all or a substantial portion of the backlog will be filled within the next 12 months. Significant elements of the Company’s business, such as sales to the communications-related markets (including wireless communications, information technology and data communications and broadband communications) and sales to distributors, generally have short lead times. Therefore, backlog may not be indicative of future demand.
Employees
As of December 31, 2017, the Company had approximately 70,000 employees worldwide. The Company believes that it has a good relationship with its unionized and non-unionized employees. Refer to “Risk Factors” in Part I, Item 1A. herein for a discussion of certain risks related to employee relations.
Environmental Matters
Certain operations of the Company are subject to environmental laws and regulations which govern the discharge of pollutants into the air and water, as well as the handling and disposal of solid and hazardous wastes. The Company believes that its operations are currently in substantial compliance with applicable environmental laws and regulations and that the costs of continuing compliance will not have a material adverse effect on the Company’s financial condition, results of operations or cash flows. For a discussion of certain risks attendant to environmental matters, refer to the risk factor titled “The Company may be subject to environmental laws and regulations that could adversely affect its business” in Part I, Item 1A herein.
Available Information
The Company’s annual report on Form 10-K and all of the Company’s other filings with the Securities and Exchange Commission (“SEC”), such as quarterly reports on Form 10-Q, current reports on Form 8-K and any amendments to those reports, are available to view, free of charge, on the Company’s website, www.amphenol.com, as soon as reasonably practicable after they are filed electronically with, or furnished to, the SEC. Copies are also available without charge, from Amphenol Corporation, Investor Relations, 358 Hall Avenue, Wallingford, CT 06492.
Item 1A. Risk Factors
Investors should carefully consider the risks described below and all other information in this annual report on Form 10-K. The risks and uncertainties described below are not the only ones facing the Company. Additional risks and uncertainties not presently known to the Company or that it currently deems immaterial may also impair the Company’s business, operations, liquidity and financial condition.
If actions taken by management to limit, monitor or control financial enterprise risk exposures are not successful, the Company’s business and consolidated financial statements could be materially adversely affected. In such case, the trading price of the Company’s common stock could decline and investors may lose all or part of their investment.
The Company is dependent on the communications industry, including information technology and data communications, wireless communications and broadband communications.
Approximately 48% of the Company’s 2017 net sales came from sales to the communications industry, including information technology and data communication, wireless communications and broadband communications, with 14% of the Company’s 2017 net sales coming from sales to the mobile device market. Demand for these products is subject to rapid technological change (see below—“The Company is dependent on the acceptance of new product introductions for continued revenue growth”). These markets are dominated by several large manufacturers and operators who regularly exert significant pressure on their suppliers, including the Company. Furthermore, there has been a trend on the part of customers to consolidate their lists of qualified suppliers to companies that have the ability to meet certain technical,
quality, delivery and other standards while maintaining competitive prices. There can be no assurance that the Company will be able to meet these standards or maintain competitive pricing and therefore continue to compete successfully in the communications industry. The Company’s failure to do so could have a material adverse effect on the Company’s business, financial condition and results of operations.
Approximately 6% and 8% of the Company’s 2017 net sales came from sales to the broadband communications and mobile networks markets, respectively. Demand for the Company’s products in these markets depends primarily on capital spending by operators for constructing, rebuilding or upgrading their systems. The amount of this capital spending and, therefore, the Company’s sales and profitability will be affected by a variety of factors, including general economic conditions, consolidation within the communications industry, the financial condition of operators and their access to financing, competition, technological developments, new legislation and regulation of operators. There can be no assurance that existing levels of capital spending will continue or that spending will not decrease.
Changes in defense expenditures may reduce the Company’s sales.
Approximately 10% of the Company’s 2017 net sales came from sales to the military market. The Company participates in a broad spectrum of defense programs. The Company’s military sales are generally to contractors and subcontractors of the U.S. or foreign governments or to distributors that in turn sell to the contractors and subcontractors. Accordingly, the Company’s sales are affected by changes in the defense budgets of the U.S. and foreign governments. A significant decline in U.S. or foreign government defense expenditures could have an adverse effect on the Company’s business, financial condition and results of operations.
The Company encounters competition in substantially all areas of its business.
The Company competes primarily on the basis of technology innovation, product quality, price, customer service and delivery time. Competitors include large, diversified companies, some of which have greater assets and financial resources than the Company, as well as medium to small companies. There can be no assurance that additional competitors will not enter the Company’s existing markets, nor can there be any assurance that the Company will be able to compete successfully against existing or new competition, and the inability to do so could have an adverse effect on the Company’s business, financial condition and results of operations.
The Company is dependent on the acceptance of new product introductions for continued revenue growth.
The Company estimates that products introduced in the last two years accounted for approximately 25% of 2017 net sales. The Company’s long-term results of operations depend substantially upon its ability to continue to conceive, design, source and market new products and upon continuing market acceptance of its existing and future product lines. In the ordinary course of business, the Company continually develops or creates new product line concepts. If the Company fails, or is significantly delayed, in introducing new product line concepts or if the Company’s new products are not met with market acceptance, its business, financial condition and results of operations may be adversely affected.
The Company’s credit agreements contain certain covenants, which if breached, could have a material adverse effect on the Company.
The Credit Agreement, dated as of March 1, 2016, among the Company, certain subsidiaries of the Company and a syndicate of financial institutions (the “Revolving Credit Facility”), which also backstops the Company’s commercial paper program, contains financial and other covenants, such as a limit on the ratio of debt to earnings before interest, taxes, depreciation and amortization, a limit on priority indebtedness and limits on incurrence of liens. Although the Company believes none of these covenants is presently restrictive to the Company’s operations, the ability to meet the financial covenants can be affected by events beyond the Company’s control, and the Company cannot provide assurance that it will meet those tests. A breach of any of these covenants could result in a default under the Revolving Credit Facility. Upon the occurrence of an event of default under any of the Company’s credit facilities, the lenders could terminate all commitments to extend further credit and elect to declare amounts outstanding thereunder to be immediately due and payable which could result in the Company not having sufficient assets to repay the Revolving Credit Facility and other indebtedness. As of December 31, 2017, the Company had outstanding borrowings under the Revolving Credit Facility and the commercial paper program of nil and $1,175.4 million, respectively.
The Company relies on the capital markets, and its inability to access those markets on favorable terms could adversely affect the Company’s results.
The Company has used the capital markets to invest in its business and make strategic acquisitions. If general economic and capital market conditions deteriorate significantly, it could impact the Company’s ability to access the capital markets. While the Company has not recently encountered any financing difficulties, the capital and credit markets have experienced significant volatility in the past. Market conditions could make it more difficult to access capital to finance capital investments, acquisitions and other initiatives including dividends and share repurchases. As such, this could have a material adverse effect on the Company’s business, financial condition, results of operations or cash flows. In addition, while the Company has not encountered any such issues to date, if the credit rating agencies that rate the Company’s debt were to downgrade the Company’s credit rating in conjunction with a deterioration of the Company’s performance, it would likely increase the Company’s cost of capital and make it more difficult for the Company to obtain new financing and access capital markets, which could also have a material adverse effect on the Company’s business, financial condition, results of operations or cash flows.
The Company’s results may be negatively affected by changing interest rates.
The Company is subject to interest rate volatility with regard to existing and future issuances of debt. The Company monitors the mix of fixed-rate and variable-rate debt, as well as the mix of short-term and long-term debt. As of December 31, 2017, approximately $1,182.0 million, or 33%, of the Company’s outstanding borrowings were subject to floating interest rates and were primarily comprised of commercial paper borrowings. A 10% change in LIBOR or floating interest rates at December 31, 2017 would not have a material effect on the Company’s interest expense. The Company does not expect changes in interest rates to have a material effect on income or cash flows in 2018, although there can be no assurance that interest rates will not change significantly.
As of December 31, 2017, approximately 67% of the Company’s outstanding borrowings were based on fixed rates and primarily related to the following unsecured Senior Notes:
| Principal | Fixed | ||||||
| Amount | Interest | ||||||
| (in millions) | Rate | Maturity | |||||
| $ | 750.0 | 2.55 | % | January 2019 | |||
| 400.0 | 2.20 | % | April 2020 | ||||
| 375.0 | 3.125 | % | September 2021 | ||||
| 500.0 | 4.00 | % | February 2022 | ||||
| 350.0 | 3.20 | % | April 2024 |
The Company’s results may be negatively affected by foreign currency exchange rates.
The Company conducts business in many international currencies through its worldwide operations, and as a result is subject to foreign exchange exposure due to changes in exchange rates of the various currencies including possible currency devaluations. Changes in exchange rates can positively or negatively affect the Company’s sales, operating margins and equity. The Company manages currency exposure risk in a number of ways, including producing its products in the same country or region in which the products are sold (thereby generating revenues and incurring expenses in the same currency), cost reduction and pricing actions, and working capital management. However, there can be no assurance that these actions will be fully effective in managing currency risk, including in the event of a significant and sudden decline in the value of any of the international currencies of the Company’s worldwide operations, which could have an adverse effect on the Company’s business, financial condition and results of operations.
Changes in fiscal and tax policies, audits and examinations by taxing authorities could impact the Company’s results.
The Company is subject to taxes in the U.S. and numerous international jurisdictions. Changes in tax laws, regulations and other tax guidance, including related interpretations, could materially impact the Company’s current, non-current and deferred tax assets and liabilities. The Company is subject to tax examinations by various tax authorities and in addition, new examinations could be initiated by tax authorities. As the Company has operations in jurisdictions throughout the world, the risk of tax examinations will continue to occur. The Company’s financial condition, results of operations or cash flows may be materially impacted by the results of these tax examinations.
On December 22, 2017, the U.S. government enacted comprehensive tax legislation commonly referred to as the Tax Cuts and Jobs Act (“Tax Act”). The changes included in the Tax Act are broad and complex. The final transition impacts of the Tax Act may differ from the estimates provided elsewhere in this report, possibly materially, due to, among other things, changes in interpretations of the Tax Act, any legislative action to address questions that arise because of the Tax Act, any changes in accounting standards for income taxes or related interpretations in response to the Tax Act, or any updates or changes to estimates the Company has utilized to calculate the transition impacts.
Non-U.S. markets form a substantial portion of the Company’s business and as a result, the Company is more exposed to political, economic, military and other risks in countries outside the United States.
During 2017, non-U.S. markets constituted approximately 72% of the Company’s net sales, with China constituting approximately 30% of the Company’s net sales. The Company employs approximately 90% of its workforce outside the United States. The Company’s customers are located throughout the world and the Company has many manufacturing, administrative and sales facilities outside the United States. Because the Company has extensive non-U.S. operations as well as significant cash and cash investments held at institutions located outside of the U.S., it is exposed to additional risks that could have a material adverse effect on the Company’s business, financial condition, results of operations, or cash flows, including:
| · | instability in political or economic conditions, including but not limited to inflation, recession, foreign currency exchange restrictions and devaluations, restrictive governmental controls on the movement and repatriation of earnings and capital, and actual or anticipated military or political conflicts, particularly in emerging markets; |
|---|
| · | intergovernmental conflicts or actions, including but not limited to armed conflict, trade wars and acts of terrorism or war; and |
|---|
| · | interruptions to the Company’s business with its largest customers, distributors and suppliers resulting from but not limited to, strikes, financial instabilities, computer malfunctions or cybersecurity incidents, inventory excesses, natural disasters or other disasters such as fires, floods, earthquakes, hurricanes or explosions. |
|---|
Changes in general economic conditions, geopolitical conditions, U.S. trade policies and other factors beyond the Company’s control may adversely impact our business and operating results.
The Company’s operations and performance depend significantly on global, regional and U.S. economic and geopolitical conditions. During, and following, the U.S. presidential election in 2016, there has been discussion and dialogue regarding potential significant changes to U.S. trade policies, legislation, treaties and tariffs, including the North American Free Trade Agreement (“NAFTA”) as well as trade policies and tariffs affecting China. At this time, it is unknown whether and to what extent new legislation will be passed into law, pending or new regulatory proposals will be adopted, international trade agreements will be negotiated, or the effect that any such action would have, either positively or negatively, on our industry or our Company. If any new legislation and/or regulations are implemented, or if existing trade agreements are renegotiated, it may be inefficient and expensive for us to alter our business operations in order to adapt to or comply with such changes. Such operational changes could have a material adverse effect on our business, financial condition, results of operations or cash flows.
In addition to changes in U.S. trade policy, a number of other economic and geopolitical factors both in the U.S. and abroad could have a material adverse effect on the Company’s business, financial condition, results of operations or cash flows, which could ultimately result in:
| · | a global or regional economic slowdown in any of the Company’s market segments; |
|---|
| · | postponement of spending, in response to tighter credit, financial market volatility and other factors; |
|---|
| · | effects of significant changes in economic, monetary and fiscal policies in the U.S. and abroad including significant income tax changes, currency fluctuations and inflationary pressures; |
|---|
| · | rapid material escalation of the cost of regulatory compliance and litigation; |
|---|
| · | changes in government policies and regulations affecting the Company or its significant customers; |
|---|
| · | employment regulations and local labor conditions, including increases in employment costs, particularly in low-cost regions in which the Company currently operates; |
|---|
| · | industrial policies in various countries that favor domestic industries over multinationals or that restrict foreign companies altogether; |
|---|
| · | difficulties protecting intellectual property; |
|---|
| · | longer payment cycles; |
|---|
| · | credit risks and other challenges in collecting accounts receivable; |
|---|
| · | changes in assumptions, such as discount rates, along with lower than expected investment returns and performance related to the Company’s benefit plans; and |
|---|
| · | the impact of each of the foregoing on outsourcing and procurement arrangements. |
|---|
The Company may experience difficulties and unanticipated expenses in connection with purchasing and integrating newly acquired businesses, including the potential for the impairment of goodwill.
The Company has completed a number of acquisitions in recent years, including the acquisition of FCI on January 8, 2016. The Company anticipates that it will continue to pursue acquisition opportunities as part of its growth strategy. The Company may experience difficulty and unanticipated expenses associated with purchasing and integrating such acquisitions, and the acquisitions may not perform as expected. At December 31, 2017, the total assets of the Company were $10,003.9 million, which included $4,042.6 million of goodwill (the excess of fair value of consideration paid over the fair value of net identifiable assets of businesses acquired). The Company performs annual evaluations for the potential impairment of the carrying value of goodwill. Such evaluations have not resulted in the need to recognize an impairment. However, if the financial performance of the Company’s businesses were to decline significantly, the Company could incur a material non-cash charge to its income statement for the impairment of goodwill.
The Company may experience difficulties in obtaining a consistent supply of materials at stable pricing levels.
The Company uses basic materials like aluminum, steel, copper, titanium, metal alloys, gold, silver, certain rare earth metals and plastic resins, in its manufacturing processes. Volatility in the prices of such materials and availability of supply may have a substantial impact on the price the Company pays for such materials. In addition, to the extent such cost increases cannot be recovered through sales price increases or productivity improvements, the Company’s margins may decline.
Our business reputation and financial results may be impaired by improper conduct by any of our employees, customers, suppliers, distributors or any other business partners.
While the Company’s internal controls and systems are designed to protect it from illegal acts committed by employees, customers, suppliers, distributors and other business partners that may violate U.S. or local jurisdictional laws, there are no guarantees that such internal controls and systems will always protect the Company from such acts. Such acts may include, but are not limited to, bribery, conflicts of interest, fraud, kickbacks and money laundering. Such violations or allegations could damage the Company’s reputation, lead to criminal or civil investigations in the U.S. or foreign jurisdictions, and ultimately result in monetary or non-monetary penalties and/or significant legal and administrative fees. Any significant violations of our standards of conduct by any of our employees, customers, suppliers, distributors or business partners could have a material adverse effect on our business, financial condition, results of operations or cash flows.
The Company may be subject to litigation and other regulatory or legal proceedings.
The Company may be subject to litigation and other regulatory or legal proceedings that could adversely impact our financial position, results of operations, or cash flows, including but not limited to, claims related to employment, tax, intellectual property, environmental, sales practices, workers compensation, product warranty, product liability and acquisitions. These lawsuits may include claims for compensatory, punitive or consequential damages, and could result in significant legal expenses. While the Company does maintain certain insurance coverages that may mitigate losses associated with some of these types of proceedings, the policy may not respond in all cases and the amount of insurance coverage may not be adequate to cover the total claims and liabilities.
The Company may be subject to environmental laws and regulations that could adversely affect its business.
The Company operates in both the United States and various foreign jurisdictions, and we must comply with locally enacted laws and regulations addressing health, safety and environmental matters in such jurisdictions in which we manufacture and/or sell our products. Certain operations of the Company are subject to locally enacted environmental laws and regulations which govern the discharge of pollutants into the air and water, as well as the handling and disposal of solid and hazardous wastes. While the Company believes that its operations are currently in substantial compliance with applicable environmental laws and regulations, the Company and its operations may be subject to liabilities, regardless of fault, for investigative and/or remediation efforts on such matters that may arise at any of the Company’s former or current properties, either owned or leased. Such liabilities could result from the use of hazardous materials in production, the disposal of products, damages associated with the use of any of our products or other related matters. We cannot be certain as to the potential impact of any changes to environmental conditions or environmental policies that may arise at any of our jurisdictions. Our failure to comply with these local environmental laws and regulations could result in fines or other punitive damages and/or modifications to our production processes, any of which could adversely impact our financial position, results of operations, or cash flows.
Cybersecurity incidents on our information technology systems could disrupt business operations, resulting in adverse impacts to our reputation and operating results and potentially leading to litigation and/or governmental investigations.
Cybersecurity threats continue to expand and evolve globally, making it difficult to detect and prevent such threats from impacting the Company. Cybersecurity threats to the Company could lead to unauthorized access to the Company’s information technology systems, products, customers, suppliers and third party service providers. Cybersecurity incidents could potentially result in the disruption of our business operations and the misappropriation, destruction, or corruption of critical data and confidential or proprietary technological information. Cybersecurity incidents could also result from unauthorized parties gaining access to our systems or information through fraud or other means of deceiving our employees, suppliers or third party service providers. Despite the Company’s implementation of preventative security measures to prevent, detect, address and mitigate these threats, our infrastructure may still be susceptible to disruptions from a cybersecurity incident, security breaches, computer viruses, outages, systems failures or other catastrophic events, any of which could include reputational damage, litigation with third parties and/or governmental investigations, among other things, which could have a material adverse effect on our business, financial condition and results of operations.
Item 1B. Unresolved Staff Comments
None.
Item 2. Properties
The Company’s fixed assets include plants and warehouses and a substantial quantity of machinery and equipment, most of which is general purpose machinery and equipment using tools and fixtures and in many instances having automatic control features and special adaptations. The Company’s plants, warehouses and machinery and equipment are generally in good operating condition, are reasonably maintained and substantially all of its facilities are in regular use. The Company considers the present level of fixed assets along with planned capital expenditures as suitable and adequate for operations in the current business environment. At December 31, 2017, the Company operated a total of approximately 420 plants, warehouses and offices of which (a) the locations in the U.S. had approximately 4.0 million square feet, of which approximately 1.9 million square feet were leased; (b) the locations outside the U.S. had approximately 16.0 million square feet, of which approximately 10.6 million square feet were leased; and (c) the square footage by segment was approximately 19.0 million square feet and approximately 1.0 million square feet for the Interconnect Products and Assemblies segment and the Cable Products and Solutions segment, respectively.
The Company believes that its facilities are suitable and adequate for the business conducted therein and are being appropriately utilized for their intended purposes. Utilization of the facilities varies based on demand for the products. The Company continuously reviews its anticipated requirements for facilities and, based on that review, may from time to time acquire or lease additional facilities and/or dispose of existing facilities.
Item 3. Legal Proceedings
The Company has been named as a defendant in several legal actions arising from normal business activities. Although the potential liability with respect to certain of such legal actions cannot be reasonably estimated, none of such matters is expected to have a material adverse effect on the Company’s financial condition, results of operations or cash flows. Refer to “Risk Factors” in Part I, Item 1A herein for additional information regarding legal risks and uncertainties.
Item 4. Mine Safety Disclosures
Not applicable.
PART II
Item 5. Market for Registrant’s Common Equity, Related Stockholder Matters and Issuer Purchases of Equity Securities
Market Information and Dividends
The Company effected the initial public offering of its Class A Common Stock (“Common Stock”) in November 1991. The Company’s Common Stock has been listed on the New York Stock Exchange since that time under the symbol “APH”. As of January 31, 2018, there were 33 holders of record of the Company’s Common Stock. A significant number of outstanding shares of Common Stock are registered in the name of only one holder, which is a nominee of The Depository Trust Company, a securities depository for banks and brokerage firms. The Company believes that there are a significant number of beneficial owners of its Common Stock. Contingent upon declaration by the Board of Directors, the Company generally pays a quarterly dividend on shares of its Common Stock. The following table sets forth the high and low closing sales prices for the Common Stock as reported on the New York Stock Exchange, as well as the dividends declared per common share, for each quarter of 2017 and 2016:
| 2017 | 2016 | |||||||||||||||||
| Closing Prices | Dividends | Closing Prices | Dividends | |||||||||||||||
| High | Low | per share | High | Low | per share | |||||||||||||
| First Quarter | $ | 71.89 | $ | 66.60 | $ | 0.16 | $ | 57.82 | $ | 45.42 | $ | 0.14 | ||||||
| Second Quarter | 76.18 | 68.65 | 0.16 | 60.11 | 55.08 | 0.14 | ||||||||||||
| Third Quarter | 84.64 | 72.48 | 0.19 | 65.68 | 55.97 | 0.14 | ||||||||||||
| Fourth Quarter | 91.04 | 84.77 | 0.19 | 68.83 | 63.05 | 0.16 | ||||||||||||
| $ | 0.70 | $ | 0.58 |
Dividends declared and paid for the years ended December 31, 2017 and 2016 (in millions):
| 2017 | 2016 | ||||||||
| Dividends declared | $ | 213.7 | $ | 178.8 | |||||
| Dividends paid (including those declared in the prior year) | 205.0 | 172.7 |
The Company’s Revolving Credit Facility contains financial covenants and restrictions, some of which may limit the Company’s ability to pay dividends, and any future indebtedness that the Company may incur could limit its ability to pay dividends.
Stock Performance Graph
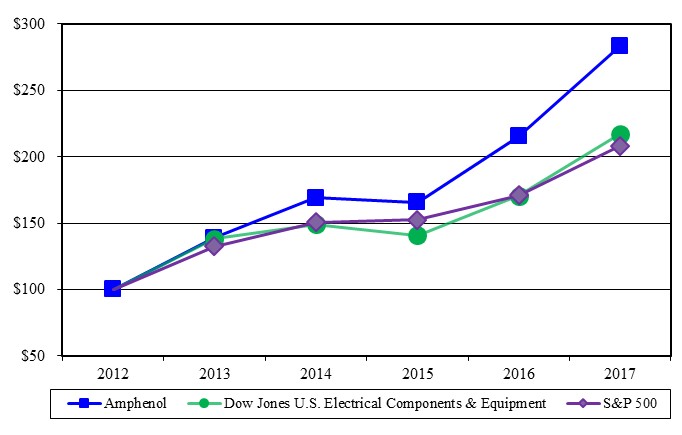
The following graph compares the cumulative total shareholder return of Amphenol over a period of five years ending December 31, 2017 with the performance of the Standard & Poor’s 500 (“S&P 500”) Stock Index and the Dow Jones U.S. Electrical Components & Equipment Index. This graph assumes that $100 was invested in the Common Stock of Amphenol and each index on December 31, 2012, reflects reinvested dividends and is weighted on a market capitalization basis at the time of each reported data point. Each reported data point below represents the last trading day of each calendar year. The comparisons in the graph below are based upon historical data and are not indicative of, nor intended to forecast, future performance.
Equity Compensation Plan Information
The following table summarizes the Company’s equity compensation plan information as of December 31, 2017:
| Equity Compensation Plan Information | ||||||||
| Number of securities to | Weighted average | Number of | ||||||
| be issued upon exercise | exercise price of | securities | ||||||
| of outstanding options, | outstanding options, | remaining available | ||||||
| Plan category | warrants and rights | warrants and rights | for future issuance | |||||
| Equity compensation plans approved by security holders | 33,235,269 | $ | 52.28 | 35,473,014 | ||||
| Equity compensation plans not approved by security holders | — | — | — | |||||
| Total | 33,235,269 | $ | 52.28 | 35,473,014 |
Repurchase of Equity Securities
On January 24, 2017, the Company’s Board of Directors authorized a new stock repurchase program under which the Company may purchase up to $1.0 billion of the Company’s Common Stock during the two-year period ending January 24, 2019 in accordance with the requirements of Rule 10b-18 of the Exchange Act (the “2017 Stock Repurchase Program”). During the year ended December 31, 2017, the Company repurchased 8.4 million shares of its Common Stock for $618.0 million. These treasury shares have been retired by the Company and Common Stock and retained earnings were reduced accordingly. From January 1, 2018 through January 31, 2018, the Company repurchased approximately 1.1 million additional shares of Common Stock for $105.5 million, leaving approximately $276.5 million available to purchase under the 2017 Stock Repurchase Program. The price and timing of any future purchases under the 2017 Stock Repurchase Program will depend on factors such as levels of cash generation from operations, the volume of stock option exercises by employees, cash requirements for acquisitions, dividends, economic and market
conditions and stock price. The table below reflects the Company’s stock repurchases for the year ended December 31, 2017:
| Total Number of | Maximum Dollar | ||||||||||
| (dollars in millions, except price per share) | Shares Purchased as | Value of Shares | |||||||||
| Total Number | Average | Part of Publicly | that May Yet be | ||||||||
| of Shares | Price Paid | Announced Plans or | Purchased Under the | ||||||||
| Period | Purchased | per Share | Programs | Plans or Programs | |||||||
| First Quarter - 2017 | 3,678,365 | $ | 67.74 | 3,678,365 | $ | 750.8 | |||||
| Second Quarter - 2017 | 2,000,000 | 75.36 | 2,000,000 | 600.1 | |||||||
| Third Quarter - 2017 | 2,000,000 | 77.86 | 2,000,000 | 444.4 | |||||||
| Fourth Quarter - 2017: | |||||||||||
| October 1 to October 31, 2017 | — | — | — | 444.4 | |||||||
| November 1 to November 30, 2017 | 446,879 | 88.53 | 446,879 | 404.8 | |||||||
| December 1 to December 31, 2017 | 253,121 | 90.13 | 253,121 | 382.0 | |||||||
| 700,000 | 89.11 | 700,000 | 382.0 | ||||||||
| Total - 2017 | 8,378,365 | $ | 73.76 | 8,378,365 | $ | 382.0 |
In January 2015, the Company’s Board of Directors authorized a stock repurchase program under which the Company could repurchase up to 10 million shares of Common Stock during the two-year period ended January 20, 2017 (the “2015 Stock Repurchase Program”). As of December 31, 2016, the Company had repurchased all of the shares authorized under the 2015 Stock Repurchase Program.
Item 6. Selected Financial Data
The following table presents selected consolidated financial data that is derived from the Company’s audited Consolidated Financial Statements and that should be read in conjunction with our “Management’s Discussion and Analysis of Financial Condition and Results of Operations” and Consolidated Financial Statements and accompanying notes included herein. The Company’s acquisitions during the five-year period below may affect the comparability of results. Our consolidated financial information may not be indicative of our future performance.
| (dollars and shares | |||||||||||||||||
| in millions, except per share data) | 2017 | 2016 | 2015 | 2014 | 2013 | ||||||||||||
| Operations | |||||||||||||||||
| Net sales | $ | 7,011.3 | $ | 6,286.4 | $ | 5,568.7 | $ | 5,345.5 | $ | 4,614.7 | |||||||
| Net income attributable to Amphenol Corporation | 650.5 | (1) | 822.9 | (2) | 763.5 | (3) | 709.1 | (4) | 635.7 | (5) | |||||||
| Net income per common share—Diluted | 2.06 | (1) | 2.61 | (2) | 2.41 | (3) | 2.21 | (4) | 1.96 | (5) | |||||||
| Financial Condition | |||||||||||||||||
| Cash, cash equivalents and short-term investments | $ | 1,753.7 | $ | 1,173.2 | $ | 1,760.4 | $ | 1,329.6 | $ | 1,192.2 | |||||||
| Working capital | 3,076.6 | 1,956.0 | 2,841.6 | 2,406.6 | 1,510.6 | ||||||||||||
| Total assets | 10,003.9 | 8,498.7 | 7,458.4 | 6,985.9 | 6,150.1 | ||||||||||||
| Long-term debt, including current portion | 3,542.6 | 3,010.7 | 2,813.5 | 2,656.2 | 2,122.2 | ||||||||||||
| Shareholders’ equity attributable to Amphenol Corporation | 3,989.8 | 3,674.9 | 3,238.5 | 2,907.4 | 2,859.5 | ||||||||||||
| Weighted average shares outstanding—Diluted | 316.5 | 315.2 | 316.5 | 320.4 | 324.5 | ||||||||||||
| Cash dividends declared per share | $ | 0.70 | $ | 0.58 | $ | 0.53 | $ | 0.45 | $ | 0.305 |
| (1) | Includes (a) an income tax charge of $398.5 related to the enactment of the Tax Cuts and Jobs Act, which represents our current estimate of taxes arising from the implementation of a modified territorial tax regime and the deemed and intended repatriation of prior unremitted earnings of foreign subsidiaries, partially offset by the tax benefit associated with the remeasurement of the Company’s U.S. net deferred tax liabilities due to the U.S. federal corporate tax rate reduction and (b) acquisition-related expenses of $4.0 ($3.7 after-tax) primarily relating to external transaction costs associated with 2017 acquisitions, partially offset by (c) excess tax benefits related to stock-based compensation of $66.6 resulting from the adoption of ASU 2016-09. These items had the aggregate effect of decreasing Net income attributable to Amphenol Corporation and Net income per common share-Diluted by $335.6 and $1.06 per share, respectively. Excluding the effect of these items, Adjusted Net Income attributable to Amphenol Corporation and Adjusted Diluted EPS, both non-GAAP financial measures defined in Part II, Item 7 herein, were $986.1 and $3.12 per share, respectively, for the year ended December 31, 2017. |
|---|
| (2) | Includes acquisition-related expenses of $36.6 ($33.1 after-tax) primarily relating to the FCI and other 2016 acquisitions, including external transaction costs, amortization related to the value associated with acquired backlog and restructuring charges. These items had the aggregate effect of decreasing Net income attributable to Amphenol Corporation and Net income per common share-Diluted by $33.1 and $0.11 per share, respectively. Excluding the effect of these items, Adjusted Net Income attributable to Amphenol Corporation and Adjusted Diluted EPS were $856.0 and $2.72 per share, respectively, for the year ended December 31, 2016. |
|---|
| (3) | Includes acquisition-related expenses of $5.7 ($5.7 after-tax) relating to acquisitions closed and announced in 2015. These acquisition-related expenses had the effect of decreasing Net income attributable to Amphenol Corporation and Net income per common share-Diluted by $5.7 and $0.02 per share, respectively. Excluding the effect of this item, Adjusted Net Income attributable to Amphenol Corporation and Adjusted Diluted EPS were $769.2 and $2.43 per share, respectively, for the year ended December 31, 2015. |
|---|
| (4) | Includes acquisition-related expenses of (a) $4.3 ($4.1 after-tax) relating to 2014 acquisitions and (b) $9.8 ($6.2 after-tax) relating to amortization of the acquired backlogs of completed acquisitions. These items had the aggregate effect of decreasing Net income attributable to Amphenol Corporation and Net income per common share-Diluted by $10.3 and $0.04 per share, respectively. Excluding the effect of these items, Adjusted Net Income attributable to Amphenol Corporation and Adjusted Diluted EPS were $719.4 and $2.25 per share, respectively, for the year ended December 31, 2014. |
|---|
| (5) | Includes (a) acquisition-related expenses of $6.0 ($4.6 after-tax) relating to 2013 acquisitions, (b) an income tax benefit of $3.6 due primarily to the favorable completion of prior year audits, and (c) an income tax benefit of $11.3 resulting from the delay, by the U.S. government, in the reinstatement of certain federal income tax provisions for the year 2012 relating primarily to research and development credits and certain U.S. taxes on foreign income. Such tax provisions were reinstated on January 2, 2013 with retroactive effect to 2012. Under U.S. GAAP, the benefit to the Company of $11.3, relating to the 2012 tax year was recorded as a benefit in the first quarter of 2013 at the date of reinstatement. These items had the aggregate effect of increasing Net income attributable to Amphenol Corporation and Net income per common share-Diluted by $10.3 and $0.03 per share, respectively. Excluding the effect of these items, Adjusted Net Income attributable to Amphenol Corporation and Adjusted Diluted EPS were $625.4 and $1.93 per share, respectively, for the year ended December 31, 2013. |
|---|
Item 7. Management’s Discussion and Analysis of Financial Condition and Results of Operations
(dollars in millions, except per share data)
The following discussion and analysis of the results of operations for the three years ended December 31, 2017, 2016 and 2015 has been derived from and should be read in conjunction with the Consolidated Financial Statements included in Part II, Item 8, herein. The Consolidated Financial Statements have been prepared in U.S. dollars, in accordance with accounting principles generally accepted in the United States (“U.S. GAAP”). The following discussion and analysis also includes references to certain non-GAAP financial measures, which are defined in the “Non-GAAP Financial Measures” section below, including “Constant Currency Net Sales Growth” and “Organic Net Sales Growth”. For purposes of the following discussion, the terms “constant currencies” and “organically” have the same meanings as these aforementioned non-GAAP financial measures. Refer to “Non-GAAP Financial Measures” within this Item 7 for more information, including our reasons for including non-GAAP financial measures and material limitations with respect to the usefulness of the measures.
In addition to historical information, the following discussion and analysis also contains certain forward-looking statements that are subject to risks and uncertainties, including but not limited to the risk factors described in Item 1A herein, as well as the risks and uncertainties that exist with the use of forward-looking statements as described in the “Cautionary Note Regarding Forward-Looking Statements” section included herein at the beginning of this Annual Report on Form 10-K.
Overview
General
The Company is one of the world’s largest designers, manufacturers and marketers of electrical, electronic and fiber optic connectors, interconnect systems, antennas, sensors and sensor-based products and coaxial and high-speed specialty cable. The Company operates through two reporting segments: (i) Interconnect Products and Assemblies and (ii) Cable Products and Solutions. In 2017, approximately 72% of the Company’s sales were outside the U.S. The primary end markets for our products are:
| · | information technology and communication devices and systems for the converging technologies of voice, video and data communications; |
|---|
| · | a broad range of industrial applications and traditional and hybrid-electric automotive applications; and |
|---|
| · | commercial aerospace and military applications. |
|---|
The Company’s products are used in a wide variety of applications by numerous customers. The Company competes primarily on the basis of technology innovation, product quality, price, customer service and delivery time. There has been a trend on the part of customers to consolidate their lists of qualified suppliers to companies that have the ability to meet certain technical, quality, delivery and other standards while maintaining competitive prices. The Company has focused its global resources to position itself to compete effectively in this environment. The Company believes that its global presence is an important competitive advantage as it allows the Company to provide quality products on a timely and worldwide basis to its multinational customers.
Strategy
The Company’s strategy is to provide its customers with comprehensive design capabilities, a broad selection of products and a high level of service on a worldwide basis while maintaining continuing programs of productivity improvement and cost control. The Company focuses its research and development efforts through close collaboration with its customers to develop highly-engineered products that meet customer needs and have the potential for broad market applications and significant sales within a one- to three-year period. The Company is also focused on controlling costs. The Company does this by investing in modern manufacturing technologies, controlling purchasing processes and expanding into lower cost areas.
The Company’s strategic objective is to further enhance its position in its served markets by pursuing the following success factors:
| · | Pursue broad diversification; |
|---|
| · | Develop performance-enhancing interconnect solutions; |
|---|
| · | Expand global presence; |
|---|
| · | Control costs; |
|---|
| · | Pursue strategic acquisitions and investments; and |
|---|
| · | Foster collaborative, entrepreneurial management. |
|---|
In 2017, the Company reported net sales and operating income of $7,011.3 and $1,427.6, respectively, up 12% and 18%, respectively, from 2016. The Company also reported net income attributable to Amphenol Corporation of $650.5, down 21% from 2016, primarily as a result of the enactment of the Tax Cuts and Jobs Act which resulted in a provisional income tax charge of $398.5 in 2017 as discussed in more detail below and in the Notes to the Consolidated Financial Statements within this Annual Report on Form 10-K, in addition to the impact of the acquisition-related expenses incurred in the respective periods, partially offset by the excess tax benefits of $66.6 related to stock-based compensation as a result of the adoption of the new stock-based compensation standard. Excluding the effects of these items, Adjusted Operating Income and Adjusted Net Income attributable to Amphenol Corporation, as defined in the “Non-GAAP Financial Measures” section below and as reconciled in Part II, Item 6 and Item 7 herein, both increased by 15% in 2017. Sales and profitability trends are discussed in detail in “Results of Operations” below. In addition, a strength of the Company has been its ability to consistently generate cash from operations. The Company uses cash generated from operations to fund capital expenditures and acquisitions, repurchase shares of its common stock, pay dividends and reduce indebtedness. In 2017, the Company generated operating cash flow of $1,144.2.
Tax Cuts and Jobs Act of 2017
On December 22, 2017, the United States federal government enacted the Tax Cuts and Jobs Act (“Tax Act”), marking a change from a worldwide tax system to a modified territorial tax system in the United States. As part of this change, the Tax Act, among other changes, provides for a transition tax on the accumulated unremitted foreign earnings and profits of the Company’s foreign subsidiaries (“Transition Tax”) and a reduction of the U.S. federal corporate income tax rate from 35% to 21%. As a result, in the fourth quarter of 2017, the Company recorded an income tax charge of $398.5 (“Tax Act Charge”) that was comprised of (i) the Transition Tax of $259.4, (ii) a charge of $176.6 related to changes in the Company’s permanent reinvestment assertion with regards to prior accumulated unremitted earnings from certain foreign subsidiaries, partially offset by (iii) a tax benefit of $37.5 associated with the remeasurement of the Company’s U.S. net deferred tax liabilities due to the U.S. federal corporate tax rate reduction. As discussed under Critical Accounting Policies and Estimates within this Item 7, the three components of the Tax Act Charge are provisional amounts recorded in accordance with Staff Accounting Bulletin No. 118 (“SAB 118”). SAB 118 addresses the application of U.S. GAAP in situations where a registrant does not have the necessary information available, prepared, or analyzed in reasonable detail to complete the accounting for certain income tax effects of the Tax Act. Due to the timing of the Tax Act’s enactment and the complexity of its provisions, the Company has not completed its accounting for the impact of the Tax Act. The Company will analyze guidance and technical interpretations of the provisions of the Tax Act, as well as refine, analyze and update the underlying data, computations and assu
Showing the first 8K of 85K characters. Open the full section
Item 7A. Quantitative and Qualitative Disclosures About Market Risk
(dollars in millions)
The Company, in the normal course of doing business, is exposed to a variety of risks, including market risks associated with foreign currency exchange rates and changes in interest rates. The Company does not have any significant concentration with any one counterparty.
Foreign Currency Exchange Rate Risk
The Company conducts business in many international currencies through its worldwide operations, and as a result is subject to foreign exchange exposure due to changes in exchange rates of the various currencies. Changes in exchange rates can positively or negatively affect the Company’s sales, operating margins and equity. The Company attempts to manage currency exposure risk in a number of ways including producing its products in the same country or region in which the products are sold (thereby generating revenues and incurring expenses in the same currency), cost reduction and pricing actions, and working capital management. However, there can be no assurance that these actions will be fully effective in managing currency risk, including in the event of a significant and sudden decline in the value of any of the international currencies of the Company’s worldwide operations.
As of December 31, 2017, the Company had six forward contracts of varying amounts that effectively fixed Euro, Great Britain Pound and Korean Won intercompany debt obligations into fixed Hong Kong dollar denominated obligations expiring at various times through 2018 concurrent with the underlying intercompany loans. The fair value of the contracts at December 31, 2017 resulted in a net asset of $2.3. A 10% change in foreign currency exchange rates would not have a material effect on the value of the hedges as of December 31, 2017 and 2016. The Company does not engage in purchasing forward contracts for trading or speculative purposes.
Refer to Note 3 of the Notes to the Consolidated Financial Statements for a discussion of derivative financial instruments.
Interest Rate Risk
The Company is subject to market risk from exposure to changes in interest rates based on the Company’s financing activities. The Company manages its exposure to interest rate risk through a mix of fixed and variable rate debt. In April 2017, the Company issued $400.0 principal amount of unsecured 2.20% senior notes due April 2020 and $350.0 principal amount of unsecured 3.20% senior notes due April 2024. The Company used all of the net proceeds to repay the outstanding 1.55% senior notes of $375.0 that was due in September 2017 as well as for general corporate purposes.
Any borrowings under the Revolving Credit Facility either bear interest at or trade at rates that fluctuate with a spread over LIBOR, while any borrowings under the Commercial Paper Program are subject to floating interest rates. Therefore, when the Company borrows under these debt instruments, the Company is exposed to market risk related to changes in interest rates. As of December 31, 2017, $1,182.0, or 33%, of the Company’s outstanding borrowings, which related mainly to its Commercial Paper Program, were subject to floating interest rates. At December 31, 2017 and 2016, the Company’s average floating rate on such borrowings was 1.71% and 1.06%, respectively. A 10% change in this interest rate at December 31, 2017 and 2016 would not have a material effect on interest expense. The Company does not expect changes in interest rates to have a material effect on income or cash flows in 2018, although there can be no assurances that interest rates will not change significantly.
Item 8. Financial Statements and Supplementary Data
REPORT OF INDEPENDENT REGISTERED PUBLIC ACCOUNTING FIRM
To the Board of Directors and Shareholders of
Amphenol Corporation
Wallingford, Connecticut
Opinions on the Financial Statements and Internal Control over Financial Reporting
We have audited the accompanying consolidated balance sheets of Amphenol Corporation and subsidiaries (the "Company") as of December 31, 2017 and 2016, the related consolidated statements of income, comprehensive income, changes in equity, and cash flows for each of the three years in the period ended December 31, 2017, and the related notes and the financial statement schedule listed in the Index at Item 15 (collectively referred to as the “financial statements”). We also have audited the Company’s internal control over financial reporting as of December 31, 2017, based on criteria established in Internal Control — Integrated Framework (2013) issued by the Committee of Sponsoring Organizations of the Treadway Commission (COSO).
In our opinion, the financial statements referred to above present fairly, in all material respects, the financial position of the Company as of December 31, 2017 and 2016, and the results of its operations and its cash flows for each of the three years in the period ended December 31, 2017, in conformity with accounting principles generally accepted in the United States of America. Also, in our opinion, the Company maintained, in all material respects, effective internal control over financial reporting as of December 31, 2017, based on criteria established in Internal Control — Integrated Framework (2013) issued by COSO.
Basis for Opinions
The Company’s management is responsible for these financial statements and financial statement schedule, for maintaining effective internal control over financial reporting, and for its assessment of the effectiveness of internal control over financial reporting, included in the accompanying Management Report on Internal Control. Our responsibility is to express an opinion on these financial statements and financial statement schedule and an opinion on the Company’s internal control over financial reporting based on our audits. We are a public accounting firm registered with the Public Company Accounting Oversight Board (United States) (PCAOB) and are required to be independent with respect to the Company in accordance with the U.S. federal securities laws and the applicable rules and regulations of the Securities and Exchange Commission and the PCAOB.
We conducted our audits in accordance with the standards of the PCAOB. Those standards require that we plan and perform the audits to obtain reasonable assurance about whether the financial statements are free of material misstatement, whether due to error or fraud, and whether effective internal control over financial reporting was maintained in all material respects.
Our audits of the financial statements included performing procedures to assess the risks of material misstatement of the financial statements, whether due to error or fraud, and performing procedures to respond to those risks. Such procedures included examining, on a test basis, evidence regarding the amounts and disclosures in the financial statements. Our audits also included evaluating the accounting principles used and significant estimates made by management, as well as evaluating the overall presentation of the financial statements. Our audit of internal control over financial reporting included obtaining an understanding of internal control over financial reporting, assessing the risk that a material weakness exists, and testing and evaluating the design and operating effectiveness of internal control based on the assessed risk. Our audits also included performing such other procedures as we considered necessary in the circumstances. We believe that our audits provide a reasonable basis for our opinions.
Definition and Limitations of Internal Control over Financial Reporting
A company’s internal control over financial reporting is a process designed to provide reasonable assurance regarding the reliability of financial reporting and the preparation of financial statements for external purposes in accordance with generally accepted accounting principles. A company’s internal control over financial reporting includes those policies and procedures that (1) pertain to the maintenance of records that, in reasonable detail, accurately and fairly reflect the transactions and dispositions of the assets of the company; (2) provide reasonable assurance that transactions are recorded as necessary to permit preparation of financial statements in accordance with generally accepted accounting principles, and that receipts and expenditures of the company are being made only in accordance with authorizations of management and directors of the company; and (3) provide reasonable assurance regarding prevention or timely
detection of unauthorized acquisition, use, or disposition of the company’s assets that could have a material effect on the financial statements.
Because of its inherent limitations, internal control over financial reporting may not prevent or detect misstatements. Also, projections of any evaluation of effectiveness to future periods are subject to the risk that controls may become inadequate because of changes in conditions, or that the degree of compliance with the policies or procedures may deteriorate.
/s/ DELOITTE & TOUCHE LLP
Hartford, Connecticut
February 21, 2018
We have served as the Company's auditor since 1997.
AMPHENOL CORPORATION
Consolidated Statements of Income
(dollars and shares in millions, except per share data)
| Year Ended December 31, | ||||||||||
| 2017 | 2016 | 2015 | ||||||||
| Net sales | $ | 7,011.3 | $ | 6,286.4 | $ | 5,568.7 | ||||
| Cost of sales | 4,701.4 | 4,246.4 | 3,789.2 | |||||||
| Gross profit | 2,309.9 | 2,040.0 | 1,779.5 | |||||||
| Acquisition-related expenses | 4.0 | 36.6 | 5.7 | |||||||
| Selling, general and administrative expenses | 878.3 | 798.2 | 669.1 | |||||||
| Operating income | 1,427.6 | 1,205.2 | 1,104.7 | |||||||
| Interest expense | (92.3) | (72.6) | (68.3) | |||||||
| Other income, net | 17.1 | 8.5 | 16.4 | |||||||
| Income before income taxes | 1,352.4 | 1,141.1 | 1,052.8 | |||||||
| Provision for income taxes | (691.7) | (308.5) | (280.5) | |||||||
| Net income | 660.7 | 832.6 | 772.3 | |||||||
| Less: Net income attributable to noncontrolling interests | (10.2) | (9.7) | (8.8) | |||||||
| Net income attributable to Amphenol Corporation | $ | 650.5 | $ | 822.9 | $ | 763.5 | ||||
| Net income per common share — Basic | $ | 2.13 | $ | 2.67 | $ | 2.47 | ||||
| Weighted average common shares outstanding — Basic | 305.7 | 308.3 | 309.1 | |||||||
| Net income per common share — Diluted | $ | 2.06 | $ | 2.61 | $ | 2.41 | ||||
| Weighted average common shares outstanding — Diluted | 316.5 | 315.2 | 316.5 | |||||||
| Dividends declared per common share | $ | 0.70 | $ | 0.58 | $ | 0.53 |
See accompanying notes to consolidated financial statements.
AMPHENOL CORPORATION
Consolidated Statements of Comprehensive Income
(dollars in millions)
| Year Ended December 31, | ||||||||||
| 2017 | 2016 | 2015 | ||||||||
| Net income |
Showing the first 8K of 141K characters. Open the full section
Item 9. Changes in and Disagreements with Accountants on Accounting and Financial Disclosure
None.
Item 9A. Controls and Procedures
The Company’s management, with the participation of the Company’s Chief Executive Officer and Chief Financial Officer, has evaluated the effectiveness of the design and operation of our disclosure controls and procedures, pursuant to Rules 13a-15(e) or 15d-15(e) of the Securities Exchange Act of 1934, as amended (the “Exchange Act”), as of December 31, 2017. These controls and procedures are designed to provide reasonable assurance that information required to be disclosed by the Company in reports that it files or submits under the Exchange Act is recorded, processed, summarized and reported within the time periods specified in the Securities and Exchange Commission rules and forms, and such information is accumulated and communicated to our management, including our Chief Executive Officer and Chief Financial Officer, as appropriate, to allow timely decisions regarding required disclosure. Based on their evaluation, the Chief Executive Officer and Chief Financial Officer have concluded that the Company’s disclosure controls and procedures were effective as of December 31, 2017. There has been no change in our internal control over financial reporting during our most recent fiscal quarter ended December 31, 2017 that has materially affected, or is reasonably likely to materially affect, our internal control over financial reporting.
Management Report on Internal Control
Internal control over financial reporting is designed to provide reasonable assurance regarding the reliability of financial reporting and the preparation of financial statements for external reporting purposes in accordance with accounting principles generally accepted in the United States of America. Due to its inherent limitations, internal control over financial reporting may not prevent or detect misstatements. Management is responsible for establishing and maintaining adequate internal control over financial reporting of Amphenol Corporation and its subsidiaries (the “Company”), pursuant to Rules 13a-15(f) and 15d-15(f) of the Exchange Act. Under the supervision and with the participation of our management, including our principal executive officer and principal financial officer, the Company conducted an evaluation of the effectiveness of the internal control over financial reporting based on the Committee of Sponsoring Organizations of the Treadway Commission (COSO) Framework (2013). Based on that evaluation, management concluded that the Company’s internal control over financial reporting was effective as of December 31, 2017.
Deloitte & Touche LLP, an independent registered public accounting firm, has audited the Company’s internal control over financial reporting as of December 31, 2017 in accordance with the standards of the Public Company Accounting Oversight Board (PCAOB). Those standards require that Deloitte & Touche LLP plan and perform the audit to obtain reasonable assurance about whether effective internal control over financial reporting was maintained in all material respects. Deloitte & Touche LLP has issued an attestation report on the Company’s internal control over financial reporting as of December 31, 2017, which is included in Item 8 of this Annual Report on Form 10-K.
Item 9B. Other Information
None.
PART III
The Company intends to file a definitive proxy statement (the “Proxy Statement”) pursuant to Regulation 14A under the Securities Exchange Act within 120 days following the end of the fiscal year ended December 31, 2017, and certain information included therein is incorporated herein by reference.
Item 10. Directors, Executive Officers and Corporate Governance
Pursuant to Instruction G(3) to Form 10-K, the information required by Item 10 with respect to the Directors of the Registrant is incorporated herein by reference to the Proxy Statement.
Pursuant to Instruction G(3) to Form 10-K, the information required by Item 10 with respect to the Executive Officers of the Registrant is incorporated herein by reference to the Proxy Statement.
Information regarding the Company’s Code of Business Conduct and Ethics is available on the Company’s website at www.amphenol.com. The Company will post all amendments to its Code of Business Conduct and Ethics on its website. In addition, a current copy may be requested by writing to the Company’s World Headquarters at:
358 Hall Avenue
P.O. Box 5030
Wallingford, CT 06492
Attention: Investor Relations
Item 11. Executive Compensation
Pursuant to Instruction G(3) to Form 10-K, the information required by Item 11 is incorporated herein by reference to the Proxy Statement.
Item 12. Security Ownership of Certain Beneficial Owners and Management and Related Stockholder Matters
Pursuant to Instruction G(3) to Form 10-K, the information required by Item 12 is incorporated herein by reference to the Proxy Statement.
For information required under Item 201(d) of Regulation S-K, refer to Item 5 of this report.
Item 13. Certain Relationships and Related Transactions, and Director Independence
Pursuant to Instruction G(3) to Form 10-K, the information required by Item 13 is incorporated herein by reference to the Proxy Statement.
Item 14. Principal Accounting Fees and Services
Pursuant to Instruction G(3) to Form 10-K, the information required by Item 14 is incorporated herein by reference to the Proxy Statement.
PART IV
Item 15. Exhibits, Financial Statement Schedules
(a)(1) Consolidated Financial Statements
Schedules other than the above have been omitted because they are either not applicable or the required information has been disclosed in the consolidated financial statements or notes thereto.
(a)(3) Listing of Exhibits
The following exhibits are filed as part of, or incorporated by reference into, this Annual Report on Form 10-K:
| 32.2 | Certification pursuant to 18 U.S.C. Section 1350, as adopted pursuant to Section 906 of the Sarbanes-Oxley Act of 2002.** | |||
|---|---|---|---|---|
| 101.INS | XBRL Instance Document.** | |||
| 101.SCH | XBRL Taxonomy Extension Schema Document.** | |||
| 101.CAL | XBRL Taxonomy Extension Calculation Linkbase Document.** | |||
| 101.DEF | XBRL Taxonomy Extension Definition Linkbase Document.** | |||
| 101.LAB | XBRL Taxonomy Extension Label Linkbase Document.** | |||
| 101.PRE | XBRL Taxonomy Extension Presentation Linkbase Document.** |
- Incorporated herein by reference as stated.
** Filed herewith.
Item 16. Form 10-K Summary
Not applicable.
SCHEDULE II
AMPHENOL CORPORATION AND SUBSIDIARIES
VALUATION AND QUALIFYING ACCOUNTS
For the years ended December 31, 2017, 2016 and 2015
(Dollars in millions)
| Balance at | Charged to | Balance at | |||||||||||
| beginning | cost and | Additions | end of | ||||||||||
| of period | expenses | (Deductions) | period | ||||||||||
| Allowance for doubtful accounts: | |||||||||||||
| Year ended 2017 | $ | 23.6 | $ | 1.8 | $ | (2.4) | $ | 23.0 | |||||
| Year ended 2016 | 25.6 | 6.0 | (8.0) | 23.6 | |||||||||
| Year ended 2015 | 20.2 | 3.7 | 1.7 | 25.6 | |||||||||
| Valuation allowance on deferred tax assets: | |||||||||||||
| Year ended 2017 | $ | 37.2 | $ | 2.5 | $ | (0.1) | $ | 39.6 | |||||
| Year ended 2016 | 18.5 | 4.8 | 13.9 | 37.2 | |||||||||
| Year ended 2015 | 15.5 | 3.0 | — | 18.5 |
Signatures
Pursuant to the requirements of Section 13 or 15(d) of the Securities Exchange Act of 1934, the registrant has duly caused this report to be signed on its behalf by the undersigned, thereunto duly authorized in the Town of Wallingford, State of Connecticut on the 21st day of February, 2018.
| AMPHENOL CORPORATION | |
| /s/ R. Adam Norwitt | |
| R. Adam Norwitt | |
| President and Chief Executive Officer |
Pursuant to the requirements of the Securities Exchange Act of 1934, this report has been signed below by the following persons on behalf of the registrant and in the capacities and on the dates indicated below.
| Signature | Title | Date | ||
| /s/ R. Adam Norwitt | President and Chief Executive Officer | February 21, 2018 | ||
| R. Adam Norwitt | (Principal Executive Officer) | |||
| /s/ Craig A. Lampo | Senior Vice President and Chief Financial Officer | February 21, 2018 | ||
| Craig A. Lampo | (Principal Financial Officer and Principal Accounting Officer) | |||
| /s/ Martin H. Loeffler | Chairman of the Board of Directors | February 21, 2018 | ||
| Martin H. Loeffler | ||||
| /s/ Ronald P. Badie | Director | February 21, 2018 | ||
| Ronald P. Badie | ||||
| /s/ Stanley L. Clark | Director | February 21, 2018 | ||
| Stanley L. Clark | ||||
| /s/ John D. Craig | Director | February 21, 2018 | ||
| John D. Craig | ||||
| /s/ David P. Falck | Director | February 21, 2018 | ||
| David P. Falck | ||||
| /s/ Edward G. Jepsen | Director | February 21, 2018 | ||
| Edward G. Jepsen | ||||
| /s/ John R. Lord | Director | February 21, 2018 | ||
| John R. Lord | ||||
| /s/ Diana G. Reardon | Director | February 21, 2018 | ||
| Diana G. Reardon |