 filings.tools
Amphenol (APH) 10-K risk factor changes: FY2017 vs FY2016
The 2017-12-31 10-K against the 2016-12-31 one, compared heading by heading and sentence by sentence. One of these filings carries no fiscal year tag, so its year is the calendar year of the period end.
Item 1A37 rewritten26 added14 removed89 unchanged
All filing items760 rewritten520 added365 removed1,327 unchanged
Summary
counted, not written
- Item 1A headings could not be compared: only 0 carried over between the two years, which usually means one filing was read wrongly, so none is reported as new or removed.
- Sentence by sentence, 520 added, 365 removed, 760 rewritten and 1,327 unchanged across 14 items that differ.
Sentences by item
22 items, with every count and a link to each item that changed
| Item | Added | Removed | Rewritten | Unchanged |
|---|---|---|---|---|
| Item 1A. Risk Factors | 26 | 14 | 37 | 89 |
| Item 7. Management’s Discussion and Analysis of Financial Condition and Results of Operations | 146 | 101 | 133 | 228 |
| Item 7A. Quantitative and Qualitative Disclosures About Market Risk | 3 | 2 | 10 | 11 |
| Item 1. Business | 10 | 6 | 45 | 239 |
| Item 3. Legal Proceedings | 0 | 0 | 1 | 2 |
| Cover and table of contents | 2 | 1 | 38 | 73 |
| Item 1B. Unresolved Staff Comments | 0 | 0 | 0 | 1 |
| Item 2. Properties | 0 | 0 | 1 | 6 |
| Item 4. Mine Safety Disclosures | 0 | 0 | 0 | 2 |
| Item 5. Market for Registrant’s Common Equity, Related Stockholder Matters and Issuer Purchases of Equity Securities | 30 | 21 | 20 | 21 |
| Item 6. Selected Financial Data | 1 | 1 | 15 | 15 |
| Item 8. Financial Statements and Supplementary Data | 242 | 155 | 429 | 555 |
| Item 9. Changes in and Disagreements with Accountants on Accounting and Financial Disclosure | 0 | 0 | 0 | 1 |
| Item 9A. Controls and Procedures | 0 | 0 | 7 | 6 |
| Item 9B. Other Information | 1 | 2 | 1 | 1 |
| Item 10. Directors, Executive Officers and Corporate Governance | 0 | 0 | 0 | 9 |
| Item 11. Executive Compensation | 0 | 0 | 0 | 1 |
| Item 12. Security Ownership of Certain Beneficial Owners and Management and Related Stockholder Matters | 0 | 0 | 0 | 2 |
| Item 13. Certain Relationships and Related Transactions, and Director Independence | 0 | 0 | 0 | 1 |
| Item 14. Principal Accounting Fees and Services | 0 | 0 | 0 | 2 |
| Item 15. Exhibits, Financial Statement Schedules | 54 | 3 | 10 | 16 |
| Item 16. Form 10-K Summary | 5 | 59 | 13 | 46 |
Underlined words on a shaded ground are new in FY2017; struck-through words were in FY2016. Sentences that are wholly new or wholly gone are labelled rather than marked.
Item 1A. Risk Factors
37 rewritten, 26 added, 14 removed, 89 unchanged
Approximately [removed: 50%] [added: 48%] of the Company’s [removed: 2016] [added: 2017] net sales came from sales to the communications industry, including information technology and data communication, wireless communications and broadband communications, with 14% of the Company’s [removed: 2016] [added: 2017] net sales coming from sales to the mobile device market.
Furthermore, there has been a trend on the part of [removed: OEM] customers to consolidate their lists of qualified suppliers to companies that have the ability to meet certain [removed: quality, delivery and other standards while maintaining competitive prices.][added: technical,]
Approximately 6% and [removed: 9%] [added: 8%] of the Company’s [removed: 2016] [added: 2017] net sales came from sales to the broadband communications and mobile networks markets, respectively.
The amount of this capital spending and, therefore, the Company’s sales and profitability will be affected by a variety of factors, including general economic conditions, consolidation within the communications industry, the financial condition of operators and their [added: access to financing, competition, technological developments, new legislation and regulation of operators.]
Approximately [removed: 9%] [added: 10%] of the Company’s [removed: 2016] [added: 2017] net sales came from sales to the military market.
The Company estimates that products introduced in the last two years accounted for approximately [removed: 20%] [added: 25%] of [removed: 2016] [added: 2017] net sales.
If the Company [removed: fails to] [added: fails,] or is significantly [removed: delayed] [added: delayed,] in introducing new product line concepts or if the Company’s new products are not met with market acceptance, its business, financial condition and results of operations may be adversely affected.
Upon the occurrence of an event of default under any of the Company’s credit facilities, the lenders could [added: terminate all commitments to extend further credit and] elect to declare amounts outstanding thereunder to be immediately due and payable [removed: and terminate all commitments] [added: which could result in the Company not having sufficient assets] to [removed: extend further credit.][added: repay the Revolving Credit Facility and other indebtedness.]
As of December 31, [removed: 2016,] [added: 2017,] the Company had outstanding borrowings under the Revolving Credit Facility and the commercial paper program of nil and [removed: $1,018.9] [added: $1,175.4] million, respectively.
As such, this could have a material adverse effect on the Company’s business, financial condition, results of operations or [added: cash flows.]
As of December 31, [removed: 2016, $1,024.4] [added: 2017, approximately $1,182.0] million, or [removed: 34%,] [added: 33%,] of the Company’s outstanding borrowings were subject to floating interest [removed: rates.][added: rates and were primarily comprised of commercial paper borrowings.]
| [added: $] | 750.0 | | 2.55 | % | January 2019 | | |
A 10% change in LIBOR or floating interest rates at December 31, [removed: 2016] [added: 2017] would not have a material effect on the Company’s interest expense.
The Company does not expect changes in interest rates to have a material effect on income or cash flows in [removed: 2017,] [added: 2018,] although there can be no assurance that interest rates will not change significantly.
Changes in exchange rates can positively or negatively affect the Company’s sales, [removed: gross] [added: operating] margins and equity.
However, there can be no assurance that these actions will be fully effective in managing currency risk, [removed: especially] [added: including] in the event of a significant and sudden decline in the value of any of the international currencies of the Company’s worldwide operations, which could have an adverse effect on the Company’s business, financial condition and results of operations.
[removed: The] [added: Non-U.S. markets form a substantial portion of the Company’s business and as a result, the] Company is [removed: subject] [added: more exposed] to [removed: the risks of] political, [removed: economic and] [added: economic,] military [removed: instability] [added: and other risks] in countries outside the United States.
During [removed: 2016,] [added: 2017,] non-U.S. markets constituted approximately 72% of the Company’s net sales, with China constituting approximately 30% of the Company’s net sales.
Because the Company has extensive non-U.S. operations as well as significant cash and cash investments held at institutions located outside of the U.S., it is exposed to [added: additional] risks that could have a material adverse effect on the Company’s business, financial condition, results of operations, or cash flows, including:
| | · | | instability in [removed: economic or] political [added: or economic] conditions, including [added: but not limited to] inflation, recession, foreign currency exchange restrictions and devaluations, [added: restrictive governmental controls on the movement] and [added: repatriation of earnings and capital, and] actual or anticipated military or political conflicts, particularly in emerging markets; [removed: and] |
The Company may experience difficulties and unanticipated [removed: expense of assimilating] [added: expenses in connection with purchasing and integrating] newly acquired businesses, including the potential for the impairment of goodwill.
The Company may experience difficulty and unanticipated expenses associated with [added: purchasing and] integrating such acquisitions, and the acquisitions may not perform as expected.
At December 31, [removed: 2016,] [added: 2017,] the total assets of the Company were [removed: $8,498.7] [added: $10,003.9] million, which included [removed: $3,678.8] [added: $4,042.6] million of goodwill (the excess of fair value of consideration paid over the fair value of net identifiable assets of businesses acquired).
Such violations or allegations could damage the Company’s reputation, lead to criminal or civil investigations in the U.S. or foreign [added: jurisdictions, and ultimately result in monetary or non-monetary penalties and/or significant legal and administrative fees.]
While the Company does maintain [added: certain] insurance [removed: coverage to] [added: coverages that may] mitigate losses associated with some of these types of proceedings, the [added: policy may not respond in all cases and the] amount of insurance coverage may not be adequate to cover the total claims and liabilities.
Cybersecurity incidents on our information technology systems could disrupt business operations, resulting in adverse impacts to our reputation and operating results and potentially [removed: lead] [added: leading] to [removed: litigation.][added: litigation and/or governmental investigations.]
[removed: Global cybersecurity] [added: Cybersecurity] threats to the Company could lead to unauthorized access to the Company’s information technology systems, products, customers, suppliers and third party service providers.
Despite the Company’s implementation of preventative security measures to prevent, detect, address and mitigate these threats, our infrastructure may still be susceptible to disruptions from a cybersecurity incident, security breaches, computer viruses, outages, systems [removed: failures, natural disasters] [added: failures] or [added: other] catastrophic events, any of which could include reputational [removed: damage and] [added: damage,] litigation with third [removed: parties,] [added: parties and/or governmental investigations, among other things,] which could have a material adverse effect on our business, financial condition and results of operations.
Changes in general economic conditions, geopolitical conditions, [added: U.S. trade policies] and other factors beyond the Company’s control may adversely impact our business and operating results.
[removed: The following factors] [added: Such operational changes] could have a material adverse effect on [removed: the Company’s] [added: our] business, financial condition, results of operations or cash [removed: flows:][added: flows.]
| | · | | a global [added: or regional] economic slowdown in any of the Company’s market segments; |
| | · | | [removed: uncertainty about global, regional and U.S. economic or geopolitical conditions that result in] postponement of spending, in response to tighter credit, financial market volatility and other factors; |
| | · | | [removed: the] effects of significant changes in economic, monetary and fiscal policies in the U.S. and abroad including significant income tax changes, currency fluctuations and [removed: unforeseen] inflationary pressures; |
| | · | | intergovernmental conflicts or actions, including but not limited to armed conflict, trade wars and acts of terrorism or war; [added: and] |
| | · | | interruptions to the Company’s business with its largest customers, distributors and suppliers resulting from but not limited to, strikes, financial instabilities, computer [removed: malfunctions,] [added: malfunctions or cybersecurity incidents,] inventory excesses, natural disasters or other disasters such as fires, floods, earthquakes, hurricanes or [removed: explosions;] [added: explosions.] |
| | · | | [added: employment regulations and local labor conditions, including] increases in employment costs, particularly in low-cost regions in which the Company currently operates; [removed: and] |
| | · | | changes in assumptions, such as discount rates, along with lower than expected investment returns and performance related to the Company’s benefit [removed: plans.] [added: plans; and] |
quality, delivery and other standards while maintaining competitive prices.
As of December 31, 2017, approximately 67% of the Company’s outstanding borrowings were based on fixed rates and primarily related to the following unsecured Senior Notes:
| | 400.0 | | 2.20 | % | April 2020 | | |
| | 350.0 | | 3.20 | % | April 2024 | | |
Changes in fiscal and tax policies, audits and examinations by taxing authorities could impact the Company’s results.
The Company is subject to taxes in the U.S. and numerous international jurisdictions.
Changes in tax laws, regulations and other tax guidance, including related interpretations, could materially impact the Company’s current, non-current and deferred tax assets and liabilities.
The Company is subject to tax examinations by various tax authorities and in addition, new examinations could be initiated by tax authorities.
As the Company has operations in jurisdictions throughout the world, the risk of tax examinations will continue to occur.
The Company’s financial condition, results of operations or cash flows may be materially impacted by the results of these tax examinations.
On December 22, 2017, the U.S. government enacted comprehensive tax legislation commonly referred to as the Tax Cuts and Jobs Act (“Tax Act”).
The changes included in the Tax Act are broad and complex.
The final transition impacts of the Tax Act may differ from the estimates provided elsewhere in this report, possibly materially, due to, among other things, changes in interpretations of the Tax Act, any legislative action to address questions that arise because of the Tax Act, any changes in accounting standards for income taxes or related interpretations in response to the Tax Act, or any updates or changes to estimates the Company has utilized to calculate the transition impacts.
During, and following, the U.S. presidential election in 2016, there has been discussion and dialogue regarding potential significant changes to U.S. trade policies, legislation, treaties and tariffs, including the North American Free Trade Agreement (“NAFTA”) as well as trade policies and tariffs affecting China.
At this time, it is unknown whether and to what extent new legislation will be passed into law, pending or new regulatory proposals will be adopted, international trade agreements will be negotiated, or the effect that any such action would have, either positively or negatively, on our industry or our Company.
If any new legislation and/or regulations are implemented, or if existing trade agreements are renegotiated, it may be inefficient and expensive for us to alter our business operations in order to adapt to or comply with such changes.
In addition to changes in U.S. trade policy, a number of other economic and geopolitical factors both in the U.S. and abroad could have a material adverse effect on the Company’s business, financial condition, results of operations or cash flows, which could ultimately result in:
| | · | | industrial policies in various countries that favor domestic industries over multinationals or that restrict foreign companies altogether; |
The Company may be subject to environmental laws and regulations that could adversely affect its business.
The Company operates in both the United States and various foreign jurisdictions, and we must comply with locally enacted laws and regulations addressing health, safety and environmental matters in such jurisdictions in which we manufacture and/or sell our products.
Certain operations of the Company are subject to locally enacted environmental laws and regulations which govern the discharge of pollutants into the air and water, as well as the handling and disposal of solid and hazardous wastes.
While the Company believes that its operations are currently in substantial compliance with applicable environmental laws and regulations, the Company and its operations may be subject to liabilities, regardless of fault, for investigative and/or remediation efforts on such matters that may arise at any of the Company’s former or current properties, either owned or leased.
Such liabilities could result from the use of hazardous materials in production, the disposal of products, damages associated with the use of any of our products or other related matters.
We cannot be certain as to the potential impact of any changes to environmental conditions or environmental policies that may arise at any of our jurisdictions.
Our failure to comply with these local environmental laws and regulations could result in fines or other punitive damages and/or modifications to our production processes, any of which could adversely impact our financial position, results of operations, or cash flows.
Cybersecurity threats continue to expand and evolve globally, making it difficult to detect and prevent such threats from impacting the Company.
access to financing, competition, technological developments, new legislation and regulation of operators.
The substantial majority of these sales are related to both U.S. and foreign military and defense programs.
If the lenders accelerate the repayment of borrowings, the Company may not have sufficient assets to repay the Revolving Credit Facility and other indebtedness.
cash flows.
As of December 31, 2016, the Company had the following unsecured Senior Notes outstanding:
| $ | 375.0 | | 1.55 | % | September 2017 | | |
Non-U.S. markets account for a substantial portion of the Company’s business.
| | · | | tariffs, trade barriers, trade disputes, trade sanctions, trade agreements or any other changes in trade policies or trade agreements; |
| --- | --- | --- | --- |
| | · | | regulations related to customs and import/export matters; |
| | · | | tax issues, such as tax law changes, audits and examinations by taxing authorities, variations in tax laws from country to country as compared to the U.S. and difficulties in repatriating cash generated or held abroad in a tax-efficient manner; |
| | · | | employment regulations and local labor conditions; |
Several anti-bribery laws, such as the U.S. Foreign Corrupt Practices Act and the U.K. Bribery Act, generally prohibit companies from engaging in improper conduct for the purpose of obtaining, retaining or improving business.
jurisdictions, and ultimately result in monetary or non-monetary penalties and/or significant legal and administrative fees.
Item 7. Management’s Discussion and Analysis of Financial Condition and Results of Operations
133 rewritten, 146 added, 101 removed, 228 unchanged
The following discussion and analysis of the results of operations for the three years ended December 31, [removed: 2016, 2015] [added: 2017, 2016] and [removed: 2014] [added: 2015] has been derived from and should be read in conjunction with the Consolidated Financial Statements included in Part II, Item 8, herein.
In [removed: 2016,] [added: 2017,] approximately 72% of the Company’s sales were outside the U.S. The primary end markets for our products are:
There has been a trend on the part of [removed: original equipment manufacturer (“OEM”)] customers to consolidate their lists of qualified suppliers to companies that have the ability to meet certain [added: technical,] quality, delivery and other standards while maintaining competitive prices.
The Company focuses its research and development efforts through close collaboration with its [removed: OEM] customers to develop highly-engineered products that meet customer needs and have the potential for broad market applications and significant sales within a one- to three-year period.
In [removed: 2016,] [added: 2017,] the Company reported net [removed: sales, operating income] [added: sales] and [removed: net] [added: operating] income [removed: attributable to Amphenol Corporation] of [removed: $6,286.4, $1,205.2] [added: $7,011.3] and [removed: $822.9,] [added: $1,427.6,] respectively, up [removed: 13%, 9%] [added: 12%] and [removed: 8%,] [added: 18%,] respectively, from [removed: 2015.][added: 2016.]
[added: Excluding the effects of these items,] Adjusted Operating Income and Adjusted Net Income attributable to [removed: Amphenol,] [added: Amphenol Corporation,] as defined in the “Non-GAAP Financial Measures” section below and as reconciled in Part II, Item 6 and Item 7 herein, [added: both] increased by [removed: 12% and 11%, respectively.][added: 15% in 2017.]
In [removed: 2016,] [added: 2017,] the Company generated operating cash flow of [removed: $1,077.6.][added: $1,144.2.]
| | | 2016 | | | [added: | | | | | | | | | |] 2015 | | | [removed: 2014] | | | [added: | | | | | |]
| Cost of sales | | [removed: 67.5] [added: 67.1] | | | [removed: 68.1] [added: 67.5] | | | [removed: 68.3] [added: 68.1] | | |
| Acquisition-related expenses | | [removed: 0.6] [added: —] | | | [removed: 0.1] [added: 0.6] | | | [removed: 0.2] [added: 0.1] | | |
| Selling, general and administrative expenses | | [removed: 12.7] [added: 12.5] | | | [removed: 12.0] [added: 12.7] | | | [removed: 12.1] [added: 12.0] | | |
| Operating income | | [removed: 19.2] [added: 20.4] | | | [removed: 19.8] [added: 19.2] | | | [removed: 19.4] [added: 19.8] | | |
| Interest expense | | [removed: (1.1)] [added: (1.3)] | | | [removed: (1.2)] [added: (1.1)] | | | [removed: (1.5)] [added: (1.2)] | | |
| Other income, net | | [removed: 0.1] [added: 0.2] | | | [removed: 0.3] [added: 0.1] | | | 0.3 | | |
| Income before income taxes | | [removed: 18.2] [added: 19.3] | | | [removed: 18.9] [added: 18.2] | | | [removed: 18.2] [added: 18.9] | | |
| Provision for income taxes | | [removed: (4.9)] [added: (9.9)] | | | [removed: (5.0)] [added: (4.9)] | | | [removed: (4.8)] [added: (5.0)] | | |
| Net income | | [removed: 13.3] [added: 9.4] | | | [removed: 13.9] [added: 13.3] | | | [removed: 13.4] [added: 13.9] | | |
| Net income attributable to noncontrolling interests | | [removed: (0.2)] [added: (0.1)] | | | (0.2) | | | [removed: (0.1)] [added: (0.2)] | | |
| Net income attributable to Amphenol Corporation | | [removed: 13.1] [added: 9.3] | % | | [removed: 13.7] [added: 13.1] | % | | [removed: 13.3] [added: 13.7] | % | |
Net sales to the industrial market increased (approximately $183.9) reflecting the benefit of acquisitions including FCI as well as sales strength in hybrid bus and truck, factory automation and heavy equipment, which was partially offset by sales declines in [removed: products sold into oil and gas exploration and alternative energy applications.]
Net sales to the mobile networks market increased (approximately $114.9), primarily due to contributions from acquisitions including FCI as well as increased sales to [added: mobile network service providers and original equipment manufacturers.]
Net sales in the Cable Products and Solutions segment (approximately 6% of net sales), which is primarily in the broadband communications market, increased 10% in U.S. dollars, 12% in constant currencies and 9% organically in 2016, compared to 2015, primarily due to the sales increase in the broadband communications market and contributions from an acquisition made during the [removed: third quarter] [added: second half] of 2016.
Geographically, net sales in the U.S. in 2016 increased approximately 3% [added: in U.S. dollars] ($1,740.7 in 2016 versus $1,696.3 in 2015) compared to 2015.
The comparatively stronger U.S. dollar in 2016 had the effect of decreasing net sales by approximately $61.3 [removed: when] compared to [removed: foreign currency translation rates in] 2015.
The increase in gross profit margin as a percentage of [added: net] sales relates primarily to higher gross profit margins in the Interconnect Products and Assemblies segment reflecting the benefit of higher volumes and cost reduction actions as well as the impact of the FCI acquisition, which had higher gross margins than the average of the Company.
[added: Operating income for 2015 includes $5.7] of acquisition-related expenses, which [removed: included] [added: includes] professional and transaction-related fees and other external expenses related to acquisitions closed and announced in 2015.
The [added: following] table [removed: below] reconciles Adjusted Operating [added: Income, Adjusted Operating Margin, Adjusted Net] Income [added: attributable to Amphenol Corporation, Adjusted Effective Tax Rate] and Adjusted [removed: Operating Margin] [added: Diluted EPS (all defined in the “Non-GAAP Financial Measures” section below)] to the most directly comparable U.S. GAAP financial measures for the years ended December 31, 2016 and 2015:
| | | [removed: 2016] [added: 2017] | | | [added: 2016] | | | 2015 | | | [removed: | |]
| | | [removed: income] [added: Income] | | | [removed: margin] [added: Margin (1)] | | [added: Corporation] | [removed: income] | | [added: Rate (1)] | [removed: margin] | [added: EPS] | [added: | | Income | | | Margin (1) | | Corporation | | | Rate (1) | | EPS | |]
| Reported (GAAP) | | $ | 1,205.2 | | 19.2 | % | [added: $] | [added: 822.9 | | 27.0 | % |] $ | [added: 2.61 | | $ |] 1,104.7 | | 19.8 | % | [added: $ | 763.5 | | 26.6 | % | $ | 2.41 |]
| Acquisition-related expenses | | | 36.6 | | 0.6 | [removed: %] | | [added: 33.1] | [added: | (0.5) | | | 0.11 | | |] 5.7 | | 0.1 | [removed: %] | [added: | 5.7 | | (0.1) | | | 0.02 |]
| Adjusted (non-GAAP) | | $ | 1,241.8 | | 19.8 | % | [added: $] | [added: 856.0 | | 26.5 | % |] $ | [added: 2.72 | | $ |] 1,110.4 | | 19.9 | % | [added: $ | 769.2 | | 26.5 | % | $ | 2.43 |]
[removed: The provision] [added: Provision] for income taxes was at an effective rate of 27.0% in 2016 and 26.6% in 2015.
The effective tax rate for 2016 and 2015 included the effect of acquisition-related expenses incurred during each [removed: year, which had the impact of increasing the effective tax rate by 50 basis points and 10 basis points, respectively.][added: year.]
Net sales were [removed: $5,568.7] [added: $7,011.3] for the year ended December 31, [removed: 2015] [added: 2017] compared to [removed: $5,345.5] [added: $6,286.4] for the year ended December 31, [removed: 2014,] [added: 2016,] an increase of [removed: 4%] [added: 12%] in [added: both] U.S. [removed: dollars, 8% in] [added: dollars and] constant currencies and [removed: 3%] [added: 8%] organically (excluding both currency and acquisition impacts) over the prior year.
Net sales in the Interconnect Products and Assemblies segment (approximately 94% of net sales) increased [removed: 5%] [added: 12%] in [added: both] U.S. [removed: dollars, 8% in] [added: dollars and] constant currencies and [removed: 3%] [added: 9%] organically in [removed: 2015,] [added: 2017,] compared to [removed: 2014.][added: 2016.]
The sales growth was driven [added: primarily] by [removed: increases] [added: growth] in the [added: industrial,] automotive, [removed: mobile devices, industrial and] information technology and data [removed: communications equipment] [added: communications, mobile devices, military and commercial aerospace] markets, with contributions from both organic [removed: growth and] [added: strength as well as from] the Company’s [removed: acquisition program;] [added: acquisitions,] partially offset by [removed: decreases] [added: a slight decline] in sales in the mobile [removed: networks, commercial aerospace and military markets.][added: networks market.]
Net sales to the mobile devices market increased (approximately [removed: $116.5)] [added: $101.1)] primarily due to growth in [removed: next generation laptops, mobile device accessories] [added: sales of products incorporated into smartphones] and [removed: production-related products.][added: related accessories, partially offset by declining sales of products incorporated into tablets.]
Net sales to the information technology and data communications market increased (approximately [removed: $17.6), primarily due to the] [added: $115.0), reflecting organic] growth in products for [removed: server, web and] data [removed: center applications, partially offset by declines in storage-related][added: centers, including server and networking-related applications.]
Net sales to the mobile networks market decreased (approximately [removed: $101.7),] [added: $20.3),] primarily due to [removed: a decrease in worldwide] [added: reduced overall capital spending by] mobile [removed: network build-outs.][added: operators.]
The Company also reported net income attributable to Amphenol Corporation of $650.5, down 21% from 2016, primarily as a result of the enactment of the Tax Cuts and Jobs Act which resulted in a provisional income tax charge of $398.5 in 2017 as discussed in more detail below and in the Notes to the Consolidated Financial Statements within this Annual Report on Form 10-K, in addition to the impact of the acquisition-related expenses incurred in the respective periods, partially offset by the excess tax benefits of $66.6 related to stock-based compensation as a result of the adoption of the new stock-based compensation standard.
Tax Cuts and Jobs Act of 2017
On December 22, 2017, the United States federal government enacted the Tax Cuts and Jobs Act (“Tax Act”), marking a change from a worldwide tax system to a modified territorial tax system in the United States.
As part of this change, the Tax Act, among other changes, provides for a transition tax on the accumulated unremitted foreign earnings and profits of the Company’s foreign subsidiaries (“Transition Tax”) and a reduction of the U.S. federal corporate income tax rate from 35% to 21%.
As a result, in the fourth quarter of 2017, the Company recorded an income tax charge of $398.5 (“Tax Act Charge”) that was comprised of (i) the Transition Tax of $259.4, (ii) a charge of $176.6 related to changes in the Company’s permanent reinvestment assertion with regards to prior accumulated unremitted earnings from certain foreign subsidiaries, partially offset by (iii) a tax benefit of $37.5 associated with the remeasurement of the Company’s U.S. net deferred tax liabilities due to the U.S. federal corporate tax rate reduction.
As discussed under Critical Accounting Policies and Estimates within this Item 7, the three components of the Tax Act Charge are provisional amounts recorded in accordance with Staff Accounting Bulletin No. 118 (“SAB 118”).
SAB 118 addresses the application of U.S. GAAP in situations where a registrant does not have the necessary information available, prepared, or analyzed in reasonable detail to complete the accounting for certain income tax effects of the Tax Act.
Due to the timing of the Tax Act’s enactment and the complexity of its provisions, the Company has not completed its accounting for the impact of the Tax Act.
The Company will analyze guidance and technical interpretations of the provisions of the Tax Act, as well as refine, analyze and update the underlying data, computations and assumptions used to prepare the Tax Act Charge.
The Company will complete its accounting in 2018 once the Company has obtained, prepared and fully analyzed all the necessary information.
Refer to Note 4 of the Notes to the Consolidated Financial Statements for further discussion on the Tax Act.
For a discussion of certain risks associated with changes to fiscal and tax policies including the Tax Act, refer to the risk factor titled “Changes in fiscal and tax policies, audits and examinations by taxing authorities could impact the Company’s results” in Part I, Item 1A herein.
2017 Compared to 2016
Net sales to the industrial market increased (approximately $244.4), reflecting sales strength in heavy equipment, industrial instrumentation, oil and gas, and factory automation as well as contributions from acquisitions.
Net sales to the automotive market increased (approximately $177.0), driven by growth and expansion in all regions of the global automotive market, as well as contributions from acquisitions.
Net sales to the military market increased (approximately $77.8), driven by broad strength across substantially all segments of the market including increased sales into military communications and military airframe applications, as well as missile applications.
Net sales to the commercial aerospace market slightly increased (approximately $9.9) primarily due to the contributions from acquisitions as well as strength in large passenger planes, partially offset by continued weakness in demand for business jets and helicopters.
| | | 2017 | | | 2016 | | | (GAAP) | | | (non-GAAP) | | | (non-GAAP) | | | (non-GAAP) | | | (non-GAAP) | | |
| Consolidated | | $ | 7,011.3 | | $ | 6,286.4 | | 12 | % | | — | % | | 12 | % | | 4 | % | | 8 | % | |
Geographically, net sales in the United States in 2017 increased approximately 14% in U.S. dollars ($1,978.4 in 2017 versus $1,740.7 in 2016) and 8% organically, compared to 2016.
Operating income was $1,427.6 or 20.4% of net sales in 2017, compared to $1,205.2 or 19.2% of net sales in 2016.
Operating income for 2017 includes $4.0 of acquisition-related expenses, related to external transaction costs incurred in the second quarter of 2017.
Ltd. (“FCI”), as well as transaction costs associated with other acquisitions.
The increase in operating income margin was driven primarily by the higher gross profit margin as discussed above.
Interest expense was $92.3 in 2017 compared to $72.6 in 2016.
The increase is primarily due to higher average debt levels, which resulted from the Company’s dividend and stock buyback programs, as well as higher average interest rates partially driven by the senior note issuances in April 2017.
Other income, net, increased to $17.1 in 2017 compared to $8.5 in 2016.
The increase is primarily related to higher interest income on higher cash equivalents and short-term investment balances.
The increase in the effective tax rate in 2017 resulted primarily from the Tax Act Charge of $398.5, partially offset by the excess tax benefits of $66.6 related to stock-based compensation as a result of the adoption of the new stock-based compensation standard in 2017 (the adoption of ASU 2016-09 is discussed in Note 1 of the Notes to the Consolidated Financial Statements).
Excluding the effect of these items, the Adjusted Effective Tax Rate, a non-GAAP financial measure defined in the “Non-GAAP Financial Measures” section below, was 26.5% for both 2017 and 2016, as reconciled in the table below to the comparable effective tax rate based on GAAP results.
Net income attributable to Amphenol Corporation and Net income per common share-Diluted (“Diluted EPS”) was $650.5 and $2.06, respectively, for 2017, compared to $822.9 and $2.61, respectively, for 2016.
Excluding the effect of the aforementioned (a) Tax Act Charge, (b) excess tax benefits related to stock-based compensation and (c) the acquisition-related expenses incurred in 2017 and 2016, Adjusted Net Income attributable to Amphenol Corporation and Adjusted Diluted EPS, as defined in the “Non-GAAP Financial Measures” section below within this Item 7, were $986.1 and $3.12, respectively, for 2017, compared to $856.0 and $2.72, respectively, for 2016.
| | | | | | | | | | | | | | | | | | | | | | | | | | | |
| --- | --- | --- | --- | --- | --- | --- | --- | --- | --- | --- | --- | --- | --- | --- | --- | --- | --- | --- | --- | --- | --- | --- | --- | --- | --- | --- |
| | | 2017 | | | | | | | | | | | | | 2016 | | | | | | | | | | | |
| | | | | | | | Net Income | | | | | | | | | | | | | Net Income | | | | | | |
| | | | | | | | attributable | | | Effective | | | | | | | | | | attributable | | | Effective | | | |
| | | Operating | | | Operating | | to Amphenol | | | Tax | | Diluted | | | Operating | | | Operating | | to Amphenol | | | Tax | | Diluted | |
| Reported (GAAP) | | $ | 1,427.6 | | 20.4 | % | $ | 650.5 | | 51.1 | % | $ | 2.06 | | $ | 1,205.2 | | 19.2 | % | $ | 822.9 | | 27.0 | % | $ | 2.61 |
| Acquisition-related expenses | | | 4.0 | | \- | | | 3.7 | | \- | | | 0.01 | | | 36.6 | | 0.6 | | | 33.1 | | (0.5) | | | 0.11 |
mobile network service providers and OEMs.
Operating income for 2015 includes $5.7
| | | | | | | | | | | | | |
| --- | --- | --- | --- | --- | --- | --- | --- | --- | --- | --- | --- | --- |
| | | Operating | | | Operating | | | Operating | | | Operating | |
2015 Compared to 2014
Net sales to the automotive market increased (approximately $190.9), driven both by acquisitions and an expansion of our products across a diversified range of vehicles and onboard electronics.
Net sales to the industrial market increased (approximately $43.0) reflecting the benefit of acquisitions as well as growth in industrial battery and hybrid vehicle applications and in alternative energy applications, offset by significant declines in products sold into oil and gas exploration.
applications.
Net sales to the commercial aerospace market decreased (approximately $21.5), primarily due to decreases in commercial helicopter and business jet demand.
Net sales to the military market decreased slightly (approximately $3.8).
| | | 2015 | | | 2014 | | | (GAAP) | | | (non-GAAP) | | | (non-GAAP) | | | (non-GAAP) | | | (non-GAAP) | | |
| Consolidated | | $ | 5,568.7 | | $ | 5,345.5 | | 4 | % | | (4) | % | | 8 | % | | 5 | % | | 3 | % | |
Geographically, net sales in the U.S. in 2015 increased approximately 1% ($1,696.3 in 2015 versus $1,673.5 in 2014) compared to 2014.
Operating income was $1,104.7 or 19.8% of net sales in 2015, compared to $1,034.6 or 19.4% of net sales in 2014.
Operating income for 2015 includes $5.7 of acquisition-related expenses (separately presented in the Consolidated Statements of Income) related to professional fees and other external expenses for acquisitions that were closed and announced in 2015.
For the years ended December 31, 2015 and 2014, these expenses had an impact on net income of $5.7, or $0.02 per share, and $10.2, or $0.04 per share, respectively.
The increase in Adjusted Operating
This increase in operating income margin is driven primarily by the positive impact of higher gross profit margins as well as a reduction of selling, general and administrative expenses as a percentage of net sales, as described above.
| | | | | | | | | | | | | | |
| --- | --- | --- | --- | --- | --- | --- | --- | --- | --- | --- | --- | --- | --- |
| | | 2015 | | | | | | 2014 | | | | | |
| | | Operating | | | Operating | | | Operating | | | Operating | | |
| Reported (GAAP) | | $ | 1,104.7 | | 19.8 | % | | $ | 1,034.6 | | 19.4 | % | |
| Acquisition-related expenses | | | 5.7 | | 0.1 | % | | | 14.1 | | 0.2 | % | |
| Adjusted (non-GAAP) | | $ | 1,110.4 | | 19.9 | % | | $ | 1,048.7 | | 19.6 | % | |
Interest expense was $68.3 for 2015 compared to $80.4 for 2014.
The decrease is primarily attributable to the benefit of lower average borrowing rates resulting from the commercial paper program that was initiated in late 2014, and a senior note issuance in the third quarter of 2014 which replaced a higher rate note maturity.
This benefit more than offset the impact of higher average debt levels which resulted from the Company’s stock buyback program as well as acquisition activity.
Other income, net, decreased to $16.4 in 2015 compared to $18.3 in 2014, primarily related to lower interest income on cash, cash equivalents and short-term investments.
The effective tax rate for 2015 included the effect of acquisition-related expenses incurred during each year, which had the impact of increasing the effective tax rate by 10 basis points.
Acquisition-related expenses incurred during 2014 did not have an impact on the effective tax rate for that year.
On January 8, 2016, the Company used approximately $1,178.6 of its cash, cash equivalents and short-term investments, net of cash acquired, to fund the FCI acquisition.
The vast majority of the Company’s cash, cash equivalents and short-term investments on hand as of December 31, 2016 was located outside of the U.S. The Company does not currently intend to repatriate any of its cash, cash equivalents and short-term investments, but rather to permanently reinvest such funds outside the U.S. However, any repatriation of funds would result in the need to accrue and pay income taxes.
The increase in cash flow provided by operating activities for 2015 compared to 2014 is primarily due to an increase in net income and an overall decrease in the net components of working capital, compared to the increase in net working capital in 2014.
Accounts receivable increased $244.7 to $1,349.3 primarily due to the impact of the FCI and other 2016 acquisitions as well as an increase in sales volume, partially offset by the effect of translation from exchange rate changes at December 31, 2016 compared to December 31, 2015 (“Translation”).
Inventories increased $77.1 to $928.9, primarily due to the impact of the FCI and other 2016 acquisitions, partially offset by Translation.
Land and depreciable assets, net, increased $101.9 to $711.4, primarily due to the impact of the FCI and other 2016 acquisitions, as well as capital expenditures of $190.8, partially offset by depreciation of $157.8, disposals and Translation.
Accounts payable increased $90.4 to $678.2, primarily as a result of the impact of the FCI and other 2016 acquisitions, partially offset by Translation.
Total accrued expenses increased $161.5 to $581.8, primarily as a result of the impact of the FCI and other 2016 acquisitions.
An excerpt. Shown here: 40 of 133 rewritten, 40 of 146 added and 40 of 101 removed. The counts are complete. For every sentence, read Item 7. Management’s Discussion and Analysis of Financial Condition and Results of Operations in the FY2017 filing and the FY2016 filing.
Item 7A. Quantitative and Qualitative Disclosures About Market Risk
10 rewritten, 3 added, 2 removed, 11 unchanged
Changes in exchange rates can positively or negatively affect the Company’s sales, [removed: gross] [added: operating] margins and equity.
However, there can be no assurance that these actions will be fully effective in managing currency risk, [removed: especially] [added: including] in the event of a significant and sudden decline in the value of any of the international currencies of the Company’s worldwide operations.
As of December 31, [removed: 2016,] [added: 2017,] the Company had [removed: four] [added: six] forward contracts of varying amounts that effectively fixed Euro, Great Britain Pound and Korean Won intercompany debt obligations into fixed Hong Kong dollar denominated obligations expiring at various times through [removed: 2017] [added: 2018] concurrent with the underlying intercompany loans.
The fair value of the contracts at December 31, [removed: 2016] [added: 2017] resulted in a net asset of [removed: $8.4.][added: $2.3.]
A 10% change in foreign currency exchange rates would not have a material effect on the value of the hedges as of December 31, [removed: 2016] [added: 2017] and [removed: 2015.][added: 2016.]
Any borrowings under the Revolving Credit Facility either bear interest at or trade at rates that fluctuate with a spread over [removed: LIBOR and] [added: LIBOR, while] any borrowings under the Commercial Paper Program are subject to floating interest rates.
As of December 31, [removed: 2016, $1,024.4,] [added: 2017, $1,182.0,] or [removed: 34%,] [added: 33%,] of the Company’s outstanding [removed: borrowings] [added: borrowings, which] related mainly to its Commercial Paper Program, were subject to floating interest rates.
At December 31, [added: 2017 and] 2016, the Company’s average floating rate on such borrowings was [removed: 1.06%.][added: 1.71% and 1.06%, respectively.]
A 10% change in this interest rate at December 31, [removed: 2016] [added: 2017] and [removed: 2015] [added: 2016] would not have a material effect on interest expense.
The Company does not expect changes in interest rates to have a material effect on income or cash flows in [removed: 2017,] [added: 2018,] although there can be no assurances that interest rates will not change significantly.
(dollars in millions)
In April 2017, the Company issued $400.0 principal amount of unsecured 2.20% senior notes due April 2020 and $350.0 principal amount of unsecured 3.20% senior notes due April 2024.
The Company used all of the net proceeds to repay the outstanding 1.55% senior notes of $375.0 that was due in September 2017 as well as for general corporate purposes.
In 2014, the Company issued $750.0 principal amount of unsecured 2.55% senior notes due January 2019, $375.0 principal amount of unsecured 1.55% senior notes due September 2017 and $375.0 principal amount of unsecured 3.125% senior notes due September 2021.
The Company used all of the net proceeds to repay the outstanding $600.0 million 4.75% senior notes that were due in November 2014 and to repay amounts outstanding under its Revolving Credit Facility and credit facilities.
Item 1. Business
45 rewritten, 10 added, 6 removed, 239 unchanged
The Company estimates, based on reports of industry analysts, that worldwide sales of interconnect and sensor-related products were approximately [removed: $140] [added: $150] billion in [removed: 2016.][added: 2017.]
The table below provides a summary of our reporting segments, the [removed: 2016] [added: 2017] net sales contribution of each segment, the primary industry and end markets that we service and our key products:
| % of [removed: 2016] [added: 2017] Net Sales: | | 94% | | 6% |
| | · | | Expand global presence - The Company intends to further expand its global manufacturing, engineering, sales and service operations to better serve its existing customer base, penetrate developing markets and establish new customer relationships. As the Company’s global customers expand their international operations to access developing world markets and lower manufacturing costs in certain regions, the Company is continuing to expand its international footprint in order to provide [removed: just-in-time] [added: real-time] capabilities to these customers. The majority of the Company’s international operations have broad capabilities including new product development. The Company is also able to take advantage of the lower manufacturing costs in some regions, and has established low-cost manufacturing and assembly facilities in the Americas, Europe/Africa and Asia. |
| | · | | Pursue strategic acquisitions and investments - The Company believes that the interconnect and sensor industry is highly fragmented and continues to provide significant opportunities for strategic acquisitions. Accordingly, we continue to pursue acquisitions of high-growth potential companies with strong management teams that complement our existing business while further expanding our product lines, technological capabilities and geographic presence. Furthermore, we seek to enhance the performance of acquired companies by leveraging Amphenol’s business strategy and access to low-cost manufacturing around the world. In [added: 2017, the Company invested approximately $266 million to fund five acquisitions comprising seven businesses, and in] 2016, the Company invested approximately $1.3 billion to fund five [removed: acquisitions. The] [added: acquisitions, including the] acquisition [removed: in 2016] of FCI Asia [removed: Pte Ltd] [added: Pte. Ltd.] (“FCI”), the largest acquisition in our history (“FCI acquisition”), for an aggregate purchase price of approximately $1.2 billion, net of cash [removed: acquired, further strengthened our customer base and product offerings] [added: acquired. Our acquisitions] in [removed: the information technology and data communications, industrial, mobile networks, automotive] [added: 2017] and [removed: mobile devices markets. The other] 2016 [removed: acquisitions also] strengthened our customer base and product offerings in [removed: those markets, as well as the broadband market.] [added: many of our end markets.] |
| | · | | Foster collaborative, entrepreneurial management - Amphenol’s management system is designed to provide clear income statement and balance sheet responsibility in a flat organizational structure. Each general manager is incented to grow and develop his or her business and to think entrepreneurially in providing innovative, timely and cost-effective solutions to customer needs. In addition, Amphenol’s general managers have access [added: to the resources of the larger organization and are encouraged to work collaboratively with other general managers to meet the needs of the expanding marketplace and to achieve common goals.] |
Sales into the automotive market represented approximately [removed: 18%] [added: 19%] of the Company’s net sales in [removed: 2016] [added: 2017] with sales into the following primary end applications:
Sales into the broadband communications market represented approximately 6% of the Company’s net sales in [removed: 2016] [added: 2017] with sales into the following primary end applications:
Sales into the commercial aerospace market represented approximately [removed: 5%] [added: 4%] of the Company’s net sales in [removed: 2016] [added: 2017] with sales into the following primary end applications:
Sales into the industrial market represented approximately [removed: 18%] [added: 19%] of the Company’s net sales in [removed: 2016] [added: 2017] with sales into the following primary end applications:
Information Technology and Data Communications - Amphenol is a global provider of interconnect solutions to [removed: designers and] [added: designers,] manufacturers [added: and operators] of internet-enabling systems.
Whether industry standard or application-specific designs are required, Amphenol provides customers with products that enable performance at the leading edge of next-generation, high-speed, power and fiber [removed: optics technology.][added: optic technologies.]
Sales into the IT and datacom market represented approximately [removed: 21%] [added: 20%] of the Company’s net sales in [removed: 2016] [added: 2017] with sales into the following primary end applications:
Military - Amphenol is a world leader in the design, manufacture and supply of high-performance interconnect systems [removed: and antennas] for harsh environment military applications.
Sales into the military market represented approximately [removed: 9%] [added: 10%] of the Company’s net sales in [removed: 2016] [added: 2017] with sales into the following primary end applications:
[added: Amphenol’s capability for] high-volume production of these technically demanding, miniaturized products, combined with our speed of new product introduction, are critical drivers of the Company’s long-term success in this market.
Sales into the mobile devices market represented approximately 14% of the Company’s net sales in [removed: 2016] [added: 2017] with sales into the following primary end applications:
| | · | | wearable [added: and hearable] devices |
The Company’s products are used in virtually every [added: current and next generation] wireless communications [removed: standard, including 3G, 3.5G, 4G, LTE, TD-LTE, 5G and other future IP-based solutions.][added: standards.]
Sales into the mobile networks market represented approximately [removed: 9%] [added: 8%] of the Company’s net sales in [removed: 2016] [added: 2017] with sales into the following primary end applications:
There has been a trend on the part of [removed: original equipment manufacturer (“OEM”)] customers to consolidate their lists of qualified suppliers to companies that have the ability to meet certain [added: technical,] quality, delivery and other standards while maintaining competitive prices.
For a discussion of certain risks related to the Company’s [removed: sales to OEMs,] [added: sales,] refer to the risk factor titled “The Company is dependent on the communications industry, including information technology and data communications, wireless communications and broadband communications” in Part I, Item 1A herein.
The Company’s products are sold to thousands of [removed: OEMs] [added: original equipment manufacturers (“OEMs”)] in approximately 70 countries throughout the world.
No single customer accounted for 10% or more of the Company’s net sales for the years ended December 31, [removed: 2016] [added: 2017] and [removed: 2014.][added: 2016.]
The Company’s sales to distributors represented approximately [removed: 14%] [added: 15%] of the Company’s net sales in [removed: 2016.][added: 2017.]
[added: In addition to product design teams and collaborative initiatives with customers, the Company uses key] account managers to manage customer relationships on a global basis such that it can bring to bear its total resources to meet the worldwide needs of its multinational customers.
The Company is a global manufacturer employing advanced manufacturing processes including molding, stamping, plating, turning, [added: CNC machining,] extruding, die casting and assembly operations and proprietary process technology for specialty and coaxial cable production and sensor fabrication.
To better serve certain high-volume customers, the Company has established [removed: just-in-time] [added: certain] facilities near these major customers.
The [removed: Company’s international] [added: Company seeks to position its] manufacturing and assembly facilities [removed: generally] [added: in order to] serve [removed: the respective] local markets [removed: and coordinate] [added: while coordinating as appropriate] product design and manufacturing responsibility with the Company’s other operations around the world.
For a discussion of certain risks attendant to the Company’s foreign operations, refer to the risk factor titled [removed: “The] [added: “Non-U.S. markets form a substantial portion of the Company’s business and as a result, the] Company is [removed: subject] [added: more exposed] to [removed: the risks of] political, [removed: economic] [added: economic, military, natural disaster] and [removed: military instability] [added: other risks] in countries outside the United States” in Part I, Item 1A herein.
Net sales by geographic area as a percentage of the Company’s total net sales for the years ended December 31, [removed: 2016, 2015] [added: 2017, 2016] and [removed: 2014] [added: 2015] were as follows:
| | | [removed: 2016] [added: 2017] | | [removed: 2015] [added: 2016] | | [removed: 2014] [added: 2015] |
| United States | | 28% | | [removed: 30%] [added: 28%] | | [removed: 31%] [added: 30%] |
| China | | 30% | | 30% | | [removed: 27%] [added: 30%] |
| Other international locations | | 42% | | [removed: 40%] [added: 42%] | | [removed: 42%] [added: 40%] |
The Company generally implements its product development strategy through product design teams and [removed: collaboration arrangements] [added: collaborative initiatives] with customers, which often results in the Company obtaining approved vendor status for its customers’ new products and programs.
[removed: The Company focuses its research and development efforts primarily on those] product areas that it believes have the potential for broad market applications and significant sales within a one- to three-year period.
By developing application specific products, the Company [removed: has decreased] [added: is able to decrease] its exposure to standard products, which [removed: generally] [added: are more likely to] experience greater pricing pressure.
At the end of [removed: 2016,] [added: 2017,] our research, development, and engineering efforts were supported by approximately [removed: 2,400] [added: 2,700] employees and were performed primarily by individual operating units focused on specific markets and [added: product] technologies.
The Company’s research and development expenses for the creation of new and improved products and processes were [removed: $166.1] [added: $193.7] million, [removed: $124.7] [added: $166.1] million and [removed: $114.8] [added: $124.7] million for [removed: 2016, 2015] [added: 2017, 2016] and [removed: 2014,] [added: 2015,] respectively, which are classified as selling, general and administrative expenses in our Consolidated Financial Statements.
| | · | | oil and gas |
| | · | | consumer electronics |
| | · | | distributed antenna systems (DAS) |
| --- | --- | --- | --- |
| | · | | small cells |
| --- | --- | --- | --- |
| --- | --- | --- | --- |
The Company focuses its research and development efforts primarily on those
From time to time, the Company is involved in disputes with third parties regarding the Company’s or such third party’s intellectual property assets, particularly patents.
For a discussion of certain risks attendant to environmental matters, refer to the risk factor titled “The Company may be subject to environmental laws and regulations that could adversely affect its business” in Part I, Item 1A herein.
| to the resources of the larger organization and are encouraged to work collaboratively with other general managers to meet the needs of the expanding marketplace and to achieve common goals. |
| --- |
| | · | | geophysical |
Amphenol’s capability for
In addition to product design teams and customer collaboration arrangements, the Company uses key
(including wireless communications, information technology and data communications and broadband communications) and sales to distributors, generally have short lead times.
An excerpt. Shown here: 40 of 45 rewritten, all 10 added and all 6 removed. The counts are complete. For every sentence, read Item 1. Business in the FY2017 filing and the FY2016 filing.
Item 3. Legal Proceedings
1 rewritten, 0 added, 0 removed, 2 unchanged
Although the potential liability with respect to [added: certain of] such legal actions cannot be reasonably estimated, [added: none of] such matters [removed: are not] [added: is] expected to have a material adverse effect on the Company’s financial condition, results of operations or cash flows.
Cover and table of contents
38 rewritten, 2 added, 1 removed, 73 unchanged
For the Fiscal Year Ended December 31, [removed: 2016][added: 2017]
][added: 1](https://www.sec.gov/Archives/edgar/data/820313/000155837018000871/aph20171231x10k001.jpg)]
Indicate by check mark whether the registrant is a large accelerated filer, an accelerated filer, a non-accelerated filer, [removed: or] a smaller reporting [added: company, or an emerging growth] company.
See the definitions of “large accelerated filer”, “accelerated [removed: filer” and] [added: filer”,] “smaller reporting [added: company,” and “emerging growth] company” in Rule 12b-2 of the Exchange Act (Check one):
| Non-accelerated filer ☐ | | Smaller reporting company ☐ [added: Emerging growth company ☐] |
The aggregate market value of Amphenol Corporation Class A Common Stock, $.001 par value, held by non-affiliates was approximately [removed: $15,415] [added: $17,320] million based on the reported last sale price of such stock on the New York Stock Exchange on June 30, [removed: 2016.][added: 2017.]
As of January 31, [removed: 2017,] [added: 2018,] the total number of shares outstanding of Registrant’s Class A Common Stock was [removed: 307,664,328.][added: 305,483,780.]
| | | [Backlog](#Backlog_272017) | | [removed: 9] [added: 10] |
| | [Item 1B.](#Item1BUnresolvedStaffComments_633240) | [Unresolved Staff Comments](#Item1BUnresolvedStaffComments_633240) | | [removed: 14] [added: 15] |
| | [Item 2.](#Item2Properties_897531) | [Properties](#Item2Properties_897531) | | [removed: 15] [added: 16] |
| | [Item 3.](#Item3LegalProceedings_984388) | [Legal Proceedings](#Item3LegalProceedings_984388) | | [removed: 15] [added: 16] |
| | [Item 4.](#Item4MineSafetyDisclosures_949251) | [Mine Safety Disclosures](#Item4MineSafetyDisclosures_949251) | | [removed: 15] [added: 16] |
| | [Item 5.](#Item5MarketforRegistrantsCommonEquityRel) | [Market for Registrant’s Common Equity, Related Stockholder Matters and Issuer Purchases of Equity Securities](#Item5MarketforRegistrantsCommonEquityRel) | | [removed: 16] [added: 17] |
| | [Item 6.](#Item6SelectedFinancialData_418162) | [Selected Financial Data](#Item6SelectedFinancialData_418162) | | [removed: 18] [added: 20] |
| | [Item 7.](#Item7ManagementsDiscussionandAnalysisofF) | [Management’s Discussion and Analysis of Financial Condition and Results of Operations](#Item7ManagementsDiscussionandAnalysisofF) | | [removed: 19] [added: 21] |
| | [Item 7A.](#Item7AQuantitativeandQualitativeDisclosu) | [Quantitative and Qualitative Disclosures About Market Risk](#Item7AQuantitativeandQualitativeDisclosu) | | [removed: 34] [added: 38] |
| | [Item 8.](#Item8FinancialStatementsandSupplementary) | [Financial Statements and Supplementary Data](#Item8FinancialStatementsandSupplementary) | | [removed: 35] [added: 39] |
| | | [Report of Independent Registered Public Accounting [removed: Firm](#ReportofIndependentRegisteredPublicAccou)] [added: Firm](#REPORTOFINDEPENDENT_150676)] | | [removed: 35] [added: 39] |
| | | [Consolidated Statements of Income](#ConsolidatedStatementsofIncome_247596) | | [removed: 36] [added: 41] |
| | | [Consolidated Statements of Comprehensive Income](#ConsolidatedStatementsofComprehensiveInc) | | [removed: 37] [added: 42] |
| | | [Consolidated Balance Sheets](#ConsolidatedBalanceSheets_591973) | | [removed: 38] [added: 43] |
| | | [Consolidated Statements of Changes in Equity](#ConsolidatedStatementsofChangesinEquity_) | | [removed: 39] [added: 44] |
| | | [Consolidated Statements of Cash Flow](#ConsolidatedStatementsofCashFlow_3394) | | [removed: 40] [added: 45] |
| | | [Notes to Consolidated Financial Statements](#NotestoConsolidatedFinancialStatements_6) | | [removed: 41] [added: 46] |
| | [Item 9.](#Item9ChangesinandDisagreementswithAccoun) | [Changes in and Disagreements with Accountants on Accounting and Financial Disclosure](#Item9ChangesinandDisagreementswithAccoun) | | [removed: 67] [added: 74] |
| | [Item 9A.](#Item9AControlsandProcedures_802439) | [Controls and Procedures](#Item9AControlsandProcedures_802439) | | [removed: 67] [added: 74] |
| | [Item 9B.](#Item9BOtherInformation_858302) | [Other Information](#Item9BOtherInformation_858302) | | [removed: 67] [added: 74] |
| | [Item 10.](#Item10DirectorsExecutiveOfficersandCorpo) | [Directors, Executive Officers and Corporate Governance](#Item10DirectorsExecutiveOfficersandCorpo) | | [removed: 68] [added: 75] |
| | [Item 11.](#Item11ExecutiveCompensation_611183) | [Executive Compensation](#Item11ExecutiveCompensation_611183) | | [removed: 68] [added: 75] |
| | [Item 12.](#Item12SecurityOwnershipofCertainBenefici) | [Security Ownership of Certain Beneficial Owners and Management and Related Stockholder Matters](#Item12SecurityOwnershipofCertainBenefici) | | [removed: 68] [added: 75] |
| | [Item 13.](#Item13CertainRelationshipsandRelatedTran) | [Certain Relationships and Related Transactions, and Director Independence](#Item13CertainRelationshipsandRelatedTran) | | [removed: 68] [added: 75] |
| | [Item 14.](#Item14PrincipalAccountingFeesandServices) | [Principal Accounting Fees and Services](#Item14PrincipalAccountingFeesandServices) | | [removed: 68] [added: 75] |
| | [Item 15.](#Item15ExhibitsFinancialStatementSchedule) | [Exhibits, Financial Statement Schedules](#Item15ExhibitsFinancialStatementSchedule) | | [removed: 69] [added: 76] |
| | [Item 16.](#Item16Form10KSummary) | [Form 10-K Summary](#Item16Form10KSummary) | | [removed: 69] [added: 78] |
| [removed: | |] [Signature of the Registrant](#Signatures_746471) | | [removed: 71] | [added: | 80 |]
| [removed: | |] [Signatures of the Directors](#Signatures_746471) | | [removed: 71] | [added: | 80 |]
This Annual Report on Form 10-K contains certain statements made by the Company (as defined below) that are intended to be “forward-looking statements” within the meaning of Section 27A of the Securities Act of 1933, as [removed: amended] [added: amended,] and Section 21E of the Securities Exchange Act of 1934, as amended.
Significant risk factors or uncertainties that might cause or contribute to a material difference and may affect our operating and financial performance are described below under the caption “Risk Factors” in Part I, Item 1A and elsewhere in this Annual Report on Form 10-K for the year ended December 31, [removed: 2016,] [added: 2017,] and other Company filings with the Securities and Exchange Commission including Quarterly Reports on Form 10-Q and Current Reports on Form 8-K.
10-K 1 aph-20171231x10k.htm 10-K
If an emerging growth company, indicate by check mark if the registrant has elected not to use the extended transition period for complying with any new or revised financial accounting standards provided pursuant to Section 13(a) of the Exchange Act.
10-K 1 aph-20161231x10k.htm 10-K
Item 2. Properties
1 rewritten, 0 added, 0 removed, 6 unchanged
At December 31, [removed: 2016,] [added: 2017,] the Company operated a total of approximately [removed: 390] [added: 420] plants, warehouses and offices of which (a) the locations in the U.S. had approximately [removed: 3.5] [added: 4.0] million square feet, of which approximately [removed: 1.7] [added: 1.9] million square feet were leased; (b) the locations outside the U.S. had approximately [removed: 15.0] [added: 16.0] million square feet, of which approximately [removed: 10.0] [added: 10.6] million square feet were leased; and (c) the square footage by segment was approximately [removed: 17.6] [added: 19.0] million square feet and approximately [removed: 0.9] [added: 1.0] million square feet for the Interconnect Products and Assemblies segment and the Cable Products and Solutions segment, respectively.
Item 5. Market for Registrant’s Common Equity, Related Stockholder Matters and Issuer Purchases of Equity Securities
20 rewritten, 30 added, 21 removed, 21 unchanged
The following table sets forth the high and low closing sales prices for the Common Stock as reported on the New York Stock [removed: Exchange] [added: Exchange, as well as the dividends declared per common share,] for each quarter of [removed: 2016] [added: 2017] and [removed: 2015:][added: 2016:]
| | | High | | | Low | | | [added: per share | | |] High | | | Low | | | [added: per share | |]
| First Quarter | | $ | [removed: 57.82] [added: 71.89] | | $ | [removed: 45.42] [added: 66.60] | | $ | [removed: 60.20] [added: 0.16] | | $ | [removed: 51.93] [added: 57.82] | | [added: $ | 45.42 | | $ | 0.14 |]
| Second Quarter | | | [removed: 60.11] [added: 76.18] | | | [removed: 55.08] [added: 68.65] | | | [removed: 59.54] [added: 0.16] | | | [removed: 55.37] [added: 60.11] | | [added: | 55.08 | | | 0.14 |]
| Third Quarter | | | [removed: 65.68] [added: 84.64] | | | [removed: 55.97] [added: 72.48] | | | [removed: 57.45] [added: 0.19] | | | [removed: 49.06] [added: 65.68] | | [added: | 55.97 | | | 0.14 |]
| Fourth Quarter | | | [removed: 68.83] [added: 91.04] | | | [removed: 63.05] [added: 84.77] | | | [removed: 55.49] [added: 0.19] | | | [removed: 50.03] [added: 68.83] | | [added: | 63.05 | | | 0.16 |]
The following graph compares the cumulative total [added: shareholder] return of Amphenol over a period of five years ending December 31, [removed: 2016] [added: 2017] with the performance of the Standard & Poor’s 500 (“S&P 500”) Stock Index and the Dow Jones U.S. Electrical Components & Equipment Index.
This graph assumes that $100 was invested in the Common Stock of Amphenol and each index on December 31, [removed: 2011,] [added: 2012,] reflects reinvested dividends and is weighted on a market capitalization basis at the time of each reported data point.
[removed: ][added: 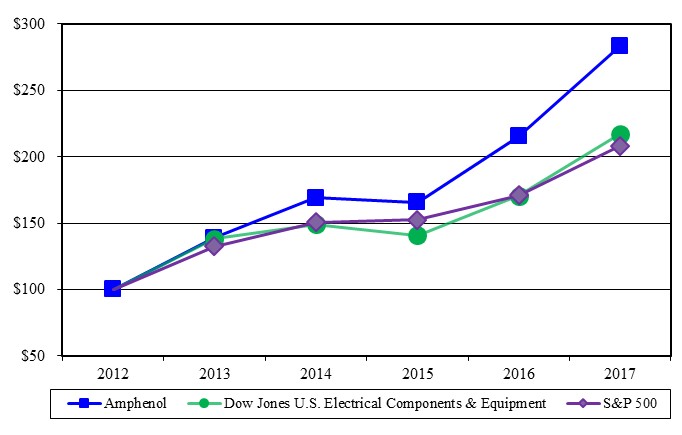]
As of January 31, [removed: 2017,] [added: 2018,] there were [removed: 37] [added: 33] holders of record of the Company’s Common Stock.
[removed: in the fourth quarter of 2016.][added: | Fourth Quarter - 2017: | | | | | | | | | | | |]
The following table summarizes the Company’s equity compensation plan information as of December 31, [removed: 2016:][added: 2017:]
During the year ended December 31, [removed: 2016,] [added: 2017,] the Company repurchased [removed: 5.5] [added: 8.4] million shares of its [removed: common stock] [added: Common Stock] for [removed: approximately $325.8] [added: $618.0] million.
The table below reflects the Company’s stock repurchases for the year ended December 31, [removed: 2016:][added: 2017:]
| | | | | | | | Total Number of | | Maximum [removed: Number] [added: Dollar] | | [added: |]
| | | [added: Total] Number [removed: of] | | [added: Average] | | | Part of Publicly | | [added: that May] Yet [removed: Be Purchased] [added: be] | | [added: |]
| | | [added: of] Shares | | [removed: Average] Price [added: Paid] | | | Announced Plans or | | [added: Purchased] Under the [removed: Plans or] | | [added: |]
| Period | | Purchased | | [removed: Paid] per Share | | | Programs | | [added: Plans or] Programs | | [added: |]
[removed: As of February 10, 2017,] [added: From January 1, 2018 through January 31, 2018,] the Company repurchased approximately [removed: 3.2] [added: 1.1] million [added: additional] shares of [removed: its common stock] [added: Common Stock] for [removed: $213.9] [added: $105.5 million, leaving approximately $276.5] million [added: available to purchase] under the 2017 Stock Repurchase Program.
The price and timing of any future purchases under the 2017 Stock Repurchase Program will depend on factors such as levels of cash generation from operations, the volume of stock option exercises by employees, cash requirements for acquisitions, dividends, economic and market [removed: conditions and stock price.]
Market Information and Dividends
| | | | | | | | | | | | | | | | | | | |
| --- | --- | --- | --- | --- | --- | --- | --- | --- | --- | --- | --- | --- | --- | --- | --- | --- | --- | --- |
| | | 2017 | | | | | | | | | 2016 | | | | | | | |
| | | Closing Prices | | | | | | Dividends | | | Closing Prices | | | | | | Dividends | |
| | | | | | | | | $ | 0.70 | | | | | | | | $ | 0.58 |
Dividends declared and paid for the years ended December 31, 2017 and 2016 (in millions):
| | | | | | | | | | |
| --- | --- | --- | --- | --- | --- | --- | --- | --- | --- |
| | | | | | 2017 | | | 2016 | |
| Dividends declared | | | | | $ | 213.7 | | $ | 178.8 |
| Dividends paid (including those declared in the prior year) | | | | | | 205.0 | | | 172.7 |
Stock Performance Graph
Each reported data point below represents the last trading day of each calendar year.
| Equity compensation plans approved by security holders | | 33,235,269 | | $ | 52.28 | | 35,473,014 | |
| Total | | 33,235,269 | | $ | 52.28 | | 35,473,014 | |
conditions and stock price.
| | | | | | | | | | | | |
| --- | --- | --- | --- | --- | --- | --- | --- | --- | --- | --- | --- |
| (dollars in millions, except price per share) | | | | | | | Shares Purchased as | | Value of Shares | | |
| First Quarter - 2017 | | 3,678,365 | | $ | 67.74 | | 3,678,365 | | $ | 750.8 | |
| Second Quarter - 2017 | | 2,000,000 | | | 75.36 | | 2,000,000 | | | 600.1 | |
| Third Quarter - 2017 | | 2,000,000 | | | 77.86 | | 2,000,000 | | | 444.4 | |
| | | | | | | | | | | | |
| October 1 to October 31, 2017 | | — | | | — | | — | | | 444.4 | |
| November 1 to November 30, 2017 | | 446,879 | | | 88.53 | | 446,879 | | | 404.8 | |
| December 1 to December 31, 2017 | | 253,121 | | | 90.13 | | 253,121 | | | 382.0 | |
| | | 700,000 | | | 89.11 | | 700,000 | | | 382.0 | |
| | | | | | | | | | | | |
| Total - 2017 | | 8,378,365 | | $ | 73.76 | | 8,378,365 | | $ | 382.0 | |
| | | | | | | | | | | | | | |
| --- | --- | --- | --- | --- | --- | --- | --- | --- | --- | --- | --- | --- | --- |
| | | 2016 | | | | | | 2015 | | | | | |
In the third quarter of 2015, the Board of Directors approved an increase in the quarterly dividend rate from $0.125 to $0.14 per share effective with dividends declared in the third quarter of 2015, and in October 2016, approved a further increase in the quarterly dividend rate from $0.14 to $0.16 per share effective with dividends declared
Total dividends declared during 2016, 2015 and 2014 were $178.8 million, $163.7 million and $140.6 million, respectively.
Total dividends paid in 2016, 2015 and 2014 were $172.7 million, $159.3 million and $101.9 million, respectively, including those declared in the prior year and paid in the current year.
The Company intends to retain the remainder of its earnings not used for dividend payments to provide funds for the operation and expansion of the Company’s business (including acquisition-related activity), to repurchase shares of its Common Stock and to repay outstanding indebtedness.
| Equity compensation plans approved by security holders | | 32,283,296 | | $ | 44.15 | | 12,355,179 | |
| Total | | 32,283,296 | | $ | 44.15 | | 12,355,179 | |
| | | | | | | | | | | |
| --- | --- | --- | --- | --- | --- | --- | --- | --- | --- | --- |
| | | Total | | | | | Shares Purchased as | | of Shares that May | |
| First Quarter - 2016 | | 1,000,000 | | $ | 49.20 | | 1,000,000 | | 4,465,400 | |
| Second Quarter - 2016 | | 1,000,000 | | | 59.18 | | 1,000,000 | | 3,465,400 | |
| Third Quarter - 2016 | | 2,000,000 | | | 60.59 | | 2,000,000 | | 1,465,400 | |
| Fourth Quarter - 2016: | | | | | | | | | | |
| October 1 to October 31, 2016 | | 248,500 | | | 65.52 | | 248,500 | | 1,216,900 | |
| November 1 to November 30, 2016 | | 1,216,900 | | | 65.73 | | 1,216,900 | | — | |
| December 1 to December 31, 2016 | | — | | | — | | — | | — | |
| | | 1,465,400 | | | 65.69 | | 1,465,400 | | — | |
| Total - 2016 | | 5,465,400 | | $ | 59.62 | | 5,465,400 | | — | |
Item 6. Selected Financial Data
15 rewritten, 1 added, 1 removed, 15 unchanged
| in millions, except per share data) | | [added: 2017 | | |] 2016 | | | 2015 | | | 2014 | | | 2013 | | | [removed: 2012] | [removed: | | |]
| Net sales | | $ | [removed: 6,286.4] [added: 7,011.3] | | $ | [removed: 5,568.7] [added: 6,286.4] | | $ | [removed: 5,345.5] [added: 5,568.7] | | $ | [removed: 4,614.7] [added: 5,345.5] | | $ | [removed: 4,292.1] [added: 4,614.7] | | |
| Net income attributable to Amphenol Corporation | | | [removed: 822.9] [added: 650.5] | (1) | | [removed: 763.5] [added: 822.9] | (2) | | [removed: 709.1] [added: 763.5] | (3) | | [removed: 635.7] [added: 709.1] | (4) | | [removed: 555.3] [added: 635.7] | (5) | |
| Net income per common share—Diluted | | | [removed: 2.61] [added: 2.06] | (1) | | [removed: 2.41] [added: 2.61] | (2) | | [removed: 2.21] [added: 2.41] | (3) | | [removed: 1.96] [added: 2.21] | (4) | | [removed: 1.69] [added: 1.96] | (5) | |
| Cash, cash equivalents and short-term investments | | $ | [removed: 1,173.2] [added: 1,753.7] | | $ | [removed: 1,760.4] [added: 1,173.2] | | $ | [removed: 1,329.6] [added: 1,760.4] | | $ | [removed: 1,192.2] [added: 1,329.6] | | $ | [removed: 942.5] [added: 1,192.2] | | |
| Working capital | | | [added: 3,076.6 | | |] 1,956.0 | | | 2,841.6 | | | 2,406.6 | | | 1,510.6 | | | [removed: 1,782.0 | | |]
| Total assets | | | [added: 10,003.9 | | |] 8,498.7 | | | 7,458.4 | | | 6,985.9 | | | 6,150.1 | | | [removed: 5,203.1 | | |]
| Long-term debt, including current portion | | | [added: 3,542.6 | | |] 3,010.7 | | | 2,813.5 | | | 2,656.2 | | | 2,122.2 | | | [removed: 1,695.6 | | |]
| Shareholders’ equity attributable to Amphenol Corporation | | | [added: 3,989.8 | | |] 3,674.9 | | | 3,238.5 | | | 2,907.4 | | | 2,859.5 | | | [removed: 2,430.0 | | |]
| Weighted average shares outstanding—Diluted | | | [added: 316.5 | | |] 315.2 | | | 316.5 | | | 320.4 | | | 324.5 | | | [removed: 327.9 | | |]
| Cash dividends declared per share | | $ | [removed: 0.58] [added: 0.70] | | $ | [removed: 0.53] [added: 0.58] | | $ | [removed: 0.45] [added: 0.53] | | $ | [removed: 0.305] [added: 0.45] | | $ | [removed: 0.21] [added: 0.305] | | |
| | [removed: (1)] [added: (2)] | | Includes acquisition-related expenses of $36.6 ($33.1 after-tax) primarily relating to the FCI and other 2016 acquisitions, including external transaction costs, amortization related to the value associated with acquired backlog and restructuring charges. These items had the aggregate effect of decreasing Net income attributable to Amphenol Corporation and Net income per common share-Diluted by $33.1 and $0.11 per share, respectively. Excluding the effect of these items, Adjusted Net Income attributable to Amphenol Corporation and Adjusted Diluted [removed: EPS, both non-GAAP financial measures defined in Part II, Item 7 herein,] [added: EPS] were $856.0 and $2.72 per share, respectively, for the year ended December 31, 2016. |
| | [removed: (2)] [added: (3)] | | Includes acquisition-related expenses of $5.7 ($5.7 after-tax) relating to acquisitions closed and announced in 2015. These acquisition-related expenses had the effect of decreasing Net income attributable to Amphenol Corporation and Net income per common share-Diluted by $5.7 and $0.02 per share, respectively. Excluding the effect of this item, Adjusted Net Income attributable to Amphenol Corporation and Adjusted Diluted EPS were $769.2 and $2.43 per share, respectively, for the year ended December 31, 2015. |
| | [removed: (3)] [added: (4)] | | Includes acquisition-related expenses of (a) $4.3 ($4.1 after-tax) relating to 2014 acquisitions and (b) $9.8 ($6.2 after-tax) relating to amortization of the acquired backlogs of completed acquisitions. These items had the aggregate effect of decreasing Net income attributable to Amphenol Corporation and Net income per common share-Diluted by $10.3 and $0.04 per share, respectively. Excluding the effect of these items, Adjusted Net Income attributable to Amphenol Corporation and Adjusted Diluted EPS were $719.4 and $2.25 per share, respectively, for the year ended December 31, 2014. |
| | [removed: (4)] [added: (5)] | | Includes (a) acquisition-related expenses of $6.0 ($4.6 after-tax) relating to 2013 acquisitions, (b) an income tax benefit of $3.6 due primarily to the favorable completion of prior year audits, and (c) an income tax benefit of $11.3 resulting from the delay, by the U.S. government, in the reinstatement of certain federal income tax provisions for the year 2012 relating primarily to research and development credits and certain U.S. taxes on foreign income. Such tax provisions were reinstated on January 2, 2013 with retroactive effect to 2012. Under U.S. GAAP, the benefit to the Company of $11.3, relating to the 2012 tax year was recorded as a benefit in the first quarter of 2013 at the date of reinstatement. These items had the [removed: net] [added: aggregate] effect of increasing Net income attributable to Amphenol Corporation and Net income per common share-Diluted by $10.3 and $0.03 per share, respectively. Excluding the effect of these items, Adjusted Net Income attributable to Amphenol Corporation and Adjusted Diluted EPS were $625.4 and $1.93 per share, respectively, for the year ended December 31, 2013. |
| | (1) | | Includes (a) an income tax charge of $398.5 related to the enactment of the Tax Cuts and Jobs Act, which represents our current estimate of taxes arising from the implementation of a modified territorial tax regime and the deemed and intended repatriation of prior unremitted earnings of foreign subsidiaries, partially offset by the tax benefit associated with the remeasurement of the Company’s U.S. net deferred tax liabilities due to the U.S. federal corporate tax rate reduction and (b) acquisition-related expenses of $4.0 ($3.7 after-tax) primarily relating to external transaction costs associated with 2017 acquisitions, partially offset by (c) excess tax benefits related to stock-based compensation of $66.6 resulting from the adoption of ASU 2016-09. These items had the aggregate effect of decreasing Net income attributable to Amphenol Corporation and Net income per common share-Diluted by $335.6 and $1.06 per share, respectively. Excluding the effect of these items, Adjusted Net Income attributable to Amphenol Corporation and Adjusted Diluted EPS, both non-GAAP financial measures defined in Part II, Item 7 herein, were $986.1 and $3.12 per share, respectively, for the year ended December 31, 2017. |
| | (5) | | Includes (a) acquisition-related expenses of $2.0 ($2.0 after-tax) relating to 2012 acquisitions and (b) income tax costs of $11.3 relating to a delay, by the U.S. government, in the reinstatement of certain federal income tax provisions for the year 2012 relating primarily to research and development credits and certain U.S. taxes on foreign income. Such tax provisions were reinstated on January 2, 2013 with retroactive effect to 2012. These items had the aggregate effect of decreasing Net income attributable to Amphenol Corporation and Net income per common share-Diluted by $13.3 and $0.04 per share, respectively. Excluding the effect of these items, Adjusted Net Income attributable to Amphenol Corporation and Adjusted Diluted EPS were $568.6 and $1.73 per share, respectively, for the year ended December 31, 2012. |
Item 8. Financial Statements and Supplementary Data
429 rewritten, 242 added, 155 removed, 555 unchanged
We have audited the accompanying consolidated balance sheets of Amphenol Corporation and subsidiaries (the [removed: “Company”)] [added: "Company")] as of December 31, [removed: 2016 and 2015,] [added: 2017] and [added: 2016,] the related consolidated statements of income, comprehensive income, changes in equity, and cash [removed: flow] [added: flows] for each of the three years in the period ended December 31, [removed: 2016.][added: 2017, and the related notes and the financial statement schedule listed in the Index at Item 15 (collectively referred to as the “financial statements”).]
We also have audited the Company’s internal control over financial reporting as of December 31, [removed: 2016,] [added: 2017,] based on criteria established in Internal Control — Integrated Framework (2013) issued by the Committee of Sponsoring Organizations of the Treadway [removed: Commission.][added: Commission (COSO).]
We conducted our audits in accordance with the standards of the [removed: Public Company Accounting Oversight Board (United States).][added: PCAOB.]
Those standards require that we plan and perform the [removed: audit] [added: audits] to obtain reasonable assurance about whether the financial statements are free of material [removed: misstatement] [added: misstatement, whether due to error or fraud,] and whether effective internal control over financial reporting was maintained in all material respects.
Our audits [removed: of the financial statements] [added: also] included [removed: examining, on a test basis, evidence supporting the amounts and disclosures in the financial statements, assessing] [added: evaluating] the accounting principles used and significant estimates made by management, [removed: and] [added: as well as] evaluating the overall [added: presentation of the] financial [removed: statement presentation.][added: statements.]
A company’s internal control over financial reporting is a process designed [removed: by, or under the supervision of, the company’s principal executive and principal financial officers, or persons performing similar functions, and effected by the company’s board of directors, management, and other personnel] to provide reasonable assurance regarding the reliability of financial reporting and the preparation of financial statements for external purposes in accordance with generally accepted accounting principles.
A company’s internal control over financial reporting includes those policies and procedures that (1) pertain to the maintenance of records that, in reasonable detail, accurately and fairly reflect the transactions and dispositions of the assets of the company; (2) provide reasonable assurance that transactions are recorded as necessary to permit preparation of financial statements in accordance with generally accepted accounting [removed: principles] [added: principles,] and that receipts and expenditures of the company are being made only in accordance with authorizations of management and directors of the company; and (3) provide reasonable assurance regarding prevention or timely [removed: detection of unauthorized acquisition, use, or disposition of the company’s assets that could have a material effect on the financial statements.]
Also, projections of any evaluation of [removed: the] effectiveness [removed: of the internal control over financial reporting] to future periods are subject to the risk that [removed: the] controls may become inadequate because of changes in conditions, or that the degree of compliance with the policies or procedures may deteriorate.
In our opinion, the [removed: consolidated] financial statements referred to above present fairly, in all material respects, the financial position of [removed: Amphenol Corporation and subsidiaries] [added: the Company] as of December 31, [removed: 2016] [added: 2017] and [removed: 2015,] [added: 2016,] and the results of [removed: their] [added: its] operations and [removed: their] [added: its] cash flows for each of the three years in the period ended December 31, [removed: 2016,] [added: 2017,] in conformity with accounting principles generally accepted in the United States of America.
Also, in our opinion, the Company maintained, in all material respects, effective internal control over financial reporting as of December 31, [removed: 2016,] [added: 2017,] based on [removed: the] criteria established in Internal Control — Integrated Framework (2013) issued by [removed: the Committee of Sponsoring Organizations of the Treadway Commission.][added: COSO.]
| | | Year Ended December 31, | | | | | | | | [removed: |]
| | | [removed: 2016] [added: 2017] | | | [removed: 2015] [added: 2016] | | | [removed: 2014] [added: 2015] | | |
| Net sales | | $ | [removed: 6,286.4] [added: 7,011.3] | | $ | [removed: 5,568.7] [added: 6,286.4] | | $ | [removed: 5,345.5] [added: 5,568.7] | |
| Cost of sales | | | [removed: 4,246.4] [added: 4,701.4] | | | [removed: 3,789.2] [added: 4,246.4] | | | [removed: 3,651.7] [added: 3,789.2] | |
| Gross profit | | | [removed: 2,040.0] [added: 2,309.9] | | | [removed: 1,779.5] [added: 2,040.0] | | | [removed: 1,693.8] [added: 1,779.5] | |
| Acquisition-related expenses | | | [removed: 36.6] [added: 4.0] | | | [removed: 5.7] [added: 36.6] | | | [removed: 14.1] [added: 5.7] | |
| Selling, general and administrative expenses | | | [removed: 798.2] [added: 878.3] | | | [removed: 669.1] [added: 798.2] | | | [removed: 645.1] [added: 669.1] | |
| Operating income | | | [removed: 1,205.2] [added: 1,427.6] | | | [removed: 1,104.7] [added: 1,205.2] | | | [removed: 1,034.6] [added: 1,104.7] | |
| Interest expense | | | [removed: (72.6)] [added: (92.3)] | | | [removed: (68.3)] [added: (72.6)] | | | [removed: (80.4)] [added: (68.3)] | |
| Other income, net | | | [removed: 8.5] [added: 17.1] | | | [removed: 16.4] [added: 8.5] | | | [removed: 18.3] [added: 16.4] | |
| Income before income taxes | | | [removed: 1,141.1] [added: 1,352.4] | | | [removed: 1,052.8] [added: 1,141.1] | | | [removed: 972.5] [added: 1,052.8] | |
| Provision for income taxes | | | [removed: (308.5)] [added: (691.7)] | | | [removed: (280.5)] [added: (308.5)] | | | [removed: (257.3)] [added: (280.5)] | |
| Net income | | | [removed: 832.6] [added: 660.7] | | | [removed: 772.3] [added: 832.6] | | | [removed: 715.2] [added: 772.3] | |
| Less: Net income attributable to noncontrolling interests | | | [removed: (9.7)] [added: (10.2)] | | | [removed: (8.8)] [added: (9.7)] | | | [removed: (6.1)] [added: (8.8)] | |
| Net income attributable to Amphenol Corporation | | $ | [removed: 822.9] [added: 650.5] | | $ | [removed: 763.5] [added: 822.9] | | $ | [removed: 709.1] [added: 763.5] | |
| Net income per common share — Basic | | $ | [removed: 2.67] [added: 2.13] | | $ | [removed: 2.47] [added: 2.67] | | $ | [removed: 2.26] [added: 2.47] | |
| Weighted average common shares outstanding — Basic | | | [removed: 308.3] [added: 305.7] | | | [removed: 309.1] [added: 308.3] | | | [removed: 313.1] [added: 309.1] | |
| Net income per common share — Diluted | | $ | [removed: 2.61] [added: 2.06] | | $ | [removed: 2.41] [added: 2.61] | | $ | [removed: 2.21] [added: 2.41] | |
| Weighted average common shares outstanding — Diluted | | | [removed: 315.2] [added: 316.5] | | | [removed: 316.5] [added: 315.2] | | | [removed: 320.4] [added: 316.5] | |
| Dividends declared per common share | | $ | [removed: 0.58] [added: 0.70] | | $ | [removed: 0.53] [added: 0.58] | | $ | [removed: 0.45] [added: 0.53] | |
| Net income | | $ | [removed: 832.6] [added: 660.7] | | $ | [removed: 772.3] [added: 832.6] | | $ | [removed: 715.2] [added: 772.3] | |
| Foreign currency translation adjustments | | | [removed: (110.7)] [added: 243.3] | | | [removed: (152.7)] [added: (110.7)] | | | [removed: (80.9)] [added: (152.7)] | |
| Unrealized gain (loss) on cash flow hedges | | | [removed: 1.6] [added: (0.1)] | | | [removed: (0.4)] [added: 1.6] | | | [removed: (1.2)] [added: (0.4)] | |
| Defined benefit plan adjustment | | | [removed: (12.5)] [added: 27.8] | | | [removed: 8.2] [added: (12.5)] | | | [removed: (69.2)] [added: 8.2] | |
| Total other comprehensive income (loss), net of tax | | | [removed: (121.6)] [added: 271.0] | | | [removed: (144.9)] [added: (121.6)] | | | [removed: (151.3)] [added: (144.9)] | |
| Total comprehensive income | | | [removed: 711.0] [added: 931.7] | | | [removed: 627.4] [added: 711.0] | | | [removed: 563.9] [added: 627.4] | |
| Less: Comprehensive income attributable to noncontrolling interests | | | [removed: (7.6)] [added: (13.2)] | | | (7.6) | | | [removed: (5.6)] [added: (7.6)] | |
| Comprehensive income attributable to Amphenol Corporation | | $ | [removed: 703.4] [added: 918.5] | | $ | [removed: 619.8] [added: 703.4] | | $ | [removed: 558.3] [added: 619.8] | |
| | | [added: 2017 | | |] 2016 | | | 2015 | | |
| Cash and cash equivalents | | $ | [removed: 1,034.6] [added: 1,719.1] | | $ | [removed: 1,737.2] [added: 1,034.6] | |
Opinions on the Financial Statements and Internal Control over Financial Reporting
Basis for Opinions
We are a public accounting firm registered with the Public Company Accounting Oversight Board (United States) (PCAOB) and are required to be independent with respect to the Company in accordance with the U.S. federal securities laws and the applicable rules and regulations of the Securities and Exchange Commission and the PCAOB.
Our audits of the financial statements included performing procedures to assess the risks of material misstatement of the financial statements, whether due to error or fraud, and performing procedures to respond to those risks.
Such procedures included examining, on a test basis, evidence regarding the amounts and disclosures in the financial statements.
Definition and Limitations of Internal Control over Financial Reporting
detection of unauthorized acquisition, use, or disposition of the company’s assets that could have a material effect on the financial statements.
Because of its inherent limitations, internal control over financial reporting may not prevent or detect misstatements.
February 21, 2018
We have served as the Company's auditor since 1997.
| | | 2017 | | | 2016 | | |
| | | | 1,106.9 | | | 928.9 | |
| Property, plant and equipment: | | | | | | | |
| | | | 2,016.9 | | | 1,718.6 | |
| | | | 816.8 | | | 711.4 | |
| | | $ | 10,003.9 | | $ | 8,498.7 | |
| Deferred income taxes | | | 241.2 | | | 77.7 | |
| | | $ | 10,003.9 | | $ | 8,498.7 | |
| Net income | | | | | | | | | | | 650.5 | | | | | | | | | 10.2 | | | 660.7 | |
| Other comprehensive income | | | | | | | | | | | | | | 268.0 | | | | | | 3.0 | | | 271.0 | |
| Purchase of noncontrolling interest | | | | | | | | (5.5) | | | | | | | | | | | | (10.3) | | | (15.8) | |
| Stock options exercised | | 6 | | | | | | 183.9 | | | | | | | | | | | | | | | 183.9 | |
| Balance December 31, 2017 | | 306 | | $ | 0.3 | | $ | 1,249.0 | | $ | 2,941.5 | | $ | (201.0) | | $ | — | | $ | 53.6 | | $ | 4,043.4 | |
| Net income | | $ | 660.7 | | $ | 832.6 | | $ | 772.3 | |
| Deferred income tax provision (benefit) | | | 186.3 | | | (29.9) | | | 12.9 | |
| Capital expenditures | | | (226.6) | | | (190.8) | | | (172.1) | |
Change in Presentation
Certain reclassifications of prior period amounts have been made to conform to the current period presentation, which had no impact on our consolidated results of operations, financial position or cash flows.
In the third quarter of 2017, the Company performed its annual assessment of these identifiable indefinite-lived intangible assets.
Based on our qualitative assessment, the Company determined that it was more likely than not that the fair value of the indefinite-lived intangible assets exceeded their respective carrying amounts.
The Company recognizes the effects of changes in tax laws and rates on deferred income taxes in the period in which legislation is enacted.
Deferred income taxes are provided on undistributed earnings of foreign subsidiaries in the period in which the Company determines it no longer intends to permanently reinvest such earnings outside the United States.
As of December 31, 2017, the Company has not provided for deferred income taxes on undistributed foreign earnings related to certain geographies of approximately $492.8, as it is the Company’s intention to permanently reinvest such earnings outside the United States.
The amount of taxes that would be payable if these undistributed foreign earnings were to be repatriated would not be material.
In addition, the Company remains indefinitely reinvested with respect to its financial statement basis in excess of tax basis of its investments in foreign subsidiaries.
It is not practicable to determine the deferred tax liability with respect to such basis differences.
As a result of the Tax Cuts and Jobs Act (“Tax Act”), the Company has recorded (i) a provisional income tax charge related to the deemed repatriation of the accumulated unremitted earnings and profits of foreign subsidiaries, (ii) a provisional income tax charge related to changes in the Company’s permanent reinvestment assertion with regards to prior accumulated unremitted earnings from certain foreign subsidiaries, partially offset by (iii) a provisional income tax benefit associated with the remeasurement of its net deferred tax liabilities due to the U.S. federal corporate tax rate reduction, and included these amounts in its consolidated financial statements for the year ended December 31, 2017.
Beginning in 2018, the Tax Act also includes a global intangible low-taxed income ("GILTI") provision, which as currently interpreted by the Company, requires a tax on foreign earnings in excess of a deemed return on tangible assets of foreign subsidiaries.
The Company has elected an accounting policy to account for GILTI as a period cost if incurred, rather than recognizing deferred taxes for temporary basis differences expected to reverse as GILTI.
Other provisions of the Tax Act that impact future tax years continue to be assessed.
Our audits also included the financial statement schedule listed in the Index at Item 15.
Because of the inherent limitations of internal control over financial reporting, including the possibility of collusion or improper management override of controls, material misstatements due to error or fraud may not be prevented or detected on a timely basis.
Also, in our opinion, such financial statement schedule, when considered in relation to the basic consolidated financial statements taken as a whole, presents fairly, in all material respects, the information set forth therein.
February 17, 2017
| | | | | | | | | | | |
| --- | --- | --- | --- | --- | --- | --- | --- | --- | --- | --- |
| | | | 928.9 | | | 851.8 | |
| Land and depreciable assets: | | | | | | | |
| | | | 1,718.6 | | | 1,510.4 | |
| | | $ | 8,498.7 | | $ | 7,458.4 | |
| Balance January 1, 2014 | | 316 | | $ | 0.3 | | $ | 489.8 | | $ | 2,424.4 | | $ | (55.0) | | $ | — | | $ | 20.6 | | $ | 2,880.1 | |
| Net income | | | | | | | | | | | 709.1 | | | | | | | | | 6.1 | | | 715.2 | |
| Other comprehensive loss | | | | | | | | | | | | | | (150.8) | | | | | | (0.5) | | | (151.3) | |
| Stock options exercised, including tax benefit | | 5 | | | | | | 128.2 | | | | | | | | | | | | | | | 128.2 | |
| Other | | | (0.7) | | | (1.3) | | | 0.2 | |
| Purchases of land and depreciable assets | | | (190.8) | | | (172.1) | | | (209.1) | |
In 2015, the Company changed its annual assessment date for goodwill impairment to be as of July 1, rather than June 30, which had no impact on the outcome of the assessment.
In 2015, the Company exercised its option to bypass the qualitative assessment, and in the third quarter of 2015, the Company performed the first step of the two-step quantitative goodwill impairment assessment for each reportable business segment.
As part of the quantitative assessment, the Company estimated the fair value of each of its reportable business segments using a market approach.
The Company believes this approach provides the best indicator of fair value, by utilizing market prices and other relevant metrics for comparable publicly traded companies with similar operating and investment characteristics and recent transactions of similar businesses within the industry.
Significant estimates and assumptions were used in the Company’s goodwill impairment assessment including revenue and profitability projections, determination of appropriate publicly traded market comparison companies, and comparable revenue and earnings multiples derived from comparable publicly traded companies and from recent acquisitions within our industry.
As part of our quantitative approach, the Company evaluated whether it was reasonably likely that changes to management’s estimates and assumptions would have a material impact on the results of the goodwill impairment
assessment.
As of July 1, 2015, we determined that the fair value of each of the Company’s reportable business segments was substantially in excess of their respective carrying amounts, and therefore, no goodwill impairment resulted from the assessment.
At December 31, 2016, the cumulative amount of undistributed earnings of foreign affiliated companies was approximately $4,182.5.
Deferred income taxes are not provided on undistributed earnings of foreign affiliated companies as it is the Company’s intention to reinvest these earnings permanently outside the U.S. It is not practicable to estimate the amount of tax that might be payable if undistributed earnings were to be repatriated as there is a significant amount of uncertainty with respect to the tax impact of the remittance of these earnings due to the fact that dividends received from numerous foreign subsidiaries may generate additional foreign tax credits, which could ultimately reduce the U.S. tax cost of the dividend.
These uncertainties are further complicated by the significant number of foreign tax jurisdictions and entities involved.
In August 2015, the FASB issued Accounting Standards Update No. 2015-14, Revenue from Contracts with Customers (Topic 606): Deferral of the Effective Date (“ASU 2015-14”), which defers the effective date of FASB’s revenue standard under ASU 2014-09 by one year for all entities and permits early adoption on a limited basis.
In April 2016, the FASB issued Accounting Standards Update No. 2016-10, Revenue from Contracts with Customers (Topic 606): Identifying Performance Obligations and Licensing, which clarified the implementation guidance regarding performance obligations and licensing arrangements.
As permitted under the standard, the Company plans to adopt ASU 2014-09 in the first quarter of 2018 using the modified retrospective approach and recognize the cumulative effect to existing contracts in opening retained earnings on the effective date.
In May 2015, the FASB issued Accounting Standards Update No. 2015-07, Fair Value Measurement (Topic 820): Disclosures for Investments in Certain Entities That Calculate Net Asset Value per Share (or Its Equivalent) (Issue 14-B) (“ASU 2015-07”), which removes the requirement that investments measured using the practical expedient to measure fair value at net asset value be included in the fair value hierarchy.
Rather, an entity shall provide a reconciliation between the total fair value of investments included in the fair value hierarchy and such amounts presented on the balance sheet, including disclosures for such investments of which the net asset value practical expedient has been elected and used to determine fair value.
The
Company adopted ASU 2015-07, and as a result, the Company’s impacted investments within its pension plan assets have been removed, retrospectively, from the fair value hierarchy, as discussed in Note 7 of the Notes to the Consolidated Financial Statements.
The Company is currently evaluating ASU 2016-02 and its impact on its consolidated financial statements.
ASU 2016-09 is effective for fiscal years, and interim periods within those fiscal years, beginning after December 15, 2016, with early adoption permitted.
In August 2016, the FASB issued Accounting Standards Update No. 2016-15, Classification of Certain Cash Receipts and Cash Payments (“ASU 2016-15”), which amends ASC 230 to add and clarify guidance on the classification of certain cash receipts and payments in the statement of cash flows.
ASU 2016-15 was issued with the intent of reducing diversity in practice with respect to certain types of cash flows.
ASU 2016-15 is effective for fiscal years, and interim periods within those fiscal years, beginning after December 15, 2017, with early adoption permitted.
On March 1, 2016, the Company replaced its $1,500.0 unsecured credit facility with a new $2,000.0 unsecured credit facility (the “Revolving Credit Facility”).
An excerpt. Shown here: 40 of 429 rewritten, 40 of 242 added and 40 of 155 removed. The counts are complete. For every sentence, read Item 8. Financial Statements and Supplementary Data in the FY2017 filing and the FY2016 filing.
Item 9A. Controls and Procedures
7 rewritten, 0 added, 0 removed, 6 unchanged
[removed: Our] [added: The Company’s] management, with the participation of [removed: our] [added: the Company’s] Chief Executive Officer and Chief Financial Officer, has evaluated the effectiveness of the design and operation of our disclosure controls and procedures, pursuant to Rules 13a-15(e) or 15d-15(e) of the Securities Exchange Act of 1934, as amended (the “Exchange Act”), as of December 31, [removed: 2016.][added: 2017.]
These controls and procedures are designed to provide reasonable assurance that information [added: required to be disclosed by the Company in reports that it files or submits under the Exchange Act] is recorded, processed, summarized and reported within the time periods specified [added: in the Securities] and [added: Exchange Commission rules and forms, and such information] is accumulated and communicated to our management, including our Chief Executive Officer and Chief Financial Officer, as appropriate, to allow timely decisions regarding required disclosure.
Based on their evaluation, the Chief Executive Officer and Chief Financial Officer have concluded that [removed: as of December 31, 2016] the Company’s disclosure controls and procedures were [removed: effective.][added: effective as of December 31, 2017.]
There has been no change in our internal control over financial reporting during our most recent fiscal quarter ended December 31, [removed: 2016] [added: 2017] that has materially affected, or is reasonably likely to materially affect, our internal control over financial reporting.
Based on that evaluation, management concluded that the Company’s internal control over financial reporting was effective as of December 31, [removed: 2016.][added: 2017.]
Deloitte & Touche LLP, an independent registered public accounting firm, has audited the Company’s internal control over financial reporting as of December 31, [removed: 2016] [added: 2017] in accordance with the standards of the Public Company Accounting Oversight Board (PCAOB).
Deloitte & Touche LLP has issued an attestation report on the Company’s internal control over financial reporting as of December 31, [removed: 2016,] [added: 2017,] which is included in Item 8 of this Annual Report on Form 10-K.
Item 9B. Other Information
1 rewritten, 1 added, 2 removed, 1 unchanged
The Company intends to file a definitive proxy statement (the “Proxy Statement”) pursuant to Regulation 14A under the Securities Exchange Act within 120 days following the end of the fiscal year ended December 31, [removed: 2016,] [added: 2017,] and certain information included therein is incorporated herein by reference.
None.
The Company has entered into indemnification agreements in the form set forth in Exhibit 10.27 to this Form 10-K with all of its directors and executive officers and intends to enter into indemnification agreements with future directors and executive officers of the Company.
The indemnification agreements provide for indemnification to the fullest extent permitted by law and for advancement of expenses.
Item 15. Exhibits, Financial Statement Schedules
10 rewritten, 54 added, 3 removed, 16 unchanged
| [Report of Independent Registered Public Accounting [removed: Firm](#ReportofIndependentRegisteredPublicAccou)] [added: Firm](#REPORTOFINDEPENDENT_150676)] | [removed: 35] [added: 39] |
| [Consolidated Statements of Income—Years Ended December 31, [removed: 2016, 2015] [added: 2017, 2016] and [removed: 2014](#ConsolidatedStatementsofIncome_247596)] [added: 2015](#ConsolidatedStatementsofIncome_247596)] | [removed: 36] [added: 41] |
| [Consolidated Statements of Comprehensive Income—Years Ended December 31, [removed: 2016, 2015] [added: 2017, 2016] and [removed: 2014](#ConsolidatedStatementsofComprehensiveInc)] [added: 2015](#ConsolidatedStatementsofComprehensiveInc)] | [removed: 37] [added: 42] |
| [Consolidated Balance Sheets—December 31, [removed: 2016] [added: 2017] and [removed: 2015](#ConsolidatedBalanceSheets_591973)] [added: 2016](#ConsolidatedBalanceSheets_591973)] | [removed: 38] [added: 43] |
| [Consolidated Statements of Changes in Equity—Years Ended December 31, [removed: 2016, 2015] [added: 2017, 2016] and [removed: 2014](#ConsolidatedStatementsofChangesinEquity_)] [added: 2015](#ConsolidatedStatementsofChangesinEquity_)] | [removed: 39] [added: 44] |
| [Consolidated Statements of Cash Flow—Years Ended December 31, [removed: 2016, 2015] [added: 2017, 2016] and [removed: 2014](#ConsolidatedStatementsofCashFlow_3394)] [added: 2015](#ConsolidatedStatementsofCashFlow_3394)] | [removed: 40] [added: 45] |
| [Notes to Consolidated Financial Statements](#NotestoConsolidatedFinancialStatements_6) | [removed: 41] [added: 46] |
| [Management Report on Internal Control](#ManagementReportonInternalControl_110591) | [removed: 67] [added: 74] |
| (a)(2) Financial Statement Schedules for the Three Years Ended December 31, [removed: 2016] [added: 2017 Schedule] | |
| [II—Valuation and Qualifying Accounts for the years ended December 31, [removed: 2016, 2015] [added: 2017, 2016] and [removed: 2014](#VALUATIONANDQUALIFYINGACCOUNTS_733763)] [added: 2015](#SCHEDULEII_950693)] | [removed: 70] [added: 79] |
The following exhibits are filed as part of, or incorporated by reference into, this Annual Report on Form 10-K:
| | | | | | |
| --- | --- | --- | --- | --- | --- |
| | | | | | |
| 3.1 | [Restated Certificate of Incorporation of Amphenol Corporation, dated August 3, 2016 (filed as Exhibit 3.1 to the June 30, 2016 10-Q).*](http://www.sec.gov/Archives/edgar/data/820313/000110465916136887/a16-11647_1ex3d1.htm) | | | | |
| 3.2 | [Amphenol Corporation, Third Amended and Restated By-Laws dated March 21, 2016 (filed as Exhibit 3.1 to the Form 8-K filed on March 22, 2016).*](http://www.sec.gov/Archives/edgar/data/820313/000110465916106811/a16-7000_1ex3d1.htm) | | | | |
| 4.1 | [Indenture, dated as of November 5, 2009, between Amphenol Corporation and the Bank of New York Mellon, as trustee (filed as Exhibit 4.1 to the Form 8-K filed on November 5, 2009).*](http://www.sec.gov/Archives/edgar/data/820313/000110465909063001/a09-32977_1ex4d1.htm) | | | | |
| 4.2 | [Officers’ Certificate, dated January 26, 2012, establishing the 4.00% Senior Notes due 2022 pursuant to the Indenture (filed as Exhibit 4.2 to the Form 8-K filed on January 26, 2012).*](http://www.sec.gov/Archives/edgar/data/820313/000110465912004215/a12-3336_2ex4d2.htm) | | | | |
| 4.3 | [Officers’ Certificate, dated January 30, 2014, establishing the 2.55% Senior Notes pursuant to the Indenture (filed as Exhibit 4.2 to the Form 8-K filed on January 30, 2014).*](http://www.sec.gov/Archives/edgar/data/820313/000110465914005191/a14-4401_1ex4d2.htm) | | | | |
| 4.4 | [Officer’s Certificate, dated September 12, 2014, establishing both the 1.550% Senior Notes due 2017 and the 3.125% Senior Notes due 2021 pursuant to the Indenture (filed as Exhibit 4.2 to the Form 8-K filed on September 12, 2014).*](http://www.sec.gov/Archives/edgar/data/820313/000110465914066145/a14-20818_1ex4d2.htm) | | | | |
| 4.5 | [Officer’s Certificate, dated April 5, 2017, establishing both the 2.200% Senior Notes due 2020 and the 3.200% Senior Notes due 2024 pursuant to the Indenture (filed as Exhibits 4.2 to the Form 8-K filed on April 5, 2017).*](http://www.sec.gov/Archives/edgar/data/820313/000110465917021585/a17-8427_5ex4d2.htm) | | | | |
| 10.1 | [2017 Stock Purchase and Option Plan for Key Employees of Amphenol and Subsidiaries (filed as Annex A to the Company’s Definitive Proxy Statement on Schedule 14A for its 2017 Annual Meeting of Stockholders, filed on April 17, 2017).*](http://www.sec.gov/Archives/edgar/data/820313/000104746917002657/a2231734zdef14a.htm) | | | | |
| 10.2 | [Form of 2017 Stock Option Agreement (filed as Exhibit 10.1 to the Form 8-K filed on May 19, 2017).*](http://www.sec.gov/Archives/edgar/data/820313/000110465917034005/a17-13874_1ex10d1.htm) | | | | |
| 10.3 | [Fourth Amended 2000 Stock Purchase and Option Plan for Key Employees of Amphenol and Subsidiaries (filed as Exhibit 10.20 to the June 30, 2007 10-Q).*](http://www.sec.gov/Archives/edgar/data/820313/000110465907058778/a07-19031_1ex10d20.htm) | | | | |
| --- | --- | --- | --- | --- | --- |
| 10.4 | [2009 Stock Purchase and Option Plan for Key Employees of Amphenol and Subsidiaries (filed as Exhibit 10.7 to the June 30, 2009 10-Q).*](http://www.sec.gov/Archives/edgar/data/820313/000110465909047605/a09-14428_1ex10d7.htm) | | | | |
| 10.5 | [The First Amendment to the 2009 Stock Purchase and Option Plan for Key Employees of Amphenol and Subsidiaries (filed as Exhibit 10.2 to the Form 8-K filed on May 23, 2014).*](http://www.sec.gov/Archives/edgar/data/820313/000110465914041219/a14-13413_1ex10d2.htm) | | | | |
| 10.6 | [Form of 2009 Non-Qualified Stock Option Grant Agreement dated as of May 20, 2009 (filed as Exhibit 10.8 to the June 30, 2009 10-Q).*](http://www.sec.gov/Archives/edgar/data/820313/000110465909047605/a09-14428_1ex10d8.htm) | | | | |
| 10.7 | [Form of 2009 Management Stockholders’ Agreement dated as of May 20, 2009 (filed as Exhibit 10.9 to the June 30, 2009 10-Q).*](http://www.sec.gov/Archives/edgar/data/820313/000110465909047605/a09-14428_1ex10d9.htm) | | | | |
| 10.8 | [Pension Plan for Employees of Amphenol Corporation as amended and restated effective January 1, 2016 (filed as Exhibit 10.6 to the December 31, 2016 10-K).*](http://www.sec.gov/Archives/edgar/data/820313/000155837017000659/aph-20161231ex1061f1a38.htm) | | | | |
| 10.9 | [First Amendment to Pension Plan for Employees of Amphenol Corporation as amended and restated effective January 1, 2016, dated November 10, 2016 (filed as Exhibit 10.7 to the December 31, 2016 10-K).*](http://www.sec.gov/Archives/edgar/data/820313/000155837017000659/aph-20161231ex1073926e5.htm) | | | | |
| 10.10 | [Second Amendment to Pension Plan for Employees of Amphenol Corporation as amended and restated effective January 1, 2016, dated October 1, 2016 (filed as Exhibit 10.8 to the December 31, 2016 10-K).*](http://www.sec.gov/Archives/edgar/data/820313/000155837017000659/aph-20161231ex1083d02fe.htm) | | | | |
| 10.11 | [Third Amendment to Pension Plan for Employees of Amphenol Corporation as amended and restated effective January 1, 2016, dated December 13, 2016 (filed as Exhibit 10.9 to the December 31, 2016 10-K).*](http://www.sec.gov/Archives/edgar/data/820313/000155837017000659/aph-20161231ex109384e74.htm) | | | | |
| 10.12 | [Fourth Amendment to Pension Plan for Employees of Amphenol Corporation as amended and restated effective January 1, 2016, dated May 2, 2017 (filed as Exhibit 10.12 to the June 30, 2017 10-Q).*](http://www.sec.gov/Archives/edgar/data/820313/000155837017005866/aph-20170630ex1012fac38.htm) | | | | |
| 10.13 | [Amended and Restated Amphenol Corporation Supplemental Employee Retirement Plan (filed as Exhibit 10.24 to the December 31, 2008 10-K).*](http://www.sec.gov/Archives/edgar/data/820313/000110465909011495/a09-1255_1ex10d24.htm) | | | | |
| 10.14 | [Amphenol Corporation Directors’ Deferred Compensation Plan (filed as Exhibit 10.11 to the December 31, 1997 10-K).*](http://www.sec.gov/Archives/edgar/data/820313/0001005477-98-000987-index.html) | | | | |
| 10.15 | [The 2004 Stock Option Plan for Directors of Amphenol Corporation (filed as Exhibit 10.44 to the June 30, 2004 10-Q).*](http://www.sec.gov/Archives/edgar/data/820313/000110465904023311/a04-9054_1ex10d44.htm) | | | | |
| 10.16 | [The Amended 2004 Stock Option Plan for Directors of Amphenol Corporation (filed as Exhibit 10.29 to the June 30, 2008 10-Q).*](http://www.sec.gov/Archives/edgar/data/820313/000110465908051275/a08-18814_1ex10d29.htm) | | | | |
| 10.17 | [The 2012 Restricted Stock Plan for Directors of Amphenol Corporation dated May 24, 2012 (filed as Exhibit 10.15 to the June 30, 2012 10-Q).*](http://www.sec.gov/Archives/edgar/data/820313/000110465912054022/a12-13710_1ex10d15.htm) | | | | |
| 10.18 | [2012 Restricted Stock Plan for Directors of Amphenol Corporation Restricted Share Award Agreement dated May 24, 2012 (filed as Exhibit 10.16 to the June 30, 2012 10-Q).*](http://www.sec.gov/Archives/edgar/data/820313/000110465912054022/a12-13710_1ex10d16.htm) | | | | |
| 10.19 | [2018 Amphenol Corporation Management Incentive Plan.](https://www.sec.gov/Archives/edgar/data/820313/000155837018000871/aph-20171231ex1019a767a.htm) | | | | |
| 10.20 | [2014 Amphenol Corporation Executive Incentive Plan (filed as Exhibit 10.1 to the Form 8-K filed on May 23, 2014).*](http://www.sec.gov/Archives/edgar/data/820313/000110465914041219/a14-13413_1ex10d1.htm) | | | | |
| 10.21 | [Credit Agreement, dated as of March 1, 2016, among the Company, certain subsidiaries of the Company, a syndicate of financial institutions and JPMorgan Chase Bank, N.A. acting as the administrative agent (filed as Exhibit 10.1 to the Form 8-K filed on March 2, 2016).*](http://www.sec.gov/Archives/edgar/data/820313/000110465916101652/a16-5641_1ex10d1.htm) | | | | |
| 10.22 | [Continuing Agreement for Standby Letters of Credit between the Company and Deutsche Bank dated March 4, 2009 (filed as Exhibit 10.36 to the March 31, 2009 10-Q).*](http://www.sec.gov/Archives/edgar/data/820313/000110465909029983/a09-11193_1ex10d36.htm) | | | | |
| 10.23 | [Third Amendment to The Amphenol Corporation Employee Savings/401(K) Plan Adoption Agreement as amended and restated effective October 1, 2013, dated September 20, 2013 (filed as Exhibit 10.40 to the December 31, 2013 10-K).*](http://www.sec.gov/Archives/edgar/data/820313/000110465914012225/a13-24862_1ex10d40.htm) | | | | |
| 10.24 | [Amended and Restated Amphenol Corporation Supplemental Defined Contribution Plan (filed as Exhibit 10.30 to the September 30, 2011 10-Q).*](http://www.sec.gov/Archives/edgar/data/820313/000110465911061028/a11-24710_1ex10d30.htm) | | | | |
| 10.25 | [Amphenol Corporation Supplemental Defined Contribution Plan as amended effective January 1, 2012 (filed as Exhibit 10.34 to the December 31, 2011 10-K).*](http://www.sec.gov/Archives/edgar/data/820313/000110465912012448/a12-1044_1ex10d34.htm) | | | | |
| 10.26 | [Commercial paper program form of Dealer Agreement dated as of August 29, 2014 between the Company, Citibank Global Markets and JP Morgan Securities LLC (filed as Exhibit 10.1 to the Form 8-K filed on September 5, 2014).*](http://www.sec.gov/Archives/edgar/data/820313/000110465914064847/a14-20531_1ex10d1.htm) | | | | |
| 10.27 | [Form of Indemnification Agreement for Directors and Executive Officers (filed as Exhibit 10.27 to the December 31, 2016 10-K).*](http://www.sec.gov/Archives/edgar/data/820313/000155837017000659/aph-20161231ex1027c5514.htm) | | | | |
| 21.1 | [Subsidiaries of the Company.](https://www.sec.gov/Archives/edgar/data/820313/000155837018000871/aph-20171231ex211605866.htm) | | | | |
| | |
| [Schedule](#SCHEDULEII_950693) | 70 |
Refer to the Index of Exhibits immediately following the signature page of this annual report on Form 10-K.
An excerpt. Shown here: all 10 rewritten, 40 of 54 added and all 3 removed. The counts are complete. For every sentence, read Item 15. Exhibits, Financial Statement Schedules in the FY2017 filing and the FY2016 filing.
Item 16. Form 10-K Summary
13 rewritten, 5 added, 59 removed, 46 unchanged
For the years ended December 31, [removed: 2016, 2015] [added: 2017, 2016] and [removed: 2014][added: 2015]
| Year ended 2016 | | [removed: $] | 25.6 | | [removed: $] | 6.0 | | [removed: $] | (8.0) | | [removed: $] | 23.6 | |
| Year ended 2016 | | [removed: $] | 18.5 | | [removed: $] | 4.8 | | [removed: $] | 13.9 | | [removed: $] | 37.2 | |
Pursuant to the requirements of Section 13 or 15(d) of the Securities Exchange Act of 1934, the registrant has duly caused this report to be signed on its behalf by the undersigned, thereunto duly authorized in the Town of Wallingford, State of Connecticut on the [removed: 17th] [added: 21st] day of February, [removed: 2017.][added: 2018.]
| /s/ R. Adam Norwitt | | President and Chief Executive Officer | | February [removed: 17, 2017] [added: 21, 2018] |
| /s/ Craig A. Lampo | | Senior Vice President and Chief Financial Officer | | February [removed: 17, 2017] [added: 21, 2018] |
| /s/ Martin H. Loeffler | | Chairman of the Board of Directors | | February [removed: 17, 2017] [added: 21, 2018] |
| /s/ Ronald P. Badie | | Director | | February [removed: 17, 2017] [added: 21, 2018] |
| /s/ Stanley L. Clark | | Director | | February [removed: 17, 2017] [added: 21, 2018] |
| /s/ David P. Falck | | Director | | February [removed: 17, 2017] [added: 21, 2018] |
| /s/ Edward G. Jepsen | | Director | | February [removed: 17, 2017] [added: 21, 2018] |
| /s/ John R. Lord | | Director | | February [removed: 17, 2017] [added: 21, 2018] |
| /s/ Diana G. Reardon | | Director | | February [removed: 17, 2017] [added: 21, 2018] |
| Allowance for doubtful accounts: | | | | | | | | | | | | | |
| Year ended 2017 | | $ | 23.6 | | $ | 1.8 | | $ | (2.4) | | $ | 23.0 | |
| Year ended 2017 | | $ | 37.2 | | $ | 2.5 | | $ | (0.1) | | $ | 39.6 | |
| /s/ John D. Craig | | Director | | February 21, 2018 |
| John D. Craig | | | | |
| Receivable reserves: | | | | | | | | | | | | | |
| Year ended 2014 | | | 12.0 | | | 9.7 | | | (1.5) | | | 20.2 | |
| Year ended 2014 | | | 19.4 | | | (3.9) | | | — | | | 15.5 | |
| --- | --- |
| /s/ Randall D. Ledford | | Director | | February 17, 2017 |
| Randall D. Ledford | | | | |
Index of Exhibits
| | | |
| --- | --- | --- |
| 2.1 | Letter Agreement, dated June 27, 2015, by and between Fidji Luxembourg (BC4) Sarl, Amphenol East Asia Limited and Amphenol Corporation (including the form of Sale and Purchase Agreement, to be entered into by and among Fidji Luxembourg (BC4) Sarl, Amphenol East Asia Limited and Amphenol Corporation) (filed as Exhibit 2.1 to the Form 8-K filed on June 29, 2015). * | |
| 2.2 | Sale and Purchase Agreement, dated July 17, 2015, by and among Fidji Luxembourg (BC4) Sarl, Amphenol East Asia Limited and Amphenol Corporation (filed as Exhibit 2.1 to the Form 8-K filed on July 20, 2015). * | |
| 2.3 | Amendment Agreement (amending the Sale and Purchase Agreement (the “Purchase Agreement”), dated as of July 17, 2015), dated December 31, 2015, by and among Fidji Luxembourg (BC4) Sarl, Amphenol East Asia Limited and Amphenol Corporation (filed as Exhibit 2.1 to the Form 8-K filed on January 4, 2016). * | |
| 3.1 | Restated Certificate of Incorporation of Amphenol Corporation, dated August 3, 2016 (filed as Exhibit 3.1 to the June 30, 2016 10-Q).* | |
| 3.2 | Amphenol Corporation, Third Amended and Restated By-Laws dated March 21, 2016 (filed as Exhibit 3.1 to the Form 8-K on March 22, 2016).* | |
| 4.1 | Indenture, dated as of November 5, 2009, between Amphenol Corporation and the Bank of New York Mellon, as trustee (filed as Exhibit 4.1 to the Form 8-K filed on November 5, 2009).* | |
| 4.2 | Officers’ Certificate, dated January 26, 2012, establishing the 4.00% Senior Notes due 2022 pursuant to the Indenture (filed as Exhibit 4.2 to the Form 8-K filed on January 26, 2012).* | |
| 4.3 | Officers’ Certificate, dated January 30, 2014, establishing the 2.55% Senior Notes Pursuant to the Indenture (filed as Exhibit 4.2 to the Form 8-K filed January 30, 2014).* | |
| 4.4 | Officer’s Certificate, dated September 12, 2014, establishing both the 1.550% Senior Notes due 2017 and the 3.125% Senior Notes due 2021 pursuant to the Indenture (filed as Exhibit 4.2 to Form 8-K filed on September 12, 2014).* | |
| 10.1 | Fourth Amended 2000 Stock Purchase and Option Plan for Key Employees of Amphenol and Subsidiaries (filed as Exhibit 10.20 to the June 30, 2007 10-Q).* | |
| 10.2 | 2009 Stock Purchase and Option Plan for Key Employees of Amphenol and Subsidiaries (filed as Exhibit 10.7 to the June 30, 2009 10-Q).* | |
| 10.3 | The First Amendment to the 2009 Stock Purchase and Option Plan for Key Employees of Amphenol and Subsidiaries (filed as Exhibit 10.2 to the Form 8-K on May 23, 2014).* | |
| 10.4 | Form of 2009 Non-Qualified Stock Option Grant Agreement dated as of May 20, 2009 (filed as Exhibit 10.8 to the June 30, 2009 10-Q).* | |
| 10.5 | Form of 2009 Management Stockholders’ Agreement dated as of May 20, 2009 (filed as Exhibit 10.9 to the June 30, 2009 10-Q).* | |
| 10.6 | Pension Plan for Employees of Amphenol Corporation as amended and restated effective January 1, 2016 (filed as Exhibit 10.6 to the December 31, 2016 10-K). | |
| 10.7 | First Amendment to Pension Plan for Employees of Amphenol Corporation as amended and restated effective January 1, 2016, dated November 10, 2016 (filed as Exhibit 10.7 to the December 31, 2016 10-K). | |
| 10.8 | Second Amendment to Pension Plan for Employees of Amphenol Corporation as amended and restated effective January 1, 2016, dated October 1, 2016 (filed as Exhibit 10.8 to the December 31, 2016 10-K). | |
| 10.9 | Third Amendment to Pension Plan for Employees of Amphenol Corporation as amended and restated effective January 1, 2016, dated December 13, 2016 (filed as Exhibit 10.9 to the December 31, 2016 10-K). | |
| 10.10 | Amended and Restated Amphenol Corporation Supplemental Employee Retirement Plan (filed as Exhibit 10.24 to the December 31, 2008 10-K).* | |
| 10.11 | Amphenol Corporation Directors’ Deferred Compensation Plan (filed as Exhibit 10.11 to the December 31, 1997 10-K).* | |
| 10.12 | The 2004 Stock Option Plan for Directors of Amphenol Corporation (filed as Exhibit 10.44 to the June 30, 2004 10-Q).* | |
| 10.13 | The Amended 2004 Stock Option Plan for Directors of Amphenol Corporation (filed as Exhibit 10.29 to the June 30, 2008 10-Q).* | |
| 10.14 | The 2012 Restricted Stock Plan for Directors of Amphenol Corporation dated May 24, 2012 (filed as Exhibit 10.15 to the June 30, 2012 10-Q).* | |
| 10.15 | 2012 Restricted Stock Plan for Directors of Amphenol Corporation Restricted Share Award Agreement dated May 24, 2012 (filed as Exhibit 10.16 to the June 30, 2012 10-Q).* |
| 10.16 | 2017 Amphenol Corporation Management Incentive Plan (filed as Exhibit 10.16 to the December 31, 2016 10-K). |
| 10.17 | 2014 Amphenol Corporation Executive Incentive Plan (filed as Exhibit 10.1 to the Form 8-K on May 23, 2014).* |
| 10.18 | Credit Agreement, dated as of March 1, 2016, among the Company, certain subsidiaries of the Company, a syndicate of financial institutions and JPMorgan Chase Bank, N.A. acting as the administrative agent (filed as Exhibit 10.1 to the Form 8-K filed on March 2, 2016).* |
| 10.19 | Continuing Agreement for Standby Letters of Credit between the Company and Deutsche Bank dated March 4, 2009 (filed as Exhibit 10.36 to the March 31, 2009 10-Q).* |
| 10.20 | The Amphenol Corporation Employee Savings/401(k) Plan Adoption Agreement as amended and restated effective December 14, 2011 (filed as Exhibit 10.32 to the December 31, 2011 10-K).* |
| 10.21 | First Amendment to The Amphenol Corporation Employee Savings/401(k) Plan Adoption Agreement as amended and restated effective December 14, 2011, dated March 30, 2012 (filed as Exhibit 10.36 to the June 30, 2012 10-Q).* |
| 10.22 | Second Amendment to The Amphenol Corporation Employee Savings/401(k) Plan Adoption Agreement as amended and restated effective December 14, 2011, dated April 10, 2012 (filed as Exhibit 10.37 to the June 30, 2012 10-Q).* |
An excerpt. Shown here: all 13 rewritten, all 5 added and 40 of 59 removed. The counts are complete. For every sentence, read Item 16. Form 10-K Summary in the FY2017 filing and the FY2016 filing.