 filings.tools
Item 5. Market for Registrant’s Common Equity, Related Stockholder Matters and Issuer Purchases of Equity Securities
7K characters. Original on sec.gov · Markdown
Item 5. Market for Registrant’s Common Equity, Related Stockholder Matters and Issuer Purchases of Equity Securities
Market Information and Dividends
The Company effected the initial public offering of its Class A Common Stock (“Common Stock”) in November 1991. The Company’s Common Stock has been listed on the New York Stock Exchange since that time under the symbol “APH”. As of January 31, 2018, there were 33 holders of record of the Company’s Common Stock. A significant number of outstanding shares of Common Stock are registered in the name of only one holder, which is a nominee of The Depository Trust Company, a securities depository for banks and brokerage firms. The Company believes that there are a significant number of beneficial owners of its Common Stock. Contingent upon declaration by the Board of Directors, the Company generally pays a quarterly dividend on shares of its Common Stock. The following table sets forth the high and low closing sales prices for the Common Stock as reported on the New York Stock Exchange, as well as the dividends declared per common share, for each quarter of 2017 and 2016:
| 2017 | 2016 | |||||||||||||||||
| Closing Prices | Dividends | Closing Prices | Dividends | |||||||||||||||
| High | Low | per share | High | Low | per share | |||||||||||||
| First Quarter | $ | 71.89 | $ | 66.60 | $ | 0.16 | $ | 57.82 | $ | 45.42 | $ | 0.14 | ||||||
| Second Quarter | 76.18 | 68.65 | 0.16 | 60.11 | 55.08 | 0.14 | ||||||||||||
| Third Quarter | 84.64 | 72.48 | 0.19 | 65.68 | 55.97 | 0.14 | ||||||||||||
| Fourth Quarter | 91.04 | 84.77 | 0.19 | 68.83 | 63.05 | 0.16 | ||||||||||||
| $ | 0.70 | $ | 0.58 |
Dividends declared and paid for the years ended December 31, 2017 and 2016 (in millions):
| 2017 | 2016 | ||||||||
| Dividends declared | $ | 213.7 | $ | 178.8 | |||||
| Dividends paid (including those declared in the prior year) | 205.0 | 172.7 |
The Company’s Revolving Credit Facility contains financial covenants and restrictions, some of which may limit the Company’s ability to pay dividends, and any future indebtedness that the Company may incur could limit its ability to pay dividends.
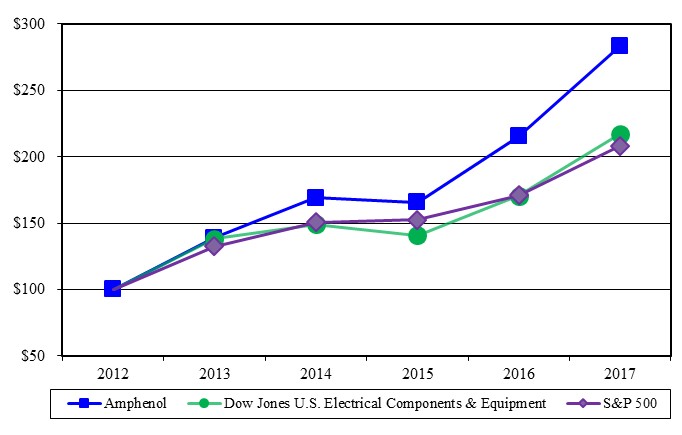
Stock Performance Graph
The following graph compares the cumulative total shareholder return of Amphenol over a period of five years ending December 31, 2017 with the performance of the Standard & Poor’s 500 (“S&P 500”) Stock Index and the Dow Jones U.S. Electrical Components & Equipment Index. This graph assumes that $100 was invested in the Common Stock of Amphenol and each index on December 31, 2012, reflects reinvested dividends and is weighted on a market capitalization basis at the time of each reported data point. Each reported data point below represents the last trading day of each calendar year. The comparisons in the graph below are based upon historical data and are not indicative of, nor intended to forecast, future performance.
Equity Compensation Plan Information
The following table summarizes the Company’s equity compensation plan information as of December 31, 2017:
| Equity Compensation Plan Information | ||||||||
| Number of securities to | Weighted average | Number of | ||||||
| be issued upon exercise | exercise price of | securities | ||||||
| of outstanding options, | outstanding options, | remaining available | ||||||
| Plan category | warrants and rights | warrants and rights | for future issuance | |||||
| Equity compensation plans approved by security holders | 33,235,269 | $ | 52.28 | 35,473,014 | ||||
| Equity compensation plans not approved by security holders | — | — | — | |||||
| Total | 33,235,269 | $ | 52.28 | 35,473,014 |
Repurchase of Equity Securities
On January 24, 2017, the Company’s Board of Directors authorized a new stock repurchase program under which the Company may purchase up to $1.0 billion of the Company’s Common Stock during the two-year period ending January 24, 2019 in accordance with the requirements of Rule 10b-18 of the Exchange Act (the “2017 Stock Repurchase Program”). During the year ended December 31, 2017, the Company repurchased 8.4 million shares of its Common Stock for $618.0 million. These treasury shares have been retired by the Company and Common Stock and retained earnings were reduced accordingly. From January 1, 2018 through January 31, 2018, the Company repurchased approximately 1.1 million additional shares of Common Stock for $105.5 million, leaving approximately $276.5 million available to purchase under the 2017 Stock Repurchase Program. The price and timing of any future purchases under the 2017 Stock Repurchase Program will depend on factors such as levels of cash generation from operations, the volume of stock option exercises by employees, cash requirements for acquisitions, dividends, economic and market
conditions and stock price. The table below reflects the Company’s stock repurchases for the year ended December 31, 2017:
| Total Number of | Maximum Dollar | ||||||||||
| (dollars in millions, except price per share) | Shares Purchased as | Value of Shares | |||||||||
| Total Number | Average | Part of Publicly | that May Yet be | ||||||||
| of Shares | Price Paid | Announced Plans or | Purchased Under the | ||||||||
| Period | Purchased | per Share | Programs | Plans or Programs | |||||||
| First Quarter - 2017 | 3,678,365 | $ | 67.74 | 3,678,365 | $ | 750.8 | |||||
| Second Quarter - 2017 | 2,000,000 | 75.36 | 2,000,000 | 600.1 | |||||||
| Third Quarter - 2017 | 2,000,000 | 77.86 | 2,000,000 | 444.4 | |||||||
| Fourth Quarter - 2017: | |||||||||||
| October 1 to October 31, 2017 | — | — | — | 444.4 | |||||||
| November 1 to November 30, 2017 | 446,879 | 88.53 | 446,879 | 404.8 | |||||||
| December 1 to December 31, 2017 | 253,121 | 90.13 | 253,121 | 382.0 | |||||||
| 700,000 | 89.11 | 700,000 | 382.0 | ||||||||
| Total - 2017 | 8,378,365 | $ | 73.76 | 8,378,365 | $ | 382.0 |
In January 2015, the Company’s Board of Directors authorized a stock repurchase program under which the Company could repurchase up to 10 million shares of Common Stock during the two-year period ended January 20, 2017 (the “2015 Stock Repurchase Program”). As of December 31, 2016, the Company had repurchased all of the shares authorized under the 2015 Stock Repurchase Program.
Previous: Item 4. Mine Safety Disclosures · Next: Item 6. Selected Financial Data