 filings.tools
Alexandria Real Estate Equities 10-K 2020-12-31
Filed 2021-02-01. 21 sections, 1072K characters. Original on sec.gov · Markdown · JSON
Cover and table of contents
UNITED STATES
SECURITIES AND EXCHANGE COMMISSION
Washington, D.C. 20549
FORM 10-K
(Mark One)
x ANNUAL REPORT PURSUANT TO SECTION 13 OR 15(d) OF THE SECURITIES EXCHANGE ACT OF 1934
For the fiscal year ended December 31, 2020
Commission file number 1-12993
ALEXANDRIA REAL ESTATE EQUITIES, INC.
(Exact name of registrant as specified in its charter)
| Maryland | 95-4502084 | |||||||
| (State or other jurisdiction of incorporation or organization) | (I.R.S. Employer Identification Number) |
26 North Euclid Avenue, Pasadena, California 91101
(Address of principal executive offices) (Zip code)
(626) 578-0777
(Registrant’s telephone number, including area code)
Securities registered pursuant to Section 12(b) of the Act:
| Title of each class | Trading Symbol(s) | Name of each exchange on which registered | ||||||
| Common Stock, $0.01 par value per share | ARE | New York Stock Exchange |
Securities registered pursuant to Section 12(g) of the Act: None
Indicate by check mark if the registrant is a well-known seasoned issuer, as defined in Rule 405 of the Securities Act. Yes x No o
Indicate by check mark if the registrant is not required to file reports pursuant to Section 13 or Section 15(d) of the Act. Yes o No x
Indicate by check mark whether the registrant (1) has filed all reports required to be filed by Section 13 or 15(d) of the Securities Exchange Act of 1934 during the preceding 12 months (or for such shorter period that the registrant was required to file such reports), and (2) has been subject to such filing requirements for the past 90 days. Yes o No x
Indicate by check mark whether the registrant has submitted electronically every Interactive Data File required to be submitted pursuant to Rule 405 of Regulation S-T (§ 232.405 of this chapter) during the preceding 12 months (or for such shorter period that the registrant was required to submit such files). Yes x No o
Indicate by check mark whether the registrant is a large accelerated filer, an accelerated filer, a non-accelerated filer, a smaller reporting company, or an emerging growth company. See the definitions of “large accelerated filer,” “accelerated filer,” “smaller reporting company,” and “emerging growth company” in Rule 12b-2 of the Exchange Act.
| Large accelerated filer | x | Smaller reporting company | o | |||||||||||
| Accelerated filer | o | Emerging growth company | o | |||||||||||
| Non-accelerated filer | o |
If an emerging growth company, indicate by check mark if the registrant has elected not to use the extended transition period for complying with any new or revised financial accounting standards provided pursuant to Section 13(a) of the Exchange Act. o
Indicate by check mark whether the registrant has filed a report on and attestation to its management’s assessment of the effectiveness of its internal control over financial reporting under Section 404(b) of the Sarbanes-Oxley Act (15 U.S.C. 7262(b)) by the registered public accounting firm that prepared or issued its audit report. x
Indicate by check mark whether the registrant is a shell company (as defined in Rule 12b-2 of the Exchange Act). Yes o No x
The aggregate market value of the shares of Common Stock held by non-affiliates of registrant was approximately $20.2 billion based on the closing price for such shares on the New York Stock Exchange on June 30, 2020.
As of January 15, 2021, 136,692,746 shares of common stock were outstanding.
Documents Incorporated by Reference
Part III of this annual report on Form 10-K incorporates certain information by reference from the registrant’s definitive proxy statement to be filed within 120 days of the end of the fiscal year covered by this annual report on Form 10-K in connection with the registrant’s annual meeting of stockholders to be held on or about May 18, 2021.
INDEX TO FORM 10-K
ALEXANDRIA REAL ESTATE EQUITIES, INC.
GLOSSARY
The following abbreviations or acronyms that may be used in this document shall have the adjacent meanings set forth below:
| ASU | Accounting Standards Update | ||||
| ATM | At the Market | ||||
| BBA | British Bankers’ Association | ||||
| CIP | Construction in Progress | ||||
| EPS | Earnings per Share | ||||
| FASB | Financial Accounting Standards Board | ||||
| FDA | U.S. Food and Drug Administration | ||||
| FDIC | Federal Deposit Insurance Corporation | ||||
| FFO | Funds From Operations | ||||
| GAAP | U.S. Generally Accepted Accounting Principles | ||||
| HVAC | Heating, Ventilation, and Air Conditioning | ||||
| IASB | International Accounting Standards Board | ||||
| IFRS | International Financial Reporting Standards | ||||
| IRS | Internal Revenue Service | ||||
| JV | Joint Venture | ||||
| LEED® | Leadership in Energy and Environmental Design | ||||
| LIBOR | London Interbank Offered Rate | ||||
| Nareit | National Association of Real Estate Investment Trusts | ||||
| NAV | Net Asset Value | ||||
| NYSE | New York Stock Exchange | ||||
| REIT | Real Estate Investment Trust | ||||
| RSF | Rentable Square Feet/Foot | ||||
| SEC | Securities and Exchange Commission | ||||
| SF | Square Feet/Foot | ||||
| SoDo | South of Downtown submarket of Seattle | ||||
| SoMa | South of Market submarket of San Francisco | ||||
| U.S. | United States | ||||
| VIE | Variable Interest Entity |
PART I
Forward-looking statements
Certain information and statements included in this annual report on Form 10-K, including, without limitation, statements containing the words “forecast,” “guidance,” “goals,” “projects,” “estimates,” “anticipates,” “believes,” “expects,” “intends,” “may,” “plans,” “seeks,” “should,” or “will,” or the negative of these words or similar words, constitute “forward-looking statements” within the meaning of Section 27A of the Securities Act of 1933, as amended, and Section 21E of the Securities Exchange Act of 1934, as amended. Forward-looking statements involve inherent risks and uncertainties regarding events, conditions, and financial trends that may affect our future plans of operations, business strategy, results of operations, and financial position. A number of important factors could cause actual results to differ materially from those included within or contemplated by the forward-looking statements, including, but not limited to, the description of risks and uncertainties in “Item 1A. Risk factors” in this annual report on Form 10-K. Additional information regarding risk factors that may affect us is included in “Item 7. Management’s discussion and analysis of financial condition and results of operations” in this annual report on Form 10-K. Readers of our annual report on Form 10-K should also read our SEC and other publicly filed documents for further discussion regarding such factors.
As used in this annual report on Form 10-K, references to the “Company,” “Alexandria,” “we,” “us,” and “our” refer to Alexandria Real Estate Equities, Inc. and its consolidated subsidiaries. The following discussion should be read in conjunction with our consolidated financial statements and notes thereto under “Item 15. Exhibits and Financial Statement Schedules” in this annual report on Form 10-K.
Item 1. BUSINESS
Overview
We are a Maryland corporation formed in October 1994 that has elected to be taxed as a REIT for federal income tax purposes. We are an S&P 500® urban office REIT and the first, longest-tenured, and pioneering owner, operator, and developer uniquely focused on collaborative life science, technology, and agtech campuses in AAA innovation cluster locations. We consider AAA locations to be highly desirable for tenancy by life science, technology, and agtech entities because of their close proximity to concentrations of specialized skills, knowledge, institutions, and related businesses. Such locations are generally characterized by high barriers to entry for new landlords, high barriers to exit for tenants, and a limited supply of available space. Founded in 1994, Alexandria pioneered this niche and has since established a significant market presence in key locations, including Greater Boston, San Francisco, New York City, San Diego, Seattle, Maryland, and Research Triangle.
Alexandria develops dynamic urban cluster campuses and vibrant ecosystems that enable and inspire the world’s most brilliant minds and innovative companies to create life-changing scientific and technological breakthroughs. We believe in the utmost professionalism, humility, and teamwork. Alexandria manages its properties through fully integrated regional teams with real estate, life science, technology, and agtech expertise. Our tenants include multinational pharmaceutical companies; public and private biotechnology companies; life science product, service, and medical device companies; digital health, technology, and agtech companies; academic and medical research institutions; U.S. government research agencies; non-profit organizations; and venture capital firms. Alexandria has a longstanding and proven track record of developing Class A properties clustered in urban life science, technology, and agtech campuses that provide its innovative tenants with highly dynamic and collaborative environments that enhance their ability to successfully recruit and retain world-class talent and inspire productivity, efficiency, creativity, and success. Alexandria also provides strategic risk capital to transformative life science, technology, and agtech companies through its venture capital arm. We believe our unique business model and diligent underwriting ensure a high-quality and diverse tenant base that should result in higher occupancy levels, longer lease terms, higher rental income, higher returns, and greater long-term asset value.
As of December 31, 2020, Alexandria’s total market capitalization was $31.9 billion. For the definition of “Total market capitalization,” refer to the “Non-GAAP measures and definitions” section under Item 7 in this annual report on Form 10-K. Our asset base in North America consisted of 49.7 million SF, which includes 31.9 million RSF of operating properties and 3.3 million RSF of Class A properties undergoing construction, 7.1 million RSF of near-term and intermediate-term development and redevelopment projects, and 7.4 million SF of future development projects as of December 31, 2020. These operating properties and development projects include 40 properties that are held by consolidated real estate joint ventures and six properties that are held by unconsolidated real estate joint ventures. The occupancy percentage of our operating properties in North America was 94.6% as of December 31, 2020. Our 10-year average occupancy rate of operating properties as of December 31, 2020, was 96%. Investment-grade or publicly traded large cap tenants represented 55% of our annual rental revenue in effect as of December 31, 2020. Additional information regarding our consolidated and unconsolidated real estate joint ventures is included in “Item 7. Management’s discussion and analysis of financial condition and results of operations” in this annual report on Form 10-K. Additional information regarding risk factors that may affect us is included in “Item 1A. Risk factors” and “Item 7. Management’s discussion and analysis of financial condition and results of operations” in this annual report on Form 10-K.
Business objective and strategies
Our primary business objective is to maximize long-term asset value and shareholder returns based on a multifaceted platform of internal and external growth. A key element of our strategy is our unique focus on Class A properties clustered in urban campuses located in AAA innovation cluster locations. These key urban campus locations are characterized by high barriers to entry for new landlords, high barriers to exit for tenants, and a limited supply of available space. They represent highly desirable locations for tenancy by life science, technology, and agtech entities because of their close proximity to concentrations of specialized skills, knowledge, institutions, and related businesses. Our strategy also includes drawing upon our deep and broad real estate, life science, technology, and agtech relationships in order to identify and attract new and leading tenants and to source additional value-creation real estate.
Our tenant base is broad and diverse within the life science, technology, and agtech industries and reflects our focus on regional, national, and international tenants with substantial financial and operational resources. For a more detailed description of our properties and tenants, refer to “Item 2. Properties” in this annual report on Form 10-K. We have an experienced Board of Directors and are led by an executive and senior management team with extensive experience in the real estate, life science, technology, and agtech industries.
Acquisitions
We seek to identify and acquire high-quality properties in our target cluster markets. Critical evaluation of prospective property acquisitions is an essential component of our acquisition strategy. When evaluating acquisition opportunities, we assess a full range of matters relating to the prospective property or properties, including:
-
Proximity to centers of innovation and technological advances;
-
Location of the property and our strategy in the relevant market;
-
Quality of existing and prospective tenants;
-
Condition and capacity of the building infrastructure;
-
Physical condition of the structure and common area improvements;
-
Quality and generic characteristics of the improvements;
-
Opportunities available for leasing vacant space and for re-tenanting or renewing occupied space;
-
Availability of and/or ability to add appropriate tenant amenities;
-
Availability of land for future ground-up development of new space;
-
Opportunities to generate higher rent through redevelopment of existing space;
-
The property’s unlevered yields; and
-
Our ability to increase the property’s long-term financial returns.
Development, pre-construction, and redevelopment
A key component of our business model is our value-creation development projects. Our development strategy is primarily to pursue selective projects with significant pre-leasing for which we expect to achieve appropriate investment returns and generally match a source of funds for this use. Our value-creation development projects focus on high-quality, generic, and reusable office/laboratory or tech office space to meet the real estate requirements of our diverse group of tenants.
We seek to meet growing demand from our stakeholders and continuously improve the efficiency of our buildings. We have committed to significant building goals to promote wellness and productivity for our buildings’ occupants, including targeting a minimum of LEED® Gold certification on all new ground-up construction projects.
Pre-construction activities include entitlements, permitting, design, site work, and other activities preceding commencement of construction of aboveground building improvements, which are focused on reducing the time required to deliver projects to prospective tenants. These critical activities add significant value to our future ground-up development and are required for the vertical construction of buildings. We normally do not commence vertical construction of new projects prior to achieving significant pre-leasing.
Another key component of our business model is our value-creation redevelopment of existing office, warehouse, or shell space, or newly acquired properties, into high-quality, generic, and reusable office/laboratory space that can be leased at higher rental rates. Our redevelopment strategy generally includes significant pre-leasing of projects prior to the commencement of redevelopment.
Non-real estate investments
We also hold equity investments in publicly traded companies, limited partnerships, and privately held entities primarily involved in the life science, technology, and agtech industries. We invest primarily in highly innovative entities whose focus on the development of therapies and products that advance health and transform patients’ lives is aligned with Alexandria’s purpose of making a positive and meaningful impact on the health, safety, and well-being of the global community. Our status as a REIT limits our ability to make such non-real estate investments. Therefore, we conduct, and will continue to conduct, our non-real estate investment activities in a manner that complies with REIT requirements.
Balance sheet and financial strategy
We seek to maximize balance sheet liquidity and flexibility, cash flows, and cash available for distribution to our stockholders through the ownership, operation, management, and selective acquisition, development, and redevelopment of office/laboratory and tech office space, as well as the management of our balance sheet. In particular, we seek to maximize balance sheet liquidity and flexibility, cash flows, and cash available for distribution to our stockholders by:
-
Maintaining access to diverse sources of capital, including operating cash flows after dividends, incremental debt, asset sales, and other capital such as the sale of equity or joint venture capital;
-
Maintaining significant liquidity through borrowing capacity under our unsecured senior line of credit and commercial paper program, marketable securities, issuances of forward equity contracts from time to time, and cash, cash equivalents, and restricted cash;
-
Continuing to improve our credit profile;
-
Minimizing the amount of near-term debt maturities in a single year;
-
Maintaining commitment to long-term capital to fund growth;
-
Maintaining low to modest leverage;
-
Minimizing variable interest rate risk;
-
Generating high-quality, strong, and increasing operating cash flows;
-
Selectively selling real estate assets, including land parcels and non-core/“core-like” operating assets, and reinvesting the proceeds into our highly leased value-creation development and redevelopment projects;
-
Allocating capital to Class A properties located in collaborative life science, technology, and agtech campuses in AAA urban innovation clusters;
-
Maintaining geographic diversity in urban intellectual centers of innovation;
-
Selectively acquiring high-quality office/laboratory and tech office space in our target urban innovation cluster submarkets at prices that enable us to realize attractive returns;
-
Selectively developing properties in our target urban innovation cluster submarkets;
-
Selectively redeveloping existing office, warehouse, or shell space, or newly acquired properties, into high-quality, generic, and reusable office/laboratory space that can be leased at higher rental rates in our target urban innovation cluster submarkets;
-
Renewing existing tenant space at higher rental rates to the extent possible;
-
Minimizing tenant improvement costs;
-
Improving investment returns through the leasing of vacant space and the replacing of existing tenants with new tenants at higher rental rates;
-
Executing leases with high-quality tenants and proactively monitoring tenant health;
-
Maintaining solid occupancy while attaining high rental rates;
-
Realizing contractual rental rate escalations; and
-
Implementing effective cost control measures, including negotiating pass-through provisions in tenant leases for operating expenses and certain capital expenditures.
Competition
In general, other office/laboratory and tech office properties are located in close proximity to our properties. The amount of rentable space available in any market could have a material effect on our ability to rent space and on the rental rates we can attain for our properties. In addition, we compete for investment opportunities with other REITs, insurance companies, pension and investment funds, private equity entities, partnerships, developers, investment companies, owners/occupants, and foreign investors. Many of these entities have substantially greater financial resources than we do and may be able to invest more than we can or accept more risk than we are willing to accept. These entities may be less sensitive to risks with respect to the creditworthiness of a tenant or the overall expected returns from real estate investments. In addition, as a result of their financial resources, our competitors may offer more free rent concessions, lower rental rates, or higher tenant improvement allowances in order to attract tenants. These leasing incentives could hinder our ability to maintain or raise rents and attract or retain tenants. Competition may also reduce the number of suitable investment opportunities available to us or may increase the bargaining power of property owners seeking to sell. Competition in acquiring existing properties and land, both from institutional capital sources and from other REITs, has been very strong over the past several years; however, we believe we have differentiated ourselves from our competitors. As the first and only publicly traded urban office REIT to focus primarily on the office/laboratory real estate niche, we provide world-class collaborative life science, technology, and agtech campuses in AAA innovation cluster locations and maintain and cultivate many of the most important and strategic relationships in the life science, technology, and agtech industries.
Financial information about our reportable segment
Refer to Note 2 – “Summary of significant accounting policies” to our consolidated financial statements under Item 15 in this annual report on Form 10-K for information about our one reportable segment.
Regulation
General
Properties in our markets are subject to various laws, ordinances, and regulations, including regulations relating to common areas. We believe we have the necessary permits and approvals to operate each of our properties.
Americans with Disabilities Act
Our properties must comply with Title III of the Americans with Disabilities Act of 1990 (“ADA”) to the extent that such properties are “public accommodations” as defined by the ADA. The ADA may require removal of structural barriers to permit access by persons with disabilities in certain public areas of our properties where such removal is readily achievable. We believe that our properties are in substantial compliance with the ADA and that we will not be required to incur substantial capital expenditures to address the requirements of the ADA. However, noncompliance with the ADA could result in the imposition of fines or an award of damages to private litigants. The obligation to make readily achievable accommodations is an ongoing one, and we will continue to assess our properties and make alterations as appropriate in this respect.
Environmental matters
Under various environmental protection laws, a current or previous owner or operator of real estate may be liable for contamination resulting from the presence or discharge of hazardous or toxic substances at that property and may be required to investigate and remediate contamination located on or emanating from that property. Such laws often impose liability without regard to whether the owner or operator knew of, or was responsible for, the presence of the contaminants, and the liability may be joint and several. Previous owners may have used some of our properties for industrial and other purposes, so those properties may contain some level of environmental contamination. The presence of contamination or the failure to remediate contamination at our properties may expose us to third-party liability or may materially adversely affect our ability to sell, lease, or develop the real estate or to borrow using the real estate as collateral.
Some of our properties may have asbestos-containing building materials. Environmental laws require that asbestos-containing building materials be properly managed and maintained and may impose fines and penalties on building owners or operators for failure to comply with these requirements. These laws may also allow third parties to seek recovery from owners or operators for personal injury associated with exposure to asbestos-containing building materials.
In addition, some of our tenants handle hazardous substances and wastes as part of their routine operations at our properties. Environmental laws and regulations subject our tenants, and potentially us, to liability resulting from such activities. Environmental liabilities could also affect a tenant’s ability to make rental payments to us. We require our tenants to comply with these environmental laws and regulations and to indemnify us against any related liabilities.
Independent environmental consultants have conducted Phase I or similar environmental site assessments on the properties in our portfolio. Site assessments are intended to discover and evaluate information regarding the environmental condition of the surveyed property and surrounding properties and do not generally include soil samplings, subsurface investigations, or an asbestos survey. To date, these assessments have not revealed any material environmental liability that we believe would have a material adverse effect on our business, assets, or results of operations. Nevertheless, it is possible that the assessments on our properties have not revealed all environmental conditions, liabilities, or compliance concerns that may have arisen after the review was completed or may arise in the future; and future laws, ordinances, or regulations may also impose additional material environmental liabilities.
Insurance
With respect to our properties, we carry commercial general liability, all-risk property, and business interruption insurance, including loss of rental income coverage. We select policy specifications and insured limits that we believe to be appropriate given the relative risk of loss and the cost of the coverage. In addition, we have obtained earthquake insurance for certain properties located in the vicinity of known active earthquake zones in an amount and with deductibles we believe are commercially reasonable. We also carry environmental insurance and title insurance policies on our properties. We generally obtain title insurance policies when we acquire the property, with each policy covering an amount equal to the initial purchase price of each property. Accordingly, any of our title insurance policies may be in an amount less than the current value of the related property. Additional information regarding risk factors that may affect us is included in “Item 1A. Risk factors” in this annual report on Form 10-K.
Available information
Copies of our annual reports on Form 10-K, quarterly reports on Form 10-Q, and current reports on Form 8-K, including any amendments to the foregoing reports, are available, free of charge, through our corporate website at www.are.com as soon as is reasonably practicable after such material is electronically filed with, or furnished to, the SEC. The current charters of our Board of Directors’ Audit, Compensation, and Nominating & Governance Committees, along with our corporate governance guidelines and Business Integrity Policy and Procedures for Reporting Non-Compliance (the “Business Integrity Policy”), are also available on our corporate website. Additionally, any amendments to, and waivers of, our Business Integrity Policy that apply to our Co-Chief Executive Officers or our Chief Financial Officer will be available free of charge on our corporate website in accordance with applicable SEC and NYSE requirements. Written requests should be sent to Alexandria Real Estate Equities, Inc., 26 North Euclid Avenue, Pasadena, California 91101, Attention: Investor Relations. The public may also download these materials from the SEC’s website at www.sec.gov.
Human Capital
As of December 31, 2020, we had 470 employees. We believe that we have good relations with our employees. We have adopted a Business Integrity Policy that applies to all of our employees, and its receipt and review by each employee is documented and verified annually. In order to promote an exceptional corporate culture, Alexandria continuously monitors employee satisfaction, seeks employee feedback, and seeks opportunities to enhance our offerings. We participate in annual performance reviews with our employees and conduct formal employee surveys, and our talent management team holds annual meetings with employees. The positive employee experience is evidenced by our low voluntary and total turnover rates (averaging 4.1% and 8.1%, respectively, over the last five years, from 2016 to 2020), which are well below the reported median voluntary and total turnover rates of 10% and 18.0%, respectively, in the Nareit 2020 Compensation & Benefits Survey (data for 2019).
We have an exceptional track record of identifying highly qualified candidates for promotion from within the Company. Alexandria’s executive and senior management team, represented by our senior vice presidents and above, consists of 47 individuals, averaging 24 years of real estate experience, including 12 years with Alexandria. Our executive management team alone averages 17 years of experience with Alexandria. Alexandria’s executive and senior management team has unique experience and expertise in creating, owning, and operating highly dynamic and collaborative campuses in key urban life science, technology, and agtech cluster locations. Alexandria’s highly experienced management team also includes regional market directors with leading reputations and longstanding relationships within the life science, technology, and agtech communities in their respective urban innovation clusters. We believe that our expertise, experience, reputation, and key relationships in the real estate, life science, technology, and agtech industries provide Alexandria with significant competitive advantages in attracting new business opportunities.
At Alexandria, people come first. At the outset of the COVID-19 pandemic, we moved swiftly to support our employees’ medical, mental, emotional, physical, and financial health. Our commitment to our people has always been our primary focus, and we continue to devote extraordinary efforts to hire, develop, and retain a healthy and diverse workforce.
Supporting our employees through COVID-19 and beyond
In response to COVID-19-related state and local government orders to stay at home, Alexandria immediately issued a $1,000 emergency bonus to each of our non-officer employees, connected employees to LiveHealth Online support, and shared comprehensive resources and tools to help our team members cope with stress, anxiety, isolation, and loss and also balance work and child care obligations. To further support our employees in prioritizing their health and well-being, the Company temporarily enhanced our existing wellness benefit. This enrichment included reimbursement of fitness and mindfulness applications, online classes, and exercise equipment to help our employees reach their individual wellness goals and stay physically and mentally strong. Additionally, Alexandria has been able to leverage our world-class network to curate a series of internal webinars featuring leading experts on COVID-19 to keep our employees informed and address some of their questions or pressing concerns.
Providing exceptional benefits to support our employees’ well-being, medical and financial health
We provide a comprehensive benefits package intended to meet and exceed the needs of our employees and their families. Our highly competitive offering helps our employees stay healthy, balance their work and personal lives, and meet their financial and retirement goals. We pay 100% of the health insurance premiums for our employees and their families and provide an employee assistance program to help them address a wide range of issues. In addition, Alexandria’s Operation CARE program provides the following services to our employees:
-
Alexandria Access. Alexandria’s unparalleled network in the life science community affords us access to deep medical expertise. Alexandria Access makes this expertise available to our employees and their immediate family members who are experiencing an illness or injury and would benefit from specialized expertise.
-
Matching Gifts.** Alexandria matches each employee’s financial contributions to, or funds raised for, eligible nonprofit organizations on a dollar-for-dollar basis, up to $2,500 per person each calendar year, to double the impact of their charitable gifts.
-
Volunteer Time Off.** Each Alexandria employee receives 16 hours (two days) per calendar year of paid volunteer time off to use at the eligible non-profit(s) of their choice.
-
Volunteer Rewards.** When an Alexandria employee volunteers more than 25 hours in any one quarter at an eligible nonprofit(s), Alexandria donates a total of $2,500 to the eligible non-profit(s) of their choice.
Investing in professional development and training
We understand that to attract and retain the best talent, we must provide opportunities for our people to grow and develop. Therefore, we invest in training and development programs to enhance our employees’ engagement, effectiveness, and well-being.
In-person and virtual training topics include project management, business writing, leadership, change management, interviewing, presentations, productivity, conversations crucial to business results, effective one-on-ones, goal setting, delegation,
flexibility, self-direction, and feedback. Our annual mentoring program allows employees to partner with senior leaders throughout the organization and receive career guidance. To customize training and development, we conduct needs assessments and design training programs for specific functional teams as well as offer a highly customized coaching program for high-potential executives, leaders, and teams. We provide access to expert panels and cutting-edge information via webinars in order to share information and support our team. We also provide on-demand learning resources such as LinkedIn Learning for employees to take classes that range from creating effective PowerPoint presentations to understanding how the brain reacts to stress.
To continuously monitor and improve employee performance and engagement, we issue satisfaction surveys and conduct annual performance reviews. Our talent management team additionally conducts formal surveys and holds regular feedback meetings with our employees.
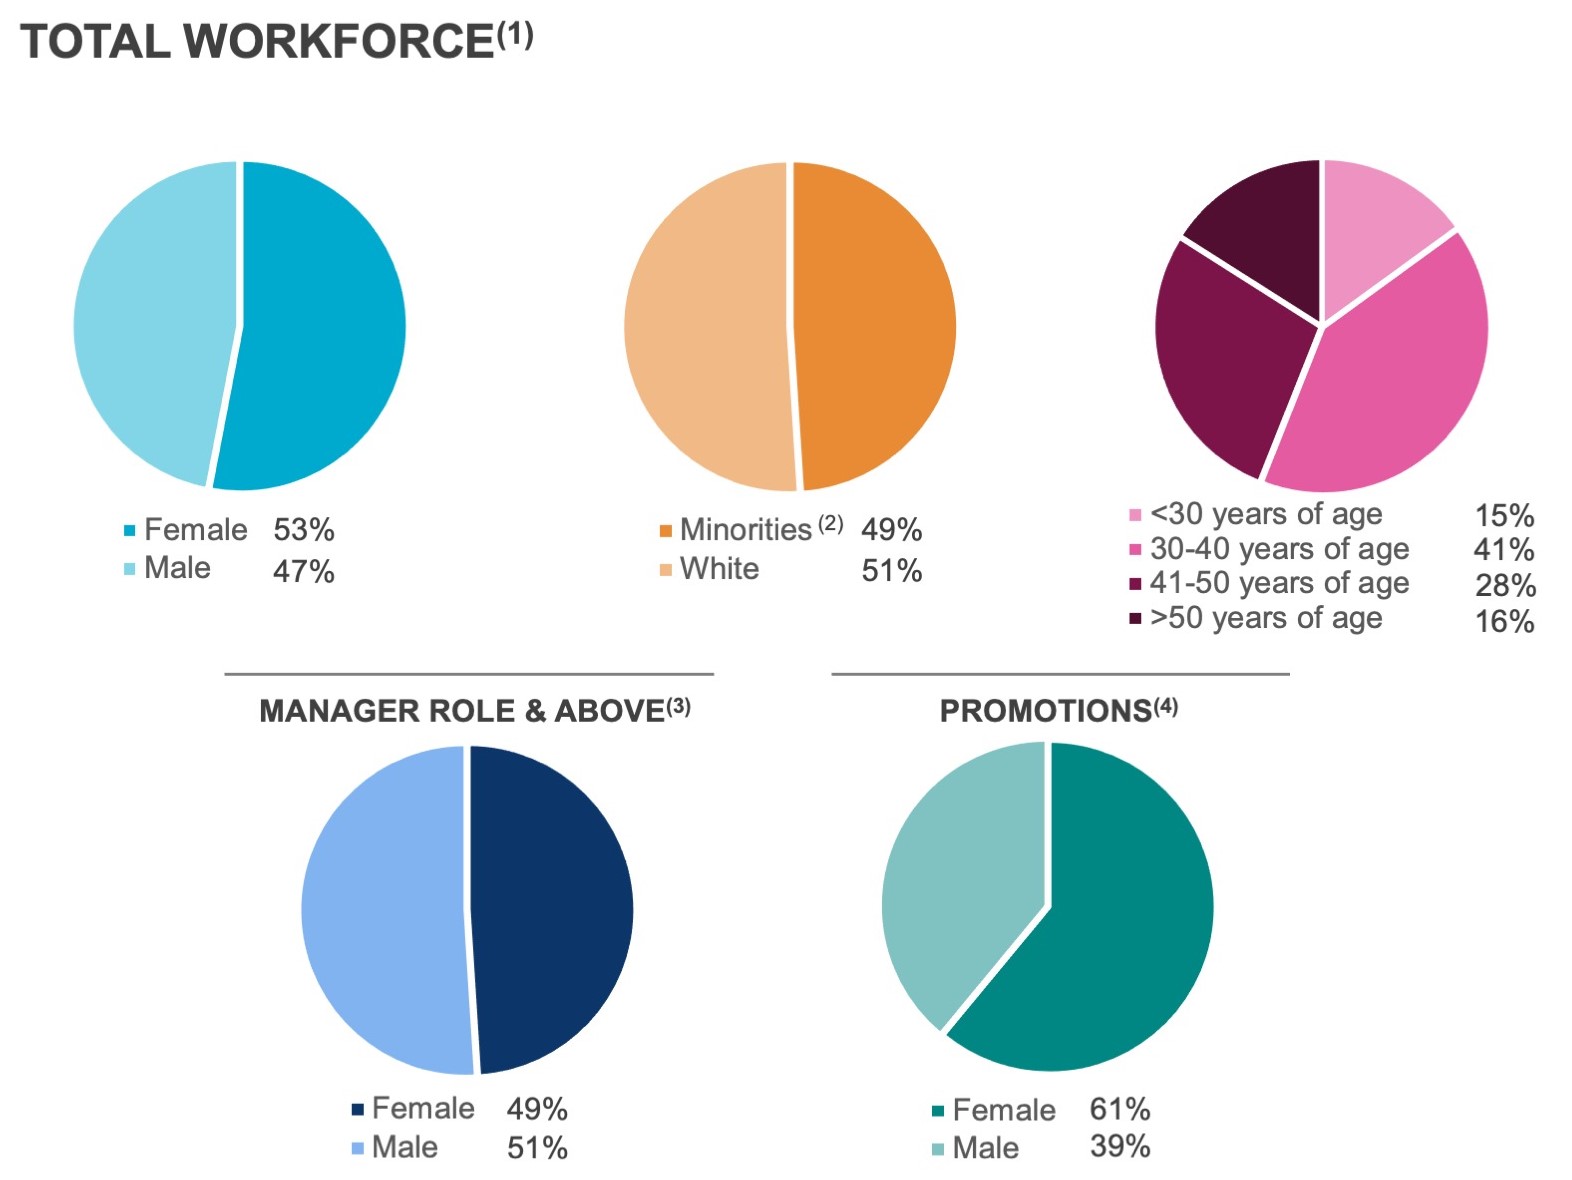
Building a diverse and inclusive workforce
We work every day to create an open and respectful environment where everyone can actively contribute, have equal access to opportunities and resources, be themselves, and realize their potential.
Our Corporate Governance Guidelines highlight the Board of Directors’ focus on diversity, which explicitly states the board’s commitment to considering qualified women and minority director candidates, as well its policy of requesting an initial list of diverse candidates of any search firm it retains. As an Equal Opportunity Employer, we emphasize inclusion through hiring and compensation practices and consider a pool of diverse candidates for open positions and internal advancement opportunities. To address issues related to pay discrimination, we do not ask potential candidates about their current or previous compensation during the hiring process, and we incorporate equal and fair pay reviews into every employment compensation decision. To reinforce our corporate culture of respect, diversity, and inclusion, each of our employees completes anti-harassment training annually.
(1)As of December 31, 2020.
(2)Minorities are defined to include individuals of Asian, Black/African American, Hispanic/Latino, Native American or Pacific Islander, or multiracial background. We determine race and gender based on our employees' self-identification or other information compiled to meet requirements of the U.S. government.
(3)Managers and above include individuals who lead others and/or oversee projects.
(4)Represents a five-year average from 2016 to 2020.
Item 1A. RISK FACTORS
Overview
The following risk factors may adversely affect our overall business, financial condition, results of operations, and cash flows; our ability to make distributions to our stockholders; our access to capital; or the market price of our common stock, as further described in each risk factor below. In addition to the information set forth in this annual report on Form 10-K, one should carefully review and consider the information contained in our other reports and periodic filings that we make with the SEC. Those risk factors could materially affect our overall business, financial condition, results of operations, and cash flows; our ability to make distributions to our stockholders; our access to capital; or the market price of our common stock. The risks that we describe in our public filings are not the only risks that we face. Additional risks and uncertainties not presently known to us, or that we currently consider immaterial, also may materially adversely affect our business, financial condition, and results of operations. Additional information regarding forward-looking statements is included in the beginning of “Part I” in this annual report on Form 10-K.
Risk factors summary
An investment in our securities involves various risks. Such risks, including those set forth in the summary of material risks in this Item 1A, should be carefully considered before purchasing our securities.
Risks related to operating factors
-
We may be unable to identify and complete acquisitions, investments, or development or redevelopment projects or to successfully and profitably operate properties.
-
We could default on our ground leases or be unable to renew or re-lease our land or space on favorable terms or at all. Our tenants may also be unable to pay us rent.
-
The cost of maintaining and improving the quality of our properties may be higher than anticipated, and we may be unable to pass any increased operating costs through to our tenants, which can result in reduced cash flows and profitability.
-
We could be held liable for environmental damages resulting from our tenants’ use of hazardous materials, or from harmful mold, poor air quality, or other defects from our properties, or we could face increased costs in complying with other environmental laws.
-
The loss of services of any of our senior officers or key employees and increased competition for skilled personnel could adversely affect us and/or increase our labor costs.
-
We rely on a limited number of vendors to provide utilities and other services at our properties, and disruption in such services may have an adverse effect on our operations and financial condition.
-
Our insurance may not adequately cover all of our potential losses, or we may incur costs due to the financial condition of our insurance carriers.
-
We may change business policies without stockholder approval.
-
Failure to maintain effective internal control over financial reporting could have a material adverse effect on our business.
-
If we failed to qualify as a REIT, we would be taxed at corporate rates and would not be able to take certain deductions when computing our taxable income.
-
We may not be able to raise sufficient capital to fund our operations due to adverse changes in our credit ratings, our inability to refinance our existing debt or issue new debt, or our inability to sell existing properties quickly.
-
We may invest or spend the net proceeds from our equity or debt offerings in ways with which our investors may not agree and in ways that may not earn a profit.
-
Our debt service obligations may restrict our ability to engage in some business activities or cause other adverse effects on our business.
-
We face risks and liabilities associated with our investments (including those in connection with short-term liquid investments) and the companies in which we invest (including properties owned through partnerships, limited liability companies, and joint ventures, as well as through our non-real estate venture investment portfolio), which expose us to risks similar to those of our tenant base and additional risks inherent in venture capital investing. We may be limited in our ability to diversify our investments.
Risks related to market and industry factors
-
There are limits on ownership of our stock under which a stockholder may lose beneficial ownership of its shares, as well as certain provisions of our charter and bylaws that may delay or prevent transactions that otherwise may be desirable to our stockholders.
-
Possible future sales of shares of our common stock could adversely affect its market price.
-
We are dependent on the health of the life science, technology, and agtech industries, and changes within these industries, increased competition, or the inability of our tenants and non-real estate equity investments within these industries to obtain funding for research, development, and other operations may adversely impact their ability to make rental payments to us or adversely impact their value.
-
Market disruption and volatility, poor economic conditions in the capital markets and global economy, including in connection with the COVID-19 pandemic, and high unemployment levels could adversely affect the value of the companies in which we hold equity investments or the ability of tenants and the companies in which we invest to raise additional capital or access capital from venture capital investors or financial institutions on favorable terms.
Risks related to government and global factors
-
Actions, policy, or key leadership changes in government agencies, or changes to laws or regulations, including those related to tax, accounting, debt, derivatives, government spending, or funding (including those related to the FDA, the National Institutes of Health (the “NIH”), the SEC, and other agencies), and drug and healthcare pricing, costs, and programs could have a significant negative impact on the overall economy, our tenants, and our business.
-
Partial or complete government shutdown resulting in temporary closures of agencies could adversely affect our tenants (some of which are also government agencies) and the companies in which we invest, including delays in the commercialization of such companies’ products, decreased funding of research and development, or delays surrounding approval of budget proposals.
-
The replacement of LIBOR with an alternative reference rate may adversely affect interest expense related to outstanding debt.
-
The current outbreak of COVID-19, or the future outbreak of any other highly infectious or contagious diseases, could adversely impact or cause disruption to our financial condition and results of operations, and/or to the financial condition and results of operations of our tenants and non-real estate investments.
Risks related to general and other factors
-
Social, political, and economic instability, unrest, significant changes, and other circumstances beyond our control, including circumstances related to changes in the U.S. presidential administration, could adversely affect our business operations.
-
Seasonal weather conditions, climate change and severe weather, changes in the availability of transportation or labor, especially in connection with the COVID-19 pandemic, and other related factors may affect our ability to conduct business, the products, and services of our tenants, or the availability of such products and services of our tenants and the companies in which we invest.
-
We may be unable to meet our sustainability goals.
-
System failures or security incidents through cyber attacks, intrusions, or other methods could disrupt our information technology networks and related systems, cause a loss of assets or data, give rise to remediation or other expenses, expose us to liability under federal and state laws, and subject us to litigation and investigations, which could result in substantial reputatio
Showing the first 8K of 230K characters. Open the full section
Item 1B. UNRESOLVED STAFF COMMENTS
None.
Item 2. PROPERTIES
General
As of December 31, 2020, we had 338 properties in North America containing approximately 35.2 million RSF of operating properties and development and redevelopment of new Class A properties (under construction), including 40 properties that are held by consolidated real estate joint ventures and six properties that are held by unconsolidated real estate joint ventures. Refer to the definitions of “Annual rental revenue” and “Operating statistics” in the “Non-GAAP measures and definitions” section under “Item 7. Management’s discussion and analysis of financial condition and results of operations” in this annual report on Form 10-K for a description of the basis used to compute the aforementioned measures. The occupancy percentage of our operating properties in North America was 94.6% as of December 31, 2020. The exteriors of our properties typically resemble traditional office properties, but the interior infrastructures are designed to accommodate the needs of life science, technology, and agtech tenants. These improvements typically are generic rather than specific to a particular tenant. As a result, we believe that the improvements have long-term value and utility and are usable by a wide range of tenants. Improvements to our properties typically include:
-
Reinforced concrete floors;
-
Upgraded roof loading capacity;
-
Increased floor-to-ceiling heights;
-
Heavy-duty HVAC systems;
-
Enhanced environmental control technology;
-
Significantly upgraded electrical, gas, and plumbing infrastructure; and
-
Laboratory benches.
As of December 31, 2020, we held a fee simple interest in each of our properties, with the exception of 36 properties in North America that accounted for approximately 11% of our total number of properties. Of these 36 properties, we held 16 properties in the Greater Boston market, 13 properties in the San Francisco market, two properties in the New York City market, two properties in the Seattle market, one property in the Maryland market, and two properties in the Research Triangle market pursuant to ground leasehold interests. During the year ended December 31, 2020, our ground lease rental expense aggregated 1.4% as a percentage of net operating income. Refer to further discussion in our consolidated financial statements and notes thereto in “Item 15. Exhibits and financial statement schedules” in this annual report on Form 10-K.
As of December 31, 2020, we had 909 leases with a total of 670 tenants, and 167, or 49%, of our 338 properties were single-tenant properties. Leases in our multi-tenant buildings typically have initial terms of four to 11 years, while leases in our single-tenant buildings typically have initial terms of 11 to 21 years. As of December 31, 2020:
-
Investment-grade or publicly traded large cap tenants represented 55% of our total annual rental revenue;
-
Approximately 94% of our leases (on an RSF basis) contained effective annual rent escalations that were either fixed (generally ranging from approximately 3.0% to 3.5%) or indexed based on a consumer price index or other index;
-
Approximately 94% of our leases (on an RSF basis) were triple net leases, which require tenants to pay substantially all real estate taxes, insurance, utilities, repairs and maintenance, common area expenses, and other operating expenses (including increases thereto) in addition to base rent; and
-
Approximately 93% of our leases (on an RSF basis) provided for the recapture of capital expenditures (such as HVAC maintenance and/or replacement, roof replacement, and parking lot resurfacing) that we believe would typically be borne by the landlord in traditional office leases.
Our leases also typically give us the right to review and approve tenant alterations to the property. Generally, tenant-installed improvements to the properties are reusable generic improvements and remain our property after termination of the lease at our election. However, we are permitted under the terms of most of our leases to require that the tenant, at its expense, remove certain non-generic improvements and restore the premises to their original condition.
Locations of properties
The locations of our properties are diversified among a number of life science, technology, and agtech cluster markets. The following table sets forth the total RSF, number of properties, and annual rental revenue in effect as of December 31, 2020, in each of our markets in North America (dollars in thousands, except per RSF amounts):
| RSF | Number of Properties | Annual Rental Revenue | ||||||||||||||||||||||||||||||||||||||||||||||||||||||
| Market | Operating | Development | Redevelopment | Total | % of Total | Total | % of Total | Per RSF | ||||||||||||||||||||||||||||||||||||||||||||||||
| Greater Boston | 8,454,396 | — | 296,489 | 8,750,885 | 25 | % | 72 | $ | 507,459 | 36 | % | $ | 61.20 | |||||||||||||||||||||||||||||||||||||||||||
| San Francisco | 7,495,390 | 744,715 | 92,147 | 8,332,252 | 24 | 61 | 362,262 | 25 | 57.87 | |||||||||||||||||||||||||||||||||||||||||||||||
| New York City | 1,145,296 | — | 122,382 | 1,267,678 | 3 | 5 | 81,185 | 6 | 73.68 | |||||||||||||||||||||||||||||||||||||||||||||||
| San Diego | 6,367,526 | 146,456 | 79,945 | 6,593,927 | 19 | 80 | 233,128 | 16 | 39.14 | |||||||||||||||||||||||||||||||||||||||||||||||
| Seattle | 1,747,332 | 100,086 | 213,976 | 2,061,394 | 6 | 22 | 81,477 | 6 | 48.59 | |||||||||||||||||||||||||||||||||||||||||||||||
| Maryland | 2,821,574 | 261,096 | 169,420 | 3,252,090 | 9 | 44 | 80,429 | 6 | 29.97 | |||||||||||||||||||||||||||||||||||||||||||||||
| Research Triangle | 2,810,670 | 410,000 | 652,381 | 3,873,051 | 11 | 35 | 61,354 | 4 | 24.38 | |||||||||||||||||||||||||||||||||||||||||||||||
| Canada | 256,967 | — | — | 256,967 | 1 | 3 | 4,870 | — | 23.16 | |||||||||||||||||||||||||||||||||||||||||||||||
| Non-cluster/other markets | 549,479 | — | — | 549,479 | 1 | 12 | 10,608 | 1 | 36.64 | |||||||||||||||||||||||||||||||||||||||||||||||
| Properties held for sale | 225,849 | — | — | 225,849 | 1 | 4 | 6,257 | — | N/A | |||||||||||||||||||||||||||||||||||||||||||||||
| North America | 31,874,479 | 1,662,353 | 1,626,740 | 35,163,572 | 100 | % | 338 |
Showing the first 8K of 180K characters. Open the full section
Item 3. LEGAL PROCEEDINGS
To our knowledge, no legal proceedings are pending against us, other than routine actions and administrative proceedings, and other actions not deemed material, substantially all of which are expected to be covered by liability insurance and which, in the aggregate, are not expected to have a material adverse effect on our financial condition, results of operations, or cash flows.
Item 4. MINE SAFETY DISCLOSURES
Not applicable.
PART II
Item 5. MARKET FOR REGISTRANT’S COMMON EQUITY, RELATED STOCKHOLDER MATTERS, AND ISSUER PURCHASES OF EQUITY SECURITIES
Our common stock is traded on the NYSE under the symbol “ARE.” On January 15, 2021, the last reported sales price per share of our common stock was $168.37, and there were 597 holders of record of our common stock (excluding beneficial owners whose shares are held in the name of Cede & Co.).
To maintain our qualification as a REIT, we must make annual distributions to stockholders of at least 90% of our taxable income for the current taxable year, determined without regard to deductions for dividends paid and excluding any net capital gains. Under certain circumstances, we may be required to make distributions in excess of cash flows available for distributions to meet these distribution requirements. In such a case, we may borrow funds or may raise funds through the issuance of additional debt or equity capital. No dividends can be paid on our common stock unless we have paid full cumulative dividends on our preferred stock. From the date of issuance of our preferred stock through December 31, 2020, we have paid full cumulative dividends on our preferred stock. As of December 31, 2020, we had no outstanding shares of preferred stock. Future distributions on our common stock will be determined by, and made at the discretion of, our Board of Directors and will depend on a number of factors, including actual cash available for distribution to our stockholders, our financial condition and capital requirements, the annual distribution requirements under the REIT provisions of the Internal Revenue Code, restrictions under Maryland law, and such other factors as our Board of Directors deems relevant. We cannot assure our stockholders that we will make any future distributions.
Refer to “Item 12. Security ownership of certain beneficial owners and management and related stockholder matters” in this annual report on Form 10-K for information on securities authorized for issuance under equity compensation plans.
ITEM 6. SELECTED FINANCIAL DATA
The following table should be read in conjunction with our consolidated financial statements and notes thereto appearing elsewhere in this annual report on Form 10-K. Refer to “Item 15. Exhibits and financial statement schedules.”
| Year Ended December 31, | ||||||||||||||||||||||||||||||||
| (In thousands, except per share amounts) | 2020 | 2019 | 2018 | 2017 | 2016 | |||||||||||||||||||||||||||
| Operating Data: | ||||||||||||||||||||||||||||||||
| Revenues: | ||||||||||||||||||||||||||||||||
| Income from rentals | $ | 1,878,208 | $ | 1,516,864 | $ | 1,314,781 | $ | 1,122,325 | $ | 897,475 | ||||||||||||||||||||||
| Other income | 7,429 | 14,432 | 12,678 | 5,772 | 24,231 | |||||||||||||||||||||||||||
| Total revenues | 1,885,637 | 1,531,296 | 1,327,459 | 1,128,097 | 921,706 | |||||||||||||||||||||||||||
| Expenses: | ||||||||||||||||||||||||||||||||
| Rental operations | 530,224 | 445,492 | 381,120 | 325,609 | 278,408 | |||||||||||||||||||||||||||
| General and administrative | 133,341 | 108,823 | 90,405 | 75,009 | 63,884 | |||||||||||||||||||||||||||
| Interest | 171,609 | 173,675 | 157,495 | 128,645 | 106,953 | |||||||||||||||||||||||||||
| Depreciation and amortization | 698,104 | 544,612 | 477,661 | 416,783 | 313,390 | |||||||||||||||||||||||||||
| Impairment of real estate | 48,078 | 12,334 | 6,311 | 203 | 209,261 | |||||||||||||||||||||||||||
| Loss on early extinguishment of debt | 60,668 | 47,570 | 1,122 | 3,451 | 3,230 | |||||||||||||||||||||||||||
| Total expenses | 1,642,024 | 1,332,506 | 1,114,114 | 949,700 | 975,126 | |||||||||||||||||||||||||||
| Equity in earnings (losses) of unconsolidated real estate JVs | 8,148 | 10,136 | 43,981 | 15,426 | (184) | |||||||||||||||||||||||||||
| Investment income | 421,321 | 194,647 | 136,763 | — | — | |||||||||||||||||||||||||||
| Gain on sales of real estate – rental properties | 154,089 | 474 | 8,704 | 270 | 3,715 | |||||||||||||||||||||||||||
| Gain on sales of real estate – land parcels | — | — | — | 111 | 90 | |||||||||||||||||||||||||||
| Net income (loss) | 827,171 | 404,047 | 402,793 | 194,204 | (49,799) | |||||||||||||||||||||||||||
| Net income attributable to noncontrolling interests | (56,212) | (40,882) | (23,481) | (25,111) | (16,102) | |||||||||||||||||||||||||||
| Net income (loss) attributable to Alexandria Real Estate Equities, Inc.’s stockholders | 770,959 | 363,165 | 379,312 | 169,093 | (65,901) | |||||||||||||||||||||||||||
| Dividends on preferred stock | — | (3,204) | (5,060) | (7,666) | (20,223) | |||||||||||||||||||||||||||
| Preferred stock redemption charge | — | (2,580) | (4,240) | (11,279) | (61,267) | |||||||||||||||||||||||||||
| Net income attributable to unvested restricted stock awards | (10,168) | (6,386) | (6,029) | (4,753) | (3,750) | |||||||||||||||||||||||||||
| Net income (loss) attributable to Alexandria Real Estate Equities, Inc.’s common stockholders | $ | 760,791 | $ | 350,995 | $ | 363,983 | $ | 145,395 | $ | (151,141) | ||||||||||||||||||||||
| Net income (loss) per share attributable to Alexandria Real Estate Equities, Inc.'s common stockholders: | ||||||||||||||||||||||||||||||||
| Basic | $ | 6.03 | $ | 3.13 | $ | 3.53 | $ | 1.59 | $ | (1.99) | ||||||||||||||||||||||
| Diluted | $ | 6.01 | $ | 3.12 | $ | 3.52 | $ | 1.58 | $ | (1.99) | ||||||||||||||||||||||
| Weighted-average shares of common stock outstanding – basic | 126,106 | 112,204 | 103,010 | 91,546 | 76,103 | |||||||||||||||||||||||||||
| Weighted-average shares of common stock outstanding – diluted | 126,490 | 112,524 | 103,321 | 92,063 | 76,103 | |||||||||||||||||||||||||||
| Dividends declared per share of common stock | $ | 4.24 | $ | 4.00 | $ | 3.73 | $ | 3.45 | $ | 3.23 |
| Balance Sheet Data (at year end): | ||||||||||||||||||||||||||||||||
| Investments in real estate | $ | 18,092,372 | $ | 14,844,038 | $ | 11,913,693 | $ | 10,298,019 | $ | 9,077,972 | ||||||||||||||||||||||
| Total assets | $ | 22,827,878 | $ | 18,390,503 | $ | 14,464,956 | $ | 12,103,953 | $ | 10,354,888 | ||||||||||||||||||||||
| Total debt | $ | 7,563,286 | $ | 6,777,479 | $ | 5,478,255 | $ | 4,764,807 | $ | 4,164,025 | ||||||||||||||||||||||
| Total liabilities | $ | 9,384,100 | $ | 8,224,025 | $ | 6,570,242 | $ | 5,620,784 | $ | 4,972,610 | ||||||||||||||||||||||
| Redeemable noncontrolling interests | $ | 11,342 | $ | 12,300 | $ | 10,786 | $ | 11,509 | $ | 11,307 | ||||||||||||||||||||||
| Total equity | $ | 13,432,436 | $ | 10,154,178 | $ | 7,883,928 | $ | 6,471,660 | $ | 5,370,971 |
Item 6. SELECTED FINANCIAL DATA (CONTINUED)
| Year Ended December 31, | ||||||||||||||||||||||||||||||||
| (Dollars in thousands, except per occupied RSF amounts) | 2020 | 2019 | 2018 | 2017 | 2016 | |||||||||||||||||||||||||||
| Other Data: | ||||||||||||||||||||||||||||||||
| Net cash provided by operating activities | $ | 882,510 | $ | 683,857 | $ | 570,339 | $ | 450,882 | $ | 393,487 | ||||||||||||||||||||||
| Net cash used in investing activities | $ | 3,278,161 | $ | 3,641,320 | $ | 2,161,760 | $ | 1,737,126 | $ | 1,498,406 | ||||||||||||||||||||||
| Net cash provided by financing activities | $ | 2,750,356 | $ | 2,927,482 | $ | 1,588,433 | $ | 1,420,341 | $ | 1,093,775 | ||||||||||||||||||||||
| Number of properties – North America | 338 | 291 | 237 | 213 | 199 | |||||||||||||||||||||||||||
| RSF – North America (including development and redevelopment projects under construction) | 35,163,572 | 29,098,433 | 24,587,438 | 21,981,133 | 19,869,729 | |||||||||||||||||||||||||||
| Occupancy of operating properties – North America | 94.6% | 96.8% | 97.3% | 96.8% | 96.6% | |||||||||||||||||||||||||||
| Occupancy of operating and redevelopment properties – North America | 90.0% | 94.4% | 95.1% | 94.7% | 95.7% | |||||||||||||||||||||||||||
| Annual rental revenue per occupied RSF – North America | $ | 49.08 | $ | 51.04 | $ | 48.42 | $ | 48.01 | $ | 45.15 | ||||||||||||||||||||||
| Reconciliation of net income (loss) attributable to Alexandria's common stockholders to funds from operations attributable to Alexandria's common stockholders – diluted: | ||||||||||||||||||||||||||||||||
| Net income (loss) attributable to Alexandria Real Estate Equities, Inc.’s common stockholders | $ | 760,791 | $ | 350,995 | $ | 363,983 | $ | 145,395 | $ | (151,141) | ||||||||||||||||||||||
| Depreciation and amortization of real estate assets | 684,682 | 541,855 | 477,661 | 416,783 | 313,390 | |||||||||||||||||||||||||||
| Noncontrolling share of depreciation and amortization from consolidated real estate JVs | (61,933) | (30,960) | (16,077) | (14,762) | (9,349) | |||||||||||||||||||||||||||
| Our share of depreciation and amortization from unconsolidated real estate JVs(1) | 11,413 | 6,366 | 3,181 | 1,551 | 2,707 | |||||||||||||||||||||||||||
| Gain on sales of real estate – rental properties | (154,089) | (474) | (8,704) | (270) | (3,715) | |||||||||||||||||||||||||||
| Our share of gain on sales of real estate from unconsolidated real estate JVs(1) | — | — | (35,678) | (14,106) | — | |||||||||||||||||||||||||||
| Gain on sales of real estate – land parcels | — | — | — | (111) | (90) | |||||||||||||||||||||||||||
| Impairment of real estate – rental properties | 40,501 | (3) | 12,334 | — | 203 | 98,194 | ||||||||||||||||||||||||||
| Assumed conversion of 7.00% Series D cumulative convertible preferred stock(2) | — | 3,204 | 5,060 | — | — | |||||||||||||||||||||||||||
| Allocation to unvested restricted stock awards | (7,018) | (5,904) | (5,961) | (2,920) | — | |||||||||||||||||||||||||||
| Funds from operations attributable to Alexandria’s common stockholders – diluted(4) | 1,274,347 | 877,416 | 783,465 | 531,763 | 249,996 | |||||||||||||||||||||||||||
| Unrealized gains on non-real estate investments | (374,033) | (161,489) | (99,634) | — | — | |||||||||||||||||||||||||||
| Realized gains on non-real estate investments | — | — | (14,680) | — | (4,361) | |||||||||||||||||||||||||||
| Impairment of real estate | 15,221 | — | 6,311 | — | 110,474 | |||||||||||||||||||||||||||
| Impairment of non-real estate investments | 24,482 | 17,124 | 5,483 | 8,296 | 3,065 | |||||||||||||||||||||||||||
| Loss on early extinguishment of debt | 60,668 | 47,570 | 1,122 | 3,451 | 3,230 | |||||||||||||||||||||||||||
| Loss on early termination of interest rate hedge agreements | — | 1,702 | — | — | — | |||||||||||||||||||||||||||
| Termination fee | (86,179) | — | — | — | — | |||||||||||||||||||||||||||
| Acceleration of stock compensation expense due to executive officer resignation | 4,499 | — | — | — | — | |||||||||||||||||||||||||||
| Our share of gain on early extinguishment of debt from unconsolidated real estate JVs(1) | — | — | (761) | — | — | |||||||||||||||||||||||||||
| Preferred stock redemption charge | — | 2,580 | 4,240 | 11,279 | 61,267 | |||||||||||||||||||||||||||
| Removal of assumed conversion of 7.00% Series D cumulative convertible preferred stock(2) | — | (3,204) | (5,060) | — | — | |||||||||||||||||||||||||||
| Allocation to unvested restricted stock awards | 4,790 | 1,307 | 1,517 | (321) | (2,356) | |||||||||||||||||||||||||||
| Funds from operations attributable to Alexandria’s common stockholders – diluted, as adjusted(4) | $ | 923,795 | $ | 783,006 | $ | 682,003 | $ | 554,468 | $ | 421,315 |
(1)Classified in equity in earnings from unconsolidated real estate joint ventures in our consolidated statements of operations under Item 15 in this annual report on Form 10-K.
(2)Refer to “Weighted-average shares of common stock outstanding – diluted” in the “Non-GAAP measures and definitions” section under Item 7 in this annual report on Form 10-K for additional information.
(3)Includes a $7.6 million impairment of our investment in a recently developed retail property held by our unconsolidated real estate joint venture recognized during the three months ended March 31, 2020. This impairment is classified in equity in earnings of unconsolidated real estate joint ventures within our consolidated statements of operations.
(4)Refer to “Funds from operations and funds from operations, as adjusted, attributable to Alexandria Real Estate Equities, Inc.’s common stockholders” in the “Non-GAAP measures and definitions” section under Item 7 in this annual report on Form 10-K.
Item 7. MANAGEMENT’S DISCUSSION AND ANALYSIS OF FINANCIAL CONDITION AND RESULTS OF OPERATIONS
The following discussion should be read in conjunction with our consolidated financial statements and notes thereto under “Item 15. Exhibits and financial statement schedules” in this annual report on Form 10-K. Forward-looking statements involve inherent risks and uncertainties regarding events, conditions, and financial trends that may affect our future plans of operations, business strategy, results of operations, and financial position. A number of important factors could cause actual results to differ materially from those included within or contemplated by such forward-looking statements, including, but not limited to, those described under “Item 7. Management’s discussion and analysis of financial condition and results of operations” in this annual report on Form 10-K. We do not undertake any responsibility to update any of these factors or to announce publicly any revisions to any of the forward-looking statements contained in this or any other document, whether as a result of new information, future events, or otherwise.
As used in this annual report on Form 10-K, references to the “Company,” “Alexandria,” “we,” “us,” and “our” refer to Alexandria Real Estate Equities, Inc. and its consolidated subsidiaries.
The COVID-19 pandemic
In December 2019, a novel coronavirus, which causes respiratory illness and spreads from person to person (COVID-19), was first identified during an investigation into an outbreak in Wuhan, China. The first case of COVID-19 in the U.S. was reported on January 20, 2020. On March 11, 2020, the World Health Organization declared COVID-19 a pandemic, and on March 13, 2020, the U.S. declared a national emergency with respect to COVID-19. As of January 29, 2021, according to the World Health Organization, over 101.0 million novel coronavirus cases have been reported worldwide. The U.S. has reported more than 25.3 million cases of COVID-19 and over 425,670 deaths as of January 29, 2021.
COVID-19 disease, treatment, and measures to combat the pandemic
Most patients with COVID-19 have had mild to severe respiratory illness with symptoms of fever, chills, cough, shortness of breath, fatigue, and loss of taste. Many individuals with COVID-19 are asymptomatic and show limited to no symptoms, highlighting the ongoing challenge of containing the continued spread of COVID-19. Some patients develop pneumonia in both lungs and/or multi-organ failure, which in some cases leads to death. Since scientists shared the virus’s genetic makeup in January 2020, intense research has been underway around the world to develop treatments and vaccines for COVID-19. This has led to the FDA issuing Emergency Use Authorizations (“EUA”s) for therapeutics to treat patients with COVID-19 and, most recently, approving two vaccines for use in the prevention of coronavirus disease caused by COVID-19.
The two approved vaccines were created by Pfizer Inc. (in partnership with BioNTech) and Moderna, Inc. (in partnership with the National Institutes of Health), each a tenant of ours. The U.S. began a large-scale COVID-19 vaccination campaign in December 2020. As of January 29, 2021, according to the U.S. Centers for Disease Control and Prevention, over 4.7 million individuals in the U.S. have been fully vaccinated for COVID-19, and the U.S. will continue to roll out vaccines across the nation, prioritizing frontline and essential workers, the elderly, and individuals considered high risk.
Although the U.S. FDA has approved two vaccines and certain therapies for use as of the date of this report, the initial rollout of vaccine distribution has encountered significant delays, and uncertainties remain as to the amount of vaccine available for distribution, the logistics of implementing a national vaccine program, and the overall efficacy of the vaccines once widely administered, especially as new strains of COVID-19 have been discovered, and the level of resistance these new strains have to the existing vaccines, if any, remains unknown.
In response to the supply and distribution issues surrounding the vaccine, in January 2021, President Biden outlined a plan to create additional vaccination sites, increase the supply and distribution of vaccines, and increase the number of vaccinations administered to Americans. The Biden administration plans to utilize the Defense Production Act to maximize the manufacturing and distribution of vaccines in order to administer 100 million vaccination shots within the first 100 days of holding office.
In addition to the currently approved vaccines, as of January 29, 2021, there are over 60 other potential vaccines in clinical development that may contribute to increasing the supply of vaccines in 2021. The current vaccines in development use a myriad of different scientific approaches to attempt to provoke an immune response, including:
-
Genetic vaccines that use part of the coronavirus’s genetic code;
-
Viral vector vaccines that use a virus to deliver coronavirus genes into cells;
-
Protein-based vaccines that use a coronavirus protein or protein fragment to stimulate the immune system; and
-
Whole-virus vaccines that use a weakened or inactivated version of the coronavirus.
Over 60 potential vaccines are currently in human clinical trials, with nearly a third of these in later stages of clinical development. Phase I trials typically include a small number of participants to test safety and dosage as well as to confirm that the vaccine stimulates the immune system. Phase II trials involve hundreds of participants split into groups, such as children and the elderly, to determine whether the vaccine acts differently in each subpopulation. Phase III trials involve delivering the vaccine to tens of thousands of people, observing how many subsequently become infected, and determining the severity of symptoms when compared with volunteer subjects who received a placebo. Regulators in each country will review the trial results to make a determination as to
whether the drug or vaccine should be approved. As of January 29, 2021, there were 20 potential vaccines in Phase III trials, including a number that require only a single dose, rather than two doses for the currently approved vaccines and that are potentially easier to distribute.
Shelter-in-place and stay-at-home orders
On March 19, 2020, California became the first state to set mandatory stay-at-home restrictions to help combat the spread of the coronavirus. The order included the shutdown of all nonessential services, such as dine-in restaurants, bars, gyms, conference or convention centers, and other businesses not deemed to support critical infrastructure. Exceptions for essential services, such as grocery stores, pharmacies, gas stations, food banks, convenience stores, and delivery restaurants, have allowed these services to remain open. Subsequently, almost all states issued similar orders, including New York, Massachusetts, Washington, Maryland, and North Carolina, where our remaining properties outside California are located. Countries around the world also implemented measures to slow the spread of the coronavirus, from national quarantines to school closures or similar types of stay-at-home orders or movement limitations.
Most state orders expired or were rescinded between May and early June 2020, and authorities began reopening businesses, including retail stores, restaurants, bars, salons, houses of worship, entertainment venues such as movie theaters and museums, and manufacturing facilities and offices. Daily new COVID-19 cases in the U.S., which had declined to approximately 18,000 new daily cases by June 9, 2020, from the low- to mid-30,000 daily range in April 2020, began to surge, leading to additional restrictions in many parts of the country. Additionally, in recent months, new COVID-19 variants were discovered in the U.K, among other countries, which have spread globally, including the U.S. While these strains do not appear to cause
Showing the first 8K of 257K characters. Open the full section
Item 7A. QUANTITATIVE AND QUALITATIVE DISCLOSURES ABOUT MARKET RISK
Interest rate risk
The primary market risk to which we believe we may be exposed is interest rate risk, which may result from many factors, including government monetary and tax policies, domestic and international economic and political considerations, and other factors that are beyond our control.
In order to modify and manage the interest rate characteristics of our outstanding debt and to limit the effects of interest rate risks on our operations, we may utilize a variety of financial instruments, including interest rate hedge agreements, caps, floors, and other interest rate exchange contracts. The use of these types of instruments to hedge a portion of our exposure to changes in interest rates may carry additional risks, such as counterparty credit risk and the legal enforceability of hedge agreements. As of December 31, 2020, we did not have any outstanding interest rate hedge agreements.
Our future earnings and fair values relating to our outstanding debt are primarily dependent upon prevalent market rates of interest. The following table illustrates the effect of a 1% change in interest rates, assuming an interest rate floor of 0%, on our fixed- and variable-rate debt as of December 31, 2020 and 2019 (in thousands):
| December 31, | |||||||||||
| 2020 | 2019 | ||||||||||
| Annualized effect on future earnings due to variable-rate debt: | |||||||||||
| Rate increase of 1% | $ | (407) | $ | (3,600) | |||||||
| Rate decrease of 1% | $ | 89 | $ | 3,600 | |||||||
| Effect on fair value of total consolidated debt: | |||||||||||
| Rate increase of 1% | $ | (700,861) | $ | (527,768) | |||||||
| Rate decrease of 1% | $ | 795,966 | $ | 605,862 |
These amounts are determined by considering the effect of the hypothetical interest rates on our borrowings as of December 31, 2020 and 2019, respectively. These analyses do not consider the effects of the reduced level of overall economic activity that could exist in such an environment. Furthermore, in the event of a change of such magnitude, we would consider taking actions to further mitigate our exposure to the change. Because of the uncertainty of the specific actions that would be taken and their possible effects, the sensitivity analyses assume no changes in our capital structure.
Equity price risk
We have exposure to equity price market risk because of our equity investments in publicly traded companies and privately held entities. All of our investments in actively traded public companies are reflected in the consolidated balance sheets at fair value. Our investments in privately held entities that report NAV per share are measured at fair value using NAV as a practical expedient to fair value. Our equity investments in privately held entities that do not report NAV per share are measured at cost less impairments, adjusted for observable price changes during the period. Changes in fair value of public investments, changes in NAV per share reported by privately held entities, and observable price changes of privately held entities that do not report NAV per share are classified as investment income in our consolidated statements of operations. There is no assurance that future declines in value will not have a material adverse effect on our future results of operations. The following table illustrates the effect that a 10% change in the value of our equity investments would have on earnings as of December 31, 2020 and 2019 (in thousands):
| December 31, | |||||||||||
| 2020 | 2019 | ||||||||||
| Equity price risk: | |||||||||||
| Fair value increase of 10% | $ | 161,111 | $ | 114,059 | |||||||
| Fair value decrease of 10% | $ | (161,111) | $ | (114,059) |
Foreign currency exchange rate risk
We have exposure to foreign currency exchange rate risk related to our subsidiaries operating in Canada and Asia. The functional currencies of our foreign subsidiaries are the local currencies in each respective country. Gains or losses resulting from the translation of our foreign subsidiaries’ balance sheets and statements of operations are classified in accumulated other comprehensive income (loss) as a separate component of total equity and are excluded from net income (loss). Gains or losses will be reflected in our consolidated statements of operations when there is a sale or partial sale of our investment in these operations or upon a complete or substantially complete liquidation of the investment. The following table illustrates the effect that a 10% change in foreign currency rates relative to the U.S. dollar would have on our potential future earnings and on the fair value of our net investment in foreign subsidiaries based on our current operating assets outside the U.S. as of December 31, 2020 and 2019 (in thousands):
| December 31, | |||||||||||
| 2020 | 2019 | ||||||||||
| Effect on potential future earnings due to foreign currency exchange rate: | |||||||||||
| Rate increase of 10% | $ | 118 | $ | 107 | |||||||
| Rate decrease of 10% | $ | (118) | $ | (107) | |||||||
| Effect on the fair value of net investment in foreign subsidiaries due to foreign currency exchange rate: | |||||||||||
| Rate increase of 10% | $ | 9,740 | $ | 10,120 | |||||||
| Rate decrease of 10% | $ | (9,740) | $ | (10,120) |
This sensitivity analysis assumes a parallel shift of all foreign currency exchange rates with respect to the U.S. dollar; however, foreign currency exchange rates do not typically move in such a manner, and actual results may differ materially.
Our exposure to market risk elements for the year ended December 31, 2020, was consistent with the risk elements presented above, including the effects of changes in interest rates, equity prices, and foreign currency exchange rates.
Item 8. FINANCIAL STATEMENTS AND SUPPLEMENTARY DATA
The information required by this Item is included as a separate section in this annual report on Form 10-K. Refer to “Item 15. Exhibits and Financial Statement Schedules.”
Item 9. CHANGES IN AND DISAGREEMENTS WITH ACCOUNTANTS ON ACCOUNTING AND FINANCIAL DISCLOSURE
None.
Item 9A. CONTROLS AND PROCEDURES
Evaluation of disclosure controls and procedures
As of December 31, 2020, we had performed an evaluation, under the supervision of our Co-Chief Executive Officers (“Co-CEOs”) and our Chief Financial Officer (“CFO”), of the effectiveness of the design and operation of our disclosure controls and procedures. These controls and procedures have been designed to ensure that information required for disclosure is recorded, processed, summarized, and reported within the requisite time periods. Based on our evaluation, the Co-CEOs and the CFO concluded that our disclosure controls and procedures were effective as of December 31, 2020.
Changes in internal control over financial reporting
There has not been any change in our internal control over financial reporting during the three months ended December 31, 2020, that has materially affected, or is reasonably likely to materially affect, our internal control over financial reporting.
Management’s annual report on internal control over financial reporting
The management of Alexandria Real Estate Equities, Inc. and its subsidiaries (the “Company”) is responsible for establishing and maintaining adequate internal control over financial reporting. Internal control over financial reporting is defined in Rule 13a-15(f) and 15d-15(f) promulgated under the Securities Exchange Act of 1934, as amended, and is a process designed by, or under the supervision of, the Co-CEOs and the CFO and effected by the Company’s Board of Directors, management, and other personnel to provide reasonable assurance regarding the reliability of financial reporting and the preparation of financial statements for external reporting purposes in accordance with GAAP. The Company’s internal control over financial reporting includes those policies and procedures that (i) pertain to the maintenance of records that, in reasonable detail, accurately and fairly reflect the transactions and dispositions of assets; (ii) provide reasonable assurance that transactions are recorded as necessary to permit preparation of financial statements in accordance with GAAP, and that receipts and expenditures are being made only in accordance with the authorizations of the Company’s management and directors; and (iii) provide reasonable assurance regarding prevention or timely detection of unauthorized acquisition, use, or disposition of assets that could have a material effect on the financial statements.
Because of its inherent limitations, internal control over financial reporting may not prevent or detect misstatements. Projections of any evaluation of effectiveness to future periods are subject to the risk that controls may become inadequate because of changes in conditions, or that the degree of compliance with the policies or procedures may deteriorate.
Management has assessed the effectiveness of the Company’s internal control over financial reporting as of December 31, 2020 and 2019. In making its assessment, management has utilized the criteria set forth by the Committee of Sponsoring Organizations (“COSO 2013”) of the Treadway Commission in Internal Control – Integrated Framework (2013 framework). Management concluded that based on its assessment, the Company’s internal control over financial reporting was effective as of December 31, 2020. The effectiveness of our internal control over financial reporting as of December 31, 2020, has been audited by Ernst & Young LLP, an independent registered accounting firm, as stated in its report, which is included herein.
Report of Independent Registered Public Accounting Firm
To the Stockholders and Board of Directors of Alexandria Real Estate Equities, Inc.
Opinion on Internal Control over Financial Reporting
We have audited Alexandria Real Estate Equities, Inc.’s internal control over financial reporting as of December 31, 2020, based on criteria established in Internal Control-Integrated Framework issued by the Committee of Sponsoring Organizations of the Treadway Commission (2013 framework) (the COSO criteria). In our opinion, Alexandria Real Estate Equities, Inc. (the Company) maintained, in all material respects, effective internal control over financial reporting as of December 31, 2020, based on the COSO criteria.
We also have audited, in accordance with the standards of the Public Company Accounting Oversight Board (United States) (PCAOB), the consolidated balance sheets of the Company as of December 31, 2020 and 2019, and the related consolidated statements of operations, comprehensive income, changes in stockholders’ equity and noncontrolling interests and cash flows for each of the three years in the period ended December 31, 2020 and the related notes and financial statement schedule, and our report dated February 1, 2021, expressed an unqualified opinion thereon.
Basis for Opinion
The Company’s management is responsible for maintaining effective internal control over financial reporting and for its assessment of the effectiveness of internal control over financial reporting included in the accompanying management’s annual report on internal control over financial reporting. Our responsibility is to express an opinion on the Company’s internal control over financial reporting based on our audit. We are a public accounting firm registered with the PCAOB and are required to be independent with respect to the Company in accordance with the U.S. federal securities laws and the applicable rules and regulations of the Securities and Exchange Commission and the PCAOB.
We conducted our audit in accordance with the standards of the PCAOB. Those standards require that we plan and perform the audit to obtain reasonable assurance about whether effective internal control over financial reporting was maintained in all material respects.
Our audit included obtaining an understanding of internal control over financial reporting, assessing the risk that a material weakness exists, testing and evaluating the design and operating effectiveness of internal control based on the assessed risk, and performing such other procedures as we considered necessary in the circumstances. We believe that our audit provides a reasonable basis for our opinion.
Definition and Limitations of Internal Control over Financial Reporting
A company’s internal control over financial reporting is a process designed to provide reasonable assurance regarding the reliability of financial reporting and the preparation of financial statements for external purposes in accordance with generally accepted accounting principles. A company’s internal control over financial reporting includes those policies and procedures that (1) pertain to the maintenance of records that, in reasonable detail, accurately and fairly reflect the transactions and dispositions of the assets of the company; (2) provide reasonable assurance that transactions are recorded as necessary to permit preparation of financial statements in accordance with generally accepted accounting principles, and that receipts and expenditures of the company are being made only in accordance with authorizations of management and directors of the company; and (3) provide reasonable assurance regarding prevention or timely detection of unauthorized acquisition, use, or disposition of the company’s assets that could have a material effect on the financial statements.
Because of its inherent limitations, internal control over financial reporting may not prevent or detect misstatements. Also, projections of any evaluation of effectiveness to future periods are subject to the risk that controls may become inadequate because of changes in conditions, or that the degree of compliance with the policies or procedures may deteriorate.
/s/ Ernst & Young LLP
Los Angeles, California
February 1, 2021
Item 9B. OTHER INFORMATION
None.
PART III
Item 10. DIRECTORS, EXECUTIVE OFFICERS, AND CORPORATE GOVERNANCE
The information required by this Item is incorporated herein by reference from our definitive proxy statement for our 2021 annual meeting of stockholders to be filed pursuant to Regulation 14A within 120 days after the end of our fiscal year (the “2021 Proxy Statement”) under the captions “Board of Directors and Executive Officers,” and “Corporate Governance Guidelines and Code of Ethics.”
Item 11. EXECUTIVE COMPENSATION
The information required by this Item is incorporated herein by reference from our 2021 Proxy Statement under the caption “Executive Compensation.”
Item 12. SECURITY OWNERSHIP OF CERTAIN BENEFICIAL OWNERS AND MANAGEMENT AND RELATED STOCKHOLDER MATTERS
The following table sets forth information on the Company’s equity compensation plan as of December 31, 2020:
Equity Compensation Plan Information
| Number of securities to be issued upon exercise of outstanding options, warrants, and rights (a) | Weighted-average exercise price of outstanding options, warrants, and rights (b) | Number of securities remaining available for future issuance under equity compensation plans (excluding securities reflected in column (a)) (c) | ||||||||||||||||||
| Equity Compensation Plan Approved by Stockholders — Amended and Restated 1997 Stock Award and Incentive Plan | — | — | 3,080,980 |
The other information required by this Item is incorporated herein by reference from our 2021 Proxy Statement under the caption “Security Ownership of Certain Beneficial Owners and Management.”
Item 13. CERTAIN RELATIONSHIPS AND RELATED TRANSACTIONS, AND DIRECTOR INDEPENDENCE
The information required by this Item is incorporated herein by reference from our 2021 Proxy Statement under the captions “Certain Relationships and Related Transactions,” “Policies and Procedures with Respect to Related-Person Transactions,” and “Director Independence.”
Item 14. PRINCIPAL ACCOUNTANT FEES AND SERVICES
The information required by this Item is incorporated herein by reference from our 2021 Proxy Statement under the caption “Fees Billed by Independent Registered Public Accountants.”
PART IV
Item 15. EXHIBITS AND FINANCIAL STATEMENT SCHEDULES
(a)(1) and (2) Financial Statements and Financial Statement Schedule
The financial statements and financial statement schedule required by this Item are included as a separate section in this annual report on Form 10-K beginning on page F-1.
| Page | |||||
| Report of Independent Registered Public Accounting Firm | 1 | ||||
| Audited Consolidated Financial Statements of Alexandria Real Estate Equities, Inc.: | |||||
| Consolidated Balance Sheets as of December 31, 2020 and 2019 | 3 | ||||
| Consolidated Financial Statements for the Years Ended December 31, 2020, 2019, and 2018: | |||||
| Consolidated Statements of Operations | 4 | ||||
| Consolidated Statements of Comprehensive Income | 5 | ||||
| Consolidated Statements of Changes in Stockholders’ Equity and Noncontrolling Interests | 6 | ||||
| Consolidated Statements of Cash Flows | 8 | ||||
| Notes to Consolidated Financial Statements | 10 | ||||
| Schedule III – Consolidated Financial Statement Schedule of Real Estate and Accumulated Depreciation | 53 |
(a)(3) Exhibits
| Exhibit Number | Exhibit Title | Incorporated by Reference to: | Date Filed | |||||||||||||||||
| 4.4* | Form of 4.500% Senior Note due 2029 (included in Exhibit 4.3 above) | Form 8-K | July 18, 2014 | |||||||||||||||||
| 4.5* | Indenture, dated as of November 17, 2015, among the Company, as Issuer, Alexandria Real Estate Equities, L.P., as Guarantor, and Wilmington Trust, National Association, as Trustee | Form 8-K | November 17, 2015 | |||||||||||||||||
| 4.6* | [Supplemental Indenture No. 1, dated as of November 17, 2015, among the Company, as Issuer, Alexandria Real Estate Equities, L.P., as Guarantor, and Wilmington Trust, National Association, as Trustee](http://www.sec.gov/Archives/edgar/data/1035443/00011046591507 |
Showing the first 8K of 329K characters. Open the full section