 filings.tools
Ares Management 10-K 2018-12-31
Filed 2019-02-26. 22 sections, 1014K characters. Original on sec.gov · Markdown · JSON
Cover and table of contents
10-K 1 aresmanagement201810-k.htm 10-K
UNITED STATES
SECURITIES AND EXCHANGE COMMISSION
Washington, D.C. 20549
FORM 10‑K
| ý | ANNUAL REPORT PURSUANT TO SECTION 13 OR 15(d) OF THE SECURITIES EXCHANGE ACT OF 1934 |
| For the fiscal year ended December 31, 2018 | |
| OR | |
| o | TRANSITION REPORT PURSUANT TO SECTION 13 OR 15(d) OF THE SECURITIES EXCHANGE ACT OF 1934 |
| For the transition period from to | |
| Commission File No. 001‑36429 |
ARES MANAGEMENT CORPORATION
(Exact name of registrant as specified in its charter)
| Delaware | 80-0962035 |
| (State or other jurisdiction of incorporation or organization) | (I.R.S. Employer Identification No.) |
| 2000 Avenue of the Stars, 12th Floor, Los Angeles, CA 90067 | |
| (Address of principal executive offices) (Zip Code) | |
| (310) 201-4100 | |
| (Registrant’s telephone number, including area code) |
Securities registered pursuant to Section 12(b) of the Act:
| Title of each class | Name of each exchange on which registered |
| Class A Common Stock, par value $0.01 per share | New York Stock Exchange |
| Series A Preferred Stock, par value $0.01 per share | New York Stock Exchange |
Securities registered pursuant to Section 12(g) of the Act: None
Indicate by check mark if the registrant is a well‑known seasoned issuer, as defined in Rule 405 of the Securities Act. Yes ý
No o
Indicate by check mark if the registrant is not required to file reports pursuant to Section 13 or Section 15(d) of the Act. Yes o No ý
Indicate by check mark whether the registrant (1) has filed all reports required to be filed by Section 13 or 15(d) of the Securities Exchange Act of 1934 during the preceding 12 months (or for such shorter period that the registrant was required to file such reports), and (2) has been subject to such filing requirements for the past 90 days: Yes ý No o
Indicate by check mark whether the registrant has submitted electronically if any, every Interactive Data File required to be submitted pursuant to Rule 405 of Regulation S‑T (Section §232.405 of this chapter) during the preceding 12 months (or for such shorter period that the registrant was required to submit such files). Yes ý No o
Indicate by check mark if disclosure of delinquent filers pursuant to Item 405 of Regulation S‑K is not contained herein, and will not be contained, to the best of registrant’s knowledge, in definitive proxy or information statements incorporated by reference in Part III of this Form 10‑K or any amendment to this Form 10‑K. ý
Indicate by check mark whether the registrant is a large accelerated filer, an accelerated filer, a non‑accelerated filer, a smaller reporting company, or an emerging growth company. See the definitions of “large accelerated filer,” “accelerated filer,” “smaller reporting company,” and "emerging growth company" in Rule 12b‑2 of the Exchange Act:
| Large accelerated filer ý | Accelerated filer o | Non‑accelerated filer o | Smaller reporting company o | Emerging growth company o |
If an emerging growth company, indicate by check mark if the registrant has elected not to use the extended transition period for complying with any new or revised financial accounting standards provided pursuant to Section 13(a) of the Exchange Act.o
Indicate by check mark whether the registrant is a shell company (as defined in Rule 12b‑2 of the Exchange Act). Yes o No ý
The aggregate market value of the common shares held by non‑affiliates of the registrant on June 30, 2018, based on the closing price on that date of $20.70 on the New York Stock Exchange, was approximately $1,324,051,923. As of February 22, 2019, there were 103,001,580 of the registrant’s shares of Class A common stock outstanding,1,000 shares of the registrant's Class B common stock outstanding, and 1 share of the registrant's Class C common stock outstanding.
TABLE OF CONTENTS
Forward‑Looking Statements
This Annual Report on Form 10‑K contains forward‑looking statements within the meaning of Section 27A of the Securities Act of 1933 and Section 21E of the Securities Exchange Act of 1934, which reflect our current views with respect to, among other things, future events and financial performance. You can identify these forward‑looking statements by the use of forward‑looking words such as “outlook,” “believes,” “expects,” “potential,” “continues,” “may,” “will,” “should,” “seeks,” “approximately,” “predicts,” “intends,” “plans,” “estimates,” “anticipates” or the negative version of those words or other comparable words. The forward‑looking statements are based on our beliefs, assumptions and expectations of our future performance, taking into account all information currently available to us. Such forward‑looking statements are subject to various risks and uncertainties and assumptions relating to our operations, financial results, financial condition, business prospects, growth strategy and liquidity. Some of these factors are described in this Annual Report on Form 10‑K under the headings “Management’s Discussion and Analysis of Financial Condition and Results of Operations” and “Risk Factors.” These factors should not be construed as exhaustive and should be read in conjunction with the risk factors and other cautionary statements that are included in this Annual Report on Form 10‑K and in our other periodic filings. If one or more of these or other risks or uncertainties materialize, or if our underlying assumptions prove to be incorrect, our actual results may vary materially from those indicated in these forward‑looking statements. New risks and uncertainties arise over time, and it is not possible for us to predict those events or how they may affect us. Therefore, you should not place undue reliance on these forward‑looking statements. Any forward‑looking statement speaks only as of the date on which it is made. We do not undertake any obligation to publicly update or review any forward‑looking statement, whether as a result of new information, future developments or otherwise, except as required by law.
Unless the context suggests otherwise, references in this Annual Report on Form 10‑K to (1) “Ares,” the "Company," “we,” “us” and “our” refer to our businesses, both before and after our conversion to a corporation. References in this Annual Report on Form 10‑K to the “Ares Operating Group” refer to, collectively, Ares Holdings L.P. (“Ares Holdings”), Ares Offshore Holdings L.P. (“Ares Offshore”) and Ares Investments L.P. (“Ares Investments”). References in this Annual Report on Form 10‑K to an “Ares Operating Group Unit” or an “AOG Unit” refer to, collectively, a partnership unit in each of the Ares Operating Group entities.
Under generally accepted accounting principles in the United States (“GAAP”), we are required to consolidate (a) entities other than limited partnerships and entities similar to limited partnerships in which we hold a majority voting interest or have majority ownership and control over the operational, financial and investing decisions of that entity, including Ares‑affiliates and affiliated funds and co‑investment entities, for which we are presumed to have controlling financial interests, and (b) entities that we concluded are variable interest entities (“VIEs”), including limited partnerships and collateralized loan obligations, for which we are deemed to be the primary beneficiary. When an entity is consolidated, we reflect the assets, liabilities, revenues, expenses and cash flows of the entity in our consolidated financial statements on a gross basis, subject to eliminations from consolidation, including the elimination of the management fees, performance income and other fees that we earn from the entity. However, the presentation of performance related compensation and other expenses associated with generating such revenues is not affected by the consolidation process. In addition, as a result of the consolidation process, the net income attributable to third‑party investors in consolidated entities is presented as net income attributable to redeemable interests and non‑controlling interests in Consolidated Funds in our Consolidated Statements of Operations.
In this Annual Report on Form 10‑K, in addition to presenting our results on a consolidated basis in accordance with GAAP, we present revenues, expenses and other results on a (i) “segment basis,” which deconsolidates these entities and therefore shows the results of our reportable segments without giving effect to the consolidation of the entities and (ii) “Unconsolidated Reporting basis,” which shows the results of our reportable segments on a combined segment basis together with our Operations Management Group. In addition to our three segments, we have an Operations Management Group (the “OMG”) that consists of independent, shared resource groups to support our reportable segments by providing infrastructure and administrative support in the areas of accounting/finance, operations, information technology, strategy and relationship management, legal, compliance and human resources. The OMG’s expenses are not allocated to our three reportable segments but we consider the cost structure of the OMG when evaluating our financial performance. This information constitutes non‑GAAP financial information within the meaning of Regulation G, as promulgated by the SEC. Our management uses this information to assess the performance of our reportable segments and our OMG, and we believe that this information enhances the ability of stockholders to analyze our performance. For more information, see “Notes to the Consolidated Financial Statements - Note 16. Segment Reporting.”
Glossary
When used in this Annual Report on Form 10-K, unless the context otherwise requires:
| • | “ARCC Part I Fees” refers to a quarterly performance income on the investment income of Ares Capital Corporation (NASDAQ: ARCC) (“ARCC”). Such fees from ARCC are classified as management fees as they are paid quarterly, predictable and recurring in nature, not subject to contingent repayment and are typically cash settled each quarter; |
| • | “ARCC Part II Fees” refers to fees, paid annually, based on ARCC's net capital gains; |
| • | “Ares Operating Group Unit” or an “AOG Unit” refers to, collectively, a partnership unit in each of the Ares Operating Group entities; |
| • | “assets under management” or “AUM” refers to the assets we manage. For our funds other than CLOs, our AUM represents the sum of the net asset value of such funds, the drawn and undrawn debt (at the fund‑level including amounts subject to restrictions) and uncalled committed capital (including commitments to funds that have yet to commence their investment periods). For our funds that are CLOs, our AUM is equal to initial principal amounts adjusted for paydowns; |
| • | “available capital” (also referred to as “dry powder”) is comprised of uncalled committed capital and undrawn amounts under credit facilities and may include AUM that may be canceled or not otherwise available to invest; |
| • | “CLOs” refers to “our funds” which are structured as collateralized loan obligations; |
| • | “Consolidated Funds” refers collectively to certain Ares‑affiliated funds, related co‑investment entities and certain CLOs that are required under GAAP to be consolidated in our consolidated financial statements; |
| • | “Co‑Founders” refers to Michael Arougheti, David Kaplan, John Kissick, Antony Ressler and Bennett Rosenthal; |
| • | “Credit Facility” refers to the revolving credit facility of the Ares Operating Group; |
| • | “fee paying AUM” or “FPAUM” refers to the AUM on which we directly earn management fees. Fee paying AUM is equal to the sum of all the individual fee bases of our funds that directly contribute to our management fees; |
| • | “fee related earnings” or “FRE”, a non-GAAP measure is used to assess core operating performance by determining whether recurring revenue, primarily consisting of management fees, is sufficient to cover operating expenses and to generate profits. FRE differs from income before taxes computed in accordance with GAAP as it excludes performance income, performance related compensation, investment income from our Consolidated Funds and non-consolidated funds and certain other items that we believe are not indicative of our core operating performance. Beginning in 2018, placement fees are no longer excluded from FRE but are amortized to match the period over which management fees are recognized; |
| • | “Holdco Members” refers to Michael Arougheti, David Kaplan, Antony Ressler, Bennett Rosenthal, Ryan Berry, R. Kipp deVeer and Michael McFerran; |
| • | “Incentive generating AUM” or “IGAUM” refers to the AUM of our funds that are currently generating, on a realized or unrealized basis, performance income. It generally represents the NAV or total assets of our funds, as applicable, for which we are entitled to receive performance income, excluding capital committed by us and our professionals (from which we generally do not earn performance income). With respect to ARCC's AUM, only ARCC Part II Fees may be generated from IGAUM; |
| • | “Incentive eligible AUM” or “IEAUM” refers to the AUM of our funds from which performance income may be generated, regardless of whether or not they are currently generating performance income. It generally represents the NAV plus uncalled equity or total assets plus uncalled debt, as applicable, of our funds for which we are entitled to receive a performance income, excluding capital committed by us and our professionals (from which we generally do not earn performance income). With respect to ARCC's AUM, only ARCC Part II Fees may be generated from IEAUM; |
| • | “management fees” refers to fees we earn for advisory services provided to our funds, which are generally based on a defined percentage of fair value of assets, total commitments, invested capital, net asset value, net investment income, total assets or par value of the investment portfolios managed by us and also include ARCC Part I Fees that are classified as management fees as they are predictable and recurring in nature, not subject to contingent repayment and generally cash‑settled each quarter; |
| • | “net inflows of capital” refers to net new commitments during the period, including equity and debt commitments and gross inflows into our open-ended managed accounts and sub-advised accounts, as well as equity offerings by our publicly traded vehicles minus redemptions from our open-ended funds, managed accounts and sub-advised accounts; |
| • | “net performance income” refers to performance income net of performance related compensation, which is the portion of the performance income earned from certain funds that is payable to our professionals; |
| • | “our funds” refers to the funds, alternative asset companies, co-investment vehicles and other entities and accounts that are managed or co‑managed by the Ares Operating Group, and which are structured to pay fees. It also includes funds managed by Ivy Hill Asset Management, L.P., a wholly owned portfolio company of ARCC, and a registered investment adviser; |
| • | “permanent capital” refers to capital of our funds that do not have redemption provisions or a requirement to return capital to investors upon exiting the investments made with such capital, except as required by applicable law, which funds currently consist of ARCC, Ares Commercial Real Estate Corporation (“ACRE”) and Ares Dynamic Credit Allocation Fund, Inc. (“ARDC”). Such funds may be required, or elect, to return all or a portion of capital gains and investment income; |
| • | “performance income” refers to income we earn based on the performance of a fund, which is generally based on certain specific hurdle rates as defined in the fund’s investment management or partnership agreements and may be either an incentive fee or carried interest; |
| • | “realized income” or “RI”, a non-GAAP measure, is an operating metric used by management to evaluate performance of the business based on operating performance and the contribution of each of the business segments to that performance, while removing the fluctuations of unrealized income and expense, which may or may not be eventually realized at the levels presented and whose realizations depend more on future outcomes than current business operations. RI differs from net income by excluding (a) income tax expense, (b) operating results of our Consolidated Funds, (c) depreciation and amortization expense, (d) the effects of changes arising from corporate actions, (e) unrealized gains and losses related to performance income and investment performance and (f) certain other items that we believe are not indicative of our operating performance. Changes arising from corporate actions include equity-based compensation expenses, the amortization of intangible assets, transaction costs associated with mergers, acquisitions and capital transactions, underwriting costs and expenses incurred in connection with corporate reorganization. Beginning in 2018, placement fees are no longer excluded from RI but are amortized to match the period over which management fees are recognized. Prior to the introduction of RI, management used distributable earnings for this evaluation. Management believes RI is a more appropriate metric to evaluate the Company's current business operations; |
| • | “SEC” refers to the Securities and Exchange Commission; |
| • | “Senior Notes” or the "AFC Notes" refers to senior notes issued by a wholly owned subsidiary of Ares Holdings; |
| • | "Series A Preferred Stock" refers to the preferred stock, $0.01 par value per share, of the Company designated as 7.00% Series A Preferred Stock; and |
| • | “Term Loans” refers to term loans held by wholly owned subsidiaries of Ares Management LLC (“AM LLC”). |
References in this Annual Report on Form 10-K to (1) “common shares” and “preferred shares” refer to shares of our Class A common stock and the Series A Preferred Stock, respectively, previously outstanding prior to our conversion to a corporation effective November 26, 2018 and (2) “common shareholders” and “preferred shareholders” refer to holders of shares of our Class A common stock and shares of the Series A Preferred Stock, respectively, prior to our conversion to a corporation effective November 26, 2018.
Many of the terms used in this report, including AUM, FPAUM, FRE and RI, may not be comparable to similarly titled measures used by other companies. In addition, our definitions of AUM and FPAUM are not based on any definition of AUM or FPAUM that is set forth in the agreements governing the investment funds that we manage and may differ from definitions of AUM or FPAUM set forth in other agreements to which we are a party or definitions used by the SEC or other regulatory bodies. Further, FRE and RI are not measures of performance calculated in accordance with GAAP. We use FRE and RI as measures of operating performance, not as measures of liquidity. FRE and RI should not be considered in isolation or as substitutes for operating income, net income, operating cash flows, or other income or cash flow statement data prepared in accordance with GAAP. The use of FRE and RI without consideration of related GAAP measures is not adequate due to the adjustments described above. Our management compensates for these limitations by using FRE and RI as supplemental measures to our GAAP results. We present these measures to provide a more complete understanding of our performance as our management measures it. Amounts and percentages throughout this report may reflect rounding adjustments and consequently totals may not appear to sum.
PART I.
Item 1. Business
BUSINESS
Overview
Ares is a leading global alternative asset manager with approximately $130.7 billion of assets under management and approximately 1,100 employees in 18 offices across the United States, Europe, Asia and Australia. We offer our investors a range of investment strategies and seek to deliver attractive performance to a growing investor base that includes over 900 direct institutional relationships and a significant retail investor base across our publicly traded and sub‑advised funds. Since our inception in 1997, we have adhered to a disciplined investment philosophy that focuses on delivering strong risk‑adjusted investment returns through market cycles. Ares believes each of its three distinct but complementary investment groups in Credit, Private Equity and Real Estate is a market leader based on assets under management and investment performance. We believe we create value for our stakeholders not only through our investment performance but also by expanding our product offering, enhancing our distribution channels, increasing our global presence, investing in our non‑investment functions, securing strategic partnerships and completing accretive acquisitions and portfolio purchases.
As shown in the chart below, over the past five and ten years, our assets under management have achieved a compound annual growth rate (“CAGR”) of 12% and 18%, respectively. Our AUM has grown to approximately $130.7 billion as of December 31, 2018 from approximately $25.0 billion a decade earlier.

We have an established track record of delivering strong risk‑adjusted returns through market cycles. We believe our consistent and strong performance in a broad range of alternative assets has been shaped by several distinguishing features of our platform:
| • | Robust Sourcing Model: our investment professionals’ local market presence and ability to effectively cross-source for other investment groups generates a robust pipeline of high-quality investment opportunities across our platform. |
| • | Comprehensive Multi‑Asset Class Expertise and Flexible Capital: our proficiency at evaluating every level of the capital structure, from senior debt to common equity, across companies, structured assets, infrastructure, power and energy assets, and real estate projects enables us to effectively assess relative value. This proficiency is complemented by our flexibility in deploying capital in a range of structures and different market environments to maximize risk‑adjusted returns. |
| • | Differentiated Market Intelligence: our proprietary research on approximately 59 industries and insights from a broad, global investment portfolio enable us to more effectively diligence and structure our products and investments. |
| • | Consistent Investment Approach: we believe our rigorous, credit‑oriented investment approach across each of our investment groups is a key contributor to our strong investment performance and ability to expand our product offering. |
| • | Talented and Committed Professionals: we attract, develop and retain highly accomplished investment professionals who not only demonstrate deep and broad investment expertise but also have a strong sense of commitment to our firm. |
| • | Collaborative Culture: we share ideas, relationships and information across our investment groups, which enables us to more effectively source, evaluate and manage investments. |
Integrated Investment Platform
We operate our increasingly diversified and global firm as an integrated investment platform with a collaborative culture that emphasizes sharing of knowledge and expertise. We believe the exchange of information enhances our ability to analyze investments, deploy capital and improve the performance of our funds and portfolio companies. Through collaboration, we drive value by leveraging our capital markets relationships and access to deal flow. The management of our operating businesses is currently overseen by our Executive Management Committee which meets weekly to discuss strategy and operational matters. The members of the Executive Management Committee are Michael Arougheti, David Kaplan, Antony Ressler, Bennett Rosenthal, Ryan Berry, R. Kipp deVeer and Michael McFerran. In addition, we have a Management Committee comprised of senior leadership from our investment, investor relations, marketing and business operations teams, which meets periodically to discuss investment and operating performance, fundraising and market conditions. Within this framework, we have established deep and sophisticated independent research capabilities in approximately 59 industries and insights from active investments in approximately 1,695 companies, 483 alternative credit investments and over 160 properties. Further, our extensive network of investment professionals includes local and geographically positioned individuals with the knowledge, experience and relationships that enable them to identify and take advantage of a wide range of investment opportunities. These professionals are supported by a highly sophisticated business operations team. We believe these broad and deep interdependencies and our operational infrastructure provide us with a scalable foundation to expand our product offerings, geographic scope and profitability.
Breadth, Depth and Tenure of our Senior Management
Ares was built upon the fundamental principle that each of our distinct but complementary investment groups benefits from being part of our broader platform. We believe that our strong performance, consistent growth and high talent retention through economic cycles is due largely to the effective application of this principle across our broad organization of approximately 1,100 employees. We do not have a centralized investment committee and instead our investment committees are structured with overlapping membership from different investment groups to ensure consistency of approach and shared investment experience. Each of our investment groups is led by its own deep leadership team of highly accomplished investment professionals, who average over 24 years of experience managing investments in, advising, underwriting and restructuring companies. While primarily focused on managing strategies within their own investment group, these senior professionals are integrated within our platform through economic, cultural and structural measures. Our senior professionals have the opportunity to participate in the incentive programs of multiple investment groups to reward collaboration across our investment activities. This collaboration takes place on a daily basis and is formally promoted through sophisticated internal systems and widely attended weekly or monthly meetings.
2018 Highlights
Fundraising
In 2018, we raised $36.1 billion in gross new capital for more than 75 different funds. Of the $36.1 billion, $30.0 billion was raised directly from 270 institutional investors (131 existing and 139 new to Ares) and $6.1 billion was raised through intermediaries. The charts below summarize our gross new capital commitments by investment group and strategy (in billions):

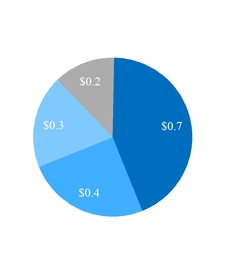

| Credit $31.6 | Private Equity: $1.6 | Real Estate: $2.9 |
| | | | | | | | | | | | | | | | | | | | | | --- | --- | --- | --- | --- | --- | ---
Showing the first 8K of 88K characters. Open the full section
Item 1A. RISK FACTORS
Summary of Risks
Our businesses are subject to a number of inherent risks. We believe that the primary risks affecting our businesses and an investment in our shares are:
| • | a complex regulatory and tax environment involving rules and regulations (both domestic and foreign), some of which are outdated relative to today’s complex financial activities and some of which are subject to political influence, which could restrict or require us to adjust our operations or the operations of our funds or portfolio companies and subject us to increased compliance costs and administrative burdens, as well as restrictions on our business activities; |
| • | poor performance by our funds due to market conditions, political actions or environments, monetary and fiscal policy or other conditions beyond our control; |
| • | the reputational harm that we would experience as a result of inappropriately addressing conflicts of interest, poor performance by the investments we manage or the actual or alleged failure by us, our employees, our funds or our portfolio companies to comply with applicable regulations in an increasingly complex political and regulatory environment; |
| • | potential variability in our period to period earnings due primarily to mark‑to‑market valuations of our funds’ investments. As a result of this variability, the market price of shares of our Class A common stock may be volatile and subject to fluctuations; the increasing demands of the investing community, including the potential for fee compression and changes to other terms, which could materially adversely affect our revenues; and |
| • | an investment in our Class A common stock is not an investment in our underlying funds. Moreover, valuation methodologies for certain assets can be subject to significant subjectivity, and the values of assets may never be realized. |
Risks Related to Our Businesses
Difficult market and political conditions may adversely affect our businesses in many ways, including by reducing the value or hampering the performance of the investments made by our funds or reducing the ability of our funds to raise or deploy capital, each of which could materially reduce our revenue, earnings and cash flow and adversely affect our financial prospects and condition.
Our businesses are materially affected by conditions in the global financial markets and economic and political conditions throughout the world, such as interest rates, the availability and cost of credit, inflation rates, economic uncertainty, changes in laws (including laws relating to our taxation, taxation of our investors and the possibility of changes to regulations applicable to alternative asset managers), trade policies, commodity prices, currency exchange rates and controls and national and international political circumstances (including wars and other forms of conflict, terrorist acts and security operations). These factors are outside of our control and may affect the level and volatility of securities prices and the liquidity and value of investments, and we may not be able to or may choose not to manage our exposure to these conditions.
Global financial markets have experienced heightened volatility in recent periods, including as a result of economic and political events in or affecting the world’s major economies. For example, the June 2016 referendum in the UK in favor of exiting the EU and subsequent ongoing uncertainty regarding the timing and terms of the exit, increased tensions with North Korea over its ballistic missile testing and nuclear program, uncertainty regarding U.S. recertification of the Iran nuclear framework, the 2016 U.S. presidential and 2016 and 2018 congressional elections and resulting uncertainties regarding actual and potential shifts in U.S. and foreign, trade, economic and other policies, and, more recently, concerns over increasing interest rates (particularly short-term rates) and uncertainty regarding the short- and long-term effects of tax reform in the United States, have precipitated market volatility. In addition, numerous structural dynamics and persistent market trends have exacerbated volatility generally. Concerns over significant declines in the commodities markets, the implementation by central banks of synchronized global monetary tightening, sluggish economic expansion in non-U.S. economies, including continued concerns over growth prospects in China and emerging markets, growing debt loads for certain countries and uncertainty about the consequences of the U.S. and other governments withdrawing monetary stimulus measures all highlight the fact that economic conditions remain unpredictable and volatile. As a result, although global economies experienced widespread growth in 2018, there is a high risk of significant ongoing volatility. Moreover, there is a risk of both sector-specific and broad-based corrections and/or downturns in the equity and credit markets. For example, in February 2018 and again in the fourth quarter of 2018, global equity markets experienced a widespread sell-off, and bonds have also declined in value. Any of the foregoing could have a significant impact on the markets in which we operate and a material adverse impact on our business prospects and financial condition.
Further, the transition of leadership following the 2016 U.S. presidential and 2016 and 2018 congressional elections, the current U.S. political environment and the resulting uncertainties regarding actual and potential shifts in U.S. foreign, trade, economic and other policies under the current administration have led to further disruption, instability and volatility in the global markets. For example, recently expanded legislation would dramatically increase the scope and number of transactions that are subject to the jurisdiction of the Committee on Foreign Investment in the United States (“CFIUS”). If the proposal becomes law, CFIUS will have the authority to review and potentially block certain non-controlling investments in critical infrastructure and technology companies and other transactions, which may reduce the number of potential buyers and limit the ability of our funds to realize value from certain existing and future investments. There can be no assurance these market conditions will not continue or worsen in the future.
A number of factors have had and may continue to have an adverse impact on credit markets in particular. The weakness and the uncertainty regarding the stability of the oil and gas markets resulted in a tightening of credit across multiple sectors. In addition, following a sustained period of historically low interest rate levels, the Federal Reserve has raised the federal funds rate on multiple occasions since December 2015, including on three separate occasions in 2018. Changes in and uncertainty surrounding interest rates may have a material effect on our business, particularly with respect to the cost and availability of financing for significant acquisition and disposition transactions. Furthermore, some of the provisions under the 2017 tax law amendments in the United States, Public Law No. 115-97 (the “Tax Cuts and Jobs Act”) could have a negative impact on the cost of financing and dampen the attractiveness of credit. Moreover, while conditions in the U.S. economy have generally improved since the credit crisis, many other economies continue to experience weakness, tighter credit conditions and a decreased availability of foreign capital. Since credit represents a significant portion of our business and ongoing strategy, any of the foregoing could have a material adverse impact on our business prospects and financial condition.
These and other conditions in the global financial markets and the global economy have resulted in, and may continue to result in, adverse consequences for us and many of our fu
Showing the first 8K of 289K characters. Open the full section
Item 1B. Unresolved Staff Comments
None.
Item 2. Properties
Our principal executive offices are located in leased office space at 2000 Avenue of the Stars, 12th Floor, Los Angeles, California. We also lease office space in Culver City, Atlanta, Chicago, Dallas, New York City, Washington, D.C., St. Louis, Dubai, Frankfurt, London, Luxembourg, Paris, Stockholm, Chengdu, Hong Kong, Shanghai, Sydney, Sausalito, Needham, Tarrytown, and Williamsville. We do not own any real property. We consider these facilities to be suitable and adequate for the management and operation of our businesses.
Item 3. Legal Proceedings
From time to time we are involved in various legal proceedings, lawsuits and claims incidental to the conduct of our business, some of which may be material. Our businesses are also subject to extensive regulation, which may result in regulatory proceedings against us.
Item 4. Mine Safety Disclosures
None.
PART II.
Item 5. Market For Registrant’s Common Equity, Related Stockholder Matters And Issuer Purchases Of Equity Securities
Market Information
Our Class A common stock is traded on the NYSE under the symbol “ARES". Our common shares began trading on the NYSE on May 2, 2014. We completed our conversion from a Delaware limited partnership to a Delaware corporation effective on November 26, 2018. Our Class A common stock continued to trade on the NYSE under our existing symbol following the Conversion.
The number of holders of record of our Class A common stock as of February 22, 2019 was two. This does not include the number of shareholders that hold shares in “street name” through banks or broker-dealers. Ares Management GP LLC is the sole holder of shares of our Class B Common Stock and Ares Voting LLC is the sole holder of shares of our Class C Common Stock.
Stock Performance Graph
The following graph and table depict the total return to holders of our Class A common stock from the closing price on May 2, 2014 (the date our common shares began trading on the NYSE) through December 31, 2018, relative to the performance of the S&P 500 Index and the Dow Jones U.S. Asset Managers Index. The graph and table assume $100 invested on May 2, 2014 and dividends received reinvested in the security or index.
The performance graph and table are not intended to be indicative of future performance. The performance graph and table shall not be deemed “soliciting material” or to be “filed” with the SEC for purposes of Section 18 of the Exchange Act, or otherwise subject to the liabilities under that Section, and shall not be deemed to be incorporated by reference into any of the Company’s filings under the Securities Act or the Exchange Act.
Total Return Performance Table

| 5/2/2014 | 12/31/2014 | 12/31/2015 | 12/31/2016 | 12/31/2017 | 12/31/2018 | |
| ARES | $100.0 | $94.5 | $74.9 | $117.3 | $129.8 | $122.6 |
| S&P 500 | 100.0 | 111.0 | 112.5 | 126.0 | 153.5 | 146.7 |
| Dow Jones U.S. Asset Manager | 100.0 | 115.0 | 103.3 | 114.9 | 149.0 | 111.7 |
Issuer Purchases of Equity Securities
The table below presents purchases made by or on behalf of Ares Management Corporation or any “affiliated purchaser” (as defined in Rule 10b-18(a)(3) under the Exchange Act) of shares of our Class A Common Stock during each of the indicated periods.
| Period | Total Number of Shares of Our Class A Common Stock Purchased(1) | Average Price Paid Per Share of Our Class A Common Stock | Total Number of Shares of Our Class A Common Stock Purchased as Part of Publicly Announced Plans or Programs | Maximum Number of Shares of Our Class A Common Stock That May Yet Be Purchased Under the Plan or Program | |||||||||
| October 1 to October 31, 2018 | — | $ | — | — | — | ||||||||
| November 1 to November 30, 2018 | — | $ | — | — | — | ||||||||
| December 1 to December 31, 2018 | — | $ | — | — | — |
In February 2019, our board of directors authorized the repurchase of up to $150 million of shares of our Class A common stock. Under this stock repurchase program, shares may be repurchased from time to time in open market purchases, privately negotiated transactions or otherwise, including in reliance on Rule 10b5-1 of the Securities Act. The program is scheduled to expire in February 2020. Repurchases under the program, if any, will depend on the prevailing market conditions and other factors. There is no assurance that any shares will be repurchased under the program.
Dividend Policy for the Series A Preferred Stock
As of December 31, 2018 and 2017, the Company had 12,400,000 shares of Series A Preferred Stock, $0.01 par value per share, designated as “7.00% Series A Preferred Stock” outstanding. When, as and if declared by the Company’s board of directors, dividends on the Series A Preferred Stock are paid quarterly at a rate per annum equal to 7.00%. During 2018 and 2017, we paid quarterly dividends of approximately $21.7 million in each year to holders of record of shares of the Series A Preferred Stockholders, and in February 2019, the Company's board of directors declared a quarterly dividend of $5.4 million in respect of the fourth quarter of 2018 payable on March 31, 2019 to holders of record of shares of the Series A Preferred Stock at the close of business on March 15, 2019.
Dividend Policy for Class A Common Stock
During 2017, we paid quarterly dividends of $0.28, $0.13, $0.31 and $0.41 per common share (totaling $1.13 per common share) to record holders of common shares, or approximately $92.6 million. During 2018, the Company declared dividends of $0.40, $0.0933, $0.28, $0.28 and $0.28 (totaling $1.33) per share to holders of record of shares of our Class A common stockholders at the close of business on February 26, April 16, June 15, September 14, and December 17, respectively, or approximately $99.3 million. In February 2019, the Company's board of directors declared a quarterly dividend of $0.32 per share, or approximately $33.0 million, in respect of the first quarter of 2019 payable on March 29, 2019 to holders of record of shares of our Class A Common stock at the close of business on March 15, 2019.
Our dividend policy for our Class A common stock is more closely aligned with our core management fee business. We intend to provide a steady quarterly dividend for each calendar year that will be based on our after-tax fee related earnings, with future potential changes based on the level and growth of our after-tax fee related earnings. Subject to the approval of our board of directors, we intend to pay a dividend of $0.32 per share of our Class A common stock per quarter in 2019.
Our fixed dividend will be reassessed each year based upon the level and growth of our after-tax fee related earnings. As fee related earnings reflect the core earnings of our business and consists of management fees less compensation and general and administrative expenses, having our recurring dividend based on this amount removes volatility from our dividend and enables investors to receive what we believe is an attractive after-tax qualifying dividend yield.
Our dividend policy reflects our intention to retain net performance income. We expect to use such retained earnings for potential stock repurchases and to fund future growth with the objective of accelerating our fee related earnings growth per share. However, the declaration, payment and determination of the amount of future dividends, if any, is at the sole discretion of our board of directors, which may change our dividend policy at any time.
The payment of cash dividends on shares of our Class A common stock is subject to compliance with DGCL. In addition, under the Credit Facility, certain subsidiaries of the Ares Operating Group are prohibited from paying dividends in certain circumstances, including if an Event of Default (as defined in the Credit Facility) has occurred and is continuing.
Because Ares Management Corporation is a holding company and has no material assets other than its indirect ownership of Ares Operating Group Units, we fund dividends by Ares Management Corporation on shares of our Class A common stock, if any, in three steps:
| • | first, we cause the Ares Operating Group entities to make distributions to their partners, including Ares Management Corporation and its direct subsidiaries. If the Ares Operating Group entities make such distributions, the partners of the Ares Operating Group entities will be entitled to receive equivalent distributions pro rata based on their partnership units in the Ares Operating Group (except as set forth in the following paragraph); |
| • | second, we cause Ares Management Corporation’s direct subsidiaries to distribute to Ares Management Corporation their share of such distributions, net of any taxes and amounts payable under the tax receivable agreement by such direct subsidiaries; and |
| • | third, Ares Management Corporation pays such distributions to our holders of our Class A common stock, net of any taxes and amounts payable under the tax receivable agreement, on a pro rata basis. |
Because we and our direct subsidiaries that are corporations for U.S. federal income tax purposes may be required to pay corporate income and franchise taxes and make payments under the tax receivable agreement, the dividend amounts ultimately paid by us to holders of our Class A common stock are expected to be generally less, on a per share basis, than the amounts distributed by the Ares Operating Group entities to their respective partners in respect of their Ares Operating Group Units.
In addition, governing agreements of the Ares Operating Group entities provide for cash distributions, which we refer to as “tax distributions,” to the partners of such entities if the general partners of the Ares Operating Group entities determine that the taxable income of the relevant Ares Operating Group entity gives rise to taxable income for its partners. Generally, these tax distributions are computed based on our estimate of the net taxable income of the relevant entity multiplied by an assumed tax rate equal to the highest effective marginal combined U.S. federal, state and local income tax rate prescribed for an individual or corporate resident in Los Angeles, California or New York, New York, whichever is higher (taking into account the non‑deductibility of certain expenses and the character of our income). The Ares Operating Group makes tax distributions only if and to the extent distributions from such entities for the relevant year were otherwise insufficient to cover such tax liabilities.
In addition, the cash flow from operations of the Ares Operating Group entities may be insufficient to enable them to make required minimum tax distributions to their partners, in which case the Ares Operating Group may have to borrow funds or sell assets, which could have a material adverse effect on our liquidity and financial condition. Furthermore, by paying cash dividends rather than investing that cash in our businesses, we might risk slowing the pace of our growth, or not having a sufficient amount of cash to fund our operations, new investments or unanticipated capital expenditures, should the need arise.
Although a portion of any dividends by us to holders of our Class A common stock may include carried interest received by us, we do not intend to seek fulfillment of any contingent repayment obligation by seeking to have holders of our Class A common stock return any portion of such dividends attributable to carried interest associated with any contingent repayment obligation.
We expect any dividends paid out of current or accumulated earnings and profits to U.S. individuals and certain other qualifying holders of our Class A common stock to constitute “qualified dividend” income that is generally taxed at a more favorable tax rate than the ordinary income tax rate, if the requisite holding periods have been met. If the dividend exceeds current and accumulated earnings and profits, the excess is treated as a nontaxable return of capital, reducing the stockholder’s tax basis in its shares to the extent of such shareholder’s tax basis in such shares. Any remaining excess is treated as capital gain. Because U.S. corporations are taxed on their own taxable income, and because owners of such entities are taxed on any dividends paid from such entities, there are two levels of potential tax upon income earned by such entities.
Unregistered Sales of Equity Securities and Purchases of Equity Securities
None.
Item 6. Selected Financial Data
The following tables present selected consolidated financial information and other data of the Company. The Company, which was formed on November 15, 2013 as a partnership and converted to a Delaware corporation effective November 26, 2018, was formed to serve as a holding company for our businesses. See “Item 1. Business—Organizational Structure.”
We derived the following selected consolidated financial data of the Company as of December 31, 2018 and 2017 and for the years ended December 31, 2018, 2017 and 2016 from the audited consolidated financial statements included elsewhere in this Annual Report on Form 10‑K. The selected consolidated financial data of the Company as of and for the years ended December 31, 2015 and 2014 were derived from the audited consolidated financial statements of the Company, which are not included in this Annual Report on Form 10-K. The consolidated financial statements were prepared on substantially the same basis as the audited consolidated financial statements and include all adjustments that we consider necessary for a fair presentation of the Company’s consolidated financial position and results of operations. The selected historical financial data is not indicative of the expected future operating results of the Company.
The entities comprising our Consolidated Funds are not the same entities for all periods presented primarily due to the adoption of new consolidation guidance. Pursuant to revised consolidation guidance that became effective for us on January 1, 2015, we consolidated entities where we hold a controlling financial interest. The consolidation of funds during the periods generally has the effect of grossing up reported assets, liabilities and cash flow, and has no effect on net income attributable to the Company. See “Item 7. Management’s Discussion and Analysis of Financial Condition and Results of Operations—Consolidation and Deconsolidation of Ares Funds” and “—Critical Accounting Estimates—Principles of Consolidation” and Note 2, “Summary of Significant Accounting Policies,” to our consolidated financial statements appearing elsewhere in this Annual Report on Form 10-K.
The following selected historical consolidated financial data should be read together with “Item 1. Business—Organizational Structure,” “Item 7. Management’s Discussion and Analysis of Financial Condition and Results of Operations” and our historical consolidated financial statements and related notes included elsewhere in this Annual Report on Form 10‑K (in thousands).
| For the Year Ended December 31, | |||||||||||||||||||
| Statements of operations data | 2018 | 2017 | 2016 | 2015 | 2014 | ||||||||||||||
| As Adjusted | As Adjusted | As Adjusted | As Adjusted | ||||||||||||||||
| Revenues | |||||||||||||||||||
| Management fees (includes ARCC Part I Fees of $128,805, $105,467, $121,181, $121,491 and $118,537 for the years ended December 31, 2018, 2017, 2016, 2015 and 2014, respectively) | $ | 802,502 | $ | 722,419 | $ | 642,068 | $ | 634,399 | $ | 486,477 | |||||||||
| Carried interest allocation | 42,410 | 620,454 | 494,580 | 146,038 | 63,884 | ||||||||||||||
| Incentive fees | 63,380 | 16,220 | 23,272 | 4,577 | 27,528 | ||||||||||||||
| Principal investment income (loss) | (1,455 | ) | 64,444 | 55,168 | 11,290 | 6,527 | |||||||||||||
| Administrative, transaction and other fees | 51,624 | 56,406 | 39,285 | 29,428 | 26,000 | ||||||||||||||
| Total revenues | 958,461 | 1,479,943 | 1,254,373 | 825,732 | 610,416 | ||||||||||||||
| Expenses | |||||||||||||||||||
| Compensation and benefits | 570,380 | 514,109 | 447,725 | 414,454 | 456,372 | ||||||||||||||
| Performance related compensation | 30,254 | 479,722 | 387,846 | 111,683 | 170,028 | ||||||||||||||
| General, administrative and other expenses | 215,964 | 196,730 | 159,776 | 224,798 | 166,839 | ||||||||||||||
| Transaction support expense | — | 275,177 | — | — | — | ||||||||||||||
| Expenses of Consolidated Funds | 53,764 | 39,020 | 21,073 | 18,105 | 66,800 | ||||||||||||||
| Total expenses | 870,362 | 1,504,758 | 1,016,420 | 769,040 | 860,039 | ||||||||||||||
| Other income (expense) | |||||||||||||||||||
| Net realized and unrealized gain (loss) on investments | (1,884 | ) | 8,262 | (7,629 | ) | 12,913 | 26,206 | ||||||||||||
| Interest and dividend income | 7,028 | 7,043 | 4,493 | 6,851 | 6,639 | ||||||||||||||
| Interest expense | (21,448 | ) | (21,219 | ) | (17,981 | ) | (18,949 | ) | (8,617 | ) | |||||||||
| Debt extinguishment expense | — | — | — | (11,641 | ) | — | |||||||||||||
| Other income (expense), net | (851 | ) | 19,470 | 35,650 | 21,680 | (2,422 | ) | ||||||||||||
| Net realized and unrealized gain (loss) on investments of Consolidated Funds | (1,583 | ) | 100,124 | (2,057 | ) | (24,616 | ) | 513,270 | |||||||||||
| Interest and other income of Consolidated Funds | 337,875 | 187,721 | 138,943 | 117,373 | 937,835 | ||||||||||||||
| Interest expense of Consolidated Funds | (222,895 | ) | (126,727 | ) | (91,452 | ) | (78,819 | ) | (666,373 | ) | |||||||||
| Total other income | 96,242 | 174,674 | 59,967 | 24,792 | 806,538 | ||||||||||||||
| Income before taxes | 184,341 | 149,859 | 297,920 | 81,484 | 556,915 | ||||||||||||||
| Income tax expense (benefit) | 32,202 | (23,052 | ) | 11,019 | 19,064 | 11,253 | |||||||||||||
| Net income | 152,139 | 172,911 | 286,901 | 62,420 | 545,662 | ||||||||||||||
| Less: Net income attributable to redeemable interests in Consolidated Funds | — | — | — | — | 2,565 | ||||||||||||||
| Less: Net income (loss) attributable to non-controlling interests in Consolidated Funds | 20,512 | 60,818 | 3,386 | (5,686 | ) | 417,793 | |||||||||||||
| Less: Net income attributable to redeemable interests in Ares Operating Group entities | — | — | 456 | 338 | 731 | ||||||||||||||
| Less: Net income attributable to non-controlling interests in Ares Operating Group entities | 74,607 | 35,915 | 171,251 | 48,390 | 89,585 | ||||||||||||||
| Net income attributable to Ares Management Corporation | 57,020 | 76,178 | 111,808 | 19,378 | 34,988 | ||||||||||||||
| Less: Series A Preferred Stock dividends paid | 21,700 | 21,700 | 12,176 | — | — | ||||||||||||||
| Net income attributable to Ares Management Corporation Class A common stockholders | $ | 35,320 | $ | 54,478 | $ | 99,632 | $ | 19,378 | $ | 34,988 |
| As of December 31, | |||||||||||||||||||
| 2018 | 2017 | 2016 | 2015 | 2014 | |||||||||||||||
| As Adjusted | As Adjusted | As Adjusted | As Adjusted | ||||||||||||||||
| Statements of financial condition data | |||||||||||||||||||
| Cash and cash equivalents | $ | 110,247 | $ | 118,929 | $ | 342,861 | $ | 121,483 | $ | 148,858 | |||||||||
| Cash and cash equivalents of Consolidated Funds | 384,644 | 556,500 | 455,280 | 159,507 | 1,314,397 | ||||||||||||||
| Investments | 1,326,137 | 1,724,571 | 1,209,793 | 974,101 | 336,159 | ||||||||||||||
| Investments, at fair value, of Consolidated Funds | 7,673,165 | 5,582,842 | 3,330,203 | 2,559,783 | 19,123,950 | ||||||||||||||
| Total assets | 10,154,692 | 8,563,522 | 5,829,712 | 4,321,408 | 21,638,992 | ||||||||||||||
| Debt obligations | 480,952 | 616,176 | 305,784 | 389,120 | 243,491 | ||||||||||||||
| CLO loan obligations of Consolidated Funds | 6,678,091 | 4,963,194 | 3,031,112 | 2,174,352 | 12,049,170 | ||||||||||||||
| Consolidated Funds’ borrowings | 209,284 | 138,198 | 55,070 | 11,734 | 777,600 | ||||||||||||||
| Mezzanine debt of Consolidated Funds | — | — | — | — | 378,365 | ||||||||||||||
| Total liabilities | 8,760,351 | 7,103,230 | 4,452,450 | 3,329,497 | 14,879,619 | ||||||||||||||
| Redeemable interest in Consolidated Funds | — | — | — | — | 1,037,450 | ||||||||||||||
| Redeemable interest in Ares Operating Group entities | — | — | — | 23,505 | 23,988 | ||||||||||||||
| Non‑controlling interest in Consolidated Funds | 503,637 | 528,488 | 338,035 | 323,606 | 4,950,803 | ||||||||||||||
| Non‑controlling interest in Ares Operating Group entities | 302,780 | 358,186 | 447,615 | 397,883 | 463,493 | ||||||||||||||
| Total stockholders' equity | 587,924 | 573,618 | 591,612 | 246,917 | 283,639 | ||||||||||||||
| Total equity | 1,394,341 | 1,460,292 | 1,377,262 | 968,406 | 5,697,935 | ||||||||||||||
| Total liabilities, redeemable interest, non‑controlling interests and equity | 10,154,692 | 8,563,522 | 5,829,712 | 4,321,408 | 21,638,992 |
Item 7. Management’s Discussion And Analysis Of Financial Condition And Results Of Operations
Ares Management Corporation is a Delaware corporation which was formerly a limited partnership formed on November 15, 2013 and which converted to a Delaware corporation effective on November 26, 2018. Unless the context otherwise requires, references to “we,” “us,” “our,” and “the Company” are intended to mean the business and operations of Ares Management Corporation and its consolidated subsidiaries. The following discussion analyzes the financial condition and results of operations of the Company. “Consolidated Funds” refers collectively to certain Ares‑affiliated funds, related co‑investment entities and certain CLOs that are required under generally accepted accounting principles in the United States (“GAAP”) to be consolidated in our consolidated financial statements included in this Annual Report on Form 10‑K. Additional terms used by the Company are defined in the Glossary and throughout the Management's Discussion and Analysis in this Annual Report on Form 10-K.
The following discussion and analysis should be read in conjunction with the audited, consolidated financial statements of Ares Management Corporation and the related notes included in this Annual Report on Form 10‑K.
Amounts and percentages presented throughout our discussion and analysis of financial condition and results of operations may reflect rounded results in thousands (unless otherwise indicated) and consequently, totals may not appear to sum.
Our Business
We are a leading global alternative asset manager that operates through three distinct but complementary investment groups, which are our reportable segments. During the year ended December 31, 2018, we reclassified certain expenses from OMG to our operating segments. We have presented our reportable segments for the years ended December 31, 2017 and 2016 to conform to the year ended December 31, 2018 presentation.
Our three operating segments are:
| • | Credit Group: Our Credit Group is a leading manager of credit strategies across the non-investment grade credit universe in the U.S. and Europe, with approximately $95.9 billion of assets under management and 156 funds as of December 31, 2018. The Credit Group offers a range of credit strategies across the liquid and illiquid spectrum, including syndicated loans, high yield bonds, credit opportunities, alternative credit investments and U.S. and European direct lending. The Credit Group provides solutions for investors seeking to access public and private credit markets and capitalizes on opportunities across U.S. and Europe. It additionally provides investors access to directly originated fixed and floating rate credit assets and the ability to capitalize on illiquidity premiums across the credit spectrum. The Credit Group’s syndicated loans strategy focuses on liquid, traded non-investment grade secured loans to corporate borrowers. The high yield bond strategy seeks to deliver a diversified portfolio of liquid, traded non-investment grade corporate bonds, including secured, unsecured and subordinated debt instruments. Credit opportunities is a “go anywhere” strategy seeking to capitalize on market inefficiencies and relative value opportunities across the capital structure. The alternative credit strategy seeks investment opportunities that fall outside of traditional, well-defined markets such as corporate debt, real estate and private equity. Alternative credit investments include certain structural features designed to protect value and minimize loss such as asset security, seniority, covenants, and cash flow prioritization. These investments include asset-backed securities, specialty assets, real assets, and structured credit. We are one of the largest self-originating direct lenders to the U.S. and European middle markets, providing one-stop financing solutions for small-to-medium sized companies, which we believe are increasingly underserved by traditional lenders. We provide investors access to these capabilities through several vehicles, including commingled funds, separately managed accounts and a publicly traded vehicle. The Credit Group conducts its U.S. corporate lending activities primarily through ARCC, the largest business development company as of December 31, 2018, by both market capitalization and total assets. In addition, the Credit Group manages a commercial finance business that provides asset-based and cash flow loans to small and middle-market companies, as well as asset-based facilities to specialty finance companies. The Credit Group’s European direct lending platform is one of the most significant participants in the European middle-market, focusing on self-originated investments in illiquid middle-market credits. |
| • | Private Equity Group: Our Private Equity Group had approximately $23.5 billion of assets under management as of December 31, 2018, broadly categorizing its investment strategies as corporate private equity, infrastructure and power, special opportunities and energy opportunities. As of December 31, 2018, the group managed five corporate private equity commingled funds focused on North America and Europe and three focused on greater China, five commingled funds and six related co-investment vehicles focused on infrastructure and power, two commingled special opportunities funds and our first energy opportunities fund. In our North American and European flexible capital strategy, we target opportunistic majority or shared-control investments in businesses with strong franchises and attractive growth opportunities in North America and Europe. The infrastructure and power strategy targets infrastructure-related assets across the power generation, transmission, midstream sectors and renewables sectors seeking attractive risk-adjusted equity returns with current cash flow and capital appreciation. The special opportunities strategy seeks to invest opportunistically across a broad spectrum of distressed and opportunistic investments, including rescue direct lending, opportunistic financing, comprehensive recapitalization solutions, stressed/distressed debt and post reorganization securities. The energy opportunities strategy targets investments in the energy industry where its flexible capital can provide attractive risk-adjusted returns while mitigating commodity risk. |
| • | Real Estate Group: Our Real Estate Group manages comprehensive equity and debt strategies, with approximately $11.3 billion of assets under management across 43 funds as of December 31, 2018. Real Estate equity strategies focus on applying hands-on value creation initiatives to mismanaged and capital-starved assets, as well as new development, ultimately selling stabilized assets back into the market. The Real Estate Group manages both a value-add strategy and an opportunistic strategy. The value-add strategy seeks to create value by buying assets at attractive valuations and through active asset management of income-producing properties across the U.S. and Western Europe. The opportunistic strategy focuses on manufacturing core assets through development, redevelopment and fixing distressed capital structures across major property types in the U.S. and Europe. The Company’s debt strategies leverage the Real Estate Group’s diverse sources of capital to directly originate and manage commercial mortgage investments on properties that range from stabilized to requiring hands-on value creation. In addition to managing private debt funds, the Real Estate Group makes debt investments through a publicly traded commercial mortgage REIT, ACRE. |
The Operations Management Group (the “OMG”) consists of shared resource groups to support our operating segments by providing infrastructure and administrative support in the areas of accounting/finance, operations, information technology, strategy and relationship management, legal, compliance and human resources. Additionally, the OMG provides serv
Showing the first 8K of 250K characters. Open the full section
Item 7A. Quantitative and Qualitative Disclosures About Market Risk
Our primary exposure to market risk is related to our role as general partner or investment adviser to our investment funds and the sensitivity to movements in the fair value of their investments, including the effect on management fees, carried interest allocation and investment income.
Market Risk
The market price of investments may significantly fluctuate during the period of investment. Investments may decline in value due to factors affecting securities markets generally or particular industries represented in the securities markets. The value of an investment may decline due to general market conditions, which are not specifically related to such investment, such as real or perceived adverse economic conditions, changes in the general outlook for corporate earnings, changes in interest or currency rates or adverse investor sentiment generally. They may also decline due to factors that affect a particular industry or industries, such as labor shortages or increased production costs and competitive conditions within an industry.
Our credit orientation has been a central tenet of our business across our debt and equity investment strategies. Our investment professionals benefit from our independent research and relationship networks in over 50 industries, and insights from our portfolio of active investments. We believe the combination of high-quality proprietary information flow and a consistent, rigorous approach to managing investments across our strategies has been, and we believe will continue to be, a major driver of our strong risk-adjusted returns and the stability and predictability of our income.
Effect on Management Fees
Management fees are generally based on a defined percentage of fair value of assets, total commitments, invested capital, net asset value, net investment income, total assets or par value of the investment portfolios we manage. Management fees calculated based on fair value of assets or net investment income are affected by short-term changes in market values.
The overall impact of a short-term change in market value may be mitigated by a number of factors including, but not limited to, fee definitions that are not based on market value including invested capital and committed capital, market value definitions that exclude the impact of realized and/or unrealized gains and losses, market value definitions based on beginning of the period values or a form of average market value including daily, monthly or quarterly averages as well monthly or quarterly payment terms.
The proportion of our management fees that are based on NAV depends on the number and type of funds in existence. For the year ended December 31, 2018, the fund management fees that were recognized based on the NAV of the applicable funds were approximately 5%. As such, a hypothetical 10% decrease in fair value of our managed funds’ investments as of December 31, 2018 would not have a material impact on our management fees.
Effect on Carried Interest Allocation
We earn carried interest allocation from certain of our funds when such funds achieve specified performance criteria. Our carried interest allocation will be impacted by changes in market risk factors. However, several major factors will influence the degree of impact, including, but not limited to, the following :
| • | the performance criteria for each individual fund in relation to how that fund’s results of operations are impacted by changes in market risk factors; |
| • | whether such performance criteria are annual or over the life of the fund; |
| • | to the extent applicable, the previous performance of each fund in relation to its performance criteria; and |
| • | whether each funds’ performance related distributions are subject to contingent repayment. |
As a result, the impact of changes in market risk factors on carried interest allocation will vary widely from fund to fund. An overall increase of 10% in the general equity markets would not necessarily drive the same impact on our funds’ valuations, as many of our investments in our funds are illiquid and do not trade on any exchange. Additionally, as a large percentage of our carried interest allocation are paid to employees as performance related compensation, the overall net impact to our income would be mitigated by lower compensation payments.
See Note 9, “Commitments and Contingencies,” to our consolidated financial statements included in this Annual Report on Form 10‑K for discussion on amount of performance income, net of tax, subject to contingent repayment if we assumed all existing investments were worthless.
Effect on Investment Income
An investment gain (loss) is realized when we redeem all or a portion of our investment or when we receive cash income, such as interest or dividends. Unrealized investment gain (loss) results from changes in the fair value of the underlying investment as well as the reversal of unrealized appreciation (depreciation) at the time an investment is realized.
Changes in the fair values of our funds’ investments directly impact unrealized principal investment income and unrealized gains on investments. A hypothetical incremental 10% decrease in the fair value of our investments as of December 31, 2018 would result in declines in principal investment income and unrealized gains on investments of $34.0 million and $14.9 million, respectively.
Exchange Rate Risk
Our funds hold investments that are denominated in non-U.S. dollar currencies that may be affected by movements in the rate of exchange between the U.S. dollar and non-U.S. dollar currencies. Movements in the exchange rate between the U.S. dollar and non-U.S. dollar currencies impact the management fees earned by funds with fee paying AUM denominated in non-U.S. dollar currencies as well as by funds with fee paying AUM denominated in U.S. dollars that hold investments denominated in non-U.S. dollar currencies. Additionally, movements in the exchange rate impact operating expenses for our foreign offices that
are denominated in non-U.S. currencies and the revaluation of assets and liabilities denominated in non-functional currencies, including cash balances and investments.
We manage our exposure to exchange rate risks through our regular operating activities, wherein we utilize payments received in non-U.S. dollar currencies to fulfill obligations in non-U.S dollar foreign currencies, and, when appropriate, through the use of derivative financial instruments to hedge the net non-U.S. exposure: in the funds that we advise; the balance sheet exposure for certain direct investments denominated in non-U.S. dollar currencies; and the cash flow exposure for non-U.S. dollar currencies.
A portion of our management fees are denominated in non-U.S. dollar currencies that may be affected by movements in the rate of exchange between the U.S. dollar and non-U.S. dollar currencies. We estimate that as of December 31, 2018 a hypothetical 10% decline in the rate of exchange of all foreign currencies against the U.S. dollar would result in a change in management fees of approximately $10.4 million, or 1% of management fees for the year ended December 31, 2018, which would largely be offset by the currency conversions of the expenses denominated in non-US dollar currencies.
Interest Rate Risk
As of December 31, 2018, we had $235.0 million of borrowings outstanding under the Credit Facility.
Our Credit Facility provides a $1.065 billion revolving line of credit with the ability to upsize to $1.28 billion (subject to obtaining commitments for any such additional borrowing capacity) with a maturity date of February 24, 2022. The Credit Facility bears interest at a variable rate based on either LIBOR or a base rate plus an applicable margin with an unused commitment fee paid quarterly, which is subject to change with our underlying credit agency rating. Currently, base rate loans bear interest calculated based on the base rate plus 0.50% and the LIBOR rate loans bear interest calculated based on LIBOR rate plus 1.50%. Our unused commitment fee is 0.20% per annum. As of December 31, 2018, we had $235.0 million of borrowings outstanding under the Credit Facility.
We estimate that in the event of a 100 basis point increase in interest rates, to the extent there is an outstanding revolver balance, we would be subject to the variable rate and would expect our interest expense to increase commensurately.
As credit-oriented investors, we are also subject to interest rate risk through the securities we hold in our Consolidated Funds. A 100 basis point increase in interest rates would be expected to negatively affect the fair value of securities that accrue interest income at fixed rates and therefore negatively impact net change in unrealized appreciation on investments of the Company and the Consolidated Funds. The actual impact is dependent on the average duration and amounts of such holdings and the amount of such holdings. Conversely, securities that accrue interest at variable rates would be expected to benefit from a 100 basis points increase in interest rates because these securities would generate higher levels of current income and therefore positively impact interest and dividend income. In the cases where our funds pay management fees based on NAV, we would expect our segment management fees to experience a change in direction and magnitude corresponding to that experienced by the underlying portfolios.
Credit Risk
We are party to agreements providing for various financial services and transactions that contain an element of risk in the event that the counterparties are unable to meet the terms of such agreements. In such agreements, we depend on the respective counterparty to make payment or otherwise perform. We generally endeavor to minimize our risk of exposure by limiting to reputable financial institutions the counterparties with which we enter into financial transactions. In other circumstances, availability of financing from financial institutions may be uncertain due to market events, and we may not be able to access these financing markets.
Item 8. Financial Statements and Supplementary Data
The information required by this item is incorporated by reference to the consolidated financial statements and accompanying notes set forth in the F pages of this Annual Report on Form 10-K.
Item 9. Changes In And Disagreements With Accountants On Accounting And Financial Disclosure
None.
Item 9A. Controls And Procedures
Evaluation of Disclosure Controls and Procedures
We maintain disclosure controls and procedures (as that term is defined in Rules 13a‑15(e) and 15d‑15(e) under the Exchange Act) that are designed to ensure that information required to be disclosed in our reports under the Exchange Act is recorded, processed, summarized and reported within the time periods specified in the SEC’s rules and forms, and that such information is accumulated and communicated to our management, including our co-principal executive officers and principal financial officer, as appropriate, to allow timely decisions regarding required disclosures. Any controls and procedures, no matter how well designed and operated, can provide only reasonable assurance of achieving the desired control objectives. Our management, with the participation of our principal executive officer and principal financial officer, has evaluated the effectiveness of the design and operation of our disclosure controls and procedures as of December 31, 2018. Based upon that evaluation and subject to the foregoing, our principal executive officers and principal financial officer concluded that, as of December 31, 2018, the design and operation of our disclosure controls and procedures were effective to accomplish their objectives at the reasonable assurance level.
Changes in Internal Control over Financial Reporting
There have been no changes in our internal control over financial reporting (as defined in Rule 13a‑15(f) and 15d‑15(f) under the Exchange Act) during the quarter ended December 31, 2018 that have materially affected, or that are reasonably likely to materially affect, our internal control over financial reporting.
Report of Management on Internal Control Over Financial Reporting
Our management is responsible for establishing and maintaining adequate internal control over financial reporting for the Company. Internal control over financial reporting is a process to provide reasonable assurance regarding the reliability of our financial reporting for external purposes in accordance with accounting principles generally accepted in the United States of America. Internal control over financial reporting includes maintaining records that in reasonable detail accurately and fairly reflect our transactions; providing reasonable assurance that transactions are recorded as necessary for preparation of our consolidated financial statements; providing reasonable assurance that receipts and expenditures of company assets are made in accordance with management authorization; and providing reasonable assurance that unauthorized acquisition, use or disposition of company assets that could have a material effect on our consolidated financial statements would be prevented or detected on a timely basis. Because of its inherent limitations, internal control over financial reporting is not intended to provide absolute assurance that a material misstatement of our consolidated financial statements would be prevented or detected.
Management conducted an evaluation of the effectiveness of our internal control over financial reporting based on the framework in Internal Control — Integrated Framework (2013) issued by the Committee of Sponsoring Organizations of the Treadway Commission. Based on this evaluation, management concluded that the Company's internal control over financial reporting was effective as of December 31, 2018. The Company's independent registered public accounting firm, Ernst & Young LLP, has issued an audit report on the effectiveness of the Company's internal control over financial reporting. Their report follows.
Report of Independent Registered Public Accounting Firm
To the Stockholders and Board of Directors of Ares Management Corporation
Opinion on Internal Control Over Financial Reporting
We have audited Ares Management Corporation’s internal control over financial reporting as of December 31, 2018, based on criteria established in Internal Control-Integrated Framework issued by the Committee of Sponsoring Organizations of the Treadway Commission (2013 framework) (the “COSO criteria”). In our opinion, Ares Management Corporation (the “Company”) maintained, in all material respects, effective internal control over financial reporting as of December 31, 2018, based on the COSO criteria.
We also have audited, in accordance with the standards of the Public Company Accounting Oversight Board (United States) (“PCAOB”), the consolidated statements of financial condition of the Company as of December 31, 2018 and 2017, the related consolidated statements of operations, comprehensive income, changes in equity and cash flows for each of the three years in the period ended December 31, 2018, and the related notes and our report dated February 26, 2019 expressed an unqualified opinion thereon.
Basis for Opinion
The Company’s management is responsible for maintaining effective internal control over financial reporting and for its assessment of the effectiveness of internal control over financial reporting included in the accompanying Report of Management on Internal Control Over Financial Reporting. Our responsibility is to express an opinion on the Company’s internal control over financial reporting based on our audit. We are a public accounting firm registered with the PCAOB and are required to be independent with respect to the Company in accordance with the U.S. federal securities laws and the applicable rules and regulations of the Securities and Exchange Commission and the PCAOB.
We conducted our audit in accordance with the standards of the PCAOB. Those standards require that we plan and perform the audit to obtain reasonable assurance about whether effective internal control over financial reporting was maintained in all material respects.
Our audit included obtaining an understanding of internal control over financial reporting, assessing the risk that a material weakness exists, testing and evaluating the design and operating effectiveness of internal control based on the assessed risk, and performing such other procedures as we considered necessary in the circumstances. We believe that our audit provides a reasonable basis for our opinion.
Definition and Limitations of Internal Control Over Financial Reporting
A company’s internal control over financial reporting is a process designed to provide reasonable assurance regarding the reliability of financial reporting and the preparation of financial statements for external purposes in accordance with generally accepted accounting principles. A company’s internal control over financial reporting includes those policies and procedures that (1) pertain to the maintenance of records that, in reasonable detail, accurately and fairly reflect the transactions and dispositions of the assets of the company; (2) provide reasonable assurance that transactions are recorded as necessary to permit preparation of financial statements in accordance with generally accepted accounting principles, and that receipts and expenditures of the company are being made only in accordance with authorizations of management and directors of the company; and (3) provide reasonable assurance regarding prevention or timely detection of unauthorized acquisition, use, or disposition of the company’s assets that could have a material effect on the financial statements.
Because of its inherent limitations, internal control over financial reporting may not prevent or detect misstatements. Also, projections of any evaluation of effectiveness to future periods are subject to the risk that controls may become inadequate because of changes in conditions, or that the degree of compliance with the policies or procedures may deteriorate.
/s/ Ernst & Young LLP
Los Angeles, California
February 26, 2019
Item 9B. Other Information
We are providing the following supplemental information about economic net income ("ENI") on a voluntary basis for historical comparability purposes. ENI, a non-GAAP measure, was a historical operating metric used by management to evaluate total operating performance, a decision tool for deployment of resources and an assessment of the performance of our business segments. ENI differs from net income by excluding (a) income tax expense, (b) operating results of our Consolidated Funds, (c) depreciation and amortization expense, (d) the effects of changes arising from corporate actions and (e) certain other items that we believe are not indicative of our total operating performance. Changes arising from corporate actions include equity-based compensation expenses, the amortization of intangible assets, transaction costs associated with mergers, acquisitions and capital transactions, underwriting costs and expenses incurred in connection with corporate reorganization. Beginning in 2018, placement fees are no longer excluded but are amortized to match the period over which management fees are recognized.
The following table reconciles income before taxes to Realized Income and ENI for the years ended December 31, 2018, 2017 and 2016 ($ in thousands):
| For the Years Ended December 31, | |||||||||||
| 2018 | 2017 | 2016 | |||||||||
| Income before taxes | $ | 184,341 | $ | 149,859 | $ | 297,920 | |||||
| Adjustments: | |||||||||||
| Amortization of intangibles | 9,032 | 17,850 | 26,638 | ||||||||
| Depreciation expense | 16,055 | 12,631 | 8,215 | ||||||||
| Equity compensation expenses | 89,724 | 69,711 | 39,065 | ||||||||
| Acquisition and merger-related expenses | 2,936 | 259,899 | (16,902 | ) | |||||||
| Placement fees and underwriting costs | 20,343 | 19,765 | 6,424 | ||||||||
| Other (income) expense | 13,489 | (1,042 | ) | (1,728 | ) | ||||||
| Expense of non-controlling interests in consolidated subsidiaries | 3,343 | 1,739 | — | ||||||||
| Income before taxes of non-controlling interests in Consolidated Funds, net of eliminations | (20,643 | ) | (62,705 | ) | (2,649 | ) | |||||
| Total consolidation adjustments and reconciling items | 134,279 | 317,848 | 59,063 | ||||||||
| Economic Net Income | 318,620 | 467,707 | 356,983 | ||||||||
| Total performance (income) loss - unrealized | 247,212 | (325,915 | ) | (228,472 | ) | ||||||
| Total performance related compensation - unrealized | (221,343 | ) | 237,392 | 189,582 | |||||||
| Total net investment (income) loss - unrealized | 50,907 | (53,744 | ) | (17,765 | ) | ||||||
| Realized Income | $ | 395,396 | $ | 325,440 | $ | 300,328 |
PART III.
Item 10. DIRECTORS, EXECUTIVE OFFICERS AND CORPORATE GOVERNANCE
The information required by this item is incorporated by reference to our definitive Proxy Statement for the 2019 Annual Meeting of Stockholders to be filed with the Securities and Exchange Commission within 120 days of December 31, 2018.
Item 11. EXECUTIVE COMPENSATION
The information required by this item is incorporated by reference to our definitive Proxy Statement for the 2019 Annual Meeting of Stockholders to be filed with the Securities and Exchange Commission within 120 days of December 31, 2018.
Item 12. SECURITY OWNERSHIP OF CERTAIN BENEFICIAL OWNERS AND MANAGEMENT AND RELATED SHAREHOLDER MATTERS
The information required by this item is incorporated by reference to our definitive Proxy Statement for the 2019 Annual Meeting of Stockholders to be filed with the Securities and Exchange Commission within 120 days of December 31, 2018.
Item 13. CERTAIN RELATIONSHIPS AND RELATED TRANSACTIONS, AND DIRECTOR INDEPENDENCE
The information required by this item is incorporated by reference to our definitive Proxy Statement for the 2019 Annual Meeting of Stockholders to be filed with the Securities and Exchange Commission within 120 days of December 31, 2018.
Item 14. PRINCIPAL ACCOUNTANT FEES AND SERVICES
The information required by this item is incorporated by reference to our definitive Proxy Statement for the 2019 Annual Meeting of Stockholders to be filed with the Securities and Exchange Commission within 120 days of December 31, 2018.
PART IV.
Item 15. Exhibits, Financial Statement Schedules
(a)Documents Filed with Report:
| Report of Independent Registered Public Accounting Firm |
| Consolidated Statements of Financial Condition as of December 31, 2018 and 2017 |
| Consolidated Statements of Operations for the years ended December 31, 2018, 2017 and 2016 |
| Consolidated Statements of Comprehensive Income for the years ended December 31, 2018, 2017 and 2016 |
| Consolidated Statements of Changes in Equity for the years ended December 31, 2018, 2017 and 2016 |
| Consolidated Statements of Cash Flows for the years ended December 31, 2018, 2017 and 2016 |
| Notes to Consolidated Financial Statements |
(b)Exhibits.
The following is a list of all exhibits filed or furnished as part of this report.
| Exhibit No. | Description | |
| 3.1 | Certificate of Incorporation of Ares Management Corporation (incorporated by reference to Exhibit 99.3 to the Registrant’s Current Report on Form 8-K (File No. 001-36429) filed with the SEC on November 15, 2018). | |
| 3.2 | Bylaws of Ares Management Corporation (incorporated by reference to Exhibit 99.4 to the Registrant’s Current Report on Form 8-K (File No. 001-36429) filed with the SEC on November 15, 2018). | |
| 4.1 | Indenture dated as of October 8, 2014 among Ares Finance Co. LLC, Ares Management, L.P., Ares Holdings Inc., Ares Domestic Holdings Inc., Ares Real Estate Holdings LLC, Ares Holdings L.P., Ares Domestic Holdings L.P., Ares Investments L.P., Ares Real Estate Holdings L.P., Ares Management LLC, Ares Investments Holdings LLC and U.S. Bank National Association, as trustee (incorporated by reference to Exhibit 4.1 to the Registrant’s Current Report on Form 8‑K (File No. 001‑36429) filed with the SEC on October 8, 2014). | |
| 4.2 | First Supplemental Indenture dated as of October 8, 2014 among Ares Finance Co. LLC, Ares Management, L.P., Ares Holdings Inc., Ares Domestic Holdings Inc., Ares Real Estate Holdings LLC, Ares Holdings L.P., Ares Domestic Holdings L.P., Ares Investments L.P., Ares Real Estate Holdings L.P., Ares Management LLC, Ares Investments Holdings LLC and U.S. Bank National Association, as trustee (incorporated by reference to Exhibit 4.2 to the Registrant’s Current Report on Form 8‑K (File No. 001‑36429) filed with the SEC on October 8, 2014). | |
| 4.3 | First Amendment, dated as of August 7, 2015, to the First Supplemental Indenture, dated October 8, 2014, to the indenture, dated October 8, 2014, among Ares Finance Co. LLC, the guarantors party thereto and U.S. Bank National Association, as trustee (incorporated by reference to Exhibit 10.2 to the Registrant's Current Report on Form 8-K (File No. 001-36429) filed with the SEC on August 7, 2015). | |
| 4.4 | Form of 4.000% Senior Note due 2024 (incorporated by reference to Exhibit 4.3 to the Registrant’s Current Report on Form 8‑K (File No. 001‑36429) filed with the SEC on October 8, 2014). | |
| 4.5 | Form of 7.00% Series A Preferred Stock Certificate (incorporated by reference to Exhibit 99.5 to the Registrant’s Current Report on Form 8-K (File No. 001-36429) filed with the SEC on November 15, 2018). | |
| 10.1* | Third Amended and Restated Limited Partnership Agreement of Ares Holdings L.P., dated November 26, 2018. | |
| 10.2* | Fourth Amended and Restated Limited Partnership Agreement of Ares Offshore Holdings L.P. dated November 26, 2018. | |
| 10.3* | Third Amended and Restated Limited Partnership Agreement of Ares Investments L.P. dated November 26, 2018. | |
| 10.4* | Investor Rights Agreement. | |
| 10.5 | Second Amended & Restated 2014 Equity Incentive Plan (incorporated by reference to Exhibit 10.1 to the Registrant’s Registration Statement on Form S-8 POS (File No. 333-225271) filed with the SEC on November 26, 2018). # | |
| 10.6* | Fourth Amended and Restated Exchange Agreement, dated as of November 26, 2018. |
| Exhibit No. | Description | |
| 10.7* | Second Amended and Restated Tax Receivable Agreement. | |
| 10.8 | Sixth Amended and Restated Credit Agreement, dated as of April 21, 2014, by and among Ares Holdings LLC, Ares Domestic Holdings L.P., Ares Investments LLC, Ares Real Estate Holdings L.P., the Guarantors party thereto, the Lenders party thereto and JPMorgan Chase Bank, N.A. (incorporated by reference to Exhibit 10.10 to the Registrant’s Registration Statement on Form S‑1/A (File No. 333‑194919) filed with the SEC on April 28, 2014). | |
| 10.9 | Amendment No. 1, dated as of July 15, 2014, to the Sixth Amended and Restated Credit Agreement, dated as of April 21, 2014, by and among Ares Holdings LLC, Ares Domestic Holdings L.P., Ares Investments LLC, Ares Real Estate Holdings L.P., the Guarantors party thereto, the Lenders party thereto and JPMorgan Chase Bank, N.A. (incorporated by reference to Exhibit 10.1 to the Registrant’s Quarterly Report on Form 10‑Q (File No. 001‑36429) filed with the SEC on November 12, 2014). | |
| 10.10 | Amendment No. 2, dated as of September 24, 2014, to the Sixth Amended and Restated Credit Agreement, dated as of April 21, 2014, by and among Ares Holdings LLC, Ares Domestic Holdings L.P., Ares Investments LLC, Ares Real Estate Holdings L.P., the Guarantors party thereto, the Lenders party thereto and JPMorgan Chase Bank, N.A. (incorporated by reference to Exhibit 10.2 to the Registrant’s Quarterly Report on Form 10‑Q (File No. 001‑36429) filed with the SEC on November 12, 2014). | |
| 10.11 | Amendment No. 3, dated as of July 23, 2015, to the Sixth Amended and Restated Credit Agreement, dated as of April 21, 2014, by and among Ares Holdings LLC, Ares Domestic Holdings L.P., Ares Investments LLC, Ares Real Estate Holdings L.P., the Guarantors party thereto, the Lenders party thereto and JPMorgan Chase Bank, N.A. (incorporated by reference to Exhibit 10.1 to the Registrant’s Current Report on Form 8‑K (File No. 001‑36429) filed with the SEC on July 28, 2015). | |
| 10.12 | Amendment No. 4, dated as of August 5, 2015, to the Sixth Amended and Restated Credit Agreement, dated as of April 21, 2014, by and among Ares Holdings LLC, Ares Domestic Holdings L.P., Ares Investments LLC, Ares Real Estate Holdings L.P., the Guarantors party thereto, the Lenders party thereto and JPMorgan Chase Bank, N.A. (incorporated by reference to Exhibit 10.1 to the Registrant’s Current Report on Form 8‑K (File No. 001‑36429) filed with the SEC on August 7, 2015). | |
| 10.13 | Amendment No. 5, dated as of December 16, 2015, to the Sixth Amended and Restated Credit Agreement, dated as of April 21, 2014, by and among Ares Holdings LLC, Ares Domestic Holdings L.P., Ares Investments LLC, Ares Real Estate Holdings L.P., the Guarantors party thereto, the Lenders party thereto and JPMorgan Chase Bank, N.A. (incorporated by reference to Exhibit 10.1 to the Registrant’s Current Report on Form 8‑K (File No. 001‑36429) filed with the SEC on December 21, 2015). | |
| 10.14 | Amendment No. 6, dated as of May 23, 2016, to the Sixth Amended and Restated Credit Agreement, dated as of April 21, 2014, by and among Ares Holdings LLC, Ares Domestic Holdings L.P., Ares Investments LLC, Ares Real Estate Holdings L.P., the Guarantors party thereto, the Lenders party thereto and JPMorgan Chase Bank, N.A. (incorporated by reference to Exhibit 10.1 to the Registrant’s Current Report on Form 8-K (File No. 001-36429) filed with the SEC on May 26, 2016). | |
| 10.15 | Amendment No. 7, dated as of February 24, 2017, to the Sixth Amended and Restated Credit Agreement, dated as of April 21, 2014, by and among Ares Holdings L.P., Ares Investments L.P., the Guarantors party thereto, the Lenders party thereto and JPMorgan Chase Bank, N.A. (incorporated by reference to Exhibit 10.15 to the Registrant’s Annual Report on Form 10-K for the year ended December 31, 2016 (File No. 001-36429, filed with the SEC on February 27, 2017). | |
| 10.16 | Restated Investment Advisory and Management Agreement between Ares Capital Corporation and Ares Capital Management LLC, dated as of June 6, 2011 (incorporated by reference to Exhibit 10.11 to the Registrant’s Registration Statement on Form S‑1/A (File No. 333‑194919) filed with the SEC on April 16, 2014). | |
| 10.17* | Form of Indemnification Agreement. # | |
| 10.18 | Form of Restricted Unit Agreement under the Second Amended & Restated 2014 Equity Incentive Plan (incorporated by reference to Exhibit 10.2 to the Registrant’s Registration Statement on Form S-8 POS (File No. 333-225271) filed with the SEC on November 26, 2018). # . | |
| 10.19* | Form of Option Agreement under the Second Amended & Restated 2014 Equity Incentive Plan. # | |
| 10.20* | Form of Phantom Unit Agreement under the Second Amended & Restated 2014 Equity Incentive Plan. # | |
| 10.21 | Form of ARCC Incentive Fee Award (incorporated by reference to Exhibit 10.16 to the Registrant’s Registration Statement on Form S‑1/A (File No. 333‑194919) filed with the SEC on April 11, 2014). | |
| 10.22 | Form of Amended and Restated Limited Partnership Agreement of Carry Vehicles (incorporated by reference to Exhibit 10.28 to the Registrant’s Annual Report on Form 10-K for the year ended December 31, 2015 (File No. 001-36429, filed with the SEC on February 29, 2016). | |
| 10.23 | Form of Supplemental Award Agreement for Carried Interest (incorporated by reference to Exhibit 10.29 to the Registrant’s Annual Report on Form 10-K for the year ended December 31, 2015 (File No. 001-36429, filed with the SEC on February 29, 2016). |
| Exhibit No. | Description | |
| 10.24 | Form of Annual Incentive Fee Award Letter (incorporated by reference to Exhibit 10.24 to the Registrant’s Annual Report on Form 10-K for the year ended December 31, 2016 (File No. 001-36429, filed with the SEC on February 27, 2017). | |
| 10.25 | Form of Deferred Restricted Unit Agreement under the Second Amended & Restated 2014 Equity Incentive Plan (incorporated by reference to Exhibit 10.3 to the Registrant’s Registration Statement on Form S-8 POS (File No. 333-225271) filed with the SEC on November 26, 2018). # | |
| 10.26 | Offer Letter for Michael R. McFerran, dated March 10, 2015 (incorporated by reference to Exhibit 10.26 to the Registrant’s Annual Report on Form 10-K (File No. 001-36429) filed with the SEC on March 20, 2015). | |
| 10.27 | Transaction Support and Fee Waiver Agreement, dated May 23, 2016, between Ares Capital Corporation and Ares Capital Management LLC (incorporated by reference to Exhibit 10.2 to the Registrant’s Current Report on Form 8-K (File No. 001-36429) filed with the SEC on May 26, 2016). | |
| 10.28 | Form of Director Restricted Unit Agreement under the Second Amended & Restated 2014 Equity Incentive Plan (incorporated by reference to Exhibit 10.4 to the Registrant’s Registration Statement on Form S-8 POS (File No. 333-225271) filed with the SEC on November 26, 2018). # | |
| 10.29 | Restricted Unit Agreement, dated as of July 31, 2018, by and between Michael J Arougheti and Ares Management, L.P. (incorporated by reference to Exhibit 10.1 to the Registrant’s Quarterly Report on Form 10-Q (File No. 001-36429) filed with the SEC on August 6, 2018). # | |
| 21.1* | Subsidiaries of Ares Management Corporation. | |
| 23.1* | Consent of Ernst and Young LLP. | |
| 31.1* | Certification of the Chief Executive Officer pursuant to Rule 13a‑14(a). | |
| 31.2* | Certification of the Chief Financial Officer pursuant to Rule 13a‑14(a). | |
| 32.1* | Certification of the Chief Executive Officer and Chief Financial Officer pursuant to 18 U.S.C. Section 1350. | |
| 101.INS* | XBRL Instance Document. | |
| 101.SCH* | XBRL Taxonomy Extension Schema Document. | |
| 101.CAL* | XBRL Taxonomy Extension Calculation Linkbase Document. | |
| 101.DEF* | XBRL Taxonomy Extension Definition Linkbase Document. | |
| 101.LAB* | XBRL Taxonomy Extension Label Linkbase Document. | |
| 101.PRE* | XBRL Taxonomy Extension Presentation Linkbase Document. |
- Filed herewith.
Denotes a management contract or compensation plan or arrangement.
Item 16. Summary of 10-K
None.
SIGNATURES
Pursuant to the requirements of Section 13 or 15(d) of the Securities Exchange Act of 1934, the registrant has duly caused this report to be signed on its behalf by the undersigned, thereunto duly authorized.
| ARES MANAGEMENT CORPORATION | ||
| Dated: February 26, 2019 | By: | /s/ Michael J Arougheti |
| Michael J Arougheti | ||
| Co‑Founder, Chief Executive Officer & President |
Pursuant to the requirements of the Securities Exchange Act of 1934, this report has been signed below by the following persons on behalf of the registrant and in the capacities and on the dates indicated.
| By: | /s/ Antony P. Ressler | |||
| Name: | Antony P. Ressler | Dated: February 26, 2019 | ||
| Title: | Executive Chairman & Co‑Founder | |||
| By: | /s/ Michael J Arougheti | |||
| Name: | Michael J Arougheti | Dated: February 26, 2019 | ||
| Title: | Director, Co‑Founder, Chief Executive Officer & President (Principal Executive Officer) | |||
| By: | /s/ Michael R. McFerran | |||
| Name: | Michael R. McFerran | Dated: February 26, 2019 | ||
| Title: | Chief Financial Officer and Chief Operating Officer (Principal Financial and Accounting Officer) | |||
| By: | /s/ David B. Kaplan | |||
| Name: | David B. Kaplan | Dated: February 26, 2019 | ||
| Title: | Director, Co‑Founder & Partner | |||
| By: | /s/ John H. Kissick | |||
| Name: | John H. Kissick | Dated: February 26, 2019 | ||
| Title: | Director, Co‑Founder & Partner | |||
| By: | /s/ Bennett Rosenthal | |||
| Name: | Bennett Rosenthal | Dated: February 26, 2019 | ||
| Title: | Director, Co‑Founder & Partner | |||
| By: | /s/ Paul G. Joubert | |||
| Name: | Paul G. Joubert | Dated: February 26, 2019 | ||
| Title: | Director | |||
| By: | /s/ Michael Lynton | |||
| Name: | Michael Lynton | Dated: February 26, 2019 | ||
| Title: | Director | |||
| By: | /s/ Judy D. Olian | |||
| Name: | Dr. Judy D. Olian | Dated: February 26, 2019 | ||
| Title: | Director | |||
| By: | /s/ Antoinette Bush | |||
| Name: | Antoinette Bush | Dated: February 26, 2019 | ||
| Title: | Director |
INDEX TO CONSOLIDATED FINANCIAL STATEMENTS
| Report of Independent Registered Public Accounting Firm | F-2 | |
| Consolidated Statements of Financial Condition as of December 31, 2018 and 2017 | F-3 | |
| Consolidated Statements of Operations for the years ended December 31, 2018, 2017 and 2016 | F-4 | |
| Consolidated Statements of Comprehensive Income for the years ended December 31, 2018, 2017 and 2016 | F-5 | |
| Consolidated Statements of Changes in Equity for the years ended December 31, 2018, 2017 and 2016 | F-6 | |
| Consolidated Statements of Cash Flows for the years ended December 31, 2018, 2017 and 2016 | F-7 | |
| Notes to Consolidated Financial Statements | F-8 |
F-1
Report of Independent Registered Public Accounting Firm
To the Stockholders and Board of Directors of Ares Management Corporation
Opinion on the Financial Statements
We have audited the accompanying consolidated statements of financial condition of Ares Management Corporation (the “Company”) as of December 31, 2018 and 2017, the related consolidated statements of operations, comprehensive income, changes in equity and cash flows for each of the three years in the period ended December 31, 2018, and the related notes (collectively referred to as the “consolidated financial statements”). In our opinion, the consolidated financial statements present fairly, in all material respects, the financial position of the Company at December 31, 2018 and 2017, and the results of its operations and its cash flows for each of the three years in the period ended December 31, 2018, in conformity with U.S. generally accepted accounting principles.
We also have audited, in accordance with the standards of the Public Company Accounting Oversight Board (United States) (“PCAOB”), the Company's internal control over financial reporting as of December 31, 2018, based on criteria established in Internal Control-Integrated Framework issued by the Committee of Sponsoring Organizations of the Treadway Commission (2013 framework) and our report dated February 26, 2019 expressed an unqualified opinion thereon.
Adoption of New Accounting Standard
As discussed in Note 2 to the consolidated financial statements, the Company changed its method for accounting for revenue from contracts with customers in 2018.
Basis for Opinion
These financial statements are the responsibility of the Company's management. Our responsibility is to express an opinion on the Company’s financial statements based on our audits. We are a public accounting firm registered with the PCAOB and are required to be independent with respect to the Company in accordance with the U.S. federal securities laws and the applicable rules and regulations of the Securities and Exchange Commission and the PCAOB.
We conducted our audits in accordance with the standards of the PCAOB. Those standards require that we plan and perform the audit to obtain reasonable assurance about whether the financial statements are free of material misstatement, whether due to error or fraud. Our audits included performing procedures to assess the risks of material misstatement of the financial statements, whether due to error or fraud, and performing procedures that respond to those risks. Such procedures included examining, on a test basis, evidence regarding the amounts and disclosures in the financial statements. Our audits also included evaluating the accounting principles used and significant estimates made by management, as well as evaluating the overall presentation of the financial statements. We believe that our audits provide a reasonable basis for our opinion.
/s/ Ernst & Young LLP
We have served as the Company’s auditor since 2011.
Los Angeles, California
February 26, 2019
F-2
Ares Management Corporation
Consolidated Statements of Financial Condition
(Amounts in Thousands, Except Share Data)
| As of December 31, | |||||||
| 2018 | 2017 | ||||||
| Assets | As Adjusted | ||||||
| Cash and cash equivalents | $ | 110,247 | $ | 118,929 | |||
| Investments (includes accrued carried interest of $841,079 and $1,077,236, at December 31, 2018 and December 31, 2017, respectively) | 1,326,137 | 1,724,571 | |||||
| Due from affiliates | 199,377 | 165,750 | |||||
| Deferred tax asset, net | 42,137 | 8,326 | |||||
| Other assets | 160,150 | 130,341 | |||||
| Intangible assets, net | 31,578 | 40,465 | |||||
| Goodwill | 143,786 | 143,895 | |||||
| Assets of Consolidated Funds: | |||||||
| Cash and cash equivalents | 384,644 | 556,500 | |||||
| Investments, at fair value | 7,673,165 | 5,582,842 | |||||
| Due from affiliates | 17,609 | 15,884 | |||||
| Dividends and interest receivable | 19,330 | 12,568 | |||||
| Receivable for securities sold | 42,076 | 61,462 | |||||
| Other assets | 4,456 | 1,989 | |||||
| Total assets | $ | 10,154,692 | $ | 8,563,522 | |||
| Liabilities | |||||||
| Accounts payable, accrued expenses and other liabilities | $ | 83,221 | $ | 81,955 | |||
| Accrued compensation | 29,389 | 27,978 | |||||
| Due to affiliates | 82,411 | 39,184 | |||||
| Performance related compensation payable | 641,737 | 822,084 | |||||
| Debt obligations | 48 |
Showing the first 8K of 302K characters. Open the full section