 filings.tools
Item 7. Management’s Discussion And Analysis Of Financial Condition And Results Of Operations
250K characters. Original on sec.gov · Markdown
Item 7. Management’s Discussion And Analysis Of Financial Condition And Results Of Operations
Ares Management Corporation is a Delaware corporation which was formerly a limited partnership formed on November 15, 2013 and which converted to a Delaware corporation effective on November 26, 2018. Unless the context otherwise requires, references to “we,” “us,” “our,” and “the Company” are intended to mean the business and operations of Ares Management Corporation and its consolidated subsidiaries. The following discussion analyzes the financial condition and results of operations of the Company. “Consolidated Funds” refers collectively to certain Ares‑affiliated funds, related co‑investment entities and certain CLOs that are required under generally accepted accounting principles in the United States (“GAAP”) to be consolidated in our consolidated financial statements included in this Annual Report on Form 10‑K. Additional terms used by the Company are defined in the Glossary and throughout the Management's Discussion and Analysis in this Annual Report on Form 10-K.
The following discussion and analysis should be read in conjunction with the audited, consolidated financial statements of Ares Management Corporation and the related notes included in this Annual Report on Form 10‑K.
Amounts and percentages presented throughout our discussion and analysis of financial condition and results of operations may reflect rounded results in thousands (unless otherwise indicated) and consequently, totals may not appear to sum.
Our Business
We are a leading global alternative asset manager that operates through three distinct but complementary investment groups, which are our reportable segments. During the year ended December 31, 2018, we reclassified certain expenses from OMG to our operating segments. We have presented our reportable segments for the years ended December 31, 2017 and 2016 to conform to the year ended December 31, 2018 presentation.
Our three operating segments are:
| • | Credit Group: Our Credit Group is a leading manager of credit strategies across the non-investment grade credit universe in the U.S. and Europe, with approximately $95.9 billion of assets under management and 156 funds as of December 31, 2018. The Credit Group offers a range of credit strategies across the liquid and illiquid spectrum, including syndicated loans, high yield bonds, credit opportunities, alternative credit investments and U.S. and European direct lending. The Credit Group provides solutions for investors seeking to access public and private credit markets and capitalizes on opportunities across U.S. and Europe. It additionally provides investors access to directly originated fixed and floating rate credit assets and the ability to capitalize on illiquidity premiums across the credit spectrum. The Credit Group’s syndicated loans strategy focuses on liquid, traded non-investment grade secured loans to corporate borrowers. The high yield bond strategy seeks to deliver a diversified portfolio of liquid, traded non-investment grade corporate bonds, including secured, unsecured and subordinated debt instruments. Credit opportunities is a “go anywhere” strategy seeking to capitalize on market inefficiencies and relative value opportunities across the capital structure. The alternative credit strategy seeks investment opportunities that fall outside of traditional, well-defined markets such as corporate debt, real estate and private equity. Alternative credit investments include certain structural features designed to protect value and minimize loss such as asset security, seniority, covenants, and cash flow prioritization. These investments include asset-backed securities, specialty assets, real assets, and structured credit. We are one of the largest self-originating direct lenders to the U.S. and European middle markets, providing one-stop financing solutions for small-to-medium sized companies, which we believe are increasingly underserved by traditional lenders. We provide investors access to these capabilities through several vehicles, including commingled funds, separately managed accounts and a publicly traded vehicle. The Credit Group conducts its U.S. corporate lending activities primarily through ARCC, the largest business development company as of December 31, 2018, by both market capitalization and total assets. In addition, the Credit Group manages a commercial finance business that provides asset-based and cash flow loans to small and middle-market companies, as well as asset-based facilities to specialty finance companies. The Credit Group’s European direct lending platform is one of the most significant participants in the European middle-market, focusing on self-originated investments in illiquid middle-market credits. |
| • | Private Equity Group: Our Private Equity Group had approximately $23.5 billion of assets under management as of December 31, 2018, broadly categorizing its investment strategies as corporate private equity, infrastructure and power, special opportunities and energy opportunities. As of December 31, 2018, the group managed five corporate private equity commingled funds focused on North America and Europe and three focused on greater China, five commingled funds and six related co-investment vehicles focused on infrastructure and power, two commingled special opportunities funds and our first energy opportunities fund. In our North American and European flexible capital strategy, we target opportunistic majority or shared-control investments in businesses with strong franchises and attractive growth opportunities in North America and Europe. The infrastructure and power strategy targets infrastructure-related assets across the power generation, transmission, midstream sectors and renewables sectors seeking attractive risk-adjusted equity returns with current cash flow and capital appreciation. The special opportunities strategy seeks to invest opportunistically across a broad spectrum of distressed and opportunistic investments, including rescue direct lending, opportunistic financing, comprehensive recapitalization solutions, stressed/distressed debt and post reorganization securities. The energy opportunities strategy targets investments in the energy industry where its flexible capital can provide attractive risk-adjusted returns while mitigating commodity risk. |
| • | Real Estate Group: Our Real Estate Group manages comprehensive equity and debt strategies, with approximately $11.3 billion of assets under management across 43 funds as of December 31, 2018. Real Estate equity strategies focus on applying hands-on value creation initiatives to mismanaged and capital-starved assets, as well as new development, ultimately selling stabilized assets back into the market. The Real Estate Group manages both a value-add strategy and an opportunistic strategy. The value-add strategy seeks to create value by buying assets at attractive valuations and through active asset management of income-producing properties across the U.S. and Western Europe. The opportunistic strategy focuses on manufacturing core assets through development, redevelopment and fixing distressed capital structures across major property types in the U.S. and Europe. The Company’s debt strategies leverage the Real Estate Group’s diverse sources of capital to directly originate and manage commercial mortgage investments on properties that range from stabilized to requiring hands-on value creation. In addition to managing private debt funds, the Real Estate Group makes debt investments through a publicly traded commercial mortgage REIT, ACRE. |
The Operations Management Group (the “OMG”) consists of shared resource groups to support our operating segments by providing infrastructure and administrative support in the areas of accounting/finance, operations, information technology, strategy and relationship management, legal, compliance and human resources. Additionally, the OMG provides services to certain of our investment companies and partnerships, which reimburse the OMG for expenses equal to the cost of services provided. The OMG’s expenses are not allocated to our three reportable segments but we consider the cost structure of the OMG when evaluating our financial performance.
The focus of our business model is to provide our investment management capabilities through various funds and products that meet the needs of a wide range of institutional and retail investors. Our revenues primarily consist of management fees, carried interest allocation, incentive fees, as well as principal investment income, administrative expense reimbursements and transaction fees. Management fees are generally based on a defined percentage of average fair value of assets, total commitments, invested capital, net asset value, net investment income or par value of the investment portfolios we manage. Carried interest allocation and incentive fees are based on certain specific hurdle rates as defined in the funds' applicable investment management or partnership agreements. Carried interest allocation and incentive fees are collectively referred to as performance income in our segment results and non-GAAP measures. Principal investment income consists of interest and dividend income and net realized and unrealized gain (loss) from the equity method investments that we manage. Other income (expense) typically represents investment income, realized gains (losses) and unrealized appreciation (depreciation) resulting from all of our other investments as well as investments of the Consolidated Funds. Interest expense is a component of other income (expense). We provide administrative services to certain of our affiliated funds that are presented within administrative, transaction and other fees for GAAP reporting but are netted against the respective expenses for segment reporting purposes. We also receive transaction fees from certain funds for activities related to fund transactions, such as loan originations. In accordance with GAAP, we are required to consolidate funds where we have a significant economic interest and substantive control rights. However, for segment reporting purposes, we present revenues and expenses on a combined basis, which presents the results of our reportable segments without giving effect to the consolidation of the funds. Accordingly, our segment revenues consist of management fees, other fees, realized net performance income and realized net investment income. Our segment expenses consist of compensation and benefits, general, administrative and other expenses, interest expense and realized performance income compensation, net of administrative fees.
Trends Affecting Our Business
We believe that our disciplined investment philosophy across our three distinct but complementary investment groups contributes to the stability of our firm’s performance throughout market cycles. As December 31, 2018, approximately 72% of our assets under management were in funds with a remaining contractual life of three years or more, approximately 80% were in funds with an initial duration greater than seven years at time of closing, and 90% of our management fees are derived from permanent capital, CLOs and closed end funds. Our funds have a stable base of committed capital enabling us to invest in assets with a long-term focus over different points in a market cycle and to take advantage of market volatility. However, our results of operations, including the fair value of our AUM, are affected by a variety of factors, particularly in the United States and Western Europe, including conditions in the global financial markets and the economic and political environments.
The U.S. markets were volatile in the fourth quarter of 2018 as fund outflows accelerated, credit spreads widened and total returns were negative across most asset classes. Markets were impacted by a decidedly negative sentiment from various geopolitical headlines, U.S. Treasury yield curve flattening and subsequent late cycle concerns and a sharp decline in commodity prices. Negative sentiment was exacerbated in December 2018 by angst around Federal Reserve policy, the U.S. government shutdown and general political uncertainty, the seasonality of capital markets and concerns of a decelerating economy. Retail fund outflows accelerated with leveraged loan funds recording a record-breaking $11.6 billion of outflows in December 2018. Against this backdrop, the CSLLI, a leveraged loan index, returned a negative 2.3% in the fourth quarter of 2018 while the ICE BAML High Yield Master II Index, a high yield bond index, returned a negative 4.7% in the fourth quarter of 2018. The mixed technical backdrop influenced annual results as the leveraged loan and high yield bond markets returned 1.1% and a negative 2.3%, respectively, for 2018.
European markets followed a similar path as their U.S. counterparts during the fourth quarter of 2018 as geopolitical concerns, mixed corporate earnings and increased risk aversion influenced total returns. Brexit discussion developments, German and Italian politics and Italian rating downgrades weighed on investor sentiment and asset prices. In addition, Europe's lowest GDP growth in the past four years of 0.2% (versus market expectations of 0.4%) combined with mixed third quarter earnings resulted in a risk aversion that impacted the leveraged loan and high yield bond markets in November 2018. Against this backdrop, the Credit Suisse Western European Leveraged Loan Index returned a negative 1.8% while the ICE BAML European Currency High Yield Index returned a negative 3.6%. The European leveraged loan market was one of the few asset classes to have a positive return in 2018, concluding the calendar year with a 0.55% gain.
In the U.S., the S&P 500 Index reversed all gains for the year in the fourth quarter of 2018 after significant volatility in equity and credit markets pushed the index down 13.8% to close the year down 5.2% compared to an increase of 20.8% in 2017. Outside the U.S., global equity markets were also negatively affected during the fourth quarter of 2018 with the MSCI All Country World ex USA Index declining 11.5% in the fourth quarter of 2018, which pushed the index down 14.2% for the full year 2018 compared to the positive 27.2% gain recorded for the full year 2017.
Recent market volatility has created opportunities for our Credit group, particularly for our direct lending and alternative credit strategies, which utilize flexible investment mandates to manage portfolios throughout market cycles. As market conditions shift and default risk and interest rate risk come under greater focus, having the ability to move up and down the capital structure enables the Credit Group to reduce risk and enhance returns. Similarly, given our broad capabilities in leveraged loans, such flexibility enables our Credit Group to reduce sensitivities to changing interest rates by increasing allocations to floating rate leveraged loans. On a market value basis, over 78% of the debt assets within our Credit Group are floating rate instruments, which we believe helps mitigate volatility associated with changes in interest rates.
In the U.S., the intermediated private equity auction market remained highly competitive and leveraged buyout purchase price multiples remained near historical highs during 2018. Amid a significant expansion in the size of the corporate debt market, leverage levels continued to increase and were even higher when EBITDA-adjustments are taken into account. These dynamics have led to a significant compression in private equity risk premiums. We continue to believe careful company selection, a focus on high-quality assets and a differentiated view to drive value creation is of paramount importance in the current market environment.
In the U.S., 2018 commercial real estate sales volume and property values rose over last year . The apartment and industrial sectors posted record transaction activity, bringing total sales across all property sectors to the second highest level of the current cycle at $562 billion. The year-end 2018 spike in financial market volatility did not impact private real estate values meaningfully. Healthy property fundamentals kept vacancy near cyclical lows despite the increase in supply activity for apartment and industrial. In Europe, buoyed by economic growth, low interest rates, higher consumer spending, property supply and demand fundamentals were generally favorable. Across our targeted markets in both the U.S. and Europe, we continue to find opportunity to capitalize on our deep understanding of local market and overall industry dynamics to acquire and lend to commercial real estate.
Notwithstanding the potential opportunities represented by market volatility, future earnings, cash flows and distributions are affected by a range of factors, including realizations of our funds’ investments, which are subject to significant fluctuations.
In 2019, some of the considerations informing our strategic decisions include:
| • | Our ability to fundraise and increase AUM and fee paying AUM. During the year ended December 31, 2018, we raised $36.1 billion of gross AUM, both in commingled and separately managed accounts, and continued to expand our investor base, raising capital from over 75 different funds and approximately 270 institutional investors, including 139 direct institutional investors that were new to Ares. Our fundraising efforts helped drive AUM growth of approximately 23% for 2018. During 2019, we expect that our fundraising will come from a combination of our existing and new strategies primarily in the U.S and Europe. During the year ended December 31, 2018, we earned approximately 1.1% on our FPAUM, which was consistent with 2017. As of December 31, 2018, we also had $28.2 billion of AUM not yet earning fees, which represents approximately $281.3 million in annual potential management fee revenue. Of the $281.3 million, $245.5 million relates to the $24.8 billion of AUM available for future deployment. Our pipeline of potential fees, coupled with our future fundraising opportunities, gives us the potential to increase our management fees in 2019. |
| • | Our ability to attract new capital and investors with our broad multi‑asset class product offering. Our ability to attract new capital and investors in our funds is driven, in part, by the extent to which they continue to see the alternative asset management industry generally, and our investment products specifically, as an attractive vehicle for capital appreciation. We continually seek to create avenues to meet our investors’ evolving needs by offering an expansive range of investment funds, developing new products and creating managed accounts and other investment vehicles tailored to our investors’ goals. We continue to expand our distribution channels, seeking to meet the needs of insurance companies, as well as the needs of traditional institutional investors, such as pension funds, sovereign wealth funds, and endowments. If market volatility persists or increases, investors may seek absolute return strategies that seek to mitigate volatility. We offer a variety of investment strategies depending upon investors’ risk tolerance and expected returns. |
| • | Our disciplined investment approach and successful deployment of capital. Our ability to maintain and grow our revenue base is dependent upon our ability to successfully deploy the capital that our investors have committed to our investment funds. Greater competition, high valuations, cost of credit and other general market conditions have affected and may continue to affect our ability to identify and execute attractive investments. Under our disciplined investment approach, we deploy capital only when we have sourced a suitable investment opportunity at an attractive price. During the year ended December 31, 2018, we deployed $22.4 billion of gross capital across our three investment groups compared to approximately $16.4 billion deployed in 2017. As of December 31, 2018, we had $38.1 billion of capital available for investment and we remain well-positioned to invest our assets opportunistically. |
| • | Our ability to invest capital and generate returns through market cycles. The strength of our investment performance affects investors’ willingness to commit capital to our funds. The flexibility of the capital we are able to attract is one of the main drivers of the growth of our AUM and the management fees we earn. Current market conditions and a changing regulatory environment have created opportunities for Ares’ businesses, particularly in the Credit Group’s direct lending funds, and in the Private Equity's special opportunities funds, which utilize flexible investment mandates to manage portfolios through market cycles. |
| • | Our ability to continue to achieve stable dividend payments to investors. Our dividend policy for our Class A common stock is closely aligned with our core management fee business. We intend to provide a steady quarterly dividend for each calendar year that will be based on our after-tax fee related earnings, with future potential changes based on the level and growth of our after-tax fee related earnings. Our fixed dividend is reassessed each year based upon the level and growth of our after-tax fee related earnings. As fee related earnings reflect the core earnings of our business and consists of management fees less compensation and general and administrative expenses, having our recurring dividend based on this amount removes volatility from our dividend and enables investors to receive what we believe is an attractive after-tax qualifying dividend yield. |
See “Item 1A. Risk Factors” included in this Annual Report on Form 10‑K for a discussion of the risks to which our businesses are subject.
Conversion to a Corporation under Delaware State Law
On November 26, 2018, we completed our state law conversion from a Delaware limited partnership to a Delaware corporation (the "Conversion"). At the Effective Date, (i) each common share of the Company outstanding immediately prior to the Effective Date converted into one issued and outstanding, fully paid and nonassessable share of Class A common stock, $0.01 par value per share, of the Company, (ii) the general partner share of the Company outstanding immediately prior to the Effective Date converted into 1,000 issued and outstanding, fully paid and nonassessable shares of Class B common stock, $0.01 par value per share of the Company, (iii) the special voting share of the Company outstanding immediately prior to the Effective Date converted into one issued and outstanding, fully paid and nonassessable share of Class C common stock, $0.01 par value per share, of the Company, and (iv) each preferred share of the Company outstanding immediately prior to the Effective Date converted into one issued and outstanding, fully paid and nonassessable share of the Series A Preferred Stock.
As a result of the Conversion, except as otherwise expressly provided in the Certificate of Incorporation, our common stockholders are entitled to vote on all matters on which stockholders of a corporation are generally entitled to vote under the DGCL, including the election of our board of directors. Holders of shares of our Class A common stock became entitled to one vote per share of our Class A common stock. On any date on which the Ares Ownership Condition (as defined in the Certificate of Incorporation) is satisfied, holders of shares of our Class B common stock are, in the aggregate, entitled to a number of votes equal to (x) four times the aggregate number of votes attributable to our Class A common stock minus (y) the aggregate number of votes attributable to our Class C common stock. On any date on which the Ares Ownership Condition is not satisfied, holders of shares of our Class B common stock are not entitled to vote on any matter submitted to a vote of our stockholders. The holder of shares of our Class C common stock is generally entitled to a number of votes equal to the number of Ares Operating Group Units (as defined in the Certificate of Incorporation) held of record by each Ares Operating Group Limited Partner (as defined in the Certificate of Incorporation) other than the Company and its subsidiaries. Our Class B common stock and our Class C common stock are non-economic and holders thereof shall not be entitled to (i) dividends from the Company or (ii) receive any assets of the Company in the event of any dissolution, liquidation or winding up of the Company. Except as provided in the Certificate of Incorporation and the Company’s Bylaws and under the DGCL and the rules of the NYSE, shares of the Series A Preferred Stock are generally non-voting.
Since March 1, 2018, we have been treated as a corporation for federal and state income tax purposes (the "Tax Election"). Ownership of our shares does not generate any unrelated business taxable income ("UBTI") or income effectively connected with a U.S. trade or business ("ECI"). Distributions made after March 1, 2018 will be reported on Form 1099-DIV and stockholders may be eligible for the favorable tax rates applicable to qualified dividend income. The Conversion did not impact the treatment of UBTI, ECI or our distributions.
Further, other terminology has been modified to be consistent with a corporation's as opposed to a limited partnership's results; distributions are now referred to as dividends, and earnings per common unit are now referred to as earnings per common share. Comparative periods conform with the current period's presentation.
Asset managers structured as pass-through entities for income tax purposes have historically traded at substantial discounts to asset managers taxed as corporations. Further, we believe that our pass-through tax structure has historically limited our investor universe due to complexities related to this structure. The Tax Election and the subsequent Conversion is intended to simplify our tax structure and expand our eligible investor universe and, in turn, enhance our liquidity and trading volume, which may, among other things, provide us with a more liquid and attractive currency for potential strategic transactions to further long-term growth. Moreover, we historically have paid corporate level taxes on our fee related earnings, which has averaged over 80% of total fee income since our initial public offering. This fact, combined with a reduction in the statutory federal corporate tax rate from 35% to 21%, presented compelling reasons to make the Tax Election. The impact of the Tax Election on our reported results is primarily limited to increased tax expense on certain performance income, which was previously classified as pass-through income. Taxes on performance related income consist of current taxes on realized net performance income and deferred taxes on unrealized net performance income that may change in subsequent periods until such income is realized.
Consolidation and Deconsolidation of Ares Funds
Pursuant to GAAP, we consolidate the Consolidated Funds into our financial results as presented in this Annual Report on Form 10‑K. These funds represented approximately 6.8% of our AUM as of December 31, 2018, 4.1% of our management fees and 3.6% of our performance income for the year ended December 31, 2018. As of December 31, 2018, 2017 and 2016, we consolidated 13, 10 and 7 CLOs, respectively, and 10, 9 and 9 private funds, respectively.
Our CLOs serve as long-term, non-recourse financing for debt investments and as a way to minimize refinancing risk and maturity risk and secure a fixed cost of funds over an underlying market interest rate. As of December 31, 2018, our maximum
exposure of loss for CLO securities was $75.0 million on our balance sheet. The management of CLOs accounted for approximately 7% of our management fees for the year ended December 31, 2018.
The consolidation of these funds had the impact of increasing interest and other income of Consolidated Funds, interest expense of Consolidated Funds, net realized and unrealized gain (loss) on investment of Consolidated Funds and non-controlling interest in Consolidated Funds, among others, for the years ended December 31, 2018, 2017 and 2016. Also, the consolidation of these funds typically has the impact of decreasing management fees, carried interest allocation and incentive fees reported under GAAP to the extent these are eliminated upon consolidation. For the actual impact that consolidation had on our results, see the Consolidating Schedules within Note 17, “Consolidation”, to our consolidated financial statements included in this Annual Report on Form 10-K.
The assets and liabilities of our Consolidated Funds are held within separate legal entities and, as a result, the liabilities of our Consolidated Funds are non-recourse to us. Generally, the consolidation of our Consolidated Funds has a significant gross-up effect on our assets, liabilities and cash flows but has no net effect on the net income attributable to us. The net economic ownership interests of our Consolidated Funds, to which we have no economic rights, are reflected as non‑controlling interests in the Consolidated Funds in our consolidated financial statements.
We generally deconsolidate funds and CLOs when we are no longer deemed to have a controlling interest in the entity. During the year ended December 31, 2018, one entity was liquidated or dissolved and no non-VIEs experienced a significant change in ownership or control that resulted in deconsolidation during the period.
The performance of our Consolidated Funds is not necessarily consistent with, or representative of, the combined performance trends of all of our funds.
Managing Business Performance
Non‑GAAP Financial Measures
We use the following non-GAAP measures to assess and measure our performance:
| • | Fee Related Earnings (FRE) |
| • | Realized Income (RI) |
These non‑GAAP financial measures supplement and should be considered in addition to and not in lieu of the results of operations, which are discussed further under “—Components of Consolidated Results of Operations” and are prepared in accordance with GAAP. For the specific components and calculations of these non-GAAP measures, as well as a reconciliation of these measures to the most comparable measure in accordance with GAAP, see Note 16, “Segment Reporting,” to our consolidated financial statements included in this Annual Report on Form 10‑K.
Operating Metrics
We monitor certain operating metrics that are common to the alternative asset management industry, which are discussed below.
Assets Under Management
Assets under management refers to the assets we manage. We view AUM as a metric to measure our investment and fundraising performance as it reflects assets generally at fair value plus available uncalled capital. For our funds other than CLOs, our AUM equals the sum of the following:
| • | net asset value (“NAV”) of such funds; |
| • | the drawn and undrawn debt (at the fund‑level including amounts subject to restrictions); and |
| • | uncalled committed capital (including commitments to funds that have yet to commence their investment periods). |
NAV refers to the fair value of all the assets of a fund less the liabilities of the fund.
For CLOs, our AUM is equal to initial principal amounts adjusted for paydowns.
The tables below provide the period-to-period rollforwards of our total AUM by segment for the years ended December 31, 2018, 2017 and 2016 (in millions):
| Credit Group | Private Equity Group | Real Estate Group | Total AUM | ||||||||||||
| Balance at 12/31/2017 | $ | 71,732 | $ | 24,530 | $ | 10,229 | $ | 106,491 | |||||||
| Net new par/equity commitments | 21,105 | 1,498 | 2,847 | 25,450 | |||||||||||
| Net new debt commitments | 9,340 | 100 | 75 | 9,515 | |||||||||||
| Distributions | (7,744 | ) | (1,900 | ) | (2,209 | ) | (11,853 | ) | |||||||
| Change in fund value | 1,403 | (741 | ) | 398 | 1,060 | ||||||||||
| Balance at 12/31/2018 | $ | 95,836 | $ | 23,487 | $ | 11,340 | $ | 130,663 | |||||||
| Average AUM(1) | $ | 84,647 | $ | 23,784 | $ | 10,793 | $ | 119,224 |
| Credit Group | Private Equity Group | Real Estate Group | Total AUM | ||||||||||||
| Balance at 12/31/2016 | $ | 60,466 | $ | 25,041 | $ | 9,752 | $ | 95,259 | |||||||
| Acquisitions | 3,605 | — | — | 3,605 | |||||||||||
| Net new par/equity commitments | 8,670 | 356 | 800 | 9,826 | |||||||||||
| Net new debt commitments | 5,989 | — | 509 | 6,498 | |||||||||||
| Distributions | (10,852 | ) | (3,014 | ) | (1,599 | ) | (15,465 | ) | |||||||
| Change in fund value | 3,854 | 2,147 | 767 | 6,768 | |||||||||||
| Balance at 12/31/2017 | $ | 71,732 | $ | 24,530 | $ | 10,229 | $ | 106,491 | |||||||
| Average AUM(1) | $ | 67,071 | $ | 24,914 | $ | 10,261 | $ | 102,246 |
| Credit Group | Private Equity Group | Real Estate Group | Total AUM | ||||||||||||
| Balance at 12/31/2015 | $ | 60,386 | $ | 22,978 | $ | 10,268 | $ | 93,632 | |||||||
| Net new par/equity commitments | 5,453 | 2,314 | 840 | 8,607 | |||||||||||
| Net new debt commitments | 5,030 | — | 225 | 5,255 | |||||||||||
| Distributions | (11,968 | ) | (2,519 | ) | (1,813 | ) | (16,300 | ) | |||||||
| Change in fund value | 1,565 | 2,268 | 232 | 4,065 | |||||||||||
| Balance at 12/31/2016 | $ | 60,466 | $ | 25,041 | $ | 9,752 | $ | 95,259 | |||||||
| Average AUM(1) | $ | 60,297 | $ | 24,553 | $ | 10,144 | $ | 94,994 |
(1) Represents a five-point average of quarter-end balances for each period.
Please refer to “— Results of Operations by Segment” for a more detailed presentation of AUM by segment for each of the periods presented.
The graphs below present our Incentive Generating AUM and Incentive Eligible AUM by segment as of December 31, 2018, 2017 and 2016 (in millions):
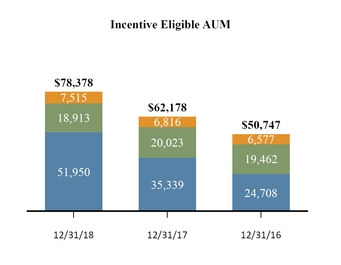
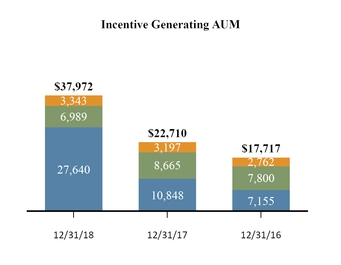
| Credit | Private Equity | Real Estate |
As of December 31, 2018, 2017 and 2016, our available capital, which we refer to as dry powder, was $38.1 billion, $25.1 billion and $23.2 billion, respectively, primarily attributable to our funds in the Credit Group and the Private Equity Group.
Fee Paying Assets Under Management
The following components generally comprise our FPAUM:
| • | The amount of limited partner capital commitments for certain closed-end funds within the reinvestment period in the Credit Group, funds in the Private Equity Group and certain private funds in the Real Estate Group; |
| • | The amount of limited partner invested capital for the aforementioned closed-end funds beyond the reinvestment period as well as the alternative credit funds in the Credit Group, certain managed accounts within their reinvestment period, the mezzanine fund in the Credit Group, European commingled funds in the Credit Group and co-invest vehicles in the Real Estate Group; |
| • | The gross amount of aggregate collateral balance, for CLOs, at par, adjusted for defaulted or discounted collateral; and |
| • | The portfolio value, gross asset value or NAV, adjusted in certain instances for cash or certain accrued expenses, for the remaining funds in the Credit Group, ARCC, certain managed accounts in the Credit Group and certain debt funds in the Real Estate Group. |
The tables below provide the period‑to‑period rollforwards of our total FPAUM by segment for the years ended December 31, 2018, 2017 and 2016 (in millions):
| Credit Group | Private Equity Group | Real Estate Group | Total | ||||||||||||
| FPAUM Balance at 12/31/2017 | $ | 49,450 | $ | 16,858 | $ | 6,189 | $ | 72,497 | |||||||
| Commitments | 4,768 | 1,049 | 1,580 | 7,397 | |||||||||||
| Subscriptions/deployment/increase in leverage | 10,434 | 896 | 678 | 12,008 | |||||||||||
| Redemptions/distributions/decrease in leverage | (6,788 | ) | (1,609 | ) | (1,134 | ) | (9,531 | ) | |||||||
| Change in fund value | (10 | ) | 6 | (20 | ) | (24 | ) | ||||||||
| Change in fee basis | (7 | ) | (129 | ) | (341 | ) | (477 | ) | |||||||
| FPAUM Balance at 12/31/2018 | $ | 57,847 | $ | 17,071 | $ | 6,952 | $ | 81,870 | |||||||
| Average FPAUM(1) | $ | 53,616 | $ | 16,760 | $ | 6,738 | $ | 77,114 |
| Credit Group | Private Equity Group | Real Estate Group | Total | ||||||||||||
| FPAUM Balance at 12/31/2016 | $ | 42,709 | $ | 11,314 | $ | 6,540 | $ | 60,563 | |||||||
| Acquisitions | 2,789 | — | — | 2,789 | |||||||||||
| Commitments | 5,060 | 7,955 | 665 | 13,680 | |||||||||||
| Subscriptions/deployment/increase in leverage | 5,094 | 1,122 | 582 | 6,798 | |||||||||||
| Redemptions/distributions/decrease in leverage | (8,733 | ) | (1,606 | ) | (841 | ) | (11,180 | ) | |||||||
| Change in fund value | 2,322 | (375 | ) | 183 | 2,130 | ||||||||||
| Change in fee basis | 209 | (1,552 | ) | (940 | ) | (2,283 | ) | ||||||||
| FPAUM Balance at 12/31/2017 | $ | 49,450 | $ | 16,858 | $ | 6,189 | $ | 72,497 | |||||||
| Average FPAUM(1) | $ | 46,598 | $ | 15,886 | $ | 6,547 | $ | 69,031 |
| Credit Group | Private Equity Group | Real Estate Group | Total | ||||||||||||
| FPAUM Balance at 12/31/2015 | $ | 39,925 | $ | 12,462 | $ | 6,757 | $ | 59,144 | |||||||
| Commitments | 3,631 | 159 | 462 | 4,252 | |||||||||||
| Subscriptions/deployment/increase in leverage | 3,712 | 93 | 630 | 4,435 | |||||||||||
| Redemptions/distributions/decrease in leverage | (5,815 | ) | (665 | ) | (1,019 | ) | (7,499 | ) | |||||||
| Change in fund value | 1,316 | (168 | ) | (58 | ) | 1,090 | |||||||||
| Change in fee basis | (60 | ) | (567 | ) | (232 | ) | (859 | ) | |||||||
| FPAUM Balance at 12/31/2016 | $ | 42,709 | $ | 11,314 | $ | 6,540 | $ | 60,563 | |||||||
| Average FPAUM(1) | $ | 40,938 | $ | 11,800 | $ | 6,669 | $ | 59,407 |
(1) Represents a five-point average of quarter-end balances for each period.
Please refer to “— Results of Operations by Segment” for detailed information by segment of the activity affecting total FPAUM for each of the periods presented.
The charts below present FPAUM by its fee basis as of December 31, 2018, 2017 and 2016 (in millions):

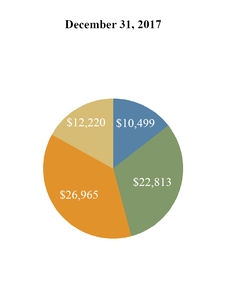

| FPAUM: $81,870 | FPAUM: $72,497 | FPAUM: $60,563 |
| Capital commitments | Invested capital | Market value/other | Collateral balances (at par) |
The components of our AUM, including the portion that is FPAUM, are presented below as of December 31, 2018, 2017 and 2016 (in millions):
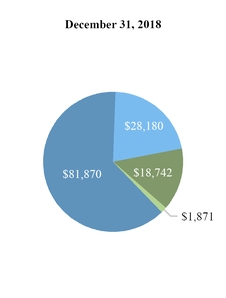


| AUM: $130,663 | AUM: $106,491 | AUM: $95,259 |
| FPAUM | Non-fee paying(1) | AUM not yet earning fees | General partner and affiliates |
(1) Includes $6,734 million, $5,656 million and $6,440 million of AUM of funds from which we indirectly earn management fees as of December 31, 2018, 2017 and 2016, respectively.
Fund Performance Metrics
Fund performance information for our investment funds that are considered to be “significant funds” is included throughout this discussion with analysis to facilitate an understanding of our results of operations for the periods presented. Our significant funds include those that contributed at least 1% of our total management fees for the year ended December 31, 2018 or comprised at least 1% of the Company’s total FPAUM as of December 31, 2018, and for which we have sole discretion for investment decisions within the fund. In addition to management fees, each of our significant funds may generate performance income upon the achievement of performance hurdles. The fund performance information reflected in this discussion and analysis is not indicative of our overall performance. An investment in Ares is not an investment in any of our funds. Past performance is not indicative of future results. As with any investment there is always the potential for gains as well as the possibility of losses. There can be no assurance that any of these funds or our other existing and future funds will achieve similar returns.
Components of Consolidated Results of Operations
Revenues
Management Fees. Management fees are generally based on a defined percentage of average fair value of assets, total commitments, invested capital, NAV, net investment income or par value of the investment portfolios managed by us. The fees are generally based on a quarterly measurement period and amounts can be paid in advance or in arrears depending on each specific fund. Management fees also include ARCC Part I Fees, a quarterly fee on investment income from ARCC, our publicly traded business development company registered under the Investment Company Act, which is managed by our subsidiary. ARCC Part I Fees are equal to 20% of ARCC's net investment income (before ARCC Part I Fees and incentive fees payable based on ARCC’s net capital gains), subject to a fixed “hurdle rate” of 1.75% per quarter, or 7.0% per annum. No fee is earned until ARCC’s net investment income exceeds a 1.75% hurdle rate, with a “catch up” provision such that we receive 20% of ARCC’s net investment income from the first dollar earned. ARCC Part I Fees are classified as management fees as they are predictable and are recurring in nature, are not subject to contingent repayment and are generally cash-settled each quarter. Management fees are recognized as revenue in the period advisory services are rendered, subject to our assessment of collectability. Additional details regarding our management fees are presented below:
Credit Group:
| • | Syndicated loans and high yield bonds: Typical management fees range from 0.35% to 0.50% of par plus cash or NAV. The syndicated loan funds have an average management contract term of 11.1 years as of December 31, 2018 and the fee ranges generally remain unchanged at the close of the re-investment period. The funds in the high-yield strategy generally represent open-ended managed accounts, which typically do not include investment period termination or management contract expiration dates. |
| • | Credit opportunities: Typical management fees range from 0.50% to 1.50% of NAV. The funds in this strategy are generally open-ended or managed account structures, which typically do not have investment period termination or management contract expiration dates. The funds in this strategy had an average management contract term of 9.0 years as of December 31, 2018. |
| • | Alternative credit: Typical management fees range from 0.50% to 1.50% of NAV, gross asset value, committed capital or invested capital. The funds in this strategy include ARDC, a publicly-traded closed-end fund, which does not include investment period termination. The funds in this strategy (excluding ARDC) had an average management contract term of 7.6 years as of December 31, 2018. |
| • | U.S and E.U. direct lending: Typical management fees range from 0.75% to 1.50% of invested capital, NAV or total assets. Following the expiration or termination of the investment period, the fee basis for certain closed-end funds and managed accounts in this strategy generally change either to the aggregate cost or to market value of the portfolio investments. In addition, management fees include the ARCC Part I Fees. Management fees on the lower end of the typical fee range are generally accompanied by transaction-based fees. The funds in this strategy (excluding ARCC, which is a permanent capital vehicle) had an average management contract term of 8.6 years as of December 31, 2018. |
Private Equity Group:
| • | Corporate opportunities, infrastructure and power and energy opportunities: Typical management fees range from 1.50% to 2.00% of total capital commitments during the investment period. The management fees for corporate private equity funds generally step down to between 0.75% and 1.25% of the aggregate adjusted cost of unrealized portfolio investments following the earlier to occur of: (i) the expiration or termination of the investment period or (ii) the launch of a successor fund. The infrastructure and power funds generally step down the fee base to the aggregated adjusted cost of unrealized portfolio investments, while retaining the same fee rate, following the expiration or termination of the investment period. The funds in this strategy had an average management contract term of 10.7 years as of December 31, 2018. |
| • | Special opportunities funds: Typical management fees range from 1.00% to 1.50% of the lesser of the aggregate cost basis of unrealized portfolio investments or committed capital. The funds in this strategy are comprised of closed-end funds, with investment period termination or management contract termination dates. The special opportunities funds also include managed accounts, which generally do not include investment period termination or management contract termination dates. The funds in this strategy had an average management contract term of 8.8 years as of December 31, 2018. |
Real Estate Group:
Real Estate equity and debt funds: Typical management fees range from 0.50% to 1.50% of invested capital, stockholders’ equity, total capital commitments or a combination thereof. Following the expiration or termination of the investment period the basis on which management fees are earned for certain closed-end funds, managed accounts and co-investment vehicles in this strategy changes from committed capital to invested capital with no change in the management fee rate. The closed end funds in these strategies had an average management contract term of 12.0 years as of December 31, 2018.
In some instances, we may not record management fees that we have earned when a fund does not have sufficient capital or liquidity to pay management fees or may be restricted by certain covenants from making payment. Management fees are not recorded until collectability is assured, which may include meeting certain performance conditions. We refer to these fees as deferred management fees. In future periods, the amount of deferred management fees that we will record typically increases with the length of time the fees were deferred. No material management fees earned were deferred as of December 31, 2018, 2017 and 2016.
As of the reporting date, accrued but unpaid management fees, net of management fee reductions and management fee offsets, are included under management fees receivable on the consolidated statements of financial condition. See Note 10, “Related Party Transactions,” to our consolidated financial statements included in this Annual Report on Form 10‑K for more information.
Carried Interest Allocation. In certain fund structures, typically in private equity and real estate equity funds, carried interest is allocated to us based on cumulative fund performance to date, subject to the achievement of minimum return levels in accordance with the respective terms in each fund’s governing documents. At the end of each reporting period, a fund allocates carried interest applicable to us based upon an assumed liquidation of that fund's net assets on the reporting date, irrespective of whether such amounts have been realized. Carried interest is recorded to the extent such amounts have been allocated and may be subject to reversal to the extent that the amount allocated ultimately exceeds the amount due to us based on a fund’s cumulative investment returns.
Carried interest is realized when an underlying investment is profitably disposed of and the fund’s cumulative returns are in excess of the specific hurdle rates as defined in the applicable governing documents. Since carried interest is subject to reversal, we may need to accrue for potential repayment of previously received carried interest. This accrual represents all amounts previously distributed to us that would need to be repaid to the funds if the funds were to be liquidated based on the fair value of the underlying funds’ investments as of the reporting date. The actual repayment obligations, however, generally do not become realized until the end of a fund’s life. Additional details regarding our carried interest are presented below:
Credit Group:
| • | Credit opportunities and alternative credit: Typical carried interest represents 15% to 20% of each carried interest eligible fund’s profits, subject to a preferred return of approximately 7% to 8% per annum. |
| • | U.S. and E.U. direct lending: Typical carried interest represents 10% to 20% of each carried interest eligible fund’s profits, or cumulative realized capital gains (net of losses and unrealized capital depreciation), and are subject to a preferred return rate of approximately 5% to 8% per annum. |
Private Equity Group:
| • | Private equity funds: Carried interest represents 20% of each carried interest eligible fund’s profits, subject to a preferred return of approximately 8% per annum. |
| • | Special opportunities funds: Carried interest represents 20% of each carried interest eligible fund’s profits, subject to a preferred return of approximately 8% per annum. |
Real Estate Group:
| • | Real estate funds: Typical carried interest represents 10% to 20% of each carried interest eligible fund’s profits, subject to a preferred return of approximately 8% to 10% per annum. |
We may be liable to certain funds for previously realized carried interest allocation if the fund’s investment values decline below certain return hurdles, which vary from fund to fund. As of December 31, 2018, if the funds were liquidated at their fair values, there would have been $0.4 million of contingent repayment obligation or liability. As of December 31, 2017 and 2016, if the funds were liquidated at their fair values at that date, there would have been no contingent repayment obligation or liability. When the fair value of a fund’s investment remains constant or falls below certain return hurdles, previously recognized carried interest allocation are reversed. In all cases, each fund is considered separately in evaluating carried interest and potential contingent repayment obligations. For any given period, carried interest allocation could therefore be negative; however, cumulative carried interest allocation can never be negative over the life of a fund. If upon a hypothetical liquidation of a fund’s investments at the then-current fair values previously recognized and distributed carried interest allocation would be required to be returned, a liability would be established in our financial statements for the potential contingent repayment obligation that may differ from the amount of revenue that we reverse. At December 31, 2018, 2017 and 2016, if we assumed all existing investments were valued at $0, the total amount of carried interest allocation subject to contingent repayment obligations, net of tax, would have been approximately $469.0 million, $476.1 million and $418.3 million, respectively, of which approximately $364.4 million, $370.0 million and $323.9 million, respectively, would have been reimbursable by professionals who have received such carried interest allocation.
Incentive Fees. Incentive fees earned on the performance of certain fund structures, typically in credit funds, are recognized based on the fund’s performance during the period, subject to the achievement of minimum return levels in accordance with the respective terms set out in each fund’s investment management agreement. Incentive fees are realized at the end of a measurement period, typically annually. Once realized, such fees are no longer subject to reversal. Additional details regarding our incentive fees are presented below:
Credit Group:
| • | Syndicated loans and high yield bonds: Typical incentive fees represents 15% to 20% of each incentive eligible fund’s profits, subject to a preferred return of approximately 12% per annum. |
| • | Credit opportunities and alternative credit: Typical incentive fees represents 12.5% to 20% of each incentive eligible fund’s profits, subject to a preferred return of approximately 5% to 7% per annum. |
| • | U.S. and E.U. direct lending: Typical incentive fees represents 10% to 20% of each incentive eligible fund’s profits, or cumulative realized capital gains (net of losses and unrealized capital depreciation), and are subject to a preferred return rate of approximately 5% to 8% per annum. |
Real Estate Group:
| • | Incentive fees we receive from ACRE are based on a percentage of the difference between ACRE’s core earnings (as defined in ACRE’s management agreement) and an amount derived from the weighted average issue price per share of ACRE’s common stock in its public offerings multiplied by the weighted average number of shares of common stock outstanding. |
Principal Investment Income (Loss). Principal investment income (loss) consists of interest and dividend income and net realized and unrealized gain (loss) on equity method investments that we manage. Interest and dividend income are recognized
on an accrual basis to the extent that such amounts are expected to be collected. Net gain (loss) from investment activities include realized and unrealized gains and losses from our equity method investment portfolio. A realized gain (loss) may be recognized when we redeem all or a portion of our investment or when we receive a distribution of capital. Unrealized gains (losses) on investments result from appreciation (depreciation) in the fair value of our investments, as well as reversals of previously recorded unrealized appreciation (depreciation) at the time the gain (loss) on an investment becomes realized.
Administrative, Transaction and Other Fees. Other fees primarily include revenue from administrative services provided to certain of our affiliated funds that are paid to us. In addition, we may receive fees from certain affiliated funds for activities related to fund transactions, such as loan originations. These fees are recognized as revenue in the period the transaction related services are rendered.
Expenses
Compensation and Benefits. Compensation generally includes salaries, bonuses, health and welfare benefits, equity-based compensation, and ARCC Part I Fee incentive compensation expenses. Compensation cost relating to the issuance of restricted units and options is measured at fair value at the grant date, reduced for actual forfeitures, and expensed over the vesting period on a straight-line basis. Phantom equity unit awards are re-measured at the end of each reporting period. Bonuses are accrued over the service period to which they relate. Compensation and benefits expenses are typically correlated to the operating performance of our segments, which is used to determine incentive-based compensation for each segment. Certain of our senior partners receive distributions based on their equity interests and are not paid an annual salary or bonus.
Performance Related Compensation. Performance related compensation includes compensation directly related to carried interest allocation and incentive fees, which generally consists of percentage interests that we grant to our professionals. Depending on the nature of each fund, the performance income participation is generally structured as a fixed percentage, typically 60-80%, or as an annual award. We have an obligation to pay our professionals a portion of the carried interest allocation or incentive fees earned from certain funds, including carried interest allocation or incentive fees from Consolidated Funds that are eliminated in consolidation. The performance related compensation payable is calculated based upon the changes to carried interest allocation and incentive fees and is not payable until the carried interest allocation or incentive fee is realized.
Although changes in performance related compensation are directly correlated with changes in performance income reported within our segment results, this correlation does not always exist when our results are reported on a fully consolidated basis in accordance with GAAP. This discrepancy is caused by the fact that performance income earned from our Consolidated Funds are eliminated upon consolidation while performance related compensation is not eliminated.
General, Administrative and Other Expenses. General and administrative expenses include costs primarily related to placement fees, professional services, occupancy and equipment expenses, depreciation and amortization expenses, travel and related expenses, communication and information services and other general operating items. These expenses are not borne by fund investors.
Expenses of Consolidated Funds. Consolidated Funds’ expenses consist primarily of costs incurred by our Consolidated Funds, including professional fees, research expenses, trustee fees, travel expenses and other costs associated with administering these funds and with launching new products.
Other Income (Expense)
Interest and Dividend Income. Interest and dividend income consists of interest income and dividend income primarily generated from investments in products that we manage. Interest and dividend income are both recognized on an accrual basis to the extent that such amounts are expected to be collected.
Interest Expense. Interest expense includes interest related to our Credit Facility, which has a variable interest rate based upon a credit spread that is adjusted with changes to corporate credit ratings, to our senior notes, which have a fixed coupon rate, and to our term loans.
Other Income (Expense), Net. Other income (expense), net consists of transaction gain (loss) and other non-operating and non‑investment related activity, such as loss on disposal of assets and gain (loss) due to the change in fair value of our contingent consideration liabilities.
Net Realized and Unrealized Gain (Loss) on Investments. Net gain (loss) from investment activities include realized and unrealized gains and losses from our investment portfolio. A realized gain (loss) may be recognized when we redeem all or a
portion of our investment or when we receive a distribution of capital. Unrealized gains (losses) on investments result from appreciation (depreciation) in the fair value of our investments, as well as reversals of previously recorded unrealized appreciation (depreciation) at the time the gain (loss) on an investment becomes realized.
Interest and Other Income of Consolidated Funds. Interest and other income of Consolidated Funds primarily includes interest and dividend income generated from the underlying investment securities of our Consolidated Funds.
Interest Expense of Consolidated Funds. Interest expense primarily consists of interest related to our Consolidated CLOs’ loans payable and, to a lesser extent, revolving credit lines, term loans and notes of other Consolidated Funds. The interest expense is solely the responsibility of the Consolidated CLO and there is no recourse to us if the CLO is unable to make interest payments.
Net Realized and Unrealized Gain (Loss) on Investments of Consolidated Funds. Net gain (loss) from investment activities of our Consolidated Funds include realized and unrealized gains and losses resulting from their investment portfolios. Realized gains (losses) may arise from dispositions of investments held by our Consolidated Funds. Unrealized gains (losses) are recorded to reflect appreciation (depreciation) of investments held by the Consolidated Funds due to periodic changes in fair value of the investments, as well as reversals of previously recorded unrealized appreciation (depreciation) of investments upon disposition, when the gain (loss) on an investment becomes realized.
Income Taxes. Effective March 1, 2018, our operations are conducted through domestic corporations that are subject to corporate level taxes and for which we record current and deferred income taxes at the prevailing rates in the various jurisdictions in which these entities operate. The majority of our Consolidated Funds are not subject to income tax as the funds’ investors are responsible for reporting their share of income or loss. To the extent required by federal, state and foreign income tax laws and regulations, certain funds may incur income tax liabilities.
Income taxes are accounted for using the liability method of accounting. Under this method, deferred tax assets and liabilities are recognized for the expected future tax consequences of differences between the carrying amounts of assets and liabilities and their respective tax basis, using tax rates in effect for the year in which the differences are expected to reverse. The effect on deferred assets and liabilities of a change in tax rates is recognized in income in the period when the change is enacted. Deferred tax assets are reduced by a valuation allowance when it is more likely than not that some portion or all of the deferred tax assets will not be realized.
Non-Controlling and Redeemable Interests. Net income attributable to non-controlling and redeemable interests in Consolidated Funds represents the ownership interests that third parties hold in entities that are consolidated into our consolidated financial statements.
Net income attributable to non-controlling interests and redeemable interests in Ares Operating Group entities represents the results attributable to strategic investment partners based on the proportional daily average ownership in Ares Operating Group entities.
Results of Operations
Consolidated Results of Operations
The following table and discussion sets forth information regarding our consolidated results of operations for the years ended December 31, 2018, 2017 and 2016. We consolidate funds where we are deemed to hold a controlling financial interest. The Consolidated Funds are not necessarily the same entities in each year presented due to changes in ownership, changes in limited partners' rights and the creation and termination of funds. The consolidation of these funds had no effect on net income attributable to us for the periods presented ($ in thousands).
| For the Years Ended December 31, | 2018 vs. 2017 | 2017 vs. 2016 | |||||||||||||||||||||||
| 2018 | 2017 | 2016 | Favorable (Unfavorable) | Favorable (Unfavorable) | |||||||||||||||||||||
| $ Change | % Change | $ Change | % Change | ||||||||||||||||||||||
| Revenues | |||||||||||||||||||||||||
| Management fees (includes ARCC Part I Fees of $128,805, $105,467 and $121,181 for the years ended December 31, 2018, 2017 and 2016, respectively) | $ | 802,502 | $ | 722,419 | $ | 642,068 | $ | 80,083 | 11 | % | $ | 80,351 | 13 | % | |||||||||||
| Carried interest allocation | 42,410 | 620,454 | 494,580 | (578,044 | ) | (93 | )% | 125,874 | 25 | % | |||||||||||||||
| Incentive fees | 63,380 | 16,220 | 23,272 | 47,160 | 291 | % | (7,052 | ) | (30 | )% | |||||||||||||||
| Principal investment income (loss) | (1,455 | ) | 64,444 | 55,168 | (65,899 | ) | NM | 9,276 | 17 | % | |||||||||||||||
| Administrative, transaction and other fees | 51,624 | 56,406 | 39,285 | (4,782 | ) | (8 | )% | 17,121 | 44 | % | |||||||||||||||
| Total revenues | 958,461 | 1,479,943 | 1,254,373 | (521,482 | ) | (35 | )% | 225,570 | 18 | % | |||||||||||||||
| Expenses | |||||||||||||||||||||||||
| Compensation and benefits | 570,380 | 514,109 | 447,725 | (56,271 | ) | (11 | )% | (66,384 | ) | (15 | )% | ||||||||||||||
| Performance related compensation | 30,254 | 479,722 | 387,846 | 449,468 | 94 | % | (91,876 | ) | (24 | )% | |||||||||||||||
| General, administrative and other expenses | 215,964 | 196,730 | 159,776 | (19,234 | ) | (10 | )% | (36,954 | ) | (23 | )% | ||||||||||||||
| Transaction support expense | — | 275,177 | — | 275,177 | NM | (275,177 | ) | NM | |||||||||||||||||
| Expenses of Consolidated Funds | 53,764 | 39,020 | 21,073 | (14,744 | ) | (38 | )% | (17,947 | ) | (85 | )% | ||||||||||||||
| Total expenses | 870,362 | 1,504,758 | 1,016,420 | 634,396 | 42 | % | (488,338 | ) | (48 | )% | |||||||||||||||
| Other income (expense) | |||||||||||||||||||||||||
| Net realized and unrealized gain (loss) on investments | (1,884 | ) | 8,262 | (7,629 | ) | (10,146 | ) | NM | 15,891 | NM | |||||||||||||||
| Interest and dividend income | 7,028 | 7,043 | 4,493 | (15 | ) | < 1% | 2,550 | 57 | % | ||||||||||||||||
| Interest expense | (21,448 | ) | (21,219 | ) | (17,981 | ) | (229 | ) | (1 | )% | (3,238 | ) | (18 | )% | |||||||||||
| Other income (expense), net | (851 | ) | 19,470 | 35,650 | (20,321 | ) | NM | (16,180 | ) | (45 | )% | ||||||||||||||
| Net realized and unrealized gain (loss) on investments of Consolidated Funds | (1,583 | ) | 100,124 | (2,057 | ) | (101,707 | ) | NM | 102,181 | NM | |||||||||||||||
| Interest and other income of Consolidated Funds | 337,875 | 187,721 | 138,943 | 150,154 | 80 | % | 48,778 | 35 | % | ||||||||||||||||
| Interest expense of Consolidated Funds | (222,895 | ) | (126,727 | ) | (91,452 | ) | (96,168 | ) | (76 | )% | (35,275 | ) | (39 | )% | |||||||||||
| Total other income | 96,242 | 174,674 | 59,967 | (78,432 | ) | (45 | )% | 114,707 | 191 | % | |||||||||||||||
| Income before taxes | 184,341 | 149,859 | 297,920 | 34,482 | 23 | % | (148,061 | ) | (50 | )% | |||||||||||||||
| Income tax expense (benefit) | 32,202 | (23,052 | ) | 11,019 | 55,254 | NM | (34,071 | ) | NM | ||||||||||||||||
| Net income | 152,139 | 172,911 | 286,901 | (20,772 | ) | (12 | )% | (113,990 | ) | (40 | )% | ||||||||||||||
| Less: Net income attributable to non-controlling interests in Consolidated Funds | 20,512 | 60,818 | 3,386 | (40,306 | ) | (66 | )% | 57,432 | NM | ||||||||||||||||
| Less: Net income attributable to redeemable interests in Ares Operating Group entities | — | — | 456 | — | — | % | (456 | ) | NM | ||||||||||||||||
| Less: Net income attributable to non-controlling interests in Ares Operating Group entities | 74,607 | 35,915 | 171,251 | 38,692 | 108 | % | (135,336 | ) | (79 | )% | |||||||||||||||
| Net income attributable to Ares Management Corporation | 57,020 | 76,178 | 111,808 | (19,158 | ) | (25 | )% | (35,630 | ) | (32 | )% | ||||||||||||||
| Less: Series A Preferred Stock dividends paid | 21,700 | 21,700 | 12,176 | — | — | % | (9,524 | ) | (78 | )% | |||||||||||||||
| Net income attributable to Ares Management Corporation Class A common stockholders | $ | 35,320 | $ | 54,478 | $ | 99,632 | (19,158 | ) | (35 | )% | (45,154 | ) | (45 | )% |
NM - Not Meaningful
The following two sections discuss the year-over-year fluctuations of our consolidated results of operations for 2018 compared to 2017, as well as 2017 compared to 2016. Additional details behind the fluctuations attributable to a particular segment are included in "—Results of Operations by Segment" for each of the segments.
Year Ended December 31, 2018 Compared to Year Ended December 31, 2017
Revenues
Management Fees. Management fees increased $80.1 million, or 11%, for the year ended December 31, 2018 compared to the year ended December 31, 2017. The increase in management fees was primarily driven by higher FPAUM due to capital deployments during 2018. For more detail regarding the fluctuations of management fees within each of the segments see "—Results of Operations by Segment."
Carried Interest Allocation. Carried interest allocation decreased $578.0 million, or 93%, for the year ended December 31, 2018 compared to the year ended December 31, 2017 and was principally composed of the following (in millions):
| For the Year Ended December 31, 2018 | Primary Drivers | For the Year Ended December 31, 2017 | Primary Drivers | ||||||
| Credit funds | $ | 82.6 | European direct lending funds generating returns in excess of their hurdle rates | $ | 55.8 | Certain European direct lending funds generating returns in excess of their hurdle rates | |||
| Private equity funds | (168.7 | ) | Market depreciation of an Ares Corporate Opportunities Fund III, L.P.'s (“ACOF III”) publicly traded retail portfolio company; Market depreciation across several Ares Corporate Opportunities Fund IV, L.P. (“ACOF IV”) portfolio companies | 477.6 | Significant market appreciation in one of ACOF III's publicly traded retail portfolio companies following its initial public offering during the period | ||||
| Real estate funds | 128.5 | Net market appreciation from properties within certain of our U.S. and E.U. real estate funds | 87.1 | Net market appreciation from properties within certain of our U.S. and E.U. real estate funds | |||||
| Total | $ | 42.4 | $ | 620.5 |
Incentive Fees. Incentive fees increased $47.2 million, or 291%, for the year ended December 31, 2018 compared to the year ended December 31, 2017. The increase was primarily driven by $50.2 million of ARCC Part II Fees recognized during 2018 due to ARCC's cumulative aggregate realized gains exceeding the sum of cumulative aggregate realized losses and aggregate unrealized capital depreciation.
Principal Investment Income (Loss). Principal investment income (loss) decreased $65.9 million from principal investment income of $64.4 million for the year ended December 31, 2017 to principal investment loss of $1.5 million for the year ended December 31, 2018. The decrease was primarily attributable to significant market appreciation in one of ACOF III's publicly traded retail portfolio companies following its initial public offering during 2017, followed by decreases in the portfolio company's stock price during 2018 primarily caused by changes in macroeconomic factors.
Administrative, Transaction and Other Fees. Administrative, transaction and other fees decreased $4.8 million, or 8%, for the year ended December 31, 2018 compared to the year ended December 31, 2017. The decrease was primarily due to lower administrative service fees resulting from temporary employees assisting with ARCC's integration of ACAS during 2017.
Expenses
Compensation and Benefits. Compensation and benefits expense increased $56.3 million, or 11%, for the year ended December 31, 2018 compared to the year ended December 31, 2017. The increase was primarily driven by higher compensation expense related to ARCC Part I Fees, merit increases, headcount growth and equity compensation expense for the year ended December 31, 2018 compared to December 31, 2017. Equity compensation expense increased by $20.0 million during 2018 compared to 2017. The increases in equity compensation expense was primarily due to additional restricted units awarded as part of bonus and retention programs and to new restricted units with a market condition granted to our Chief Executive Officer during 2018.
Performance Related Compensation. Performance related compensation decreased $449.5 million, or 94%, for the year ended December 31, 2018 compared to the year ended December 31, 2017. The decrease in performance related compensation was largely correlated with the decreases in carried interest allocation and incentive fees before giving effect to the carried interest allocation and incentive fees earned from our Consolidated Funds that are eliminated upon consolidation.
General, Administrative and Other Expenses. General, administrative and other expenses increased $19.2 million, or 10%, for the year ended December 31, 2018 compared to the year ended December 31, 2017. The increase was partially due to an $11.8 million one-time reimbursement to ARCC for certain rent and utilities for the first quarter of 2018 and each of the years ended 2017, 2016, 2015 and 2014. Beginning April 1, 2018, we assumed these expenses going forward, resulting in a $3.5 million increase in occupancy expense in 2018.
Professional service fees increased by $5.4 million for the year ended December 31, 2018 compared to the year ended December 31, 2017. The increase was primarily driven by fees incurred from legal and tax advisers due to our election to change our tax classification from a partnership to a corporation for U.S. income tax purposes, by an increase in operating expenses from a joint venture distribution platform and by an increase in recruiting fees to support our expanding business. These increases were offset by the impact of a $2.5 million one-time non-income tax expense during the year ended December 31, 2017.
Transaction Support Expense. Transaction support expense represents a one-time payment of $275.2 million that we made, through our subsidiary Ares Capital Management LLC, to ACAS shareholders during the first quarter of 2017 upon the closing of ARCC’s acquisition of ACAS.
Expenses of Consolidated Funds. Expenses of Consolidated Funds increased $14.7 million, or 38%, for the year ended December 31, 2018 compared to the year ended December 31, 2017. The increase was primarily driven by fees incurred as a result of an increase in CLO debt issuances and refinancings within our Consolidated Funds for the year ended December 31, 2018 compared to the year ended December 31, 2017. These fees were expensed in the period incurred, as CLO debt is recorded at fair value on our Consolidated Statements of Financial Condition.
Other Income (Expense)
When evaluating the changes in other income (expense), we separately analyze the other income (expense) generated by the Company from the investment returns generated by our Consolidated Funds.
Net Realized and Unrealized Gain (Loss) on Investments. Net realized and unrealized gain (loss) on investments decreased by $10.1 million from a net gain of $8.3 million for the year ended December 31, 2017 to a net loss of $1.9 million for the year ended December 31, 2018. The decrease was primarily attributable to a change in fair value of one of our non-core, insurance related investments following the termination of an executed purchase and sale agreement, which was the basis of the prior valuation.
Other Income (Expense), Net. Other income (expense), net changed by $20.3 million from other income, net of $19.5 million for the year ended December 31, 2017 to other expense, net of $0.9 million for the year ended December 31, 2018. The change was primarily driven by a reversal of a contingent consideration related to the Energy Investors Funds (“EIF”) acquisition that was recorded as a gain in 2017.
Net Realized and Unrealized Gain (Loss) on Investments of Consolidated Funds. Net realized and unrealized loss on investments of Consolidated Funds of $1.6 million for the year ended December 31, 2018 was principally composed of net losses from liquid bank loans held within our consolidated CLOs primarily driven by market depreciation. Net realized and unrealized gain on investments of Consolidated Funds for the year ended December 31, 2017 of $100.1 million was principally composed of net gains on certain investments of an Asian corporate private equity fund, net gains of an E.U. direct lending fund primarily due to a strengthened Euro in 2017 and net gains from liquid bank loans held within our consolidated CLOs primarily driven by market appreciation.
Interest and Other Income of Consolidated Funds. Interest and other income of Consolidated Funds increased $150.2 million, or 80%, for the year ended December 31, 2018 compared to the year ended December 31, 2017. The increase was primarily driven by an increase in loans primarily made by the CLOs that we consolidate.
Interest Expense of Consolidated Funds. Interest expense of Consolidated Funds increased $96.2 million, or 76%, for the year ended December 31, 2018 compared to the year ended December 31, 2017. The increase was primarily the result of interest expense from loan obligations of the CLOs that increased from $5.0 billion as of December 31, 2017 to $6.7 billion as of December 31, 2018 due to the consolidation of four new CLOs during 2018.
Income Tax Expense (Benefit). Income tax expense was $32.2 million for the year ended December 31, 2018 compared to income tax benefit of $23.1 million for the year ended December 31, 2017. Income tax expense for the year ended December 31, 2018 was primarily driven by a deferred tax liability arising from the embedded net unrealized gains of both carried interest and the investment portfolio that were not previously subject to corporate taxes prior to our election to be taxed as a corporation for U.S. federal income tax purposes effective March 1, 2018. Income tax benefit for the year ended December 31, 2017 was largely driven by the pre-tax losses recognized by AHI, a U.S. taxable entity, resulting from the $275.2 million transaction support payment made in connection with ARCC's acquisition of ACAS.
Non-Controlling and Redeemable Interests. Net income attributable to non-controlling interests in Ares Operating Group entities represents results attributable to the owners of AOG Units that are not held by Ares Management Corporation and is allocated based on the weighted average daily ownership of the AOG unitholders.
Net income attributable to non-controlling interests in Ares Operating Group entities increased $38.7 million, or 107.7%, for the year ended December 31, 2018 compared to the year ended December 31, 2017. The weighted average daily ownership for non-controlling AOG unitholders was 55.8% for the year ended December 31, 2018 compared to 61.4% for the year ended December 31, 2017. The decrease in non–controlling ownership was primarily driven by our common share offering of 5,000,000 shares and by an affiliate of Alleghany Corporation's exchange of 12,500,000 of its AOG Units into common shares during 2018.
Year Ended December 31, 2017 Compared to Year Ended December 31, 2016
Revenues
Management Fees. Total management fees increased $80.4 million, or 13%, to $722.4 million, after giving effect to an increase in management fees of $5.0 million that were eliminated upon consolidation, for the year ended December 31, 2017 compared to the year ended December 31, 2016. Segment management fees attributable to the Private Equity Group and Credit Group increased by $50.7 million and $36.8 million, respectively, and segment management fees attributable to the Real Estate Group decreased by $2.1 million compared to 2016. For more detail regarding the fluctuations of management fees within each of the segments see "—Results of Operations by Segment."
Carried Interest Allocation. Carried interest allocation increased $125.9 million, or 25%, for the year ended December 31, 2017 compared to the year ended December 31, 2016. The increase in carried interest was primarily driven by significant market appreciation in one of ACOF III's retail portfolio companies following its initial public offering and by Ares Capital Europe II, L.P. (“ACE II”) and Ares Capital Europe III, L.P. (“ACE III”) generating returns in excess of their hurdle rates on a larger capital base.
Incentive Fees. Incentive fees decreased $7.1 million, or 30%, for the year ended December 31, 2017 compared to the year ended December 31, 2016. The decrease was primarily driven by lower incentive fees attributable to our syndicated loans strategy, which benefited from a broad-based credit market rally in 2016.
Principal investment income. Principal investment income decreased $9.3 million, or 17%, for the year ended December 31, 2017 compared to the year ended December 31, 2016. The decrease was primarily driven by a $14.2 million decrease in investment income received from our investment in ACOF III in 2017. Recapitalization of portfolio companies within ACOF III caused increased disbursements in 2016 that did not recur in 2017.
Administrative, Transaction and Other Fees. Administrative, transaction and other fees increased $17.1 million, or 44%, for the year ended December 31, 2017 compared to the year ended December 31, 2016. The increase was primarily due to a $9.7 million increase in fees associated with certain funds within the U.S. and E.U. direct lending groups, from which we earned transaction fees of $18.2 million in 2017 compared to $8.5 million in 2016. We began to recognize transaction-based fees from certain direct lending funds in the fourth quarter of 2016. These fees will change with the level of deployed capital and the number of new funds, however we do not earn this fee from each fund. In addition, administrative fees included $30.7 million of compensation and benefits expense reimbursements for 2017, of which $7.7 million related to temporary employees that were assisting with the integration of ACAS into ARCC. Comparatively, administrative fee reimbursements offsetting compensation and benefits was $23.9 million for 2016.
Expenses
Compensation and Benefits. Compensation and benefits expenses increased $66.4 million, or 15%, for the year ended December 31, 2017 compared to the year ended December 31, 2016. The increase was due to an increase in headcount, including an additional $16.8 million attributable to employees hired in connection with ARCC's acquisition of ACAS, of which $7.7 million related to temporary employees assisting with the integration. In addition, equity compensation increased $21.6 million due to restricted units granted as part of a one-time grant to certain employees in 2017.
Performance Related Compensation. Performance related compensation increased $91.9 million, or 24%, for the year ended December 31, 2017 compared to the year ended December 31, 2016. The increase in performance related compensation is largely correlated with the increases in carried interest allocation and incentive fees before giving effect to the carried interest allocation and incentive fees earned from our Consolidated Funds eliminated upon consolidation.
General, Administrative and Other Expenses. General, administrative and other expenses increased by $37.0 million, or 23%, for the year ended December 31, 2017 compared to the year ended December 31, 2016. The increase was attributable to an increase of placement fees of $13.3 million primarily due to the fundraising on two funds within our Credit Group during the current year. We incurred expenses of $4.4 million in connection with the operations of a new joint venture distribution platform. The platform will be used to raise capital for registered investment companies through independent brokerage networks. The first such fund, a direct lending closed end fund, was launched in 2017. Diligence related costs associated with potential acquisitions and capital transactions increased by $4.0 million. Also impacting the year ended December 31, 2017 was a $2.5 million one-time non-income tax expense. The remaining portion of the increase in expense was a result of additional occupancy-related and support costs associated with an increase in headcount. Total headcount increased by 8%, to more than 1,000 employees as of December 31, 2017 compared to total headcount as of December 31, 2016.
Transaction Support Expense. Transaction support expense represents a one-time payment of $275.2 million that we made, through our subsidiary Ares Capital Management LLC, to ACAS shareholders during the first quarter of 2017 upon the closing of ARCC’s acquisition of ACAS.
Expenses of Consolidated Funds. Expenses of the Consolidated Funds increased by $17.9 million, or 85%, for the year ended December 31, 2017 compared to the year ended December 31, 2016. The increase was primarily due to increased organizational and offering costs incurred to launch four new funds that we began consolidating in 2017 compared to organizational and offering costs incurred to launch two new funds that we began consolidating in 2016.
Other Income (Expense)
When evaluating the changes in other income (expense), we separately analyze the other income generated by the Company from the investment returns generated by our Consolidated Funds.
Net Realized and Unrealized Gain (Loss) on Investments. Net realized and unrealized gain (loss) on investments increased by $15.9 million from a net loss of $7.6 million for the year ended December 31, 2016 to a net gain of $8.3 million for the year ended December 31, 2017. The increase was primarily attributable to a $20 million realized loss in 2016 on our investment in Deimos Management Holdings LLC due to the winding down of its operations.
Interest and Dividend Income. Interest and dividend income increased $2.6 million, or 57%, for the year ended December 31, 2017 compared to the year ended December 31, 2016. The increase was primarily due to interest income from investments in our syndicated loan strategies purchased during 2017 as a result of our compliance with risk retention requirements.
Interest Expense. Interest expense increased $3.2 million, or 18%, for the year ended December 31, 2017 compared to the year ended December 31, 2016. The increase in interest expense was primarily due to the CLO term loan balance increasing from $61.1 million as of December 31, 2016 to $160.9 million as of December 31, 2017. CLO term loans entered in 2017 were in connection with risk retention requirements.
Other Income, Net. Other income of the Company decreased by $16.2 million, or 45%, for the year ended December 31, 2017 compared to the year ended December 31, 2016. The decrease was primarily due to gains of $16.2 million for the year ended December 31, 2016 compared to losses of $1.7 million from the revaluation of certain assets and liabilities denominated in foreign currencies. In 2016, the Brexit vote caused exchange rate fluctuations that resulted in the strengthening of the U.S. dollar against foreign currencies in which we conduct business, primarily the British pounds sterling and the Euro. That strengthening of the U.S. dollar against these foreign currencies resulted in gains in 2016. In 2017, a portion of these gains reversed as the British pounds sterling and the Euro strengthened against the U.S. dollar. The impact was partially mitigated by reductions in liabilities denominated in foreign currencies during 2017.
Net Realized and Unrealized Gain (Loss) on Investments of Consolidated Funds. Net gain (loss) on investments of the Consolidated Funds increased $102.2 million from a net investment loss of $2.1 million for the year ended December 31, 2016 to a net investment gain of $100.1 million for the year ended December 31, 2017. The increase was driven by unrealized appreciation on certain investments of $38.5 million in an Asian corporate private equity fund and an increase in net realized and unrealized gains of $47.1 million in an E.U. direct lending fund due to the strengthening Euro for the year ended December 31, 2017 compared to the year ended December 31, 2016. The remaining portion of the increase was primarily attributable to the impact of unrealized gains from investments in funds we began consolidating in 2017.
Interest and Other Income of Consolidated Funds. Interest income and other income of the Consolidated Funds increased$48.8 million, or 35%, for the year ended December 31, 2017 compared to the year ended December 31, 2016. The increase was primarily driven by $28.8 million of interest income from funds we began consolidating in 2017 in addition to the impact of a full year of interest income from funds we began consolidating late in 2016. Also contributing to the increase was income from an Asian corporate private equity investment. These increases were offset by a decrease in interest income from the liquidation of a Consolidated Fund during the year ended December 31, 2017.
Interest Expense of Consolidated Funds. Interest expense of the Consolidated Funds increased $35.3 million, or 39%, for the year ended December 31, 2017 compared to the year ended December 31, 2016. The increase was driven by interest expense from new borrowing arrangements for four new funds combined with a full year of interest expense from two new funds that we began consolidating in 2016.
Income Tax Expense (Benefit). Income tax benefit was $23.1 million for the year ended December 31, 2017 compared to income tax expense of $11.0 million for the year ended December 31, 2016. The tax benefit for the year ended December 31, 2017 was largely driven by the pre-tax losses recognized by AHI, a U.S. taxable entity, resulting from the $275.2 million transaction support payment made in connection with ARCC's acquisition of ACAS.
Non-Controlling and Redeemable Interests. Net income attributable to non-controlling and redeemable interests in Ares Operating Group entities represents results attributable to the owners of AOG Units that are not held by Ares Management Corporation and is allocated based on the weighted average daily ownership of the AOG unitholders. The former owners of Indicus Advisors, LLP (“Indicus”), a company we acquired in 2011, exercised the put option on their redeemable interest during the third quarter of 2016, at which time the redeemable interest in Ares Operating Group entities ceased to exist.
Net income attributable to non-controlling interests decreased by a higher percentage than net income of the Company for the comparative period due to the tax benefits recognized by AHI being solely attributable to the Company. The weighted average daily ownership for non-controlling and redeemable AOG unitholders was 61.4% for the year ended December 31, 2017 compared to 62.0% for the year ended December 31, 2016.
Segment Analysis
Under GAAP, we are required to consolidate entities where we have both significant economics and the power to direct the activities of the entity that impact economic performance. For more information regarding consolidation principles, see Note 2, “Summary of Significant Accounting Policies,” to our consolidated financial statements included in this Annual Report on Form 10‑K.
For segment reporting purposes, revenues and expenses are presented on a basis before giving effect to the results of our Consolidated Funds. As a result, segment revenues from management fees, performance income and investment income are greater than those presented on a consolidated basis in accordance with GAAP because revenues recognized from Consolidated Funds are eliminated in consolidation. Furthermore, expenses and the effects of other income (expense) are different than related amounts presented on a consolidated basis in accordance with GAAP due to the exclusion of the results of Consolidated Funds.
Discussed below are our results of operations for each of our three reportable segments. In addition to the three segments, we separately discuss the OMG. This information is used by our management to make operating decisions, assess performance and allocate resources.
FRE, RI and Other Measures
The following table sets forth FRE and RI by segment for the years ended December 31, 2018, 2017 and 2016. FRE and RI are non‑GAAP financial measures our management uses when making resource deployment decisions and in assessing performance of our segments. For definitions of each of these non-GAAP financial measures see the Glossary ($ in thousands).
| Year Ended December 31, | 2018 vs. 2017 | 2017 vs. 2016 | |||||||||||||||||||||||
| 2018 | 2017 | 2016 | Favorable (Unfavorable) | Favorable (Unfavorable) | |||||||||||||||||||||
| $ Change | % Change | $ Change | % Change | ||||||||||||||||||||||
| Fee related earnings: | |||||||||||||||||||||||||
| Credit Group | $ | 327,369 | $ | 275,323 | $ | 240,910 | $ | 52,046 | 19 | % | $ | 34,413 | 14 | % | |||||||||||
| Private Equity Group | 106,036 | 113,863 | 73,379 | (7,827 | ) | (7 | )% | 40,484 | 55 | % | |||||||||||||||
| Real Estate Group | 23,950 | 14,862 | 16,157 | 9,088 | 61 | % | (1,295 | ) | (8 | )% | |||||||||||||||
| Operations Management Group | (202,043 | ) | (187,058 | ) | (158,096 | ) | (14,985 | ) | (8 | )% | (28,962 | ) | (18 | )% | |||||||||||
| Fee related earnings | $ | 255,312 | $ | 216,990 | $ | 172,350 | 38,322 | 18 | % | 44,640 | 26 | % | |||||||||||||
| Realized income: | |||||||||||||||||||||||||
| Credit Group | $ | 374,554 | $ | 292,081 | $ | 299,439 | 82,473 | 28 | % | (7,358 | ) | (2 | )% | ||||||||||||
| Private Equity Group | 150,532 | 192,814 | 149,544 | (42,282 | ) | (22 | )% | 43,270 | 29 | % | |||||||||||||||
| Real Estate Group | 67,605 | 24,527 | 26,611 | 43,078 | 176 | % | (2,084 | ) | (8 | )% | |||||||||||||||
| Operations Management Group | (197,295 | ) | (183,982 | ) | (175,266 | ) | (13,313 | ) | (7 | )% | (8,716 | ) | (5 | )% | |||||||||||
| Realized income | $ | 395,396 | $ | 325,440 | $ | 300,328 | 69,956 | 21 | % | 25,112 | 8 | % |
NM - Not Meaningful
Reconciliation of Consolidated GAAP Financial Measures to Certain Non-GAAP Measures
Income before provision for income taxes is the GAAP financial measure most comparable to RI and FRE. The following table presents the reconciliation of income before taxes as reported in the Consolidated Statements of Operations to RI and FRE (in thousands):
| For the Year Ended December 31, | |||||||||||
| 2018 | 2017 | 2016 | |||||||||
| Income before taxes | $ | 184,341 | $ | 149,859 | $ | 297,920 | |||||
| Adjustments: | |||||||||||
| Amortization of intangibles | 9,032 | 17,850 | 26,638 | ||||||||
| Depreciation expense | 16,055 | 12,631 | 8,215 | ||||||||
| Equity compensation expenses | 89,724 | 69,711 | 39,065 | ||||||||
| Acquisition and merger-related expenses | 2,936 | 259,899 | (16,902 | ) | |||||||
| Placement fees and underwriting costs | 20,343 | 19,765 | 6,424 | ||||||||
| Other (income) expense(1) | 13,489 | (1,042 | ) | (1,728 | ) | ||||||
| Expense of non-controlling interests in consolidated subsidiaries | 3,343 | 1,739 | — | ||||||||
| Income before taxes of non-controlling interests in Consolidated Funds, net of eliminations | (20,643 | ) | (62,705 | ) | (2,649 | ) | |||||
| Unconsolidated performance (income) loss - unrealized | 247,212 | (325,915 | ) | (228,472 | ) | ||||||
| Unconsolidated performance related compensation - unrealized | (221,343 | ) | 237,392 | 189,582 | |||||||
| Unconsolidated net investment (income) loss - unrealized | 50,907 | (53,744 | ) | (17,765 | ) | ||||||
| Realized income | 395,396 | 325,440 | 300,328 | ||||||||
| Unconsolidated performance income - realized | (357,207 | ) | (317,787 | ) | (292,998 | ) | |||||
| Unconsolidated performance related compensation - realized | 251,597 | 242,330 | 198,264 | ||||||||
| Unconsolidated net investment income - realized | (34,474 | ) | (32,993 | ) | (33,244 | ) | |||||
| Fee related earnings | $ | 255,312 | $ | 216,990 | $ | 172,350 |
(1) Year ended December 31, 2018 expenses include an $11.8 million payment made to ARCC for rent and utilities for the years ended 2017, 2016, 2015 and 2014, and the first quarter of 2018.
Results of Operations by Segment
Credit Group—Year Ended December 31, 2018 Compared to Year Ended December 31, 2017
Fee Related Earnings:
The following table presents the components of the Credit Group's FRE and the changes for the comparative periods ($ in thousands):
| For the Years Ended December 31, | Favorable (Unfavorable) | |||||||||||||
| 2018 | 2017 | $ Change | % Change | |||||||||||
| Management fees (includes ARCC Part I Fees of $128,805 and $105,467 for the years ended December 31, 2018 and 2017, respectively) | $ | 564,899 | $ | 481,466 | $ | 83,433 | 17 | % | ||||||
| Other fees | 23,247 | 20,830 | 2,417 | 12 | % | |||||||||
| Compensation and benefits | (216,843 | ) | (193,347 | ) | (23,496 | ) | (12 | )% | ||||||
| General, administrative and other expenses | (43,934 | ) | (33,626 | ) | (10,308 | ) | (31 | )% | ||||||
| Fee Related Earnings | $ | 327,369 | $ | 275,323 | 52,046 | 19 | % |
Management Fees
The chart below presents the Credit Group's management fees and effective management fee rates for the years ended December 31, 2018 and 2017 ($ in millions):

The increase in management fees attributable to additional capital deployment of existing funds was $58.2 million for the comparative periods. The formation of 23 new funds with FPAUM of $7.4 billion during 2018 increased management fees by $21.5 million. ARCC Part I Fees increased by $23.3 million to $128.8 million for 2018. The increase in ARCC Part I Fees was primarily due to increased interest income from a higher average size and weighted average yield of ARCC's portfolio, as well as an increase in capital structuring fees from a greater number of new investment commitments. The increase was partially offset by a $10 million quarterly ARCC Part I Fee waiver that commenced in the second quarter of 2017. Additionally, the liquidation of 25 funds with FPAUM of $2.3 billion in 2018 decreased management fees by $19.4 million in 2018.
The increase in the effective management fee rate was primarily due to increased ARCC Part I Fees and to new direct lending funds with higher effective fee rates for the year ended December 31, 2018 compared to the year ended December 31, 2017. ARCC Part I Fees' contribution towards the total effective management fee rate of the Credit Group increased to 0.24% for the year ended December 31, 2018 from 0.22% for the year ended December 31, 2017.
Other fees. Other fees increased $2.4 million, or 12%, for the year ended December 31, 2018 compared to the year ended December 31, 2017. The increase was primarily driven by a higher volume of transaction fees based on loan originations within certain direct lending funds.
Compensation and Benefits. Compensation and benefits expense increased $23.5 million, or 12%, for the year ended December 31, 2018 compared to the year ended December 31, 2017. The increase was primarily driven by higher compensation expense related to ARCC Part I Fees.
General, Administrative and Other Expenses. General, administrative and other expense increased $10.3 million, or 31%, for the year ended December 31, 2018 compared to the year ended December 31, 2017. The increase was primarily driven by marketing expenses to support expanding distribution and fundraising efforts, including our joint venture distribution platform and by an increase in recruiting fees to support our expanding business. Additionally, occupancy costs increased by $3.5 million related to costs previously paid by ARCC for certain rent and utilities that we expect to continue.
Realized Income:
The following table presents the components of the Credit Group's RI and the changes for the comparative periods ($ in thousands):
| For the Years Ended December 31, | Favorable (Unfavorable) | ||||||||||||
| 2018 | 2017 | $ Change | % Change | ||||||||||
| Fee Related Earnings | $ | 327,369 | $ | 275,323 | 52,046 | 19 | % | ||||||
| Performance income-realized | 121,270 | 21,087 | 100,183 | NM | |||||||||
| Performance related compensation-realized | (75,541 | ) | (9,218 | ) | (66,323 | ) | NM | ||||||
| Realized net performance income | 45,729 | 11,869 | 33,860 | 285 | % | ||||||||
| Investment income-realized | 2,492 | 7,102 | (4,610 | ) | (65 | )% | |||||||
| Interest and other investment income-realized | 10,350 | 10,192 | 158 | 2 | % | ||||||||
| Interest expense | (11,386 | ) | (12,405 | ) | 1,019 | 8 | % | ||||||
| Realized net investment income | 1,456 | 4,889 | (3,433 | ) | (70 | )% | |||||||
| Realized Income | $ | 374,554 | $ | 292,081 | 82,473 | 28 | % |
Realized income for the periods presented was composed of FRE, as explained above, realized net performance income and realized net investment income for the respective periods.
Realized net performance income for the for the year ended December 31, 2018 was primarily attributable to certain direct lending funds that are generating returns in excess of their hurdle rates and ARCC Part II Fees, net of performance related compensation, due to ARCC's cumulative aggregate realized gains exceeding the sum of cumulative aggregate realized losses and aggregate unrealized capital depreciation. Realized net performance income for the for the year ended December 31, 2017 was primarily attributable to certain direct lending funds that are generating returns in excess of their hurdle rates.
Realized net investment income for the years ended December 31, 2018 and 2017 was primarily attributable to realized gains from our syndicated loan funds.
Credit Group—Year Ended December 31, 2017 Compared to Year Ended December 31, 2016
Fee Related Earnings:
The following table presents the components of the Credit Group's FRE and the changes for the comparative periods ($ in thousands):
| For the Years Ended December 31, | Favorable (Unfavorable) | |||||||||||||
| 2017 | 2016 | $ Change | % Change | |||||||||||
| Management fees (includes ARCC Part I Fees of $105,467 and $121,181 for the years ended December 31, 2017 and 2016, respectively) | $ | 481,466 | $ | 444,664 | $ | 36,802 | 8 | % | ||||||
| Other fees | 20,830 | 9,953 | 10,877 | 109 | % | |||||||||
| Compensation and benefits | (193,347 | ) | (184,571 | ) | (8,776 | ) | (5 | )% | ||||||
| General, administrative and other expenses | (33,626 | ) | (29,136 | ) | (4,490 | ) | (15 | )% | ||||||
| Fee Related Earnings | 275,323 | 240,910 | 34,413 | 14 | % |
Management Fees
The chart below presents the Credit Group's management fees and effective management fee rates for the years ended December 31, 2017 and 2016 ($ in millions):

ARCC's acquisition of ACAS in the first quarter of 2017 increased FPAUM by approximately $2.8 billion at the time of acquisition, which drove an increase of $34.3 million in management fees generated by ARCC in 2017. Conversely, ARCC Part I Fees decreased $15.7 million due primarily to the $10 million per quarter ARCC Part I Fee waiver, which became effective in the second quarter of 2017 and totaled $30.0 million for 2017. Direct lending funds generated additional management fees of $25.5 million from capital deployment in existing funds during the year ended December 31, 2017, $10.3 million of which was attributable to ACE III. We also earned $16.8 million of management fees from 34 new funds that launched at various points throughout 2017. The aforementioned increases were offset by a decrease of $17.9 million in management fees from 23 funds liquidated during the year ended December 31, 2017.
The decrease in effective management fee rate was primarily due to the impact of the ARCC Part I Fee waiver, offset partially by new direct lending funds with higher effective fee rates replacing run-off assets with lower fees rates. ARCC Part I Fees' contribution towards the total effective management fee rate of the Credit Group decreased from 0.29% for 2016 to 0.22% for 2017.
Other Fees. Other fees increased $10.9 million, or 109%, for the year ended December 31, 2017 compared to the year ended December 31, 2016. The increase resulted from a full year of transaction fees based on the increased volume and the amount of loans funded from certain U.S. direct lending funds.
Compensation and Benefits. Compensation and benefits expense increased $9.1 million, or 5%, for the year ended December 31, 2017 compared to the year ended December 31, 2016. The increase was primarily due to additional headcount and higher incentive compensation in line with segment performance. Compensation costs related to employees hired in connection with the ARCC-ACAS Transaction in 2017 was $6.7 million. The increase was offset by a $9.3 million decrease in ARCC Part I compensation during 2017, due to the decrease in ARCC Part I Fee revenue.
General, Administrative and Other Expenses. General, administrative and other expenses increased $4.8 million, or 17%, for the year ended December 31, 2017 compared to the year ended December 31, 2016. The increase was primarily attributable to $4.4 million of costs incurred from operating expenses from a joint venture distribution platform. The platform will be used to raise capital for registered investment companies through independent brokerage networks. The first such fund, a direct lending closed end fund, was launched in 2017.
Realized Income:
The following table presents the components of the Credit Group's RI and the changes for the comparative periods ($ in thousands):
| For the Years Ended December 31, | Favorable (Unfavorable) | |||||||||||||
| 2017 | 2016 | $ Change | % Change | |||||||||||
| Fee Related Earnings | $ | 275,323 | $ | 240,910 | $ | 34,413 | 14 | % | ||||||
| Performance income-realized | 21,087 | 51,435 | (30,348 | ) | (59 | )% | ||||||||
| Performance income compensation-realized | (9,218 | ) | (11,772 | ) | 2,554 | 22 | % | |||||||
| Realized net performance income | 11,869 | 39,663 | (27,794 | ) | (70 | )% | ||||||||
| Investment income-realized | 7,102 | 4,928 | 2,174 | 44 | % | |||||||||
| Interest and other investment income-realized | 10,192 | 22,547 | (12,355 | ) | (55 | )% | ||||||||
| Interest expense | (12,405 | ) | (8,609 | ) | (3,796 | ) | (44 | )% | ||||||
| Realized net investment income | 4,889 | 18,866 | (13,977 | ) | (74 | )% | ||||||||
| Realized Income | $ | 292,081 | $ | 299,439 | (7,358 | ) | (2 | )% |
Realized income for the periods presented was composed of FRE, as explained above, realized net performance income and realized net investment income for the respective periods.
Realized net performance income for the years ended December 31, 2017 and 2016 was primarily attributable to certain direct lending funds that were generating returns in excess of their hurdle rates.
Realized net investment income for the years ended December 31, 2017 and 2016 was primarily attributable to realized gains from our syndicated loan funds.
Credit Group— Carried Interest and Incentive Fees
Accrued carried interest and incentive fee receivable for the Credit Group are comprised of the following (in thousands):
| As of December 31, | |||||||
| 2018 | 2017 | ||||||
| ARCC | $ | 50,246 | — | ||||
| PCS | 21,009 | 4,475 | |||||
| ACE II | 27,060 | 24,090 | |||||
| ACE III | 63,338 | 43,595 | |||||
| ACE IV | 8,517 | — | |||||
| Other credit funds | 40,485 | 96,344 | |||||
| Total Credit Group | $ | 210,655 | $ | 168,504 |
The change in accrued carried interest and incentive fee receivable for the comparative periods was composed of the following: (i) $28.0 million reversal of unconsolidated unrealized incentive fees as a result of our adoption of the new revenue recognition standard; (ii) $27.7 million of unrealized carried interest allocation for the year ended December 31, 2018; (iii) $50.2 million of realized incentive fees received after December 31, 2018; and (iv) foreign currency translation and other adjustments. The following table presents the components of incentive fees and carried interest allocation for the Credit Group. Results for 2017 and 2016 include unrealized incentive fees, which are no longer recognized as revenue following our adoption of the new revenue recognition standard in 2018 (in thousands).
| Year Ended December 31, 2018 | Year Ended December 31, 2017 | Year Ended December 31, 2016 | |||||||||||||||||||||||||||||||||
| Realized | Unrealized | Net | Realized | Unrealized | Net | Realized | Unrealized | Net | |||||||||||||||||||||||||||
| ARCC | $ | 50,246 | $ | — | $ | 50,246 | $ | — | $ | — | $ | — | $ | — | $ | — | $ | — | |||||||||||||||||
| PCS | — | 16,289 | 16,289 | — | 4,406 | 4,406 | — | — | — | ||||||||||||||||||||||||||
| ACE II | 7,246 | 3,514 | 10,760 | 3,201 | 6,543 | 9,744 | 12,124 | (8,110 | ) | 4,014 | |||||||||||||||||||||||||
| ACE III | 28,111 | 21,876 | 49,987 | — | 29,557 | 29,557 | — | 12,035 | 12,035 | ||||||||||||||||||||||||||
| ACE IV | — | 8,572 | 8,572 | — | — | — | — | — | — | ||||||||||||||||||||||||||
| Other credit funds | 35,667 | (22,601 | ) | 13,066 | 17,886 | 13,690 | 31,576 | 39,311 | 18,926 | 58,237 | |||||||||||||||||||||||||
| Total Credit Group | $ | 121,270 | $ | 27,650 | $ | 148,920 | $ | 21,087 | $ | 54,196 | $ | 75,283 | $ | 51,435 | $ | 22,851 | $ | 74,286 |
Credit Group—Assets Under Management
The tables below provide the period‑to‑period rollforwards of AUM for the Credit Group for the years ended December 31, 2018, 2017 and 2016 (in millions):
| Syndicated Loans | High Yield | Credit Opportunities | Alternative Credit | U.S. Direct Lending | E.U. Direct Lending(2) | Total Credit Group | |||||||||||||||||||||
| Balance at 12/31/2017 | $ | 16,530 | $ | 4,630 | $ | 3,333 | $ | 4,791 | $ | 30,640 | $ | 11,808 | $ | 71,732 | |||||||||||||
| Net new par/ equity commitments | 268 | 293 | 128 | 1,597 | 7,504 | 11,315 | 21,105 | ||||||||||||||||||||
| Net new debt commitments | 3,162 | — | — | — | 4,254 | 1,924 | 9,340 | ||||||||||||||||||||
| Distributions | (956 | ) | (808 | ) | (639 | ) | (950 | ) | (3,182 | ) | (1,209 | ) | (7,744 | ) | |||||||||||||
| Change in fund value | (124 | ) | (91 | ) | (61 | ) | 10 | 1,452 | 217 | 1,403 | |||||||||||||||||
| Balance at 12/31/2018 | $ | 18,880 | $ | 4,024 | $ | 2,761 | $ | 5,448 | $ | 40,668 | $ | 24,055 | $ | 95,836 | |||||||||||||
| Average AUM(3) | $ | 17,827 | $ | 4,413 | $ | 3,006 | $ | 5,199 | $ | 36,387 | $ | 17,815 | $ | 84,647 |
| Syndicated Loans | High Yield | Credit Opportunities | Alternative Credit | U.S. Direct Lending(1) | E.U. Direct Lending | Total Credit Group | |||||||||||||||||||||
| Balance at 12/31/2016 | $ | 17,260 | $ | 4,978 | $ | 3,304 | $ | 4,254 | $ | 21,110 | $ | 9,560 | $ | 60,466 | |||||||||||||
| Acquisitions | — | — | — | — | 3,605 | — | 3,605 | ||||||||||||||||||||
| Net new par/ equity commitments | 731 | 558 | (6 | ) | 356 | 6,167 | 864 | 8,670 | |||||||||||||||||||
| Net new debt commitments | 3,536 | — | — | — | 1,882 | 571 | 5,989 | ||||||||||||||||||||
| Distributions | (5,426 | ) | (1,224 | ) | (146 | ) | (173 | ) | (3,011 | ) | (872 | ) | (10,852 | ) | |||||||||||||
| Change in fund value | 429 | 318 | 181 | 354 | 887 | 1,685 | 3,854 | ||||||||||||||||||||
| Balance at 12/31/2017 | $ | 16,530 | $ | 4,630 | $ | 3,333 | $ | 4,791 | $ | 30,640 | $ | 11,808 | $ | 71,732 | |||||||||||||
| Average AUM(3) | $ | 16,861 | $ | 4,685 | $ | 3,343 | $ | 4,482 | $ | 26,957 | $ | 10,743 | $ | 67,071 |
| Syndicated Loans | High Yield | Credit Opportunities | Alternative Credit | U.S. Direct Lending(1) | E.U. Direct Lending | Total Credit Group | |||||||||||||||||||||
| Balance at 12/31/2015 | $ | 17,617 | $ | 3,303 | $ | 3,715 | $ | 3,103 | $ | 23,592 | $ | 9,056 | $ | 60,386 | |||||||||||||
| Net new par/ equity commitments | 624 | 1,664 | 281 | 905 | 751 | 1,228 | 5,453 | ||||||||||||||||||||
| Net new debt commitments | 2,287 | — | — | — | 2,411 | 332 | 5,030 | ||||||||||||||||||||
| Distributions | (3,410 | ) | (459 | ) | (923 | ) | (106 | ) | (6,269 | ) | (801 | ) | (11,968 | ) | |||||||||||||
| Change in fund value | 142 | 470 | 231 | 352 | 625 | (255 | ) | 1,565 | |||||||||||||||||||
| Balance at 12/31/2016 | $ | 17,260 | $ | 4,978 | $ | 3,304 | $ | 4,254 | $ | 21,110 | $ | 9,560 | $ | 60,466 | |||||||||||||
| Average AUM(3) | $ | 17,162 | $ | 4,217 | $ | 3,365 | $ | 3,743 | $ | 22,299 | $ | 9,511 | $ | 60,297 |
(1) Distributions of $3.0 billion and $6.3 billion in 2017 and 2016, respectively, includes $1.6 billion and $4.8 billion reduction in leverage, respectively, related to the paydown associated with the Senior Secured Loan Program (the "SSLP").
(2) Includes $7.6 billion related to ACE IV which had its final close in July 2018.
(3) Represents a five-point average of quarter-end balances for each period.
Credit Group—Fee Paying AUM
The tables below provide the period‑to‑period rollforwards of fee paying AUM for the Credit Group for the years ended December 31, 2018, 2017 and 2016 (in millions):
| Syndicated Loans | High Yield | Credit Opportunities | Alternative Credit | U.S. Direct Lending | E.U. Direct Lending | Total Credit Group | |||||||||||||||||||||
| FPAUM Balance at 12/31/2017 | $ | 15,251 | $ | 4,629 | $ | 2,809 | $ | 3,434 | $ | 16,869 | $ | 6,458 | $ | 49,450 | |||||||||||||
| Commitments | 4,196 | 282 | 17 | 133 | 110 | 30 | 4,768 | ||||||||||||||||||||
| Subscriptions/deployment/increase in leverage | — | 12 | 42 | 480 | 6,212 | 3,688 | 10,434 | ||||||||||||||||||||
| Redemptions/distributions/decrease in leverage | (945 | ) | (805 | ) | (610 | ) | (1,239 | ) | (1,954 | ) | (1,235 | ) | (6,788 | ) | |||||||||||||
| Change in fund value | (170 | ) | (90 | ) | (62 | ) | 18 | 420 | (126 | ) | (10 | ) | |||||||||||||||
| Change in fee basis | (4 | ) | (3 | ) | — | — | — | — | (7 | ) | |||||||||||||||||
| FPAUM Balance at 12/31/2018 | $ | 18,328 | $ | 4,025 | $ | 2,196 | $ | 2,826 | $ | 21,657 | $ | 8,815 | $ | 57,847 | |||||||||||||
| Average FPAUM(1) | $ | 16,913 | $ | 4,412 | $ | 2,473 | $ | 3,356 | $ | 18,787 | $ | 7,675 | $ | 53,616 |
| Syndicated Loans | High Yield | Credit Opportunities | Alternative Credit | U.S. Direct Lending | E.U. Direct Lending | Total Credit Group | |||||||||||||||||||||
| FPAUM Balance at 12/31/2016 | $ | 15,998 | $ | 4,978 | $ | 2,705 | $ | 3,128 | $ | 11,292 | $ | 4,608 | $ | 42,709 | |||||||||||||
| Acquisitions | — | — | — | — | 2,789 | — | 2,789 | ||||||||||||||||||||
| Commitments | 4,116 | 495 | 4 | 273 | 172 | — | 5,060 | ||||||||||||||||||||
| Subscriptions/deployment/increase in leverage | — | 77 | 65 | 325 | 2,998 | 1,629 | 5,094 | ||||||||||||||||||||
| Redemptions/distributions/decrease in leverage | (5,240 | ) | (1,238 | ) | (137 | ) | (587 | ) | (948 | ) | (583 | ) | (8,733 | ) | |||||||||||||
| Change in fund value | 377 | 317 | 172 | 295 | 566 | 595 | 2,322 | ||||||||||||||||||||
| Change in fee basis | — | — | — | — | — | 209 | 209 | ||||||||||||||||||||
| FPAUM Balance at 12/31/2017 | $ | 15,251 | $ | 4,629 | $ | 2,809 | $ | 3,434 | $ | 16,869 | $ | 6,458 | $ | 49,450 | |||||||||||||
| Average FPAUM(1) | $ | 15,550 | $ | 4,685 | $ | 2,788 | $ | 3,316 | $ | 14,627 | $ | 5,632 | $ | 46,598 |
| Syndicated Loans | High Yield | Credit Opportunities | Alternative Credit | U.S. Direct Lending | E.U. Direct Lending | Total Credit Group | |||||||||||||||||||||
| FPAUM Balance at 12/31/2015 | $ | 17,180 | $ | 3,303 | $ | 2,606 | $ | 2,558 | $ | 10,187 | $ | 4,091 | $ | 39,925 | |||||||||||||
| Commitments | 1,985 | 1,537 | 62 | 7 | 40 | — | 3,631 | ||||||||||||||||||||
| Subscriptions/deployment/increase in leverage | 24 | 127 | 366 | 379 | 1,423 | 1,393 | 3,712 | ||||||||||||||||||||
| Redemptions/distributions/decrease in leverage | (3,239 | ) | (459 | ) | (492 | ) | (112 | ) | (928 | ) | (585 | ) | (5,815 | ) | |||||||||||||
| Change in fund value | 48 | 470 | 223 | 296 | 570 | (291 | ) | 1,316 | |||||||||||||||||||
| Change in fee basis | — | — | (60 | ) | — | — | — | (60 | ) | ||||||||||||||||||
| FPAUM Balance at 12/31/2016 | $ | 15,998 | $ | 4,978 | $ | 2,705 | $ | 3,128 | $ | 11,292 | $ | 4,608 | $ | 42,709 | |||||||||||||
| Average FPAUM(1) | $ | 16,234 | $ | 4,217 | $ | 2,569 | $ | 2,805 | $ | 10,640 | $ | 4,473 | $ | 40,938 |
(1) Represents a five-point average of quarter-end balances for each period.
The charts below present FPAUM for the Credit Group by its fee basis as of December 31, 2018, 2017 and 2016 (in millions):


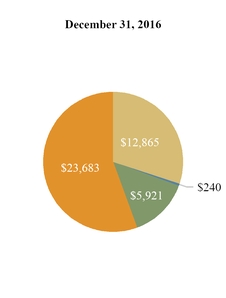
| FPAUM: $57,847 | FPAUM: $49,450 | FPAUM: $42,709 |
| Market value/other | Collateral balances (at par) | Invested capital | Capital commitments |
The components of our AUM, including the portion that is FPAUM, for the Credit Group are presented below as of December 31, 2018, 2017 and 2016 (in millions):

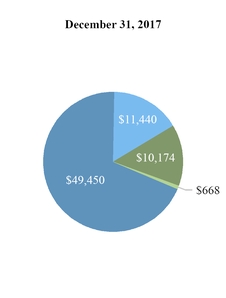

| AUM: $95,836 | AUM: $71,732 | AUM: $60,466 |
| FPAUM | Non-fee paying(1) | AUM not yet earning fees | General partner and affiliates |
(1) Includes $6,734 million, $5,656 million and $6,440 million of AUM of funds from which we indirectly earn management fees as of December 31, 2018, 2017 and 2016, respectively.
Credit Group—Fund Performance Metrics as of December 31, 2018
The Credit Group managed 156 funds as of December 31, 2018. ARCC contributed approximately 55% of the Credit Group’s total management fees for the year ended December 31, 2018. In addition to ARCC, we have six significant funds which contributed approximately 9.1% of the Credit Group’s management fees for the year ended December 31, 2018. Our significant non-drawdown funds are: ARCC; one sub-advised fund; and one separately managed account over which we exercise sole investment discretion. Our significant E.U. direct lending drawdown funds include ACE II, ACE III and Ares Capital Europe IV, L.P. (“ACE IV”), all of which focus on direct lending to European middle market companies. Our significant U.S. direct lending drawdown fund, Ares Private Credit Solutions, L.P. (“PCS”), targets junior capital needs of upper middle market companies in North America.
The following table presents the performance data for our significant non-drawn funds in the Credit Group as of December 31, 2018 ($ in millions):
| Returns(%)(1) | |||||||||||||||||||||||
| Year of | AUM | Fourth Quarter | Year-To-Date | Since Inception(2) | |||||||||||||||||||
| Fund | Inception | Gross | Net | Gross | Net | Gross | Net | Investment Strategy | |||||||||||||||
| ARCC(3) | 2004 | $ | 14,295 | N/A | 2.0 | N/A | 12.4 | N/A | 11.8 | U.S. Direct Lending | |||||||||||||
| Sub-advised Client A(4) | 2007 | 571 | (4.3 | ) | (4.4 | ) | (2.4 | ) | (2.7 | ) | 7.0 | 6.7 | High Yield | ||||||||||
| Separately Managed Account Client B(4) | 2016 | 703 | (3.5 | ) | (3.5 | ) | (2.7 | ) | (3.0 | ) | 3.1 | 2.8 | High Yield |
| (1) | Returns are time-weighted rates of return and include the reinvestment of income and other earnings from securities or other investments and reflect the deduction of all trading expenses. |
| (2) | Since inception returns are annualized. |
| (3) | Net returns are calculated using the fund's NAV and assume dividends are reinvested at the closest quarter-end NAV to the relevant quarterly ex-dividend dates. Additional information related to ARCC can be found in its financial statements filed with the SEC, which are not part of this report. |
| (4) | Gross returns do not reflect the deduction of management fees or any other expenses. Net returns are calculated by subtracting the applicable management fee from the gross returns on a monthly basis. |
The following table presents the performance data of our significant drawdown funds as of December 31, 2018 ($ in millions):
| Year of Inception | AUM | Original Capital Commitments | Cumulative Invested Capital | Realized Proceeds(1) | Unrealized Value(2) | Total Value | MoIC | IRR(%) | |||||||||||||||||||||||||||
| Fund | Gross(3) | Net(4) | Gross(5) | Net(6) | Investment Strategy | ||||||||||||||||||||||||||||||
| ACE II(7) | 2013 | $ | 739 | $ | 1,216 | $ | 963 | $ | 775 | $ | 511 | $ | 1,286 | 1.4x | 1.3x | 10.3 | 7.6 | E.U. Direct Lending | |||||||||||||||||
| ACE III(8) | 2015 | 5,047 | 2,822 | 2,519 | 242 | 2,817 | 3,059 | 1.3x | 1.2x | 16.9 | 12.9 | E.U. Direct Lending | |||||||||||||||||||||||
| PCS | 2017 | 3,471 | 3,365 | 915 | 60 | 941 | 1,001 | 1.1x | 1.1x | NA | NA | U.S. Direct Lending | |||||||||||||||||||||||
| ACE IV Unlevered (9) | 2018 | 8,969 | 2,851 | 450 | — | 466 | 466 | 1.0x | 1.0x | NA | NA | E.U. Direct Lending | |||||||||||||||||||||||
| ACE IV Levered (9) | 4,819 | 760 | — | 804 | 804 | 1.1x | 1.1x | NA | NA | E.U. Direct Lending |
| (1) | Realized proceeds represent the sum of all cash distributions to all partners and if applicable, exclude tax and incentive distributions made to the general partner. |
| (2) | Unrealized value represents the fund's NAV reduced by the accrued incentive allocation, if applicable. There can be no assurance that unrealized values will be realized at the valuations indicated. |
| (3) | The gross multiple of invested capital (“MoIC”) is calculated at the fund-level and is based on the interests of the fee-paying limited partners and if applicable, excludes interests attributable to the non-fee paying limited partners and/or the general partner which does not pay management fees or carried interest. The gross MoIC is before giving effect to management fees, carried interest as applicable and other expenses. |
| (4) | The net MoIC is calculated at the fund-level and is based on the interests of the fee-paying limited partners and if applicable, excludes those interests attributable to the non-fee paying limited partners and/or the general partner which does not pay management fees or carried interest. The net MoIC is after giving effect to management fees, carried interest as applicable and other expenses. The funds may utilize a credit facility during the investment period and for general cash management purposes. |
| (5) | The gross IRR is an annualized since inception gross internal rate of return of cash flows to and from the fund and the fund’s residual value at the end of the measurement period. Gross IRR reflects returns to the fee-paying limited partners and if applicable, excludes interests attributable to the non-fee paying limited partners and/or the general partner which does not pay management fees or carried interest. The cash flow dates used in the gross IRR calculation are based on the actual dates of the cash flows. Gross IRRs are calculated before giving effect to management fees, carried interest as applicable, and other expenses. |
| (6) | The net IRR is an annualized since inception net internal rate of return of cash flows to and from the fund and the fund’s residual value at the end of the measurement period. Net IRRs reflect returns to the fee-paying limited partners and if applicable, exclude interests attributable to the non-fee paying limited partners and/or the general partner who does not pay management fees or carried interest. The cash flow dates used in the net IRR calculations are based on the actual dates of the cash flows. The net IRRs are calculated after giving effect to management fees, carried interest as applicable, and other expenses. The funds may utilize a credit facility during the investment period and for general cash management purposes. Net fund-level IRRs would likely have been lower had such fund called capital from its limited partners instead of utilizing the credit facility. |
| (7) | ACE II is made up of two feeder funds, one denominated in U.S. dollars and one denominated in Euros. The gross and net IRR and gross and net MoIC presented in the chart are for the U.S. dollar denominated feeder fund as that is the larger of the two feeders. The gross and net IRR for the Euro denominated feeder fund are 11.9% and 9.0%, respectively. The gross and net MoIC for the Euro denominated feeder fund are 1.5x and 1.4x, respectively. Original capital commitments are converted to U.S. dollars at the prevailing exchange rate at the time of the fund's closing. All other values for ACE II are for the combined fund and are converted to U.S. dollars at the prevailing quarter-end exchange rate. The |
variance between the gross and net MoICs and the net IRRs for the U.S. dollar denominated and Euro denominated feeder funds is driven by the U.S. GAAP mark-to-market reporting of the foreign currency hedging program in the U.S. dollar denominated feeder fund. The feeder fund will be holding the foreign currency hedges until maturity, and therefore is expected to ultimately recognize a gain while mitigating the currency risk associated with the initial principal investments.
| (8) | ACE III is made up of two feeder funds, one denominated in U.S. dollars and one denominated in Euros. The gross and net MoIC presented in the chart are for the Euro denominated feeder fund as that is the larger of the two feeders. The gross and net IRR for the U.S. dollar denominated feeder fund are 16.6% and 12.6%, respectively. The gross and net MoIC for the U.S. dollar denominated feeder fund are 1.3x and 1.2x, respectively. Original capital commitments are converted to U.S. dollars at the prevailing exchange rate at the time of the fund's closing. All other values for ACE III are for the combined fund and are converted to U.S. dollars at the prevailing quarter-end exchange rate. |
| (9) | ACE IV is made up of four parallel funds: ACE IV (E) Unlevered, ACE IV (G) Unlevered, ACE IV (E) Levered, and ACE IV (G) Levered, all of which with a 2018 inception date. The gross and net MoIC presented in the chart are for ACE IV (E) Unlevered and ACE IV (E) Levered as those are the largest of the levered and unlevered parallel funds. Metrics for ACE IV (E) Levered are inclusive of a U.S. Dollar denominated feeder fund, which has not been presented separately. The gross and net MoIC for ACE IV (G) Unlevered are 1.0x and 1.0x, respectively. The gross and net MoIC for ACE IV (G) Levered are 1.1x and 1.0x, respectively. Original capital commitments are converted to U.S. dollars at the prevailing exchange rate at the time of the fund's closing. AUM is presented as the aggregate ACE IV amount. All other values for ACE IV Unlevered and ACE IV Levered are for the combined levered and unlevered parallel funds and are converted to U.S. dollars at the prevailing quarter-end exchange rate. |
Private Equity Group—Year Ended December 31, 2018 Compared to Year Ended December 31, 2017
Fee Related Earnings:
The following table presents the components of the Private Equity Group's FRE and the changes for the comparative periods ($ in thousands):
| For the Years Ended December 31, | Favorable (Unfavorable) | |||||||||||||
| 2018 | 2017 | $ Change | % Change | |||||||||||
| Management fees | $ | 198,182 | $ | 198,498 | $ | (316 | ) | < 1% | ||||||
| Other fees | 1,008 | 1,495 | (487 | ) | (33 | )% | ||||||||
| Compensation and benefits | (74,672 | ) | (68,569 | ) | (6,103 | ) | (9 | )% | ||||||
| General, administrative and other expenses | (18,482 | ) | (17,561 | ) | (921 | ) | (5 | )% | ||||||
| Fee Related Earnings | $ | 106,036 | $ | 113,863 | (7,827 | ) | (7 | )% |
Management fees
The chart below presents the Private Equity Group's management fees and effective management fee rates for the years ended December 31, 2018 and 2017 ($ in millions):

Management fees attributable to Ares Corporate Opportunities Fund V, L.P. (“ACOF V”), which began generating fees in March 2017, increased by $18.5 million for the year ended December 31, 2018. Capital deployment in Ares Special Situations Fund IV, L.P. (“SSF IV”) increased its fee basis, which generated additional management fees of $5.1 million in 2018. Additionally, the formation of new funds during 2018 increased management fees by $2.8 million. Conversely, monetizations and distributions of portfolio holdings of infrastructure and power funds and by ACOF III during 2018 resulted in a $12.7 million decrease in management fees compared to 2017. Management fees from ACOF IV decreased by $8.7 million in 2018 due to a reduced fee rate and fee basis in connection with the launch of ACOF V. Additionally, management fees generated from Ares Energy Investors Fund V, L.P. (“EIF V”) decreased by $4.8 million primarily due to one-time catch-up fees related to prior years recognized during 2017.
Compensation and Benefits. Compensation and benefits expense increased $6.1 million, or 9%, for the year ended December 31, 2018 compared to the year ended December 31, 2017. The increase was primarily due to additional headcount to expand our capabilities within the special opportunities strategy and to support an increasing asset base and pool of investments within our corporate opportunities strategy.
Realized Income:
The following table presents the components of the Private Equity Group's RI and the changes for the comparative periods ($ in thousands):
| For the Years Ended December 31, | Favorable (Unfavorable) | ||||||||||||
| 2018 | 2017 | $ Change | % Change | ||||||||||
| Fee Related Earnings | $ | 106,036 | $ | 113,863 | (7,827 | ) | (7 | )% | |||||
| Performance income-realized | 139,820 | 287,092 | (147,272 | ) | (51 | )% | |||||||
| Performance income compensation-realized | (111,764 | ) | (228,774 | ) | 117,010 | 51 | % | ||||||
| Realized net performance income | 28,056 | 58,318 | (30,262 | ) | (52 | )% | |||||||
| Investment income-realized | 17,816 | 22,625 | (4,809 | ) | (21 | )% | |||||||
| Interest and other investment income-realized | 4,624 | 3,226 | 1,398 | 43 | % | ||||||||
| Interest expense | (6,000 | ) | (5,218 | ) | (782 | ) | (15 | )% | |||||
| Realized net investment income | 16,440 | 20,633 | (4,193 | ) | (20 | )% | |||||||
| Realized Income | $ | 150,532 | $ | 192,814 | (42,282 | ) | (22 | )% |
Realized income for the periods presented was composed of FRE, as explained above, realized net performance income and realized net investment income for the respective periods.
Realized net performance income and net realized investment income for 2018 were primarily attributable to realizations and from ACOF III's partial sale of its position in a publicly traded retail portfolio company. Realized net performance income and realized net investment income for 2017 were primarily attributable to realizations from monetizations of multiple investments held within ACOF III, ACOF IV and SSF IV.
Private Equity Group—Year Ended December 31, 2017 Compared to Year Ended December 31, 2016
Fee Related Earnings:
The following table presents the components of the Private Equity Group's FRE and the changes for the comparative periods ($ in thousands):
| For the Years Ended December 31, | Favorable (Unfavorable) | |||||||||||||
| 2017 | 2016 | $ Change | % Change | |||||||||||
| Management fees | $ | 198,498 | $ | 147,790 | $ | 50,708 | 34 | % | ||||||
| Other fees | 1,495 | 1,544 | (49 | ) | (3 | )% | ||||||||
| Compensation and benefits | (68,569 | ) | (61,276 | ) | (7,293 | ) | (12 | )% | ||||||
| General, administrative and other expenses | (17,561 | ) | (14,679 | ) | (2,882 | ) | (20 | )% | ||||||
| Fee Related Earnings | $ | 113,863 | $ | 73,379 | 40,484 | 55 | % |
Management fees
The chart below presents the Private Equity Group's management fees and effective management fee rates for the years ended December 31, 2017 and 2016 ($ in millions):
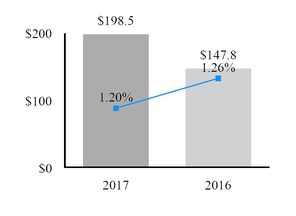
The increase was primarily attributable to ACOF V, which began generating fees in March 2017 totaling $90.8 million for the year ended December 31, 2017. In addition, EIF V held its final close in the second quarter of 2017, generating additional management fees of $8.9 million for the year ended December 31, 2017. Management fees generated by EIF V for the year ended December 31, 2017 included $5.8 million of one-time catch-up fees. Partially offsetting these increases were management fees generated by ACOF IV, which decreased by $37.1 million due to a reduced fee rate and change in fee basis in connection with the launch of ACOF V. Additionally, monetizations and distributions, which reduced the fee basis of certain infrastructure and power funds during 2017, resulted in a $9.4 million decrease in management fees.
The decrease in the effective management fee rate resulted from the reduced fee rate at ACOF IV partially offset by ACOF V management fees.
Compensation and Benefits. Compensation and benefits expense increased $7.3 million, or 12%, for the year ended December 31, 2017 compared to the year ended December 31, 2016. The increase was primarily due to increases in salary and benefits expenses as a result of additional headcount needed to support ACOF V's capital deployment, as well as merit based increases.
General, Administrative and Other Expenses. General, administrative and other expenses increased $2.9 million, or 20%, for the year ended December 31, 2017 compared to the year ended December 31, 2016. The increase in the current year was primarily attributable to an increase in recruiting fees of $1.7 million and other business support costs driven by increased headcount.
Realized Income:
The following table presents the components of the Private Equity Group's RI and the changes for the comparative periods ($ in thousands):
| For the Years Ended December 31, | Favorable (Unfavorable) | ||||||||||||
| 2017 | 2016 | $ Change | % Change | ||||||||||
| Fee Related Earnings | $ | 113,863 | $ | 73,379 | 40,484 | 55 | % | ||||||
| Performance income-realized | 287,092 | 230,162 | 56,930 | 25 | % | ||||||||
| Performance income compensation-realized | (228,774 | ) | (184,072 | ) | (44,702 | ) | (24 | )% | |||||
| Realized net performance income | 58,318 | 46,090 | 12,228 | 27 | % | ||||||||
| Investment income-realized | 22,625 | 18,773 | 3,852 | 21 | % | ||||||||
| Interest and other investment income-realized | 3,226 | 16,891 | (13,665 | ) | (81 | )% | |||||||
| Interest expense | (5,218 | ) | (5,589 | ) | 371 | 7 | % | ||||||
| Realized net investment income | 20,633 | 30,075 | (9,442 | ) | (31 | )% | |||||||
| Realized Income | $ | 192,814 | $ | 149,544 | 43,270 | 29 | % |
Realized income for the periods presented was composed of FRE, as explained above, realized net performance income and realized net investment income for the respective periods.
Realized net performance income and net realized investment income for 2017 were primarily attributable to realizations from monetizations of multiple investments held within ACOF III, ACOF IV and SSF IV. Realized net performance income and realized net investment income for 2016 were primarily attributable to realizations from monetizations of multiple investments held within ACOF III.
Private Equity Group—Carried Interest
Accrued carried interest for the Private Equity Group are comprised of the following (in thousands):
| As of December 31, | |||||||
| 2018 | 2017 | ||||||
| ACOF III | $ | 316,377 | $ | 570,578 | |||
| ACOF IV | 183,595 | 217,354 | |||||
| EIF V | — | 16,215 | |||||
| Other funds | 6,900 | 11,260 | |||||
| Total Private Equity Group | $ | 506,872 | $ | 815,407 |
The following table presents the components of carried interest allocation for the Private Equity Group (in thousands):
| Year Ended December 31, 2018 | Year Ended December 31, 2017 | Year Ended December 31, 2016 | |||||||||||||||||||||||||||||||||
| Realized | Unrealized | Net | Realized | Unrealized | Net | Realized | Unrealized | Net | |||||||||||||||||||||||||||
| ACOF III | $ | 138,216 | $ | (254,201 | ) | $ | (115,985 | ) | $ | 58,946 | $ | 227,620 | $ | 286,566 | $ | 161,216 | $ | 4,574 | $ | 165,790 | |||||||||||||||
| ACOF IV | 1,604 | (33,759 | ) | (32,155 | ) | 223,479 | (16,852 | ) | 206,627 | 41,807 | 181,571 | 223,378 | |||||||||||||||||||||||
| EIF V | — | (16,215 | ) | (16,215 | ) | — | (294 | ) | (294 | ) | — | 16,510 | 16,510 | ||||||||||||||||||||||
| Other funds | — | (4,361 | ) | (4,361 | ) | 4,667 | (18,915 | ) | (14,248 | ) | 27,139 | (14,368 | ) | 12,771 | |||||||||||||||||||||
| Total Private Equity Group | $ | 139,820 | $ | (308,536 | ) | $ | (168,716 | ) | $ | 287,092 | $ | 191,559 | $ | 478,651 | $ | 230,162 | $ | 188,287 | $ | 418,449 |
Private Equity Group—Assets Under Management
The tables below provide the period‑to‑period rollforwards of AUM for the Private Equity Group for the years ended December 31, 2018, 2017 and 2016 (in millions):
| Corporate Private Equity | Infrastructure and Power | Special Opportunities | Energy Opportunities | Total Private Equity Group | |||||||||||||||
| Balance at 12/31/2017 | $ | 18,557 | $ | 4,423 | $ | 1,550 | $ | — | $ | 24,530 | |||||||||
| Net new equity commitments | 213 | 354 | 175 | 756 | 1,498 | ||||||||||||||
| Net new debt commitments | — | — | 100 | — | 100 | ||||||||||||||
| Distributions | (844 | ) | (982 | ) | (74 | ) | — | (1,900 | ) | ||||||||||
| Change in fund value | (767 | ) | 47 | (18 | ) | (3 | ) | (741 | ) | ||||||||||
| Balance at 12/31/2018 | $ | 17,159 | $ | 3,842 | $ | 1,733 | $ | 753 | $ | 23,487 | |||||||||
| Average AUM(2) | $ | 18,003 | $ | 4,033 | $ | 1,597 | $ | 755 | $ | 23,784 |
| Corporate Private Equity | Infrastructure and Power | Special Opportunities | Total Private Equity Group | ||||||||||||
| Balance at 12/31/2016 | $ | 18,162 | $ | 5,143 | $ | 1,736 | $ | 25,041 | |||||||
| Net new equity commitments | 56 | 300 | — | 356 | |||||||||||
| Distributions | (2,130 | ) | (697 | ) | (187 | ) | (3,014 | ) | |||||||
| Change in fund value | 2,469 | (323 | ) | 1 | 2,147 | ||||||||||
| Balance at 12/31/2017 | $ | 18,557 | $ | 4,423 | $ | 1,550 | $ | 24,530 | |||||||
| Average AUM(2) | $ | 18,591 | $ | 4,697 | $ | 1,626 | $ | 24,914 |
| Corporate Private Equity(1) | Infrastructure and Power | Special Opportunities | Total Private Equity Group | ||||||||||||
| Balance at 12/31/2015 | $ | 15,908 | $ | 5,207 | $ | 1,863 | $ | 22,978 | |||||||
| Net new equity commitments | 2,184 | 130 | — | 2,314 | |||||||||||
| Distributions | (1,886 | ) | (372 | ) | (261 | ) | (2,519 | ) | |||||||
| Change in fund value | 1,956 | 178 | 134 | 2,268 | |||||||||||
| Balance at 12/31/2016 | $ | 18,162 | $ | 5,143 | $ | 1,736 | $ | 25,041 | |||||||
| Average AUM(2) | $ | 17,651 | $ | 5,102 | $ | 1,800 | $ | 24,553 |
| (1) | Net new equity commitments in 2016 includes $2.1 billion of commitments to ACOF V. |
| (2) | Represents a five-point average of quarter-end balances for each period; except for energy opportunities, which represents the average calculated using AUM on the strategy's first fund's inception date and December 31, 2018. |
Private Equity Group—Fee Paying AUM
The tables below provide the period‑to‑period rollforwards of fee paying AUM, for the Private Equity Group for the years ended December 31, 2018, 2017 and 2016 (in millions):
| Corporate Private Equity | Infrastructure and Power | Special Opportunities | Energy Opportunities | Total Private Equity Group | |||||||||||||||
| FPAUM Balance at 12/31/2017 | $ | 12,073 | $ | 4,019 | $ | 766 | $ | — | $ | 16,858 | |||||||||
| Commitments | 13 | 354 | — | 682 | 1,049 | ||||||||||||||
| Subscriptions/deployment/increase in leverage | 149 | 38 | 709 | — | 896 | ||||||||||||||
| Redemptions/distributions/decrease in leverage | (490 | ) | (939 | ) | (180 | ) | — | (1,609 | ) | ||||||||||
| Change in fund value | (6 | ) | — | 12 | — | 6 | |||||||||||||
| Change in fee basis | (23 | ) | — | (106 | ) | — | (129 | ) | |||||||||||
| FPAUM Balance at 12/31/2018 | $ | 11,716 | $ | 3,472 | $ | 1,201 | $ | 682 | $ | 17,071 | |||||||||
| Average FPAUM(1) | $ | 12,026 | $ | 3,621 | $ | 977 | $ | 682 | $ | 16,760 |
| Corporate Private Equity | Infrastructure and Power | Special Opportunities | Total Private Equity Group | ||||||||||||
| FPAUM Balance at 12/31/2016 | $ | 6,454 | $ | 4,232 | $ | 628 | $ | 11,314 | |||||||
| Commitments | 7,655 | 300 | — | 7,955 | |||||||||||
| Subscriptions/deployment/increase in leverage | 478 | 230 | 414 | 1,122 | |||||||||||
| Redemptions/distributions/decrease in leverage | (966 | ) | (392 | ) | (248 | ) | (1,606 | ) | |||||||
| Change in fund value | 4 | (351 | ) | (28 | ) | (375 | ) | ||||||||
| Change in fee basis | (1,552 | ) | — | — | (1,552 | ) | |||||||||
| FPAUM Balance at 12/31/2017 | $ | 12,073 | $ | 4,019 | $ | 766 | $ | 16,858 | |||||||
| Average FPAUM(1) | $ | 11,157 | $ | 4,047 | $ | 682 | $ | 15,886 |
| Corporate Private Equity | Infrastructure and Power | Special Opportunities | Total Private Equity Group | ||||||||||||
| FPAUM Balance at 12/31/2015 | $ | 6,957 | $ | 4,454 | $ | 1,051 | $ | 12,462 | |||||||
| Commitments | 29 | 130 | — | 159 | |||||||||||
| Subscriptions/deployment/increase in leverage | 52 | 45 | (4 | ) | 93 | ||||||||||
| Redemptions/distributions/decrease in leverage | (288 | ) | (46 | ) | (331 | ) | (665 | ) | |||||||
| Change in fund value | — | (80 | ) | (88 | ) | (168 | ) | ||||||||
| Change in fee basis | (296 | ) | (271 | ) | — | (567 | ) | ||||||||
| FPAUM Balance at 12/31/2016 | $ | 6,454 | $ | 4,232 | $ | 628 | $ | 11,314 | |||||||
| Average FPAUM(1) | $ | 6,652 | $ | 4,306 | $ | 842 | $ | 11,800 |
| (1) | Represents a five-point average of quarter-end balances for each period; except for energy opportunities, which represents the average calculated using FPAUM on the strategy's first fund's inception date and December 31, 2018. |
The charts below present FPAUM for the Private Equity Group by its fee basis as of December 31, 2018, 2017 and 2016 (in millions):


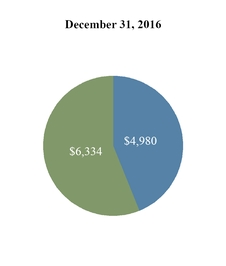
| FPAUM: $17,071 | FPAUM: $16,858 | FPAUM: $11,314 |
| Invested capital | Capital commitments |
The components of our AUM, including the portion that is FPAUM, for the Private Equity Group are presented below as of December 31, 2018, 2017 and 2016 (in millions):
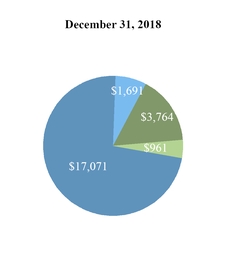


| AUM: $23,487 | AUM: $24,530 | AUM: $25,041 |
| FPAUM | Non-fee paying | AUM not yet earning fees | General partner and affiliates |
Private Equity Group—Fund Performance Metrics as of December 31, 2018
The Private Equity Group managed 22 commingled funds and related co-investment vehicles as of December 31, 2018. Our significant funds combined for approximately 92% of the Private Equity Group’s management fees for the year ended December 31, 2018. Our Corporate Private Equity funds focus on majority or shared-control investments, principally in under-capitalized companies in North America, Europe and Asia. Our special opportunities funds invest opportunistically across a broad spectrum of distressed or mispriced investments. Our infrastructure and power funds focus on generating long-term, stable cash-flowing investments in the power generation, transmission and midstream energy sector. ACOF III, ACOF IV and U.S. Power Fund IV ("USPF IV") are in harvest mode, meaning they are generally not seeking to deploy capital into new investment opportunities, while ACOF V, SSF IV and EIF V are in deployment mode. We do not present fund performance metrics for significant funds with less than two years of historical information, except for those significant funds that pay management fees on invested capital, in which case performance is shown at the earlier of (i) the one-year anniversary of the fund's first investment or (ii) such time the fund is 50% or more invested.
The following table presents the performance data for our significant funds in the Private Equity Group, all of which are drawdown funds, as of December 31, 2018 ($ in thousands):
| Year of Inception | AUM | Original Capital Commitments | Cumulative Invested Capital | Realized Proceeds(1) | Unrealized Value(2) | Total Value | MoIC | IRR(%) | |||||||||||||||||||||||||||||
| Fund | Gross(3) | Net(4) | Gross(5) | Net(6) | Investment Strategy | ||||||||||||||||||||||||||||||||
| ACOF III | 2008 | $ | 3,152 | $ | 3,510 | $ | 3,867 | $ | 6,973 | $ | 2,847 | $ | 9,820 | 2.5x | 2.2x | 28.9 | 20.5 | Corporate Private Equity | |||||||||||||||||||
| USPF IV | 2010 | 1,666 | 1,688 | 1,960 | 1,110 | 1,468 | 2,578 | 1.3x | 1.2x | 8.6 | 5.2 | Infrastructure and Power | |||||||||||||||||||||||||
| ACOF IV | 2012 | 5,283 | 4,700 | 4,143 | 2,533 | 4,461 | 6,994 | 1.7x | 1.5x | 18.5 | 12.1 | Corporate Private Equity | |||||||||||||||||||||||||
| EIF V | 2015 | 796 | 801 | 740 | 206 | 629 | 835 | 1.1x | 1.0x | 13.1 | 5.7 | Infrastructure and Power | |||||||||||||||||||||||||
| SSF IV (7) | 2015 | 1,418 | 1,515 | 2,305 | 1,033 | 1,116 | 2,149 | 0.9x | 0.9x | (7.3 | ) | (9.2 | ) | Special Opportunities | |||||||||||||||||||||||
| ACOF V | 2017 | 7,797 | 7,850 | 3,523 | 137 | 3,591 | 3,728 | 1.1x | 1.0x | NA | NA | Corporate Private Equity |
| (1) | Realized proceeds represent the sum of all cash dividends, interest income, other fees and cash proceeds from realizations of interests in portfolio investments. |
| (2) | Unrealized value represents the fair market value of remaining investments. There can be no assurance that unrealized investments will be realized at the valuations indicated. |
| (3) | The gross MoIC is calculated at the investment-level and is based on the interests of all partners. The gross MoIC is before giving effect to management fees, carried interest, as applicable, and other expenses. |
| (4) | The net MoIC for the infrastructure and power and special opportunities funds is calculated at the fund-level. The net MoIC for the corporate private equity funds is calculated at the investment level. For all funds, the net MoIC is based on the interests of the fee-paying limited partners and, if applicable, excludes interests attributable to the non-fee paying limited partners and/or the general partner who does not pay management fees or carried interest. The net MoIC is after giving effect to management fees, carried interest, as applicable, and other expenses. The funds may utilize a credit facility during the investment period and for general cash management purposes. |
| (5) | The gross IRR is an annualized since inception gross internal rate of return of cash flows to and from investments and the residual value of the investments at the end of the measurement period. Gross IRRs reflect returns to all partners. For SSF IV, cash flows used in the gross IRR calculation are based on the actual dates of the cash flows. For all other funds, cash flows are assumed to occur at month-end. The gross IRRs are calculated before giving effect to management fees, carried interest, as applicable, and other expenses. |
| (6) | The net IRR is an annualized since inception net internal rate of return of cash flows to and from the fund and the fund’s residual value at the end of the measurement period. Net IRRs reflect returns to the fee-paying limited partners and, if applicable, exclude interests attributable to the non-fee paying limited partners and/or the general partner who does not pay management fees or carried interest. The cash flow dates used in the net IRR calculation are based on the actual dates of the cash flows. The net IRRs are calculated after giving effect to management fees, carried interest, as applicable, and other expenses and exclude commitments by the general partner and Schedule I investors who do not pay either management fees or carried interest. The funds may utilize a credit facility during the investment period and for general cash management purposes. Net fund-level IRRs would have generally been lower had such fund called capital from its limited partners instead of utilizing the credit facility. |
| (7) | In January 2017, a new team assumed portfolio management of SSF IV. In addition to presenting the cumulative performance measure by SSF IV, we have also adopted a new performance measurement called “SSF IV 2.0”. SSF IV 2.0 is a subset of SSF IV positions and is intended to provide insight into the new team’s cumulative investment performance. SSF IV 2.0 investments represent (i) existing and re-underwritten positions by the new team on January 1, 2017 and (ii) all new investments made by the new team since January 1, 2017. As part of the re-underwriting process, each liquid investment in the SSF IV portfolio was evaluated and a determination was made whether to continue to hold such investment in the SSF IV portfolio or dispose of such investment. At the same time, legacy illiquid investments have been excluded from the SSF IV 2.0 track record as it was not possible to dispose of such investments in the near-term due to their private, illiquid nature. Since January 2017, SSF IV 2.0 has generated gross and net (realized and unrealized) internal rates of return of 7.2% and 5.2%, respectively, through December 31, 2018. |
Real Estate Group—Year Ended December 31, 2018 Compared to Year Ended December 31, 2017
Fee Related Earnings:
The following table presents the components of the Real Estate Group's FRE and the changes for the comparative periods ($ in thousands):
| For the Years Ended December 31, | Favorable (Unfavorable) | |||||||||||||
| 2018 | 2017 | $ Change | % Change | |||||||||||
| Management fees | $ | 73,663 | $ | 64,861 | $ | 8,802 | 14 | % | ||||||
| Other fees | 33 | 106 | (73 | ) | (69 | )% | ||||||||
| Compensation and benefits | (38,623 | ) | (39,586 | ) | 963 | 2 | % | |||||||
| General, administrative and other expenses | (11,123 | ) | (10,519 | ) | (604 | ) | (6 | )% | ||||||
| Fee Related Earnings | $ | 23,950 | $ | 14,862 | 9,088 | 61 | % |
Management Fees
The chart below presents the Real Estate Group's management fees and effective management fee rates for the years ended December 31, 2018 and 2017 ($ in millions):

Management fees increased by $19.9 million for the year ended December 31, 2018 from the launches of Ares European Real Estate Fund V L.P. (“EF V”) and Ares US Real Estate Fund IX, L.P. (“VEF IX”), from which $6.5 million was attributable to catch up fees. This increase was primarily offset by a decrease of $11.2 million for the year ended December 31, 2018 attributable to partial realizations of one of our European real estate equity funds and by monetizations of investments within certain of our other real estate equity funds.
Realized Income:
The following table presents the components of the Real Estate Group's RI and the changes for the comparative periods ($ in thousands):
| For the Years Ended December 31, | Favorable (Unfavorable) | ||||||||||||
| 2018 | 2017 | $ Change | % Change | ||||||||||
| Fee Related Earnings | $ | 23,950 | $ | 14,862 | 9,088 | 61 | % | ||||||
| Performance income-realized | 96,117 | 9,608 | 86,509 | NM | |||||||||
| Performance income compensation-realized | (64,292 | ) | (4,338 | ) | (59,954 | ) | NM | ||||||
| Realized net performance income | 31,825 | 5,270 | 26,555 | NM | |||||||||
| Investment income-realized | 11,409 | 5,534 | 5,875 | 106 | % | ||||||||
| Interest and other investment income-realized | 2,257 | 511 | 1,746 | NM | |||||||||
| Interest expense | (1,836 | ) | (1,650 | ) | (186 | ) | (11 | )% | |||||
| Realized net investment income | 11,830 | 4,395 | 7,435 | 169 | % | ||||||||
| Realized Income | $ | 67,605 | $ | 24,527 | 43,078 | 176 | % |
Realized income for the periods presented was composed of FRE, as explained above, realized net performance income and realized net investment income for the respective periods.
Realized net performance income for the year ended December 31, 2018 was primarily attributable to gains on the sale of a large conference resort center in Colorado that was held in multiple funds and multiple properties within Ares European Real Estate Fund IV L.P. (“EF IV”). Realized net investment income for the year ended December 31, 2018 was primarily attributable to the aforementioned sale of the conference resort center in Colorado and various other U.S. real estate equity funds.
Realized net performance income and realized net investment income for the year ended December 31, 2017 was primarily attributable to realizations from monetizations of investments within certain of our real estate equity funds nearing the end of their fund terms.
Real Estate Group—Year Ended December 31, 2017 Compared to Year Ended December 31, 2016
Fee Related Earnings:
The following table presents the components of the Real Estate Group's FRE and the changes for the comparative periods ($ in thousands):
| For the Years Ended December 31, | Favorable (Unfavorable) | |||||||||||||
| 2017 | 2016 | $ Change | % Change | |||||||||||
| Management fees | $ | 64,861 | $ | 66,997 | $ | (2,136 | ) | (3 | )% | |||||
| Other fees | 106 | 854 | (748 | ) | (88 | )% | ||||||||
| Compensation and benefits | (39,586 | ) | (41,091 | ) | 1,505 | 4 | % | |||||||
| General, administrative and other expenses | (10,519 | ) | (10,603 | ) | 84 | 1 | % | |||||||
| Fee Related Earnings | $ | 14,862 | $ | 16,157 | (1,295 | ) | (8 | )% |
Management Fees
The chart below presents the Real Estate Group's management fees and effective management fee rates for the years ended December 31, 2017 and 2016 ($ in millions):
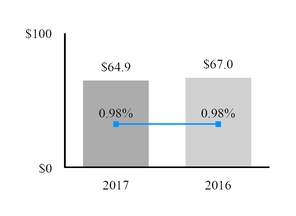
The decrease was primarily attributable to a 2% decline in average fee paying AUM for the year ended December 31, 2017 compared to the year ended December 31, 2016. Ares Real Estate Fund VIII ("US VIII") and EF IV had decreases in management fees of $1.1 million and $1.3 million, respectively, for the year ended December 31, 2017 compared to the year ended December 31, 2016 due to a change in the fee basis in connection with the launch of a successor fund and the end of the investment period, respectively. The winding down of one of our U.S. real estate equity funds resulted in a reduction in management fees of $2.1 million for the year ended December 31, 2017 compared to the year ended December 31, 2016. Partially offsetting these decreases was $2.4 million of management fees contributed by one of our U.S. real estate equity funds that began generating fees in 2017.
Compensation and Benefits. Compensation and benefits expenses decreased $1.5 million, or 4%, for the year ended December 31, 2017 compared to the year ended December 31, 2016. The decrease was due to a reorganization of the group's management team that occurred in the latter half of 2016.
Realized Income:
The following table presents the components of the Real Estate Group's RI and the changes for the comparative periods ($ in thousands):
| For the Years Ended December 31, | Favorable (Unfavorable) | ||||||||||||
| 2017 | 2016 | $ Change | % Change | ||||||||||
| Fee Related Earnings | $ | 14,862 | $ | 16,157 | (1,295 | ) | (8 | )% | |||||
| Performance income-realized | 9,608 | 11,401 | (1,793 | ) | (16 | )% | |||||||
| Performance income compensation-realized | (4,338 | ) | (2,420 | ) | (1,918 | ) | (79 | )% | |||||
| Realized net performance income | 5,270 | 8,981 | (3,711 | ) | (41 | )% | |||||||
| Investment income-realized | 5,534 | 931 | 4,603 | NM | |||||||||
| Interest and other investment income-realized | 511 | 1,598 | (1,087 | ) | (68 | )% | |||||||
| Interest expense | (1,650 | ) | (1,056 | ) | (594 | ) | (56 | )% | |||||
| Realized net investment income | 4,395 | 1,473 | 2,922 | 198 | % | ||||||||
| Realized Income | $ | 24,527 | $ | 26,611 | (2,084 | ) | (8 | )% |
Realized income for the periods presented was composed of FRE, as explained above, realized net performance income and realized net investment income for the respective periods.
Realized net performance income and realized net investment income for the year ended December 31, 2017 and December 31, 2016 were primarily attributable to realizations from monetizations of investments within certain of our real estate equity funds.
Real Estate Group— Carried Interest and Incentive Fees
Accrued carried interest and incentive fee receivable for the Real Estate Group are comprised of the following (in thousands):
| As of December 31, | |||||||
| 2018 | 2017 | ||||||
| EPEP II | $ | 7,980 | $ | 4,622 | |||
| US VIII | 50,847 | 32,940 | |||||
| EF IV | 65,166 | 50,801 | |||||
| Other real estate funds | 49,256 | 32,906 | |||||
| Subtotal | 173,249 | 121,269 | |||||
| Other fee generating funds(1) | 12,197 | 15,362 | |||||
| Total Real Estate Group | $ | 185,446 | $ | 136,631 |
| (1) | Relates to investment income from AREA Sponsor Holdings LLC that is reclassified for segment reporting to align with the character of the underlying income generated. |
The change in accrued carried interest and incentive fee receivable for the comparative periods was composed of the following: (i) $33.7 million of unrealized carried interest allocation for the year ended December 31, 2018; (ii) $16.9 million of realized carried interest allocations received after December 31, 2018; and (iii) foreign currency translation and other adjustments. The following table presents the components of incentive fees and carried interest allocation for the Real Estate Group (in thousands):
| Year Ended December 31, 2018 | Year Ended December 31, 2017 | Year Ended December 31, 2016 | |||||||||||||||||||||||||||||||||
| Realized | Unrealized | Net | Realized | Unrealized | Net | Realized | Unrealized | Net | |||||||||||||||||||||||||||
| EPEP II | $ | 1,242 | $ | 3,586 | $ | 4,828 | $ | — | $ | 4,523 | $ | 4,523 | $ | — | $ | — | $ | — | |||||||||||||||||
| US VIII | — | 17,907 | 17,907 | — | 20,366 | 20,366 | — | 9,482 | 9,482 | ||||||||||||||||||||||||||
| EF IV | 24,301 | 14,334 | 38,635 | — | 46,750 | 46,750 | — | 4,052 | 4,052 | ||||||||||||||||||||||||||
| Other real estate funds | 67,728 | 485 | 68,213 | 6,887 | 9,307 | 16,194 | 4,034 | 8,688 | 12,722 | ||||||||||||||||||||||||||
| Subtotal | 93,271 | 36,312 | 129,583 | 6,887 | 80,946 | 87,833 | 4,034 | 22,222 | 26,256 | ||||||||||||||||||||||||||
| Other fee generating funds(1) | 2,846 | (2,640 | ) | 206 | 2,721 | (786 | ) | 1,935 | 7,367 | (4,888 | ) | 2,479 | |||||||||||||||||||||||
| Total Real Estate Group | $ | 96,117 | $ | 33,672 | $ | 129,789 | $ | 9,608 | $ | 80,160 | $ | 89,768 | $ | 11,401 | $ | 17,334 | $ | 28,735 |
| (1) | Relates to investment income from AREA Sponsor Holdings LLC that is reclassified for segment reporting to align with the character of the underlying income generated. |
Real Estate Group—Assets Under Management
The tables below provide the period‑to‑period rollforwards of AUM for the Real Estate Group for the years ended December 31, 2018, 2017 and 2016 (in millions):
| Real Estate Equity - U.S. | Real Estate Equity - E.U. | Real Estate Debt | Total Real Estate Group | ||||||||||||
| Balance at 12/31/2017 | $ | 4,578 | $ | 2,704 | $ | 2,947 | $ | 10,229 | |||||||
| Net new equity commitments | 813 | 1,456 | 578 | 2,847 | |||||||||||
| Net new debt commitments | — | — | 75 | 75 | |||||||||||
| Distributions | (1,608 | ) | (428 | ) | (173 | ) | (2,209 | ) | |||||||
| Change in fund value | 380 | (21 | ) | 39 | 398 | ||||||||||
| Balance at 12/31/2018 | $ | 4,163 | $ | 3,711 | $ | 3,466 | $ | 11,340 | |||||||
| Average AUM(1) | $ | 4,342 | $ | 3,365 | $ | 3,086 | $ | 10,793 |
| Real Estate Equity - U.S. | Real Estate Equity - E.U. | Real Estate Debt | Total Real Estate Group | ||||||||||||
| Balance at 12/31/2016 | $ | 4,106 | $ | 3,100 | $ | 2,546 | $ | 9,752 | |||||||
| Net new equity commitments | 800 | — | — | 800 | |||||||||||
| Net new debt commitments | — | — | 509 | 509 | |||||||||||
| Distributions | (659 | ) | (801 | ) | (139 | ) | (1,599 | ) | |||||||
| Change in fund value | 331 | 405 | 31 | 767 | |||||||||||
| Balance at 12/31/2017 | $ | 4,578 | $ | 2,704 | $ | 2,947 | $ | 10,229 | |||||||
| Average AUM(1) | $ | 4,459 | $ | 2,956 | $ | 2,846 | $ | 10,261 |
| Real Estate Equity - U.S. | Real Estate Equity - E.U. | Real Estate Debt | Total Real Estate Group | ||||||||||||
| Balance at 12/31/2015 | $ | 4,617 | $ | 3,059 | $ | 2,592 | $ | 10,268 | |||||||
| Net new equity commitments | 355 | 470 | 15 | 840 | |||||||||||
| Net new debt commitments | — | — | 225 | 225 | |||||||||||
| Distributions | (1,125 | ) | (357 | ) | (331 | ) | (1,813 | ) | |||||||
| Change in fund value | 259 | (72 | ) | 45 | 232 | ||||||||||
| Balance at 12/31/2016 | $ | 4,106 | $ | 3,100 | $ | 2,546 | $ | 9,752 | |||||||
| Average AUM(1) | $ | 4,444 | $ | 3,143 | $ | 2,557 | $ | 10,144 |
(1) Represents a five-point average of quarter-end balances for each period.
Real Estate Group—Fee Paying AUM
The tables below provide the period‑to‑period rollforwards of fee paying AUM, for the Real Estate Group for the years ended December 31, 2018, 2017 and 2016 (in millions):
| Real Estate Equity - U.S. | Real Estate Equity - E.U. | Real Estate Debt | Total Real Estate Group | ||||||||||||
| FPAUM Balance at 12/31/2017 | $ | 3,062 | $ | 2,064 | $ | 1,063 | $ | 6,189 | |||||||
| Commitments | 350 | 1,230 | — | 1,580 | |||||||||||
| Subscriptions/deployment/increase in leverage | 259 | 392 | 27 | 678 | |||||||||||
| Redemptions/distributions/decrease in leverage | (797 | ) | (151 | ) | (186 | ) | (1,134 | ) | |||||||
| Change in fund value | 4 | (64 | ) | 40 | (20 | ) | |||||||||
| Change in fee basis | (139 | ) | (202 | ) | — | (341 | ) | ||||||||
| FPAUM Balance at 12/31/2018 | $ | 2,739 | $ | 3,269 | $ | 944 | $ | 6,952 | |||||||
| Average FPAUM(1) | $ | 2,915 | $ | 2,822 | $ | 1,001 | $ | 6,738 |
| Real Estate Equity - U.S. | Real Estate Equity - E.U. | Real Estate Debt | Total Real Estate Group | ||||||||||||
| FPAUM Balance at 12/31/2016 | $ | 2,891 | $ | 2,531 | $ | 1,118 | $ | 6,540 | |||||||
| Commitments | 665 | — | — | 665 | |||||||||||
| Subscriptions/deployment/increase in leverage | 441 | 138 | 3 | 582 | |||||||||||
| Redemptions/distributions/decrease in leverage | (510 | ) | (236 | ) | (95 | ) | (841 | ) | |||||||
| Change in fund value | — | 146 | 37 | 183 | |||||||||||
| Change in fee basis | (425 | ) | (515 | ) | — | (940 | ) | ||||||||
| FPAUM Balance at 12/31/2017 | $ | 3,062 | $ | 2,064 | $ | 1,063 | $ | 6,189 | |||||||
| Average FPAUM(1) | $ | 3,017 | $ | 2,429 | $ | 1,101 | $ | 6,547 |
| Real Estate Equity - U.S. | Real Estate Equity - E.U. | Real Estate Debt | Total Real Estate Group | ||||||||||||
| FPAUM Balance at 12/31/2015 | $ | 3,205 | $ | 2,554 | $ | 998 | $ | 6,757 | |||||||
| Commitments | 97 | 365 | — | 462 | |||||||||||
| Subscriptions/deployment/increase in leverage | 397 | 63 | 170 | 630 | |||||||||||
| Redemptions/distributions/decrease in leverage | (842 | ) | (87 | ) | (90 | ) | (1,019 | ) | |||||||
| Change in fund value | 34 | (132 | ) | 40 | (58 | ) | |||||||||
| Change in fee basis | — | (232 | ) | — | (232 | ) | |||||||||
| FPAUM Balance at 12/31/2016 | $ | 2,891 | $ | 2,531 | $ | 1,118 | $ | 6,540 | |||||||
| Average FPAUM(1) | $ | 3,011 | $ | 2,581 | $ | 1,077 | $ | 6,669 |
(1) Represents a five-point average of quarter-end balances for each period.
The charts below present FPAUM for the Real Estate Group by its fee basis as of December 31, 2018, 2017 and 2016 (in millions):

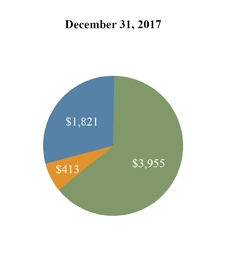
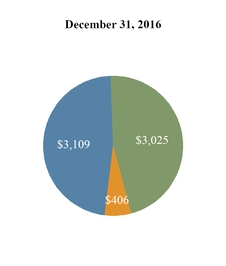
| FPAUM: $6,952 | FPAUM: $6,189 | FPAUM: $6,540 |
| Invested capital | Capital commitments | Market value/other(1) |
| (1) | Market value/other includes ACRE's fee paying AUM, which is based on ACRE’s stockholders’ equity. |
The components of our AUM, including the portion that is FPAUM, for the Real Estate Group are presented below as of December 31, 2018, 2017 and 2016 (in millions):
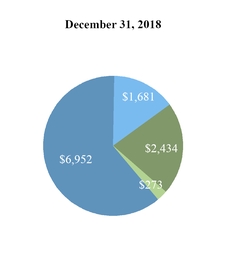


| AUM: $11,340 | AUM: $10,229 | AUM: $9,752 |
| FPAUM | Non-fee paying | AUM not yet earning fees | General partner and affiliates |
Real Estate Group—Fund Performance Metrics as of December 31, 2018
The Real Estate Group managed 43 funds as of December 31, 2018. Our significant funds in the Real Estate Group combined for approximately 60% of the Real Estate Group’s management fees for the year ended December 31, 2018: EF IV and EF V are commingled funds focused on real estate assets located in Europe, primarily in the United Kingdom, France and Germany; Ares European Property Enhancement Program II, L.P. (“EPEP II”), a commingled equity fund focused on real estate assets located in Europe; and VEF IX, a commingled equity fund focused on real estate assets located in United States.
The following table presents the performance data for our significant funds in the Real Estate Group, all of which are drawdown funds, as of December 31, 2018 ($ in thousands):
| Year of Inception | AUM | Original Capital Commitments | Cumulative Invested Capital | Realized Proceeds(1) | Unrealized Value(2) | Total Value | MoIC | IRR(%) | |||||||||||||||||||||||||||
| Fund | Gross(3) | Net(4) | Gross(5) | Net(6) | Investment Strategy | ||||||||||||||||||||||||||||||
| EF IV (7) | 2014 | $ | 1,036 | $ | 1,302 | $ | 1,122 | $ | 539 | $ | 1,036 | $ | 1,575 | 1.5x | 1.3x | 20.2 | 14.9 | E.U. Real Estate Equity | |||||||||||||||||
| EPEP II (8) | 2015 | 683 | 747 | 387 | 140 | 356 | 496 | 1.3x | 1.2x | 19.2 | 16.5 | E.U. Real Estate Equity | |||||||||||||||||||||||
| VEF IX | 2017 | 1,026 | 1,040 | 225 | 8 | 445 | 453 | 1.0x | 1.0x | NA | NA | U.S. Real Estate Equity | |||||||||||||||||||||||
| EF V (9) | 2018 | 1,222 | 1,197 | 160 | — | 201 | 201 | 1.2x | NA | NA | NA | E.U. Real Estate Equity |
| (1) | Realized proceeds include distributions of operating income, sales and financing proceeds received. |
| (2) | Unrealized value represents the fair market value of remaining investments. There can be no assurance that unrealized investments will be realized at the valuations indicated. |
| (3) | The gross MoIC is calculated at the investment level and is based on the interests of all partners. The gross MoIC for all funds is before giving effect to management fees, carried interest, as applicable, and other expenses. |
| (4) | The net MoIC is calculated at the fund-level and is based on the interests of the fee-paying partners and, if applicable, excludes interests attributable to the non fee-paying partners and/or the general partner who does not pay management fees or carried interest or has such fees rebated outside of the fund. The net MoIC is after giving effect to management fees, carried interest, as applicable, and other expenses. |
| (5) | The gross IRR is an annualized since inception gross internal rate of return of cash flows to and from investments and the residual value of the investments at the end of the measurement period. Gross IRRs reflect returns to all partners. Cash flows used in the gross IRR calculation are assumed to occur at quarter-end. The gross IRRs are calculated before giving effect to management fees, carried interest as applicable, and other expenses. |
| (6) | The net IRR is an annualized since inception net internal rate of return of cash flows to and from the fund and the fund’s residual value at the end of the measurement period. Net IRRs reflect returns to the fee-paying partners and, if applicable, exclude interests attributable to the non fee-paying partners and/or the general partner who does not pay management fees or carried interest or has such fees rebated outside of the fund. The cash flow dates used in the net IRR calculation are based on the actual dates of the cash flows. The net IRRs are calculated after giving effect to management fees, carried interest, as applicable, and other expenses. The funds may utilize a credit facility during the investment period and for general cash management purposes. Net fund-level IRRs would generally likely have been lower had such fund called capital from its limited partners instead of utilizing the credit facility. |
| (7) | EF IV is made up of two parallel funds, one denominated in U.S. dollars and one denominated in Euros. The gross and net MoIC and gross and net IRRs presented in the chart are for the U.S. dollar denominated parallel fund as that is the larger of the two funds. The gross and net IRRs for the Euro denominated parallel fund are 20.6% and 14.6%, respectively. The gross and net MoIC for the Euro denominated parallel fund are 1.5x and 1.3x, respectively. Original capital commitments are converted to U.S. dollars at the prevailing exchange rate at the time of fund's closing. All other values for EF IV are for the combined fund and are converted to U.S. dollars at the prevailing quarter-end exchange rate. |
| (8) | EPEP II is made up of dual currency investors and Euro currency investors. The gross and net MoIC presented in the chart are for dual currency investors as dual currency investors represent the largest group of investors in the fund. Multiples exclude foreign currency gains and losses since dual currency investors fund capital contributions and receive distributions in local deal currency (GBP or EUR) and therefore, do not realize foreign currency gains or losses. The gross and net IRRs for the Euro currency investors, which include foreign currency gains and losses, are 18.6% and 15.4%, respectively. The gross and net MoIC for the Euro currency investors, which include foreign currency gains and losses, are 1.3x and 1.2x, respectively. Original capital commitments are converted to U.S. dollars at the prevailing exchange rate at the time of fund's closing. All other values for EPEP II are for the combined fund and are converted to U.S. dollars at the prevailing quarter-end exchange rate. |
| (9) | EF V is made up of two parallel funds, one denominated in U.S. dollars and one denominated in Euros. The gross MoIC presented in the chart is for the Euro denominated parallel fund as that is the larger of the two funds. The gross MoIC for the U.S. dollar denominated parallel fund is 1.2x. The net MoIC cannot be calculated for either of the parallel funds since capital has not yet been called from investors. Original capital commitments are converted to U.S. dollars at the prevailing exchange rate at the time of fund's closing. All other values for are for the combined fund and are converted to U.S. dollars at the prevailing quarter-end exchange rate. |
Operations Management Group—Year Ended December 31, 2018 Compared to Year Ended December 31, 2017
Fee Related Earnings:
The following table presents the components of the OMG's FRE and the changes for the comparative periods ($ in thousands):
| For the Years Ended December 31, | Favorable (Unfavorable) | |||||||||||||
| 2018 | 2017 | $ Change | % Change | |||||||||||
| Compensation and benefits | $ | (126,117 | ) | $ | (112,233 | ) | $ | (13,884 | ) | (12 | )% | |||
| General, administrative and other expenses | (75,926 | ) | (74,825 | ) | (1,101 | ) | (1 | )% | ||||||
| Fee Related Earnings | (202,043 | ) | (187,058 | ) | (14,985 | ) | (8 | )% |
Compensation and Benefits. Compensation and benefits expense increased $13.9 million, or 12%, for the year ended December 31, 2018 compared to the year ended December 31, 2017. The increase was primarily driven by annual merit increases
and headcount growth for the comparative periods. Headcount growth was primarily driven by employees hired to support several information technology initiatives, reduce reliance on external service providers and to expand our strategy and relationship management platform to support global fundraising initiatives.
Realized Income:
The following table presents the components of the OMG's RI and the changes for the comparative periods ($ in thousands):
| For the Years Ended December 31, | Favorable (Unfavorable) | ||||||||||||
| 2018 | 2017 | $ Change | % Change | ||||||||||
| Fee Related Earnings | (202,043 | ) | (187,058 | ) | (14,985 | ) | (8 | )% | |||||
| Investment income-realized | 4,790 | 3,880 | 910 | 23 | % | ||||||||
| Interest and other investment income-realized | 2,184 | 1,142 | 1,042 | 91 | % | ||||||||
| Interest expense | (2,226 | ) | (1,946 | ) | (280 | ) | (14 | )% | |||||
| Realized net investment income | 4,748 | 3,076 | 1,672 | 54 | % | ||||||||
| Realized Income | $ | (197,295 | ) | $ | (183,982 | ) | (13,313 | ) | (7 | )% |
Realized income for the periods presented was composed of FRE, as explained above, and realized net investment income for the respective periods. Realized net investment income for the year ended December 31, 2018 was primarily attributable to realized gains from the liquidation of certain of our non-core energy investments. Realized net investment income for the year ended December 31, 2017 was primarily attributable to realizations from monetizations of investments held within one of our non-core investment strategies.
Operations Management Group—Year Ended December 31, 2017 Compared to Year Ended December 31, 2016
Fee Related Earnings:
The following table presents the components of the OMG's FRE and the changes for the comparative periods ($ in thousands):
| For the Years Ended December 31, | Favorable (Unfavorable) | |||||||||||||
| 2017 | 2016 | $ Change | % Change | |||||||||||
| Compensation and benefits | $ | (112,233 | ) | $ | (97,777 | ) | $ | (14,456 | ) | (15 | )% | |||
| General, administrative and other expenses | (74,825 | ) | (60,319 | ) | (14,506 | ) | (24 | )% | ||||||
| Fee Related Earnings | (187,058 | ) | (158,096 | ) | (28,962 | ) | (18 | )% |
Compensation and Benefits. Compensation and benefits expense increased $14.5 million, or 15%, for the year ended December 31, 2017 compared to the year ended December 31, 2016. The increase was primarily due to additional headcount and merit based increases. Additional headcount was partially driven by employees hired to support several information technology initiatives and the expansion of our strategy and relationship management platform in order to more effectively raise additional investor commitments for our planned and newly launched funds. Employees hired in connection with ARCC's acquisition of ACAS also contributed to the growth in headcount, ACAS-related compensation expense, net of administrative fee reimbursements, for the year ended December 31, 2017 was $3.4 million.
General, Administrative and Other Expenses. General, administrative and other expenses increased $14.5 million, or 24%, for the year ended December 31, 2017 compared to the year ended December 31, 2016. The increase was due to several information technology initiatives to support system implementations, increased occupancy costs from growing headcount and business support costs associated with our expanding business platform during 2017. We also paid a $2.5 million one-time non-income tax during 2017.
Realized Income:
The following table presents the components of the OMG's RI and the changes for the comparative periods ($ in thousands):
| For the Years Ended December 31, | Favorable (Unfavorable) | ||||||||||||
| 2017 | 2016 | $ Change | % Change | ||||||||||
| Fee Related Earnings | (187,058 | ) | (158,096 | ) | (28,962 | ) | (18 | )% | |||||
| Investment income (loss)-realized | 3,880 | (14,606 | ) | 18,486 | NM | ||||||||
| Interest and other investment income-realized | 1,142 | 163 | 979 | NM | |||||||||
| Interest expense | (1,946 | ) | (2,727 | ) | 781 | 29 | % | ||||||
| Realized net investment income (loss) | 3,076 | (17,170 | ) | 20,246 | NM | ||||||||
| Realized Income | $ | (183,982 | ) | $ | (175,266 | ) | (8,716 | ) | (5 | )% |
Realized income for the periods presented was composed of FRE, as explained above, and realized net investment income for the respective periods.
Realized net investment income for the year ended December 31, 2017 was primarily attributable to realizations from monetizations of investments within certain of our non-core investment strategies. Realized net investment loss for the year ended December 31, 2016 was primarily attributable to a $20 million realized loss on our investment in Deimos Management Holdings LLC due to the winding down of its operations.
Liquidity and Capital Resources
Sources and Uses of Liquidity
Our sources of liquidity are (1) cash on hand, (2) net working capital, (3) cash from operations, including management fees, which are collected monthly, quarterly or semi‑annually, net realized performance income, which is unpredictable as to amount and timing, (4) fund distributions related to our investments that are also unpredictable as to amount and timing and (5) net borrowing provided by the Credit Facility. As of December 31, 2018, our cash and cash equivalents were $110.2 million and we had $235.0 million of borrowings outstanding under the Credit Facility. The ability to draw from the Credit Facility is subject to a leverage covenant. We believe that these sources of liquidity will be sufficient to fund our working capital requirements and to meet our commitments in the ordinary course of business for the foreseeable future.
We expect that our primary liquidity needs will continue to be to (1) provide capital to facilitate the growth of our existing investment management businesses, (2) fund our investment commitments, (3) provide capital to facilitate our expansion into businesses that are complementary to our existing investment management businesses, (4) pay operating expenses, including cash compensation to our employees and payments under the tax receivable agreement (“TRA”), (5) fund capital expenditures, (6) service our debt, (7) pay income taxes and (8) make dividends payment to our Class A common stockholders and the Series A Preferred stockholders in accordance with our dividend policy.
In the normal course of business, we intend to pay dividends based on our expected fee related earnings. If cash flow from operations were insufficient to fund dividends over a sustained period of time, we expect that we would suspend paying such dividends. Unless quarterly dividends have been declared and paid (or declared and set apart for payment) on the Series A Preferred Stock, we may not declare or pay or set apart payment for dividends on any shares of our Class A common stock during the period. Dividends on Series A Preferred Stock are not cumulative and the Series A Preferred Stock is not convertible into our Class A common stock or any other security.
In February 2019, our board of directors authorized the repurchase of up to $150 million of shares of our Class A common stock. Under this stock repurchase program, shares may be repurchased from time to time in open market purchases, privately negotiated transactions or otherwise, including in reliance on Rule 10b5-1 of the Securities Act. The program is scheduled to expire in February 2020. Repurchases under the program, if any, will depend on the prevailing market conditions and other factors. There is no assurance that any shares will be repurchased under the program.
In July 2018, our board of directors authorized the repurchase, from time to time in open market purchases privately negotiated transactions, of the Series A Preferred Stock with an aggregate liquidation preference of up to $50 million. Such repurchases, if any, will depend on the prevailing market conditions and other factors.
Net realized performance income also provide a source of liquidity. Performance income is primarily realized when a portfolio investment is profitably disposed of and the fund’s cumulative returns are in excess of the preferred return or hurdle rate. Performance income is typically realized at the end of each fund’s measurement period when investment performance exceeds a stated benchmark or hurdle rate.
Our accrued carried interest and incentive fee receivable by segment as of December 31, 2018 are set forth in the table below (in thousands):
| Accrued Carried Interest & Incentive Fee Receivable (1) | |||
| Credit Group | $ | 210,655 | |
| Private Equity Group | 506,872 | ||
| Real Estate Group | 173,250 | ||
| Total | $ | 890,777 |
| (1) | No amounts of accrued performance income earned from Consolidated Funds were eliminated in consolidation. |
Our consolidated financial statements reflect the cash flows of our operating businesses as well as the results of our Consolidated Funds. The assets of our Consolidated Funds, on a gross basis, are significantly larger than the assets of our operating businesses and therefore have a substantial effect on our reported cash flows. The primary cash flow activities of our Consolidated Funds include: (1) raising capital from third-party investors, which is reflected as non-controlling interests of our Consolidated Funds when required to be consolidated into our consolidated financial statements, (2) financing certain investments by issuing debt, (3) purchasing and selling investment securities, (4) generating cash through the realization of certain investments, (5) collecting interest and dividend income and (6) distributing cash to investors. Our Consolidated Funds are treated as investment companies for financial accounting purposes under GAAP; therefore, the character and classification of all Consolidated Fund transactions are presented as cash flows from operations. Liquidity available at our consolidated funds is typically not available for corporate liquidity needs, and debt of the consolidated funds is non–recourse to the Company except to the extent of the Company's investment in the fund.
Cash Flows
The significant captions and amounts from our consolidated financial statements, which include the effects of our Consolidated Funds and CLOs in accordance with GAAP, are summarized below. Negative amounts represent a net outflow or use of cash (in millions).
| Year Ended December 31, | |||||||||||
| 2018 | 2017 | 2016 | |||||||||
| Net cash used in operating activities | $ | (1,417 | ) | $ | (1,863 | ) | $ | (626 | ) | ||
| Net cash used in investing activities | (18 | ) | (33 | ) | (12 | ) | |||||
| Net cash provided by financing activities | 1,405 | 1,655 | 881 | ||||||||
| Effect of foreign exchange rate change | 22 | 17 | (22 | ) | |||||||
| Net change in cash and cash equivalents | $ | (8 | ) | $ | (224 | ) | $ | 221 |
Operating Activities
Our net cash flows used in operating activities were $1.4 billion, $1.9 billion and $625.7 million for the years ended December 31, 2018, 2017 and 2016, respectively.
The changes in cash used in operating activities for the comparative periods were primarily driven by net investment activity in our Consolidated Funds related to new funds that we began consolidating in 2018 and 2017. For the years ended December 31, 2018, 2017 and 2016, net purchases from investments by our Consolidated Funds were $2.2 billion, $1.8 billion and $0.8 billion, respectively. The changes in net purchases from investments by our Consolidated Funds were primarily driven by an increase in the number of Consolidated Funds. Net proceeds from the sale of investments of the Company increased $236.3 million during 2018 compared to 2017 primarily due to the sale of CLO securities during 2018. Subsequent to the removal of the U.S. risk retention requirements related to open-market CLO managers, we sold $206.0 million of CLO securities and used the proceeds to pay off the related term loans and settle our repurchase agreement during 2018. Net purchases of investments of the Company increased $128.0 million during 2017 compared to 2016 primarily due to the purchase of CLO securities in connection
with risk retention requirements. The change for 2017 compared to 2016 was also attributable to a change in the timing of annual bonus payments to employees for 2017. Employee bonuses earned in 2017 were paid in December 2017, while a majority of employee bonuses earned in 2016 were paid in January 2017, resulting in an $114.3 million increase in net cash used in operating activities for 2017 compared to 2016.
The movements within our Consolidated Funds do not adversely impact our liquidity or earnings trends. We believe that our ability to generate cash from revenues, as well as the capacity under the Credit Facility, provides us with the necessary liquidity to manage short-term fluctuations in working capital and to meet our short-term commitments.
Investing Activities
Our investing activities generally reflect cash used for certain acquisitions and purchases of fixed assets. 2018, 2017 and 2016 purchases of fixed assets were $18.4 million, $33.2 million and $11.9 million, respectively. The increase in fixed asset purchases in 2017 largely related to furniture, fixtures, equipment and leasehold improvements related to an office location in Los Angeles opened during the year.
Financing Activities
Net cash flows provided by financing activities were $1.4 billion, $1.7 billion and $880.8 million for 2018, 2017 and 2016, respectively. Net cash inflows in 2018 were primarily due to net borrowings on debt facilities of our Consolidated Funds and net proceeds from our common share issuance offset by net repayments on debt facilities of the Company and by distributions to AOG unitholders and dividends paid to our Class A common stockholders. Net cash inflows in 2017 primarily represented net borrowings on debt facilities of the Company and our Consolidated Funds. Net cash inflows in 2016 were primarily due to net proceeds from preferred stock issuances and net borrowings on debt facilities of the Consolidated Funds, which were partially offset by net repayments on the Company's debt facilities and a $40 million payment made in connection with our 2011 acquisition of Indicus Advisors, LLP. Proceeds from the issuance of preferred equity offering, net of issuance costs, resulted in a cash inflow of $298.8 million in 2016.
Net repayments of our debt obligations were $137.0 million during 2018 compared to net borrowings from our debt obligations of $310.4 million and $84.0 million during 2017 and 2016, respectively. During 2018, we had net repayments under the Credit Facility, paid off our term loans and settled our repurchase agreement. During 2017, we had net borrowings under the Credit Facility to support earlier payments of annual bonuses and net borrowings from new Term Loans that were issued to support purchases of CLOs that we managed within risk retention vehicles.
Our Consolidated Funds had net proceeds from debt obligations of $1.9 billion, $1.5 billion and $905.0 million for the years ended December 31, 2018, 2017 and 2016, respectively. The increases in net borrowing activity for the Consolidated Funds are primarily driven by an increase in the number of Consolidated Funds.
Distributions to our AOG unitholders and dividends paid to our Class A common stockholders were $312.6 million, $261.7 million and $200.7 million in 2018, 2017 and 2016, respectively. The increase in distributions and dividends for the year ended December 31, 2018 compared to the year ended December 31, 2017 was primarily driven by a change in the timing of dividend payments to our Class A common stockholders to match the related income in the current quarter. For our Consolidated Funds, net distributions were $88.7 million in 2018 compared to net contributions of $128.3 million and $14.5 million in 2017 and 2016, respectively. The change in net distributions for the year ended December 31, 2018 compared to the year ended December 31, 2017 was primarily due to distributions from the winding down of one Consolidated Fund. The change in net contributions for the year ended December 31, 2017 compared to the year ended December 31, 2016 was primarily driven by an increase in the number of Consolidated Funds.
Capital Resources
The following table summarizes the Company's debt obligations (in thousands):
| As of December 31, 2018 | As of December 31, 2017 | |||||||||||||||||||
| Debt Origination Date | Maturity | Original Borrowing Amount | Carrying Value | Interest Rate | Carrying Value | Interest Rate | ||||||||||||||
| Credit Facility(1) | Revolver | 2/24/2022 | N/A | $ | 235,000 | 4.00 | % | $ | 210,000 | 3.09 | % | |||||||||
| Senior Notes(2) | 10/8/2014 | 10/8/2024 | $ | 250,000 | 245,952 | 4.21 | % | 245,308 | 4.21 | % | ||||||||||
| 2015 Term Loan(3) | 9/2/2015 | 7/29/2026 | $ | — | — | N/A | 35,037 | 2.86 | % | |||||||||||
| 2016 Term Loan(4) | 12/21/2016 | 1/15/2029 | $ | — | — | N/A | 25,948 | 3.08 | % | |||||||||||
| 2017 Term Loan A(4) | 3/22/2017 | 1/22/2028 | $ | — | — | N/A | 17,407 | 2.90 | % | |||||||||||
| 2017 Term Loan B(4) | 5/10/2017 | 10/15/2029 | $ | — | — | N/A | 35,062 | 2.90 | % | |||||||||||
| 2017 Term Loan C(4) | 6/22/2017 | 7/30/2029 | $ | — | — | N/A | 17,078 | 2.88 | % | |||||||||||
| 2017 Term Loan D(4) | 11/16/2017 | 10/15/2030 | $ | — | — | N/A | 30,336 | 2.77 | % | |||||||||||
| Total debt obligations | $ | 480,952 | $ | 616,176 |
| (1) | The AOG entities are borrowers under the Credit Facility, which provides a $1.065 billion revolving line of credit. It has a variable interest rate based on LIBOR or a base rate plus an applicable margin with an unused commitment fee paid quarterly, which is subject to change with the Company’s underlying credit agency rating. As of December 31, 2018, base rate loans bear interest calculated based on the base rate plus 0.50% and the LIBOR rate loans bear interest calculated based on LIBOR plus 1.50%. The unused commitment fee is 0.20% per annum. There is a base rate and LIBOR floor of zero. |
| (2) | The Senior Notes were issued in October 2014 by Ares Finance Co. LLC, a subsidiary of the Company, at 98.268% of the face amount with interest paid semi-annually. The Company may redeem the Senior Notes prior to maturity, subject to the terms of the indenture. |
| (3) | The 2015 Term Loan was entered into in August 2015 by a subsidiary of the Company that acted as a manager to a CLO. The 2015 Term Loan was secured by collateral in the form of CLO senior tranches owned by the Company. To the extent the assets were not sufficient to cover the Term Loan, there was no further recourse to the Company to fund or repay the remaining balance. Interest was paid quarterly, and the Company also paid a fee of 0.025% of a maximum investment amount. |
| (4) | The 2016 and 2017 Term Loans (the “Term Loans”) were entered into by a subsidiary of the Company that acted as a manager to CLOs. The Term Loans were secured by collateral in the form of CLO senior tranches and subordinated notes owned by the Company. Collateral associated with one of the Term Loans could have been used to satisfy outstanding liabilities of another Term Loan should the collateral fall short. To the extent the assets associated with these Term Loans were not sufficient to cover the Term Loans, there was no further recourse to the Company to fund or repay the remaining balance. Interest was paid quarterly, and the Company also paid a fee of 0.03% of a maximum investment amount. |
Subsequent to the removal of the U.S. risk retention requirements related to open-market CLO managers, we sold $219.3 million of CLO securities and used the proceeds to pay off the related 2015-2017 Term Loans and settle a repurchase agreement totaling $206.0 million during the second quarter of 2018.
As of December 31, 2018, we were in compliance with all covenants of our debt obligations.
We intend to use a portion of our available liquidity to pay cash dividends on a quarterly basis in accordance with our dividend policies. Our ability to make cash dividends to the Preferred A stockholders and our Class A common stockholders is dependent on a myriad of factors, including among others: general economic and business conditions; our strategic plans and prospects; our business and investment opportunities; timing of capital calls by our funds in support of our commitments; our financial condition and operating results; working capital requirements and other anticipated cash needs; contractual restrictions and obligations; legal, tax and regulatory restrictions; restrictions on the payment of distributions by our subsidiaries to us and other relevant factors.
In conjunction with the Tax Election and our subsequent conversion to a corporation, we adopted a new dividend policy that will reduce volatility of the quarterly dividends and become more closely aligned with our core management fee business. For further detail our dividend policy, see "Item 5. Market For Registrant’s Common Equity, Related Stockholder Matters And Issuer Purchases Of Equity Securities - Dividend Policy for Class A Common Stock."
We are required to maintain minimum net capital balances for regulatory purposes for our United Kingdom subsidiary and for our subsidiary that operates as a broker‑dealer. These net capital requirements are met in part by retaining cash, cash‑equivalents and investment securities. As a result, we may be restricted in our ability to transfer cash between different
operating entities and jurisdictions. As of December 31, 2018, we were required to maintain approximately $27.9 million in liquid net assets within these subsidiaries to meet regulatory net capital and capital adequacy requirements. We remain in compliance with all regulatory requirements.
Holders of AOG Units, subject to the terms of the exchange agreement, may exchange their AOG Units for shares of our Class A common stock on a one-for-one basis. These exchanges are expected to result in increases in the tax basis of the tangible and intangible assets of Ares Management Corporation that otherwise would not have been available. These increases in tax basis may increase (for tax purposes) depreciation and amortization and therefore reduce the amount of tax that we would otherwise be required to pay in the future. We entered into the TRA with the TRA recipients that provides for the payment by us to the TRA Recipients of 85% of the amount of cash savings, if any, in U.S. federal, state, local and foreign income tax or franchise tax that we actually realize as a result of these increases in tax basis and of certain other tax benefits related to entering into the TRA, including tax benefits attributable to payments under the TRA and interest accrued thereon. Future payments under the TRA in respect of subsequent exchanges are expected to be substantial. As of December 31, 2018, the TRA liability balance was $24.9 million. In 2018, there were exchanges of approximately 13.1 million of AOG Units for shares of our Class A common stock. In connection with these conversions, we recognized deferred tax benefits of $25.2 million, which increased additional paid in capital by $3.8 million and our TRA liability by $21.4 million. There was an insignificant amount of AOG Units that were exchanged prior to 2018.
Series A Preferred Stock
As of December 31, 2018 and 2017, the Company had 12,400,000 shares of Series A Preferred Stock outstanding. When, as and if declared by the Company’s board of directors, dividends on the Series A Preferred Stock are paid quarterly at a rate per annum equal to 7.00%. The Series A Preferred Stock may be redeemable at our option, in whole or in part, at any time on or after June 30, 2021, at a price of $25.00 per share.
In connection with the Series A Preferred Stock issuance, the Ares Operating Group issued mirror preferred units (“GP Mirror Units”) paying the same 7.00% rate per annum to wholly owned subsidiaries of the Company including AHI. Although income allocated in respect of distributions on the GP Mirror Units may be subject to tax, cash dividends to our Series A Preferred stockholders will not be reduced on account of any income taxes owed by us. As a result, the amounts of dividend ultimately paid by us to our Class A common stockholders may be reduced by any corporate taxes imposed on us or AHI.
In July 2018, our board of directors authorized the repurchase, from time to time in open market purchases privately negotiated transactions, of share of the Series A Preferred Stock with an aggregate liquidation preference of up to $50 million. Such repurchases, if any, will depend on the prevailing market conditions and other factors.
Critical Accounting Estimates
We prepare our consolidated financial statements in accordance with GAAP. In applying many of these accounting principles, we need to make assumptions, estimates or judgments that affect the reported amounts of assets, liabilities, revenues and expenses in our consolidated financial statements. We base our estimates and judgments on historical experience and other assumptions that we believe are reasonable under the circumstances. These assumptions, estimates or judgments, however, are both subjective and subject to change, and actual results may differ from our assumptions and estimates. If actual amounts are ultimately different from our estimates, the revisions are included in our results of operations for the period in which the actual amounts become known. We believe the following critical accounting policies could potentially produce materially different results if we were to change the underlying assumptions, estimates or judgments. See “—Components of Consolidated Results of Operations” and Note 2, “Summary of Significant Accounting Policies,” to our consolidated financial statements included in this Annual Report on Form 10‑K for a summary of our significant accounting estimates.
Principles of Consolidation
We consolidate entities based on either a variable interest model or voting interest model. As such, for entities that are determined to be variable interest entities (“VIEs”), we consolidate those entities where we have both significant economics and the power to direct the activities of the entity that impact economic performance. For limited partnerships and similar entities evaluated under the voting interest model, we do not consolidate those entities for which we act as the general partner. However, the Company continues to consolidate entities in which it holds majority voting interest.
The consolidation guidance requires qualitative and quantitative analysis to determine whether our involvement, through holding interests directly or indirectly in the entity or contractually through other variable interests (e.g., management and performance related income), would give us a controlling financial interest. This analysis requires judgment. These judgments
include: (1) determining whether the equity investment at risk is sufficient to permit the entity to finance its activities without additional subordinated financial support, (2) evaluating whether the equity holders, as a group, can make decisions that have a significant effect on the success of the entity, (3) determining whether two or more parties’ equity interests should be aggregated, (4) determining whether the equity investors have proportionate voting rights to their obligations to absorb losses or rights to receive returns from an entity and (5) evaluating the nature of relationships and activities of the parties involved in determining which party within a related‑party group is most closely associated with a VIE and hence would be deemed the primary beneficiary.
The holders of the consolidated VIEs’ liabilities do not have recourse to us other than to the assets of the consolidated VIEs. The assets and liabilities of the consolidated VIEs are comprised primarily of investments and loans payable, respectively.
Fair Value Measurement
GAAP establishes a hierarchal disclosure framework prioritizing the inputs used in measuring financial instruments at fair value into three levels based on their market observability. Market price observability is affected by a number of factors, including the type of instrument and the characteristics specific to the instrument. Financial instruments with readily available quoted prices from an active market or where fair value can be measured based on actively quoted prices generally have a higher degree of market price observability and a lesser degree of judgment inherent in measuring fair value.
Financial assets and liabilities measured and reported at fair value are classified as follows:
| • | Level I—Quoted prices in active markets for identical instruments. |
| • | Level II—Quoted prices for similar instruments in active markets; quoted prices for identical or similar instruments in inactive markets; and model‑derived valuations with directly or indirectly observable significant inputs. Level II inputs include prices in markets with few transactions, non-current prices, prices for which little public information exists or prices that vary substantially over time or among brokered market makers. Other inputs include interest rates, yield curves, volatilities, prepayment risks, loss severities, credit risks and default rates. |
| • | Level III—Valuations that rely on one or more significant unobservable inputs. These inputs reflect the Company’s assessment of the assumptions that market participants would use to value the instrument based on the best information available. |
In some instances, an instrument may fall into multiple levels of the fair value hierarchy. In such instances, the instrument’s level within the fair value hierarchy is based on the lowest of the three levels (with Level III being the lowest) that is significant to the fair value measurement. Our assessment of the significance of an input requires judgment and considers factors specific to the instrument. See Note 5, “Fair Value,” to our consolidated financial statements included in this Annual Report on Form 10‑K for a summary of our valuation of investments and other financial instruments by fair value hierarchy levels.
Equity-Based Compensation
We recognize expense related to equity-based compensation in which we receive services from our professionals in exchange for (a) equity instruments of the Company, (b) derivatives based on our Class A common stock, or (c) a cash payment equal to the fair value of the Company’s equity instruments. Equity-based compensation expense represents expenses associated with restricted units, options and phantom shares granted under the Second Amended and Restated Ares Management Corporation 2014 Equity Incentive Plan.
Total compensation expense related to equity-based awards expected to be recognized in all future periods is determined based on the fair value of the respective equity-based award on the grant date and is recognized on a straight-line basis over the requisite service period, where applicable. Compensation expense for a liability award is recognized each reporting period until the liability is settled. The fair value of liability award is remeasured at the end of each reporting period through settlement.
The Company recognizes forfeitures in the period they occur as a reversal of previously recognized compensation expense. The reduction in compensation expense is determined based on the specific awards forfeited during that period and will be reflected as a reduction in the expense for that period.
We record deferred tax assets for equity-based compensation transactions that result in deductions on our income tax returns based on the amount of equity-based compensation recognized and the statutory tax rate in the jurisdiction in which we will receive a tax deduction.
Restricted Units
Certain restricted units are subject to a lock up provision that expires on May 1, 2019. We used Finnerty’s average strike‑price put option model to estimate the discount associated with this lack of marketability to be applied on the closing price of our Class A common stock on the grant date, using the following key assumptions:
| Expected volatility factor(1) | 20% to 28% |
| Average length of holding period restriction (in years) | 2.4 year |
| Weighted average expected dividend yield | 5.0% |
| (1) | Expected volatility is based on the Company's guideline companies' expected volatility. |
Restricted Unit Awards with a Market Condition
We granted certain restricted units with a vesting condition based upon the volume-weighted, average closing price of shares of our Class A common stock meeting or exceeding a stated price for 30 consecutive calendar days on or prior to January 1, 2028, referred to as the market condition. Vesting is also generally subject to continued employment at the time such market condition is achieved. Under the terms of the awards, if the price target is not achieved by the close of business on January 1, 2028, the unvested market condition awards will be automatically canceled and forfeited.
The grant date fair values are based on a probability distributed Monte-Carlo simulation. Due to the existence of the market condition, the vesting period for the awards is not explicit, and as such, compensation expense is recognized on a straight-line basis over the median vesting period derived from the positive iterations of the Monte Carlo simulations where the market condition was achieved.
Below is a summary of the significant assumptions used to estimate the grant date fair value of market condition awards:
| Closing price of the Company's common shares as of valuation date | $ | 20.95 | ||
| Risk-free interest rate | 2.95 | % | ||
| Volatility | 30.0 | % | ||
| Dividend yield | 5.0 | % | ||
| Cost of equity | 10.0 | % |
Options
The fair value of each option granted was measured on the date of the grant using the Black‑Scholes option pricing model. There were no new options granted during the years ended December 31, 2018, 2017 and 2016. Aggregate intrinsic value represents the value of the closing price of our Class A common stock on the last trading day of the period in excess of the weighted-average exercise price multiplied by the number of options exercisable or expected to vest. The fair value of an award is affected by the price of our Class A common stock on the date of grant as well as other assumptions including the estimated volatility of the price of our Class A common stock over the term of the awards and the estimated period of time that management expects employees to hold their Class A common stock options. The estimated period of time that management expects employees to hold their options was estimated as the midpoint between the vesting date and maturity date.
Phantom Shares
Each phantom share represents an unfunded, unsecured right of the holder to receive an amount in cash per phantom share equal to the average closing price of a share of our Class A common stock for the 15 trading days immediately prior to, and the 15 trading days immediately following, the vesting dates. The fair value of the awards is remeasured at each reporting period based on the most recent closing price of a share of our Class A common stock.
Income Taxes
Effective March 1, 2018, the Company is taxed as corporation for U.S. federal and state income tax purposes. Prior to the Tax Election, the Company’s share of carried interest and investment income flowed through to investors without being subject to income taxes at the entity level. Consequently, we did not reflect a provision for income taxes on such income except those for foreign, state and local income taxes incurred at the entity level.
We use the liability method of accounting for deferred income taxes pursuant to GAAP. Under this method, deferred tax assets and liabilities are recognized for the future tax consequences attributable to temporary differences between the carrying value of existing assets and liabilities and their respective tax bases. Deferred tax assets and liabilities are measured using the statutory tax rates expected to be applied in the periods in which those temporary differences are settled. The effect of a change in tax rates on deferred tax assets and liabilities is recognized in the period of the change. A valuation allowance is recorded on our net deferred tax assets when it is more likely than not that such assets will not be realized. When evaluating the realizability of our deferred tax assets, all evidence, both positive and negative, is evaluated. Items considered in this analysis include the ability to carry back losses, the reversal of temporary differences, tax planning strategies and expectations of future earnings.
Under GAAP, the amount of tax benefit to be recognized is the amount of benefit that is “more likely than not” to be sustained upon examination. We analyze our tax filing positions in all of the U.S. federal, state, local and foreign tax jurisdictions where we are required to file income tax returns, as well as for all open tax years in these jurisdictions. If, based on this analysis, we determine that uncertainties in tax positions exist, a liability is established, which is included in accounts payable, accrued expenses and other liabilities in our consolidated financial statements. We recognize accrued interest and penalties related to unrecognized tax positions in the provision for income taxes.
Tax laws are complex and subject to different interpretations by the taxpayer and respective governmental taxing authorities. Significant judgment is required in determining tax expense and in evaluating tax positions, including evaluating uncertainties under GAAP. We review our tax positions quarterly and adjust our tax balances as new information becomes available.
Goodwill
Goodwill represents the excess of cost over the identifiable net assets of businesses acquired and is recorded in the functional currency of the acquired entity. Goodwill is tested annually for impairment. If, after assessing qualitative and quantitative factors, we believe that it is more likely than not that the fair value of the reporting unit is less than its carrying value, we will record the amount of goodwill impairment as the excess of the carrying amount over the fair value.
The assessment requires us to make judgments and involves the use of significant estimates and assumptions. These estimates and assumptions include long-term growth rates and margins used to calculate projected future cash flows, risk-adjusted discount rates based on our weighted average cost of capital and future economic and market conditions. These estimates and assumptions have to be made for each reporting unit evaluated for impairment. Our estimates for market growth, our market share and costs are based on historical data, various internal estimates and certain external sources, and are based on assumptions that are consistent with the plans and estimates we are using to manage the underlying business. If future forecasts are revised, they may indicate or require future impairment charges. We base our fair value estimates on assumptions we believe to be reasonable but that are unpredictable and inherently uncertain. Actual future results may differ from those estimates.
Recent Accounting Pronouncements
Information regarding recent accounting pronouncements and their impact on the Company can be found in Note 2, “Summary of Significant Accounting Policies,” in the “Notes to the Consolidated Financial Statements” included in this Annual Report on Form 10‑K for a summary of our significant accounting estimates.
Off‑Balance Sheet Arrangements
In the normal course of business, we engage in off‑balance sheet arrangements, including transactions in derivatives, guarantees, commitments, indemnifications and potential contingent repayment obligations.
Contractual Obligations, Commitments and Contingencies
The following table sets forth information relating to our contractual obligations of the Company and of the Consolidated Funds as of December 31, 2018 (in thousands):
| Less than 1 year | 1 - 3 years | 4 - 5 years | Thereafter | Total | ||||||||||||||||
| The Company: | ||||||||||||||||||||
| Operating lease obligations(1) | $ | 32,039 | $ | 47,564 | $ | 42,792 | $ | 45,141 | $ | 167,536 | ||||||||||
| Debt obligations payable(2) | — | — | — | 245,952 | 245,952 | |||||||||||||||
| Capital lease obligations | 364 | 766 | 403 | 1,533 | ||||||||||||||||
| Interest obligations on debt(3) | 15,694 | 31,389 | 20,949 | 10,000 | 78,032 | |||||||||||||||
| Interest obligations on capital lease obligations | 52 | 67 | 14 | 133 | ||||||||||||||||
| Credit Facility(4) | — | — | 235,000 | — | 235,000 | |||||||||||||||
| Capital commitments(5) | 267,568 | — | — | — | 267,568 | |||||||||||||||
| Subtotal | 315,717 | 79,786 | 299,158 | 301,093 | 995,754 | |||||||||||||||
| Consolidated Funds: | ||||||||||||||||||||
| Debt obligations payable | 115,125 | 38,844 | 16,316 | 7,040,080 | 7,210,365 | |||||||||||||||
| Interest obligations on debt(3) | 223,883 | 446,205 | 442,994 | 1,253,992 | 2,367,074 | |||||||||||||||
| Capital commitments of Consolidated Funds(6) | 23,240 | — | — | — | 23,240 | |||||||||||||||
| Total | $ | 677,965 | $ | 564,835 | $ | 758,468 | $ | 8,595,165 | $ | 10,596,433 |
| (1) | The table includes future minimum commitments for our operating leases. Office space, computer and communication equipment are leased under agreements with expirations ranging from one-year contracts to lease commitments through 2030. Rent expense includes only base contractual rent. |
| (2) | Debt obligations include $250 million of senior notes, net of unamortized discount. |
| (3) | Interest obligations include interest accrued on outstanding indebtedness. |
| (4) | Represents outstanding balance under the Credit Facility as of December 31, 2018 and maturity date of February 24, 2022. |
| (5) | Represents commitments to invest in certain investment products, primarily in funds managed by us. These amounts are generally due on demand and are therefore presented as obligations payable in the less than one-year. |
| (6) | Represents commitments by Consolidated Funds to fund certain investments. These amounts are generally due on demand and are therefore presented as obligations payable in the less than one-year. |
We entered into a TRA with the TRA Recipients that requires us to pay them 85% of any tax savings realized by Ares Management Corporation from any step‑up in tax basis resulting from an exchange of Ares Operating Group Units for shares of our Class A common stock or, at our option, for cash. Because the timing of amounts to be paid under the tax receivable agreement cannot be determined, this contractual commitment has not been presented in the table above. The tax savings achieved may not ensure that we have sufficient cash available to pay this liability, and we may be required to incur additional debt to satisfy this liability.
Indemnifications
Consistent with standard business practices in the normal course of business, we enter into contracts that contain indemnities for our affiliates, persons acting on our behalf or such affiliates and third parties. The terms of the indemnities vary from contract to contract and the maximum exposure under these arrangements, if any, cannot be determined and has not been recorded in our consolidated financial statements. As of December 31, 2018, we have not had prior claims or losses pursuant to these contracts and expect the risk of loss to be remote.
Capital Commitments
As of December 31, 2018 and December 31, 2017, we had aggregate unfunded commitments of $267.6 million and $285.7 million, respectively, including commitments to both non-consolidated funds and Consolidated Funds. There were no unfunded commitments to funds not managed by the Company as of December 31, 2018. Total unfunded commitments included $16.5 million in commitments to funds not managed by the Company as of December 31, 2017.
ARCC Fee Waiver
In conjunction with the ARCC-ACAS Transaction, we agreed to waive up to $10 million per quarter of ARCC's Part I Fees for ten calendar quarters, which began in the second quarter of 2017. ARCC Part I Fees will only be waived to the extent they are paid. If Part I Fees are less than $10 million in any single quarter, the shortfall will not carryover to the subsequent quarters.
As of December 31, 2018, there are three remaining quarters as part of the fee waiver agreement, with a maximum of $30 million in potential waivers. ARCC Part I Fees are shown net of the fee waiver.
Contingent Obligations
Generally, if at the termination of a fund (and increasingly at interim points in the life of a fund), the fund has not achieved investment returns that (in most cases) exceed the preferred return threshold or (in all cases) the general partner receives net profits over the life of the fund in excess of its allocable share under the applicable partnership agreement, the Company will be obligated to repay carried interest that was received by the Company in excess of the amounts to which the Company is entitled. This contingent obligation is normally reduced by income taxes paid by the Company related to its carried interest.
The partnership documents governing our funds generally include a contingent repayment provision that, if triggered, may give rise to a contingent obligation that may require the general partner to return amounts to the fund for distribution to investors. Therefore, performance income, generally, is subject to reversal in the event that the funds incur future losses. These losses are limited to the extent of the cumulative performance income recognized in income to date. Due in part to our investment performance and the fact that our carried interest is generally determined on a liquidation basis, if the funds were liquidated at their fair values as of December 31, 2018, there would have been $0.4 million of contingent repayment obligation or liability. No contingent repayment obligation existed as of December 31, 2017. If all of the existing investments were deemed worthless, the amount of cumulative revenues that have been recognized would be reversed. We believe that the possibility of all of the existing investments becoming worthless is remote. At December 31, 2018, 2017 and 2016, had we assumed all existing investments were worthless, the amount of carried interest, net of tax, subject to contingent repayment would have been approximately $469.0 million, $476.1 million and $418.3 million, respectively, of which approximately $364.4 million, $370.0 million and $323.9 million, respectively, would be reimbursable to the Company by certain professionals.
Performance income is also affected by changes in the fair values of the underlying investments in the funds that we advise. Valuations, on an unrealized basis, can be significantly affected by a variety of external factors including, but not limited to, bond yields and industry trading multiples.
Our senior professionals and other professionals who have received carried interest distributions are responsible for funding their proportionate share of any contingent repayment obligations. However, the governing agreements of certain of our funds provide that if a current or former professional from such funds does not fund his or her respective share, then we may have to fund additional amounts beyond what we received in carried interest, although we will generally retain the right to pursue any remedies that we have under such governing agreements against those carried interest recipients who fail to fund their obligations.
Previous: Item 6. Selected Financial Data · Next: Item 7A. Quantitative and Qualitative Disclosures About Market Risk