 filings.tools
Atmos Energy (ATO) 10-K risk factor changes: FY2016 vs FY2015
The 2016-09-30 10-K against the 2015-09-30 one, compared heading by heading and sentence by sentence. One of these filings carries no fiscal year tag, so its year is the calendar year of the period end.
Item 1A15 rewritten6 added4 removed122 unchanged
All filing items943 rewritten510 added447 removed2,409 unchanged
Summary
counted, not written
- Item 1A headings could not be compared: only 0 carried over between the two years, which usually means one filing was read wrongly, so none is reported as new or removed.
- Sentence by sentence, 510 added, 447 removed, 943 rewritten and 2,409 unchanged across 17 items that differ.
Sentences by item
21 items, with every count and a link to each item that changed
Underlined words on a shaded ground are new in FY2016; struck-through words were in FY2015. Sentences that are wholly new or wholly gone are labelled rather than marked.
Item 1A. Risk Factors.
15 rewritten, 6 added, 4 removed, 122 unchanged
Any adverse changes in economic conditions in the United States, especially in the states in which we operate, [removed: similar to the economic downturn we experienced for several years beginning in 2008] could adversely affect the financial resources of many domestic households and lead to an increase in mortgage defaults and significant decreases in the values of our customers’ homes and investment assets.
This, in turn, would probably increase our financing [removed: requirements and bad debt expense.][added: requirements.]
Although our nonregulated operations represent only about five percent of our consolidated [added: financial] results, commodity price volatility experienced in this business segment could lead to some minor volatility in our earnings.
[added: Our regulated pipeline operations historically have faced limited competition] from other existing intrastate pipelines and gas marketers seeking to provide or arrange transportation, storage and other services for customers.
The costs of providing health care benefits to our employees could significantly increase over time due to rapidly increasing health care inflation, [removed: the impact of the Health Care Reform Act of 2010 (HCR)] and any future legislative changes related to the provision of health care benefits.
The impact of additional costs [removed: incurred by the health insurance industry arising from the implementation of HCR,] which are likely to be passed on to the [removed: Company,] [added: Company] are difficult to measure at this time.
The costs of providing a cash-balance pension plan [added: to eligible full-time employees prior to 2011] and postretirement health care benefits to eligible full-time employees and related funding requirements could be influenced by changes in the market value of the assets funding our pension and postretirement health care plans.
If we were unable to hire appropriate personnel to fill future needs, the Company could encounter operating challenges and increased costs, primarily due to a loss of knowledge, [added: errors due to inexperience or the lengthy time period typically required to adequately train replacement personnel.]
We [removed: are committed to] constantly [removed: monitoring] [added: monitor] and [removed: maintaining] [added: maintain] our pipeline and distribution system to ensure that natural gas is delivered safely, reliably and efficiently through our network of more than 72,000 miles of pipeline and distribution lines.
However, [removed: due primarily to the unfortunate pipeline incident] in [removed: California in 2010,] [added: recent years,] natural gas distribution and pipeline companies have continued to face increasing federal, state and local oversight of the safety of their operations.
Although we believe these costs should be ultimately recoverable through our rates, the costs of complying with [removed: such increased] [added: new] laws and regulations may have at least a short-term adverse impact on our operating costs and financial results.
FERC has adopted rules designed to prevent market power abuse and market manipulation and to promote compliance with FERC’s other rules, policies and orders by companies engaged in the [removed: sale, purchase, transportation or storage of natural gas in interstate commerce.]
To the extent climate changes would result in warmer temperatures in our service territories, financial results [removed: from our regulated distribution segment] could be adversely affected through lower gas volumes and [removed: revenues, with our regulated pipeline segment also likely experiencing lower volumes and revenues as well.][added: revenues.]
Another possible climate change would be more frequent and more severe weather events, such as hurricanes and [removed: tornados,] [added: tornadoes,] which could increase our costs to repair damaged facilities and restore service to our customers.
[added: At this time, we] cannot predict the potential impact of such laws or regulations that may be adopted on our future business, financial condition or financial results.
If contracted gas supplies, interstate pipeline and/or storage services are not available or delivered in a timely manner, our ability to meet our customers’ natural gas requirements may be impaired and our financial condition may be adversely affected.
In order to meet our customers’ annual and seasonal natural gas demands, we must obtain a sufficient supply of natural gas, interstate pipeline capacity and storage capacity.
If we are unable to obtain these, either from our suppliers’ inability to deliver
the contracted commodity or the inability to secure replacement quantities, our financial condition and results of operations may be adversely affected.
If a substantial disruption to or reduction in interstate natural gas pipelines’ transmission and storage capacity occurred due to operational failures or disruptions, legislative or regulatory actions, hurricanes, tornadoes, floods, terrorist or cyber-attacks or acts of war, our operations or financial results could be adversely affected.
sale, purchase, transportation or storage of natural gas in interstate commerce.
Our regulated pipeline operations historically have faced limited competition
errors due to inexperience or the lengthy time period typically required to adequately train replacement personnel.
The pipeline replacement programs currently underway in several of our divisions typify the preventive maintenance and continual renewal that we perform on our natural gas distribution system in the eight states in which we currently operate.
At this time, we
Item 7. Management’s Discussion and Analysis of Financial Condition and Results of Operations.
211 rewritten, 81 added, 101 removed, 327 unchanged
These risks and uncertainties include the following: our ability to continue to access the credit markets to satisfy our liquidity requirements; regulatory trends and decisions, including the impact of rate proceedings before various state regulatory commissions; the impact of adverse economic conditions on our customers; the effects of inflation and changes in the availability and price of natural gas; [added: the availability and accessibility of contracted gas supplies, interstate pipeline and/or storage services;] market risks beyond our control affecting our risk management activities, including commodity price volatility, counterparty creditworthiness or performance and interest rate risk; the concentration of our distribution, pipeline and storage operations in Texas; increased competition from energy suppliers and alternative forms of energy; adverse weather conditions; the capital-intensive nature of our regulated distribution business; increased costs of providing health care benefits along with pension and postretirement health care benefits and increased funding requirements; the inability to continue to hire, train and retain appropriate personnel; possible increased federal, state and local regulation of the safety of our operations; increased federal regulatory oversight and potential penalties; the impact of environmental regulations on our business; the impact of climate changes or related additional legislation or regulation in the future; the inherent hazards and risks involved in operating our distribution and pipeline and storage businesses; the threat of cyber-attacks or acts of cyber-terrorism that could disrupt our business operations and information technology systems; natural disasters, terrorist activities or other events and other risks and uncertainties discussed herein, all of which are difficult to predict and many of which are beyond our control.
| Regulation | Our regulated distribution and pipeline operations meet the criteria of a cost-based, rate-regulated entity under accounting principles generally accepted in the United States. Accordingly, the financial results for these operations reflect the effects of the ratemaking and accounting practices and policies of the various regulatory commissions to which we are subject. As a result, certain costs that would normally be expensed under accounting principles generally accepted in the United States are permitted to be capitalized or deferred on the balance sheet because it is probable they can be recovered through rates. Further, regulation may impact the period in which revenues or expenses are recognized. The amounts [added: expected] to be recovered or recognized are based upon historical experience and our understanding of the regulations. Discontinuing the application of this method of accounting for regulatory assets and liabilities or changes in the accounting for our various regulatory mechanisms could significantly increase our operating expenses as fewer costs would likely be capitalized or deferred on the balance sheet, which could reduce our net income. | Decisions of regulatory authorities Issuance of new regulations or regulatory mechanisms Assessing the probability of the recoverability of deferred costs [added: Continuing to meet the criteria of a cost-based, rate regulated entity for accounting purposes] |
| Contingencies | In the normal course of business, we are confronted with issues or events that may result in a contingent liability. These generally relate to uncollectible receivables, lawsuits, claims made by third parties or the action of various regulatory agencies. We recognize these contingencies in our consolidated financial statements when we determine, based on currently available facts and circumstances it is probable that a liability has been incurred or an asset will not be recovered, and an amount can be reasonably estimated. Actual results may differ from estimates, depending on actual outcomes or changes in the facts or expectations surrounding each potential exposure. Changes in the estimates related to contingencies could have a negative impact on our consolidated results of operations, cash flows or financial position. Our contingencies are further discussed in Note [removed: 10] [added: 11] to our consolidated financial statements. | Currently available facts Management’s estimate of future resolution |
| Financial instruments and hedging activities | We use financial instruments to mitigate commodity price risk and interest rate risk. The objectives for using financial instruments have been tailored to meet the needs of our regulated and nonregulated businesses. These objectives are more fully described in Note [removed: 12] [added: 13] to the consolidated financial statements. We record all of our financial instruments on the balance sheet at fair value as required by accounting principles generally accepted in the United States, with changes in fair value ultimately recorded in the income statement. The recognition of the changes in fair value of these financial instruments recorded in the income statement is contingent upon whether the financial instrument has been designated and qualifies as a part of a hedging relationship or if regulatory rulings require a different accounting treatment. Our accounting elections for financial instruments and hedging activities utilized are more fully described in Note [removed: 12] [added: 13] to the consolidated financial statements. The criteria used to determine if a financial instrument meets the definition of a derivative and qualifies for hedge accounting treatment are complex and require management to exercise professional judgment. Further, as more fully discussed below, significant changes in the fair value of these financial instruments could materially impact our financial position, results of operations or cash flows. Finally, changes in the effectiveness of the hedge relationship could impact the accounting treatment. | Designation of contracts under the hedge accounting rules Judgment in the application of accounting guidance Assessment of the probability that future hedged transactions will occur Changes in market conditions and the related impact on the fair value of the hedged item and the associated designated financial instrument Changes in the effectiveness of the hedge relationship |
[removed: Accordingly,] [added: Additionally,] we have significantly increased investments in the safety and reliability of our natural gas distribution and transmission infrastructure.
The year-over-year increase largely reflects positive rate outcomes, which more than offset weather that was [removed: 10] [added: 25] percent warmer than the prior [removed: year, particularly in our nonregulated segment.][added: year and increased pipeline maintenance and integrity spending.]
Capital expenditures for fiscal [removed: 2015] [added: 2016] totaled [removed: $975.1] [added: $1,087.0] million.
[removed: Approximately] [added: Over] 80 percent was invested to improve the safety and reliability of our distribution and [removed: transportation] [added: transmission] systems, with a significant portion of this investment incurred under regulatory mechanisms that reduce [added: regulatory] lag to six months or less.
Fiscal [removed: 2014] [added: 2015] spending under these and other mechanisms enabled the Company to complete [removed: 17] [added: 20] regulatory filings during fiscal [removed: 2015] [added: 2016] that should increase annual operating income from regulated operations by [removed: $114.5] [added: $122.5] million.
As a result of the continued contribution and stability of our regulated earnings, cash flows and capital structure, our Board of Directors increased the quarterly dividend by [removed: 7.7] [added: 7.1] percent for fiscal [removed: 2016.][added: 2017.]
The following table presents our consolidated financial highlights for the fiscal years ended September 30, [removed: 2015, 2014] [added: 2016, 2015] and [removed: 2013.][added: 2014.]
[removed: | | For the] Fiscal [removed: Year Ended] [added: year ended] September [removed: 30 | | | | | | | | | | |][added: 30, 2016 compared with fiscal year ended September 30, 2015]
| | [removed: 2015] [added: 2016] | | | | [removed: 2014] [added: 2015] | | | | [removed: 2013] [added: 2014] | | |
| Operating revenues | $ | [removed: 4,142,136] [added: 3,349,949] | | | $ | [removed: 4,940,916] [added: 4,142,136] | | | $ | [removed: 3,875,460] [added: 4,940,916] | |
| Gross profit | [removed: 1,680,017] [added: 1,744,896] | | | | [removed: 1,582,426] [added: 1,680,017] | | | | [removed: 1,412,050] [added: 1,582,426] | | |
| Operating expenses | [removed: 1,048,622] [added: 1,076,878] | | | | [removed: 971,077] [added: 1,048,622] | | | | [removed: 910,171] [added: 971,077] | | |
| Operating income | [removed: 631,395] [added: 668,018] | | | | [removed: 611,349] [added: 631,395] | | | | [removed: 501,879] [added: 611,349] | | |
| Interest charges | [removed: 116,241] [added: 115,948] | | | | [removed: 129,295] [added: 116,241] | | | | [removed: 128,385] [added: 129,295] | | |
| Income [removed: from continuing operations] before income taxes | [removed: 510,765] [added: 550,477] | | | | [removed: 476,819] [added: 510,765] | | | | [removed: 373,297] [added: 476,819] | | |
| Net [removed: income] [added: income(1)] | $ | [removed: 315,075] [added: 350,104] | | | $ | [removed: 289,817] [added: 315,075] | | | $ | [removed: 243,194] [added: 289,817] | |
| Diluted net income per [removed: share from continuing operations] [added: share(1)] | $ | [removed: 3.09] [added: 3.38] | | | $ | [removed: 2.96] [added: 3.09] | | | $ | [removed: 2.50] [added: 2.96] | |
Regulated operations contributed 95 percent, [removed: 89] [added: 95] percent and [removed: 95] [added: 89] percent to our consolidated net income [removed: from continuing operations] for fiscal years [removed: 2015, 2014] [added: 2016, 2015] and [removed: 2013.][added: 2014.]
| Regulated distribution segment | $ | [removed: 204,813] [added: 232,370] | | | $ | [removed: 171,585] [added: 204,813] | | | $ | [removed: 150,856] [added: 171,585] | |
| Regulated pipeline segment | [removed: 94,662] [added: 101,689] | | | | [removed: 86,191] [added: 94,662] | | | | [removed: 68,260] [added: 86,191] | | |
| Nonregulated segment | [removed: 15,600] [added: 16,045] | | | | [removed: 32,041] [added: 15,600] | | | | [removed: 11,582] [added: 32,041] | | |
| Net income [removed: from continuing operations] | [removed: 315,075] [added: $] | [added: 350,104] | | | [removed: 289,817] [added: $] | [added: 315,075] | | | [removed: 230,698] [added: $] | [added: 289,817] | |
[removed: We reported] [added: This trend continued during fiscal 2016 as] net income [removed: of $315.1] [added: increased to $350.1] million, or [removed: $3.09] [added: $3.38] per diluted share for the year ended September 30, [removed: 2015,] [added: 2016,] compared with net income of [removed: $289.8] [added: $315.1] million or [removed: $2.96] [added: $3.09] per diluted share in the prior year.
[added: | (1) |] Unrealized [removed: losses] [added: gains/losses] in our nonregulated operations during [removed: the current year decreased] [added: fiscal 2016, 2015 and 2014 increased/(decreased)] net income by [removed: $1.5] [added: $0.7 million, $(1.5)] million [removed: or $0.01 per diluted share compared with net gains recorded in the prior year of] [added: and] $5.8 [removed: million] [added: million,] or [added: $0.01, $(0.01) and] $0.06 per diluted share. [added: |]
[removed: We record the tax expense as a] component of taxes, other than income.
During fiscal [removed: 2015,] [added: 2016,] we completed [removed: 16] [added: 19] regulatory proceedings in our regulated distribution segment, which should result in a [removed: $77.3] [added: $81.8] million increase in annual operating income.
Financial and operational highlights for our regulated distribution segment for the fiscal years ended September 30, [removed: 2015, 2014] [added: 2016, 2015] and [removed: 2013] [added: 2014] are presented below.
| | [removed: 2015] [added: 2016] | | | | [removed: 2014] [added: 2015] | | | | [removed: 2013] [added: 2014] | | | | [removed: 2015] [added: 2016] vs. [removed: 2014] [added: 2015] | | | | [removed: 2014] [added: 2015] vs. [removed: 2013] [added: 2014] | | |
| Gross profit | $ | [removed: 1,237,577] [added: 1,272,805] | | | $ | [removed: 1,176,515] [added: 1,237,577] | | | $ | [removed: 1,081,236] [added: 1,176,515] | | | $ | [removed: 61,062] [added: 35,228] | | | $ | [removed: 95,279] [added: 61,062] | |
| Operating expenses | [removed: 817,428] [added: 833,221] | | | | [removed: 791,947] [added: 817,428] | | | | [removed: 738,143] [added: 791,947] | | | | [removed: 25,481] [added: 15,793] | | | | [removed: 53,804] [added: 25,481] | | |
| Operating income | [removed: 420,149] [added: 439,584] | | | | [removed: 384,568] [added: 420,149] | | | | [removed: 343,093] [added: 384,568] | | | | [removed: 35,581] [added: 19,435] | | | | [removed: 41,475] [added: 35,581] | | |
| Miscellaneous income (expense) | [removed: (377] [added: 455] | | [removed: )] | | [removed: (381] [added: (377] | | ) | | [removed: 2,535] [added: (381] | | [added: )] | | [removed: 4] [added: 832] | | | | [removed: (2,916] [added: 4] | | [removed: )] |
| Interest charges | [removed: 84,132] [added: 79,404] | | | | [removed: 94,918] [added: 84,132] | | | | [removed: 98,296] [added: 94,918] | | | | [removed: (10,786] [added: (4,728] | | ) | | [removed: (3,378] [added: (10,786] | | ) |
| Income [removed: from continuing operations] before income taxes | [removed: 335,640] [added: 360,635] | | | | [removed: 289,269] [added: 335,640] | | | | [removed: 247,332] [added: 289,269] | | | | [removed: 46,371] [added: 24,995] | | | | [removed: 41,937] [added: 46,371] | | |
| Income tax expense | [removed: 130,827] [added: 128,265] | | | | [removed: 117,684] [added: 130,827] | | | | [removed: 96,476] [added: 117,684] | | | | [removed: 13,143] [added: (2,562] | | [added: )] | | [removed: 21,208] [added: 13,143] | | |
| Net Income | $ | [removed: 204,813] [added: 232,370] | | | $ | [removed: 171,585] [added: 204,813] | | | $ | [removed: 163,707] [added: 171,585] | | | $ | [removed: 33,228] [added: 27,557] | | | $ | [removed: 7,878] [added: 33,228] | |
We funded our capital expenditure program primarily through operating cash flows of $795.0 million, net short-term borrowings and the issuance of common stock, including the At-the-Market Equity Sales (ATM) Program described below.
In order to strengthen our ability to meet our financing needs, we:
- Entered into an ATM equity distribution agreement in March 2016 under which we may issue and sell shares of our common stock, up to an aggregate offering price of $200 million.
We issued 1.4 million shares of common stock and received $98.6 million in net proceeds under the ATM program in fiscal 2016.
- Executed in September 2016 a new three-year, $200 million multi-draw term loan agreement with a syndicate of three lenders.
The term loan will be used to refinance existing indebtedness and for working capital, capital expenditures and other general corporate purposes.
- Amended our existing five-year $1.25 billion unsecured credit facility in October 2016, which increased the committed loan to $1.5 billion and extended the facility through September 25, 2021.
On May 13, 2016, Standard & Poor’s Corporation upgraded our senior unsecured debt rating to A from A- and upgraded our short-term debt rating to A-1 from A-2, with a ratings outlook of stable, citing strong financial performance largely due to our ability to timely recover capital investments.
On October 31, 2016, we announced the proposed sale of AEM to CenterPoint Energy Services, Inc. The transaction will include the transfer of approximately 800 delivered gas customers and AEM’s related asset optimization business at an all cash price of $40.0 million plus working capital at the date of closing.
No material gain or loss is currently anticipated in connection with the closing of this transaction.
The proceeds from the sale will be redeployed to fund infrastructure investment in the regulated business.
Upon completion of the sale, we will have fully exited the nonregulated gas marketing business.
We record the tax expense as a
| • | a $47.5 million net increase in rate adjustments. Our Mid-Tex Division accounted for $20.9 million of this increase. We also experienced increases in our Mississippi and West Texas Divisions. |
| • | The impact of weather that was 25 percent warmer than the prior year, before adjusting for weather normalization mechanisms. Therefore, although sales volumes declined 17 percent, gross margin experienced just a $3.4 million decline from lower consumption. |
| • | Customer growth, primarily in our Mid-Tex, Louisiana and Tennessee service areas, which contributed an incremental $6.6 million. |
Net income for the year ended September 30, 2016 includes a $5.0 million income tax benefit for equity awards that vested during the current year as a result of adopting the new stock-based accounting guidance, as described in Note 2 to our consolidated financial statements.
| | 2016 | | | | 2015 | | | | 2014 | | | | 2016 vs. 2015 | | | | 2015 vs. 2014 | | |
As part of its pipeline operations, APT manages five underground storage reservoirs in Texas.
| | 2016 | | | | 2015 | | | | 2014 | | | | 2016 vs. 2015 | | | | 2015 vs. 2014 | | |
Additionally, gross profit reflects a $3.6 million increase from the sale of excess retention gas, which was offset by a $4.0 million decrease in through-system volumes and lower storage and blending fees due to warmer weather in the current year compared to the prior year.
Operating expenses increased $20.6 million, primarily due to increased levels of pipeline maintenance activities to improve the safety and reliability of our system and increased property taxes and depreciation expense associated with increased capital investments.
The increase in gross profit primarily reflects a $47.0 million increase in rates from the approved 2014 and 2015 GRIP filings.
| | 2016 | | | | 2015 | | | | 2014 | | | | 2016 vs. 2015 | | | | 2015 vs. 2014 | | |
Fiscal year ended September 30, 2016 compared with fiscal year ended September 30, 2015
| • | A $10.3 million decrease in other realized margins. As a result of warmer weather, we modified storage positions to meet customer needs throughout the winter and captured less favorable spread values on the related supply repurchases. Additionally, we experienced an increase in storage demand fees related primarily to higher park and loan activity. |
| • | A $2.3 million decrease in gas delivery and related services margins, primarily due to a three percent decrease in consolidated sales volumes due to warmer weather. However, lower net transportation costs and other variable costs driven by fewer deliveries resulted in per-unit margins of 12 cents per Mcf, which is consistent with prior year per-unit margins. |
Operating expenses decreased $8.1 million, primarily due to lower administrative expenses.
As we continue to invest in the safety and reliability of our distribution and transportation system, we expect our capital spending will increase.
We intend to fund this additional investment through available operating cash flows, the issuance of long-term debt securities and, to a lesser extent, the issuance of equity.
To support our capital market activities, we filed a registration statement with the SEC on March 28, 2016 to issue, from time to time, up to $2.5 billion in common stock and/or debt securities, which replaced our registration statement that expired on March 28, 2016.
On March 28, 2016, we entered into an ATM equity distribution agreement under which we may issue and sell, shares of our common stock, up to an aggregate offering price of $200 million.
The shares will be issued under our shelf registration statement.
Proceeds from the ATM program will be used primarily to repay short-term debt outstanding under our $1.25 billion commercial paper program, to fund capital spending primarily to enhance the safety and reliability of our system and for general corporate purposes.
During fiscal 2016, we issued 1.4 million shares of common stock and received $98.6 million in net proceeds under the ATM program.
At September 30, 2016, $2.4 billion of securities remain available for issuance under the shelf registration statement.
On September 22, 2016, we entered into a three year, $200 million multi-draw term loan agreement with a syndicate of three lenders.
The term loan will be used to refinance existing indebtedness and for working capital, capital expenditures and other general corporate purposes.
At September 30, 2016, there were no borrowings under the term loan.
On October 5, 2016, we amended our existing five-year $1.25 billion credit facility, which increased the committed loan to $1.5 billion and extended the facility through September 25, 2021.
In addition, recent pipeline safety rulemaking has impacted the level of operating and maintenance expense and capital spending in our regulated business, which we expect to continue.
This trend continued during fiscal 2015.
Net income increased 9 percent to $315.1 million, or $3.09 per diluted share.
Additionally, operating cash flow increased $96.5 million to $836.5 million for the fiscal year ended September 30, 2015.
We plan to continue to fund our growth through the use of operating cash flows and debt and equity securities, to maintain a balanced capital structure.
On July 1, 2015, Fitch Ratings (Fitch) upgraded our senior unsecured debt rating to A from A- with a ratings outlook of stable.
Fitch cited its expectation of continued strong financial performance driven primarily by organic growth in our regulated distribution and regulated pipeline segments.
On October 29, 2015, S&P affirmed our senior unsecured debt rating as A- and issued a revised outlook from stable to positive, citing the potential for an upgraded rating in the future if we maintain our current level of financial performance as capital spending levels remain elevated.
| | | | | | | | | | | | |
| --- | --- | --- | --- | --- | --- | --- | --- | --- | --- | --- | --- |
| | (In thousands, except per share data) | | | | | | | | | | |
| Miscellaneous expense | (4,389 | | ) | | (5,235 | | ) | | (197 | | ) |
| Income tax expense | 195,690 | | | | 187,002 | | | | 142,599 | | |
| Income from continuing operations | 315,075 | | | | 289,817 | | | | 230,698 | | |
| Income from discontinued operations, net of tax | — | | | | — | | | | 7,202 | | |
| Gain on sale of discontinued operations, net of tax | — | | | | — | | | | 5,294 | | |
| Diluted net income per share from discontinued operations | $ | — | | | $ | — | | | $ | 0.14 | |
| Diluted net income per share | $ | 3.09 | | | $ | 2.96 | | | $ | 2.64 | |
| Net income from discontinued operations | — | | | | — | | | | 12,496 | | |
The following table segregates our consolidated net income and diluted earnings per share between our regulated and nonregulated operations:
| Regulated operations | $ | 299,475 | | | $ | 257,776 | | | $ | 219,116 | |
| Nonregulated operations | 15,600 | | | | 32,041 | | | | 11,582 | | |
| Diluted EPS from continuing regulated operations | $ | 2.93 | | | $ | 2.63 | | | $ | 2.38 | |
| Diluted EPS from nonregulated operations | 0.16 | | | | 0.33 | | | | 0.12 | | |
| Diluted EPS from continuing operations | 3.09 | | | | 2.96 | | | | 2.50 | | |
| Diluted EPS from discontinued operations | — | | | | — | | | | 0.14 | | |
| Consolidated diluted EPS | $ | 3.09 | | | $ | 2.96 | | | $ | 2.64 | |
We reported net income of $289.8 million, or $2.96 per diluted share for the year ended September 30, 2014, compared with net income of $243.2 million or $2.64 per diluted share in fiscal 2013.
Income from continuing operations in fiscal 2013 was $230.7 million, or $2.50 per diluted share.
Income from discontinued operations was $12.5 million or $0.14 per diluted share for the year ended September 30, 2013, which includes the gain on sale of substantially all our assets in Georgia of $5.3 million.
Unrealized gains in our nonregulated operations during fiscal 2014 increased net income by $5.8 million or $0.06 per diluted share compared with net gains recorded in fiscal 2013 of $5.3 million, or $0.05 per diluted share.
In April 2013, we completed the sale of our Georgia regulated distribution operations, representing approximately 64,000 customers.
| Income from continuing operations | 204,813 | | | | 171,585 | | | | 150,856 | | | | 33,228 | | | | 20,729 | | |
| Income from discontinued operations, net of tax | — | | | | — | | | | 7,202 | | | | — | | | | (7,202 | | ) |
| Gain on sale of discontinued operations, net of tax | — | | | | — | | | | 5,649 | | | | — | | | | (5,649 | | ) |
| Consolidated regulated distribution throughput from discontinued operations — MMcf | — | | | | — | | | | 4,731 | | | | — | | | | (4,731 | | ) |
| Total consolidated regulated distribution throughput — MMcf | 429,322 | | | | 451,803 | | | | 397,037 | | | | (22,481 | | ) | | 54,766 | | |
| Consolidated regulated distribution average transportation revenue per Mcf | $ | 0.50 | | | $ | 0.48 | | | $ | 0.46 | | | $ | 0.02 | | | $ | 0.02 | |
| | |
| --- | --- |
An excerpt. Shown here: 40 of 211 rewritten, 40 of 81 added and 40 of 101 removed. The counts are complete. For every sentence, read Item 7. Management’s Discussion and Analysis of Financial Condition and Results of Operations. in the FY2016 filing and the FY2015 filing.
Item 7A. Quantitative and Qualitative Disclosures About Market Risk.
4 rewritten, 0 added, 0 removed, 26 unchanged
Our risk management activities and related accounting treatment are described in further detail in Note [removed: 12] [added: 13] to the consolidated financial statements.
Based on AEH’s net open position (including existing storage and related financial contracts) at September 30, [removed: 2015] [added: 2016] of [removed: 1.0] [added: 0.1] Bcf, a $0.50 change in the forward NYMEX price would have had [removed: a $0.3 million] [added: an] impact [added: of less than $0.1 million] on our consolidated net income.
Based upon our net physical position at September 30, [removed: 2015] [added: 2016] and assuming our hedges would still qualify as highly effective, a $0.50 change in the difference between the Gas Daily and NYMEX indices would impact our reported net income by approximately [removed: $4.4] [added: $5.9] million.
Had interest rates associated with our short-term borrowings increased by an average of one percent, our interest expense would have increased by approximately [removed: $2.7] [added: $6.4] million during [removed: 2015.][added: 2016.]
Item 1. Business.
67 rewritten, 70 added, 53 removed, 265 unchanged
At September 30, [removed: 2015,] [added: 2016,] we held [removed: 1,005] [added: 1,003] franchises having terms generally ranging from five to 35 years.
| Mid-Tex | | Texas, including the Dallas/Fort Worth Metroplex | | 550 | | [removed: 1,629,826] [added: 1,649,291] |
| Kentucky/Mid-States | | Kentucky | | 230 | | [removed: 180,033] [added: 179,717] |
| West Texas | | Amarillo, Lubbock, Midland | | 80 | | [removed: 305,814] [added: 308,988] |
| Colorado-Kansas | | Colorado | | 170 | | [removed: 115,048] [added: 117,017] |
Major suppliers during fiscal [removed: 2015] [added: 2016] were [removed: Anadarko] [added: Concord] Energy [removed: Services Company,] [added: LLC,] ConocoPhillips Company, Devon Gas Services, L.P., [removed: Enbridge Marketing (US) Inc., Hydrocarbon Exchange Corporation, Munich Re Trading Ltd,] [added: Gulf South Pipeline Company LP, Sequent Energy Management, LP,] Targa Gas Marketing LLC, [added: Tenaska Gas Storage, LLC, Texas]
[removed: Targa Pipeline Mid-Continent WestTex LLC, Tenaska] Gas [removed: Storage, LLC,] [added: Transmission Corporation,] Texla Energy Management, Inc. and Atmos Energy Marketing, LLC and Trans Louisiana Gas Pipeline, Inc., [added: which are] wholly owned subsidiaries in our nonregulated segment.
The peak-day demand for our distribution operations in fiscal [removed: 2015] [added: 2016] was on January [removed: 7, 2015,] [added: 10, 2016,] when sales to customers reached approximately [removed: 3.2] [added: 2.5] Bcf.
Currently, our distribution divisions, except for our Mid-Tex Division, utilize [removed: 35] [added: 40] pipeline transportation companies, both interstate and intrastate, to transport our natural gas.
The natural gas supply for our Mid-Tex Division is delivered primarily by our Atmos Pipeline — Texas [removed: Division.][added: Division (APT).]
We [added: do not] anticipate [removed: no] [added: any] problems with obtaining additional gas supply as needed for our customers.
Our regulated pipeline segment consists of the [added: regulated] pipeline and storage operations of [removed: our Atmos Pipeline - Texas Division (APT).][added: APT.]
APT is one of the largest intrastate pipeline operations in Texas with a heavy concentration in the established natural gas-producing areas of central, northern and eastern Texas, extending into or near the major producing areas of the Barnett Shale, the Texas Gulf Coast and the [removed: Permian Basin] [added: Delaware and Val Verde Basins] of West Texas.
[added: Through it,] APT [removed: also] provides [removed: interruptible transportation, storage] [added: transportation] and [removed: ancillary] [added: storage] services [removed: for] [added: to our Mid-Tex Division, other] third [removed: parties including,] [added: party local distribution companies,] industrial and electric generation [removed: customers as well as producers,] [added: customers,] marketers and [removed: other shippers..][added: producers.]
[removed: The regulated pipeline] [added: This] segment represents approximately 30 percent of our consolidated operations.
Gross profit earned from transportation and storage services for [removed: our Atmos Pipeline - Texas Division] [added: APT] is subject to traditional ratemaking governed by the RRC.
Rates are updated through [removed: annual] [added: periodic] filings made under Texas’ Gas Reliability Infrastructure Program [removed: (GRIP) and Rider REV.][added: (GRIP).]
GRIP allows us to include in our [removed: rates] [added: rate base] annually approved capital costs incurred in the prior calendar year provided that we file a complete rate case at least once every five years.
[removed: Atmos Pipeline-Texas’] [added: APT’s] existing regulatory mechanisms allow certain transportation and storage services to be provided under market-based rates.
| • | Authorization in tariffs, [removed: statute,] [added: statute] or commission rules that allows us to defer certain elements of our cost of service until they are included in rates, such as depreciation, ad valorem taxes and pension costs. |
| Atmos Pipeline — Texas — GRIP | | Texas | | [removed: 04/08/2015] [added: 05/03/2016] | | [removed: 533,774(2)] [added: 722,700(2)] | | 9.36% | | N/A | 11.80% |
| Kentucky/Mid-States | | Kentucky | | [removed: 04/22/2014 |] [added: 09/2015] | [removed: 252,738] | [added: 4,382] | [removed: 7.71%] | | [removed: 51/49] | [removed: 9.80%] [added: 10/10/2014] |
| Louisiana | | Trans La | | [removed: 04/01/2015] [added: 04/01/2016] | | [removed: 117,462] [added: 138,692] | | 7.79% | | [removed: 47/53] [added: 46/54] | 9.80% |
| Mid-Tex Cities | | Texas | | [removed: 06/01/2015] [added: 06/01/2016] | | [removed: 1,955,948(3)] [added: 2,130,568(3)] | | 8.43% | | 45/55 | 10.50% |
| | | Mississippi - SGR | | [removed: 11/01/2014] [added: 12/03/2015] | | [removed: 8,960] [added: 3,475] | | 9.37% | | [removed: N/A] [added: 47/53] | 12.00% |
| West Texas(5) | | Texas | | [removed: 03/15/2015] [added: 03/15/2016] | | (4) | | [removed: 8.44%] [added: (4)] | | (4) | 10.50% |
| | | Texas-GRIP | | [removed: 04/28/2015] [added: 05/03/2016] | | [removed: 379,303] [added: 419,976] | | 8.57% | | 48/52 | 10.50% |
| Division | | Jurisdiction | | Bad Debt Rider(6) | | Formula Rate | | Infrastructure Mechanism | [removed: Performance-] [added: Performance] Based Rate Program(7) | | WNA Period |
| Colorado-Kansas | | Colorado | | No | | No | | [removed: Pending(8)] [added: Yes] | No | | N/A |
| (1) | The rate base, authorized rate of return and authorized return on equity presented in this table are those from the most recent [removed: rate case or GRIP] [added: regulatory] filing for each jurisdiction. These rate bases, rates of return and returns on equity are not necessarily indicative of current or future rate bases, rates of return or returns on equity. |
Substantially all of our regulated revenues in the fiscal years ended September 30, [removed: 2015, 2014] [added: 2016, 2015] and [removed: 2013] [added: 2014] were derived from sales at rates set by or subject to approval by local or state authorities.
Net operating income increases resulting from ratemaking activity totaling [removed: $114.5] [added: $122.5] million, [removed: $93.3] [added: $114.5] million and [removed: $98.1] [added: $93.3] million, became effective in fiscal [removed: 2015, 2014] [added: 2016, 2015] and [removed: 2013,] [added: 2014,] as summarized below:
| Rate Action | | [removed: 2015] [added: 2016] | | | | [removed: 2014] [added: 2015] | | | | [removed: 2013] [added: 2014] | | |
| Annual formula rate mechanisms | | $ | [removed: 113,706] [added: 114,974] | | | $ | [removed: 71,749] [added: 113,706] | | | $ | [removed: 40,088] [added: 71,749] | |
| Rate case filings | | [removed: 711] [added: 7,716] | | | | [removed: 21,819] [added: 711] | | | | [removed: 56,700] [added: 21,819] | | |
| Other ratemaking activity | | [removed: 78] [added: (183] | | [added: )] | | [removed: (226] [added: 78] | | [removed: )] | | [removed: 1,322] [added: (226] | | [added: )] |
| | | $ | [removed: 114,495] [added: 122,507] | | | $ | [removed: 93,342] [added: 114,495] | | | $ | [removed: 98,110] [added: 93,342] | |
Additionally, the following ratemaking efforts were initiated during fiscal [removed: 2015] [added: 2016] but had not been completed as of September 30, [removed: 2015:][added: 2016:]
| Kentucky/Mid-States | [removed: PRP(2)] | [removed: Kentucky] [added: Kentucky-PRP] | [added: | 09/2016 | |] 3,786 | | | [added: | 10/01/2015 |]
| Mississippi | [removed: SRF] | [removed: Mississippi] [added: Mississippi-SRF(2)] | [removed: 11,186] | [added: 10/2016] | | [added: 9,192 | | | | 01/01/2016 |]
Over the last five years, we have achieved growth by making significant capital investments to fortify and upgrade our distribution and transmission systems and successfully recovering these investments through regulatory mechanisms designed to minimize regulatory lag.
| | | Tennessee | | | | 143,942 |
| | | Virginia | | | | 23,820 |
| Louisiana | | Louisiana | | 280 | | 358,972 |
| Mississippi | | Mississippi | | 110 | | 269,750 |
| | | Kansas | | | | 134,012 |
As part of its pipeline operations, APT owns and operates five underground storage reservoirs in Texas.
| • | Infrastructure programs in place in the majority of our states that provide for an annual rate adjustment to rates for qualifying capital expenditures. Through our annual formula rate mechanisms and infrastructure programs, we have the ability to recover over 90 percent of our capital expenditures within six months. |
| Colorado-Kansas | | Colorado | | 01/01/2016 | | 129,094 | | 7.82% | | 48/52 | 9.60% |
| | | Colorado SSIR | | 01/01/2016 | | 9,478 | | 7.82% | | 48/52 | 9.60% |
| | | Kansas | | 03/17/2016 | | 200,564 | | (4) | | (4) | (4) |
| Kentucky/Mid-States | | Kentucky | | 08/15/2016 | | 335,833 | | (4) | | (4) | (4) |
| | | Tennessee | | 06/01/2016 | | 274,595 | | 7.72% | | 47/53 | 9.80% |
| | | Virginia | | 04/01/2016 | | 49,132 | | (4) | | (4) | 9.00% - 10.00% |
| | | LGS | | 07/01/2016 | | 350,837 | | 7.73% | | 46/54 | 9.80% |
| Mid-Tex — Dallas | | Texas | | 06/01/2016 | | 2,076,415(3) | | 8.28% | | 43/57 | 10.10% |
| Mississippi | | Mississippi | | 12/21/2015 | | 357,646 | | 7.94% | | 47/53 | 9.88% |
| (2) | This APT rate base represents the incremental rate base approved through annual GRIP filings since APT's last rate case in 2011. |
| | PRP(1) | Kentucky | 4,938 | | |
| | ARM(2) True-Up | Tennessee | 5,514 | | |
| Mississippi | SIR(1) | Mississippi | 3,334 | | |
| | | | $ | 14,897 | |
| (1) | The Steps to Advance Virginia Energy (SAVE) Plan, the Pipeline Replacement Program (PRP) and the System Integrity Rider (SIR) surcharges relate to long-term programs to replace aging infrastructure. |
| (2) | The Annual Rate Mechanism (ARM) is a formula rate mechanism that refreshes the Company's rates on an annual basis. |
The following table summarizes our annual formula rate mechanisms by state.
| | | | | |
| --- | --- | --- | --- | --- |
| | | | | |
| | | Annual Formula Rate Mechanisms | | |
| State | | Infrastructure Programs | | Formula Rate Mechanisms |
| | | | | |
| Colorado | | System Safety and Integrity Rider (SSIR) | | — |
| Kansas | | Gas System Reliability Surcharge (GSRS) | | — |
| Kentucky | | Pipeline Replacement Program (PRP) | | — |
| Louisiana | | (1) | | Rate Stabilization Clause (RSC) |
| Mississippi | | System Integrity Rider (SIR) | | Stable Rate Filing (SRF), Supplemental Growth Filing (SGR) |
| Tennessee | | — | | Annual Rate Mechanism (ARM) |
| Texas | | Gas Reliability Infrastructure Program (GRIP), (1) | | Dallas Annual Rate Review (DARR), Rate Review Mechanism (RRM) |
| Virginia | | Steps to Advance Virginia Energy (SAVE) | | — |
| (1) | Infrastructure mechanisms in Texas and Louisiana allow for the deferral of all expenses associated with capital expenditures incurred pursuant to these rules, which primarily consists of interest, depreciation and other taxes (Texas only), until the next rate proceeding (rate case or annual rate filing), at which time investment and costs would be recoverable through base rates. |
| | |
| --- | --- |
Over the last seven years, we have achieved growth by implementing rate designs that reduce or eliminate regulatory lag and separate the recovery of our approved margins from customer usage patterns.
In addition, we have developed various commercial opportunities within our regulated transmission and storage operations.
| | | Tennessee | | | | 141,141 |
| | | Virginia | | | | 23,567 |
| Louisiana | | Louisiana | | 300 | | 356,579 |
| Mississippi | | Mississippi | | 110 | | 266,467 |
| | | Kansas | | | | 132,837 |
APT’s primary business is providing firm transportation and storage services for our Mid-Tex Division and other LDC customers.
Rider REV is an annual adjustment mechanism that adjusts the regulated rates for a portion of the variation in non-regulated annual revenues from a set base level.
| • | Infrastructure programs in place in four of our states that provide for an annual rate adjustment to rates. |
| • | Implemented various rate mechanisms that allow us to recover over 90 percent of our capital expenditures are recovered within six months. |
| Colorado-Kansas | | Colorado | | 08/26/2014 | | 111,297 | | 8.04% | | 48/52 | 9.72% |
| | | Kansas | | 09/04/2014 | | 177,563 | | 7.75% | | 47/53 | 9.10% |
| | | Kansas-GSRS | | 02/01/2015 | | 2,708 | | 7.75% | | N/A | 9.10% |
| | | Kentucky-PRP | | 10/10/2014 | | 35,382 | | 7.71% | | N/A | 9.80% |
| | | Tennessee | | 06/01/2015 | | 247,958 | | 7.73% | | 47/53 | 9.80% |
| | | Virginia | | 09/09/2014 | | 37,456 | | 7.94% | | 46/54 | 9.00% - 10.00% |
| | | Virginia-SAVE | | 10/01/2014 | | 3,896 | | 7.94% | | N/A | 9.00% - 10.00% |
| | | LGS | | 07/01/2015 | | 326,875 | | 7.91% | | 46/54 | 9.80% |
| Mid-Tex — Dallas | | Texas | | 06/01/2015 | | 1,935,160(3) | | 8.33% | | 46/54 | 10.10% |
| Mississippi | | Mississippi | | 02/03/2015 | | 322,610 | | 8.26% | | 45/55 | 9.98% |
| (2) | The APT rate base represents the incremental rate base from the 2011 APT filing. |
| (8) | The Company and intervenors have entered into a settlement agreement, approved on October 23, 2015, for implementation of an Infrastructure Mechanism effective January 1, 2016. |
| Colorado-Kansas | Rate Case(1) | Colorado | $ | 5,276 | |
| | Rate Case | Kansas | 5,667 | | |
| | PRP (3) | Virginia | 118 | | |
| | | | $ | 26,282 | |
| (1) | A Stipulation and Settlement was signed on September 23, 2015. The settlement was approved on October 23, 2015 resulting in an operating income increase of $2.1 million and authorization to implement a long-term program to replace aging infrastructure in Colorado. The base rate change and infrastructure surcharge will go into effect on January 1, 2016. |
| (2) | The Pipeline Replacement Program (PRP) surcharge relates to a long-term program to replace aging infrastructure. The Kentucky PRP was implemented on October 1, 2015. |
| (3) | The PRP surcharge relates to a long-term program to replace aging infrastructure. The Virginia PRP was implemented on October 1, 2015. |
The formula rate filing mechanism is referred to as Dallas annual rate review (DARR) and rate review mechanisms (RRM) in our Mid-Tex Division, as the RRM in our West Texas Division, as the stable rate filing (SRF) in the Mississippi Division, the rate stabilization clause (RSC) in the Louisiana Division, and Annual Rate Mechanism (ARM) in Tennessee.
These infrastructure programs are referred to as System Safety and Integrity Rider in Colorado (SSIR), Gas System Reliability Surcharge (GSRS) in Kansas, Pipeline Replacement Program (PRP) in Kentucky, System Integrity Rider in Mississippi (SIR), Gas Infrastructure Reliability Program (GRIP) and Steps to Advance Virginia Energy (SAVE).
| 2013 Filings: | | | | | | | | | | |
| Louisiana | | LGS | | 12/2012 | | $ | 908 | | | 07/01/2013 |
| Mid-Tex | | City of Dallas | | 09/2012 | | 1,800 | | | | 06/01/2013 |
| Atmos Pipeline — Texas | | Texas | | 12/2012 | | 26,730 | | | | 05/07/2013 |
| Louisiana | | TransLa | | 09/2012 | | 2,260 | | | | 04/01/2013 |
| Kentucky/Mid-States | | Georgia(6) | | 09/2013 | | 743 | | | | 02/01/2013 |
An excerpt. Shown here: 40 of 67 rewritten, 40 of 70 added and 40 of 53 removed. The counts are complete. For every sentence, read Item 1. Business. in the FY2016 filing and the FY2015 filing.
Item 3. Legal Proceedings.
1 rewritten, 0 added, 0 removed, 3 unchanged
See Note [removed: 10] [added: 11] to the consolidated financial statements, which is incorporated in this Item 3 by reference.
Cover and table of contents
25 rewritten, 1 added, 1 removed, 100 unchanged
For the fiscal year ended September 30, [removed: 2015][added: 2016]
The aggregate market value of the common voting stock held by non-affiliates of the registrant as of the last business day of the registrant’s most recently completed second fiscal quarter, March 31, [removed: 2015,] [added: 2016,] was [removed: $5,500,632,050.][added: $7,463,087,078.]
As of [removed: October 30, 2015,] [added: November 9, 2016,] the registrant had [removed: 101,506,645] [added: 103,964,735] shares of common stock outstanding.
Portions of the registrant’s Definitive Proxy Statement to be filed for the Annual Meeting of Shareholders on February [removed: 3, 2016] [added: 8, 2017] are incorporated by reference into Part III of this report.
| [Glossary of Key [removed: Terms](#sBF800B7AE6F311676A6365124C94680D)] [added: Terms](#s23F674823CCA5C52933B2C1F5E87C6F6)] | | [removed: [3](#sBF800B7AE6F311676A6365124C94680D)] [added: [3](#s23F674823CCA5C52933B2C1F5E87C6F6)] |
| Item 1. | [removed: [Business](#sB41CD63E6DF16AB3687765120A63BF41)] [added: [Business](#s19FEA457CBCD53E997D9D71F4B4C6B1E)] | [removed: [4](#sB41CD63E6DF16AB3687765120A63BF41)] [added: [4](#s19FEA457CBCD53E997D9D71F4B4C6B1E)] |
| Item 1A. | [Risk [removed: Factors](#sB616A30BFE563251FBBF65124CFBCD87)] [added: Factors](#sD24A1E2F8AF15330B56990B34B3EA129)] | [removed: [13](#sB616A30BFE563251FBBF65124CFBCD87)] [added: [13](#sD24A1E2F8AF15330B56990B34B3EA129)] |
| Item 1B. | [Unresolved Staff [removed: Comments](#sBFC0810BF5C3103B55EE65124D111765)] [added: Comments](#sF4716AE19D375151BF31B47B2647ADD1)] | [removed: [17](#sBFC0810BF5C3103B55EE65124D111765)] [added: [18](#sF4716AE19D375151BF31B47B2647ADD1)] |
| Item 2. | [removed: [Properties](#sB49740D224A05553C00265121733EC5E)] [added: [Properties](#s1C77D2CAA077509EABFE69DDD7D3891E)] | [removed: [17](#sB49740D224A05553C00265121733EC5E)] [added: [18](#s1C77D2CAA077509EABFE69DDD7D3891E)] |
| Item 3. | [Legal [removed: Proceedings](#s4EAC0BFD865925D7593165124D7DC073)] [added: Proceedings](#sE3DDC5A74E1D56B398B18A2B512DDF5F)] | [removed: [19](#s4EAC0BFD865925D7593165124D7DC073)] [added: [19](#sE3DDC5A74E1D56B398B18A2B512DDF5F)] |
| Item 4. | Mine Safety Disclosures | [removed: [19](#s5E94864768592E02777665124DC0072A)] [added: [19](#sC14CF7E3914C5CD59FD1FD44EC1089F5)] |
| Item 5. | [Market for Registrant’s Common Equity, Related Stockholder Matters and Issuer Purchases of Equity [removed: Securities](#s338E61030349700E4FCE65120E256F75)] [added: Securities](#sE802B414A8455C988CC2A2A41C6AC55F)] | [removed: [19](#s338E61030349700E4FCE65120E256F75)] [added: [20](#sE802B414A8455C988CC2A2A41C6AC55F)] |
| Item 6. | [Selected Financial [removed: Data](#s621B2C86967341DD378C65124E245DA7)] [added: Data](#sD541FF993F8A547BB9F2D0518169F335)] | [removed: [21](#s621B2C86967341DD378C65124E245DA7)] [added: [22](#sD541FF993F8A547BB9F2D0518169F335)] |
| Item 7. | [Management’s Discussion and Analysis of Financial Condition and Results of [removed: Operations](#sB1A0472EC456A19C8E30651250535424)] [added: Operations](#sFCF8147E22975893A19C6577F178AAB0)] | [removed: [22](#s3D56F4BA234B8E85C6EB65124E3F5733)] [added: [23](#sCCF71BC7F5AC565EB36D1E6420C18B60)] |
| Item 7A. | [Quantitative and Qualitative Disclosures About Market [removed: Risk](#sD354EAC8FC8D05D79975651250ADC1C0)] [added: Risk](#sA0D8CA3877ED556DA215B9ED5EC40A26)] | [removed: [41](#sD354EAC8FC8D05D79975651250ADC1C0)] [added: [42](#sA0D8CA3877ED556DA215B9ED5EC40A26)] |
| Item 8. | [Financial Statements and Supplementary [removed: Data](#s119F694E3B313DF7AE89651250B0E252)] [added: Data](#s3EFB14C4C03455129585E893FA4610EB)] | [removed: [43](#s119F694E3B313DF7AE89651250B0E252)] [added: [44](#s3EFB14C4C03455129585E893FA4610EB)] |
| Item 9. | [Changes in and Disagreements With Accountants on Accounting and Financial [removed: Disclosure](#s2FC61376DAA92C8ADFFB6512569B28E0)] [added: Disclosure](#s606F32261AF15C9694B3A341C7B7976C)] | [removed: [97](#s2FC61376DAA92C8ADFFB6512569B28E0)] [added: [98](#s606F32261AF15C9694B3A341C7B7976C)] |
| Item 9A. | [Controls and [removed: Procedures](#sDF86255D5617468117B9651256B34D33)] [added: Procedures](#s761BE7AC13A952129ECED0B4CB7439BA)] | [removed: [97](#sDF86255D5617468117B9651256B34D33)] [added: [98](#s761BE7AC13A952129ECED0B4CB7439BA)] |
| Item 9B. | [Other [removed: Information](#s75FA84EB667C513F0331651256FF53A5)] [added: Information](#sD27BD8127F3F5E5292DF370B2EB27EC3)] | [removed: [99](#s75FA84EB667C513F0331651256FF53A5)] [added: [100](#sD27BD8127F3F5E5292DF370B2EB27EC3)] |
| Item 10. | [Directors, Executive Officers and Corporate [removed: Governance](#s5B301D0624616CFBC5A06512572A16F2)] [added: Governance](#sC385376D903A568280361241ECC7BA36)] | [removed: [99](#s5B301D0624616CFBC5A06512572A16F2)] [added: [100](#sC385376D903A568280361241ECC7BA36)] |
| Item 11. | [Executive [removed: Compensation](#s81246F11136E146A4598651257831480)] [added: Compensation](#sBFB228010E07549DABE8B395FB22B4A3)] | [removed: [100](#s81246F11136E146A4598651257831480)] [added: [101](#sBFB228010E07549DABE8B395FB22B4A3)] |
| Item 12. | [Security Ownership of Certain Beneficial Owners and Management and Related Stockholder [removed: Matters](#sECB82ADE0F711B8A5DE865125786CE46)] [added: Matters](#sAA3231B7D33958D88DFF8A7CB665503B)] | [removed: [100](#sECB82ADE0F711B8A5DE865125786CE46)] [added: [101](#sAA3231B7D33958D88DFF8A7CB665503B)] |
| Item 13. | [Certain Relationships and Related Transactions, and Director [removed: Independence](#sD8BB0B8EC65B74D060AF651257AE256D)] [added: Independence](#sEB2EE70AC1425C74805DFF4E940DE206)] | [removed: [100](#sD8BB0B8EC65B74D060AF651257AE256D)] [added: [101](#sEB2EE70AC1425C74805DFF4E940DE206)] |
| Item 14. | [Principal Accountant Fees and [removed: Services](#s11340B5ADBB2A76D8E81651257F97F78)] [added: Services](#s2206273DB640532681DBA040C33C4C73)] | [removed: [100](#s11340B5ADBB2A76D8E81651257F97F78)] [added: [101](#s2206273DB640532681DBA040C33C4C73)] |
| Item 15. | [Exhibits and Financial Statement [removed: Schedules](#sBA83A105B70B2D1D93A5651258A0C3AB)] [added: Schedules](#sD070143C027F51E8884FF0FA35A24E24)] | [removed: [100](#sFCD32789A1BDB1BC7C3165125830837C)] [added: [101](#s685E4EE86252542282AAF1CD4C5F3B66)] |
10-K 1 ato2016093010-k.htm 10-K
10-K 1 ato2015093010-k.htm FORM 10-K
Item 2. Properties.
8 rewritten, 1 added, 1 removed, 46 unchanged
At September 30, [removed: 2015,] [added: 2016,] in our regulated distribution segment, we owned an aggregate of [removed: 70,218] [added: 70,593] miles of underground distribution and transmission mains throughout our distribution systems.
Through our regulated pipeline segment we owned [removed: 5,477] [added: 5,446] miles of gas transmission [removed: and gathering] lines as well as 111 miles of transmission and gathering lines through our nonregulated segment.
The following table summarizes certain information regarding our underground gas storage facilities at September 30, [removed: 2015:][added: 2016:]
Additionally, we contract for storage service in underground storage facilities on many of the interstate [added: and intrastate] pipelines serving us to supplement our proprietary storage capacity.
The following table summarizes our contracted storage capacity at September 30, [removed: 2015:][added: 2016:]
| | | Colorado-Kansas Division | | [removed: 4,761,909] [added: 5,261,909] | | | [removed: 113,689] [added: 118,889] | |
| | | Mid-Tex Division | | [removed: 3,250,000] [added: 3,500,000] | | | 175,000 | |
| Total Contracted Storage Capacity | | | | [removed: 39,544,535] [added: 40,294,535] | | | [removed: 1,352,553] [added: 1,357,753] | |
| Total | | | | 30,593,666 | | | 1,039,309 | |
| Total | | | | 29,843,666 | | | 1,034,109 | |
Item 5. Market for Registrant’s Common Equity, Related Stockholder Matters and Issuer Purchases of Equity Securities.
20 rewritten, 12 added, 10 removed, 27 unchanged
Our stock trades on the New York Stock Exchange under the trading symbol “ATO.” The high and low sale prices and dividends paid per share of our common stock for fiscal [removed: 2015] [added: 2016] and [removed: 2014] [added: 2015] are listed below.
| | Fiscal [removed: 2015] [added: 2016] | | | | | | | | | | | | Fiscal [removed: 2014] [added: 2015] | | | | | | | | | | |
| December 31 | $ | [removed: 58.08] [added: 64.25] | | | $ | [removed: 47.35] [added: 57.82] | | | $ | [removed: 0.39] [added: 0.42] | | | $ | [removed: 47.06] [added: 58.08] | | | $ | [removed: 41.08] [added: 47.35] | | | $ | [removed: 0.37] [added: 0.39] | |
| March 31 | [removed: 58.81] [added: 74.33] | | | | [removed: 52.02] [added: 61.74] | | | | [removed: 0.39] [added: 0.42] | | | | [removed: 48.01] [added: 58.81] | | | | [removed: 44.19] [added: 52.02] | | | | [removed: 0.37] [added: 0.39] | | |
| June 30 | [removed: 56.41] [added: 81.32] | | | | [removed: 51.28] [added: 70.60] | | | | [removed: 0.39] [added: 0.42] | | | | [removed: 53.40] [added: 56.41] | | | | [removed: 46.94] [added: 51.28] | | | | [removed: 0.37] [added: 0.39] | | |
| September 30 | [removed: 58.18] [added: 81.16] | | | | [removed: 51.48] [added: 71.88] | | | | [removed: 0.39] [added: 0.42] | | | | [removed: 52.68] [added: 58.18] | | | | [removed: 47.01] [added: 51.48] | | | | [removed: 0.37] [added: 0.39] | | |
The number of record holders of our common stock on October [removed: 30, 2015] [added: 31, 2016] was [removed: 14,881.][added: 14,108.]
We sold no securities during fiscal [removed: 2015] [added: 2016] that were not registered under the Securities Act of 1933, as amended.
The performance graph and table below compares the yearly percentage change in our total return to shareholders for the last five fiscal years with the total return of the [removed: Standard and Poor’s] [added: S&P] 500 Stock Index and the cumulative total return of [removed: two different] [added: a] customized peer company [removed: groups, the New Comparison Company Index and] [added: group,] the [removed: Old] Comparison Company Index.
The [removed: New] Comparison Company Index [removed: includes ONE Gas, Inc., The Laclede Group, Inc. and TECO Energy, Inc. and excludes ONEOK, Inc., National Fuel Gas Company and Integrys Energy Group because the Board of Directors determined that these companies better fit the profile of the companies in our peer group, which] is comprised of natural gas distribution companies with similar revenues, market capitalizations and asset bases to that of the Company.
The graph and table below assume that $100.00 was invested on September 30, [removed: 2010] [added: 2011] in our common stock, the S&P 500 Index and in the common stock of the companies in the [removed: New and Old] Comparison Company [removed: Indexes,] [added: Index,] as well as a reinvestment of dividends paid on such investments throughout the period.
[removed: 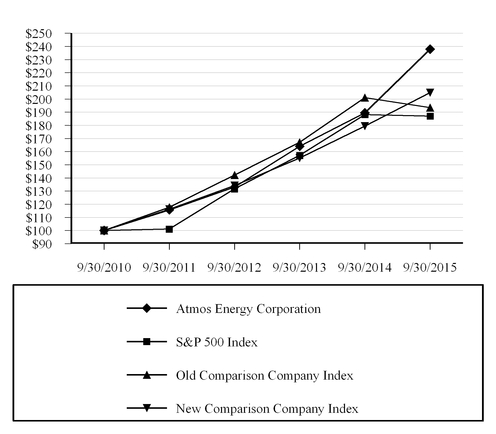][added: 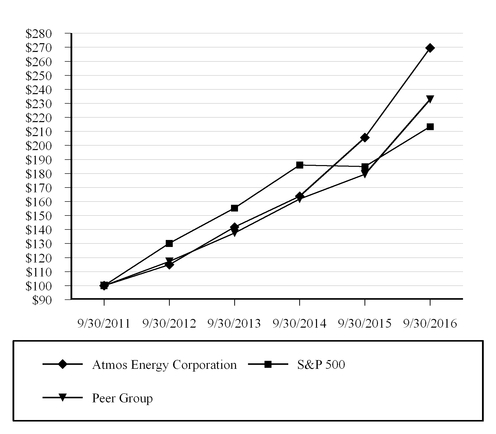]
| | [removed: 9/30/2010 | | |] 9/30/2011 | | | 9/30/2012 | | | 9/30/2013 | | | 9/30/2014 | | | 9/30/2015 | | [added: | 9/30/2016 | |]
The [removed: New] Comparison Company Index reflects the cumulative total return of companies in our peer group, which is comprised of a hybrid group of utility companies, primarily natural gas distribution companies, recommended by our independent executive compensation consulting firm and approved by the Board of Directors.
The companies [removed: included] in [removed: the index] [added: our peer group] are AGL Resources [removed: Inc.,] [added: Inc.(1),] CenterPoint Energy, Inc., CMS Energy Corporation, NiSource Inc., ONE Gas, Inc., Piedmont Natural Gas Company, Inc., Questar [removed: Corporation,] [added: Corporation(1),] TECO Energy, [removed: Inc., The Laclede Group, Inc., Vectren Corporation and WGL Holdings,] [added: Inc.(1), Spire,] Inc. [added: (formerly] The [removed: Old Comparison Company Index includes AGL Resources Inc., CenterPoint Energy Resources Corporation, CMS Energy Corporation, Integrys Energy] [added: Laclede] Group, [removed: Inc., National Fuel Gas, NiSource Inc., ONEOK Inc., Piedmont Natural Gas Company, Inc., Questar Corporation,] [added: Inc.),] Vectren Corporation and WGL Holdings, Inc.
The following table sets forth the number of securities authorized for issuance under our equity compensation plans at September 30, [removed: 2015.][added: 2016.]
| | Number of securities to be issued upon exercise of outstanding options, [added: restricted stock units,] warrants and rights | | | Weighted-average exercise price of outstanding options, warrants and rights | | | | Number of securities remaining available for future issuance under equity compensation plans (excluding securities reflected in column (a)) | |
| 1998 Long-Term Incentive Plan | [removed: —] [added: 1,338,162] | | [added: (1)] | $ | — | | | [removed: 308,582] [added: 2,359,106] | |
| Total equity compensation plans approved by security holders | [removed: —] [added: 1,338,162] | | | — | | | | [removed: 308,582] [added: 2,359,106] | |
We did not repurchase any shares during fiscal [removed: 2015] [added: 2016] under the [removed: program, which is scheduled to end on September 30, 2016.][added: program.]
| | | | | | | | | | $ | 1.68 | | | | | | | | | | | $ | 1.56 | |
| Atmos Energy Corporation | 100.00 | | | 114.96 | | | 141.77 | | | 163.78 | | | 205.60 | | | 269.55 | |
| S&P 500 Index | 100.00 | | | 130.20 | | | 155.39 | | | 186.05 | | | 184.91 | | | 213.44 | |
| Peer Group | 100.00 | | | 117.20 | | | 137.59 | | | 161.70 | | | 179.33 | | | 232.91 | |
| (1) | AGL Resources Inc., Questar Corporation and TECO Energy, Inc. were acquired prior to September 30, 2016. As a result, the cumulative total return of these companies is not included in the Comparison Company Index represented in the graph above. |
| Total | 1,338,162 | | | $ | — | | | 2,359,106 | |
| --- | --- |
| (1) | Comprised of a total of 614,588 time-lapse restricted stock units, 326,249 director share units and 397,325 performance-based restricted stock units at the target level of performance granted under our 1998 Long-Term Incentive Plan. |
The program expired on September 30, 2016 and will not be renewed.
| | |
| --- | --- |
| | |
| | | | | | | | | | $ | 1.56 | | | | | | | | | | | $ | 1.48 | |
| Atmos Energy Corporation | 100.00 | | | 115.72 | | | 133.03 | | | 164.05 | | | 189.51 | | | 237.91 | |
| S&P 500 Index | 100.00 | | | 101.14 | | | 131.69 | | | 157.17 | | | 188.18 | | | 187.02 | |
| Old Comparison Company Index | 100.00 | | | 117.66 | | | 142.22 | | | 167.00 | | | 201.17 | | | 193.52 | |
| New Comparison Company Index | 100.00 | | | 116.24 | | | 134.26 | | | 155.06 | | | 179.39 | | | 204.94 | |
| Total | — | | | $ | — | | | 308,582 | |
The program is primarily intended to minimize the dilutive effect of equity grants under various benefit related incentive compensation plans of the Company.
Although the program is authorized for a five-year period, it may be terminated or limited at any time.
Shares may be repurchased in the open market or in privately negotiated transactions in amounts the Company deems appropriate.
At September 30, 2015, there were 4,612,009 shares of repurchase authority remaining under the program.
Item 6. Selected Financial Data.
12 rewritten, 3 added, 3 removed, 16 unchanged
| | [removed: 2015] [added: 2016] | | | | [removed: 2014] [added: 2015] | | | | [removed: 2013] [added: 2014] | | | | [removed: 2012(1)] [added: 2013] | | | | [removed: 2011(1)] [added: 2012(1)] | | |
| Operating revenues | $ | [removed: 4,142,136] [added: 3,349,949] | | | $ | [removed: 4,940,916] [added: 4,142,136] | | | $ | [removed: 3,875,460] [added: 4,940,916] | | | $ | [removed: 3,436,162] [added: 3,875,460] | | | $ | [removed: 4,286,435] [added: 3,436,162] | |
| Gross profit | $ | [removed: 1,680,017] [added: 1,744,896] | | | $ | [removed: 1,582,426] [added: 1,680,017] | | | $ | [removed: 1,412,050] [added: 1,582,426] | | | $ | [removed: 1,323,739] [added: 1,412,050] | | | $ | [removed: 1,300,820] [added: 1,323,739] | |
| Income from continuing operations | $ | [removed: 315,075] [added: 350,104] | | | $ | [removed: 289,817] [added: 315,075] | | | $ | [removed: 230,698] [added: 289,817] | | | $ | [removed: 192,196] [added: 230,698] | | | $ | [removed: 189,588] [added: 192,196] | |
| Net income | $ | [removed: 315,075] [added: 350,104] | | | $ | [removed: 289,817] [added: 315,075] | | | $ | [removed: 243,194] [added: 289,817] | | | $ | [removed: 216,717] [added: 243,194] | | | $ | [removed: 207,601] [added: 216,717] | |
| Diluted income per share from continuing operations | $ | [removed: 3.09] [added: 3.38] | | | $ | [removed: 2.96] [added: 3.09] | | | $ | [removed: 2.50] [added: 2.96] | | | $ | [removed: 2.10] [added: 2.50] | | | $ | [removed: 2.07] [added: 2.10] | |
| Diluted net income per share | $ | [removed: 3.09] [added: 3.38] | | | $ | [removed: 2.96] [added: 3.09] | | | $ | [removed: 2.64] [added: 2.96] | | | $ | [removed: 2.37] [added: 2.64] | | | $ | [removed: 2.27] [added: 2.37] | |
| Cash dividends declared per share | $ | [removed: 1.56] [added: 1.68] | | | $ | [removed: 1.48] [added: 1.56] | | | $ | [removed: 1.40] [added: 1.48] | | | $ | [removed: 1.38] [added: 1.40] | | | $ | [removed: 1.36] [added: 1.38] | |
| Net property, plant and equipment(2) | $ | [removed: 7,430,580] [added: 8,280,511] | | | $ | [removed: 6,725,906] [added: 7,430,580] | | | $ | [removed: 6,030,655] [added: 6,725,906] | | | $ | [removed: 5,475,604] [added: 6,030,655] | | | $ | [removed: 5,147,918] [added: 5,475,604] | |
| Shareholders’ equity | $ | [removed: 3,194,797] [added: 3,463,059] | | | $ | [removed: 3,086,232] [added: 3,194,797] | | | $ | [removed: 2,580,409] [added: 3,086,232] | | | $ | [removed: 2,359,243] [added: 2,580,409] | | | $ | [removed: 2,255,421] [added: 2,359,243] | |
| (1) | Financial results for fiscal [removed: years] 2012 [removed: and 2011] reflect a $5.3 million [removed: and a $30.3 million] pre-tax loss for the impairment of certain assets. |
| (2) | Amounts shown for fiscal 2012 [removed: and 2011] are net of assets held for sale. |
| Total assets | $ | 10,010,889 | | | $ | 9,075,072 | | | $ | 8,581,006 | | | $ | 7,919,069 | | | $ | 7,484,518 | |
| Long-term debt (excluding current maturities) | 2,188,779 | | | | 2,437,515 | | | | 2,442,288 | | | | 2,440,472 | | | | 1,945,148 | | |
| Total capitalization | $ | 5,651,838 | | | $ | 5,632,312 | | | $ | 5,528,520 | | | $ | 5,020,881 | | | $ | 4,304,391 | |
| Total assets | $ | 9,092,945 | | | $ | 8,594,704 | | | $ | 7,934,268 | | | $ | 7,495,675 | | | $ | 7,282,871 | |
| Long-term debt (excluding current maturities) | 2,455,388 | | | | 2,455,986 | | | | 2,455,671 | | | | 1,956,305 | | | | 2,206,117 | | |
| Total capitalization | $ | 5,650,185 | | | $ | 5,542,218 | | | $ | 5,036,080 | | | $ | 4,315,548 | | | $ | 4,461,538 | |
Item 8. Financial Statements and Supplementary Data.
536 rewritten, 314 added, 263 removed, 1,251 unchanged
| [Report of independent registered public accounting [removed: firm](#s4E5961B7C0001E110BED651250F73E28)] [added: firm](#sB9AA3BA755205CF084D3199D3CBBE432)] | [removed: [44](#s4E5961B7C0001E110BED651250F73E28)] [added: [45](#sB9AA3BA755205CF084D3199D3CBBE432)] |
| Consolidated balance sheets at September 30, [removed: 2015] [added: 2016] and [removed: 2014] [added: 2015] | [removed: [45](#sB9011621B123970392A26511FED61A0C)] [added: [46](#s8ECE97B1DD0C5D2AAF2E89F50D25FFB2)] |
| Consolidated statements of income for the years ended September 30, [removed: 2015, 2014] [added: 2016, 2015] and [removed: 2013] [added: 2014] | [removed: [46](#s662497B4A23EB38F8F8D6511FEE6EDBB)] [added: [47](#s8576A038216D5DABBC4EFCAA8F4C4469)] |
| Consolidated statements of comprehensive income for the years ended September 30, [removed: 2015, 2014] [added: 2016, 2015] and [removed: 2013] [added: 2014] | [removed: [47](#s42DDA887756DDDE2637B6511FF05F59E)] [added: [48](#s09F35AF3A9035800943C1905E5024C7E)] |
| Consolidated statements of shareholders' equity for the years ended September 30, [removed: 2015, 2014] [added: 2016, 2015] and [removed: 2013] [added: 2014] | [removed: [48](#s968910CA6251868F907B6511FF15FE0C)] [added: [49](#s679D7004E6585B5095B7DE8C2BF9E727)] |
| Consolidated statements of cash flow for the years ended September 30, [removed: 2015, 2014] [added: 2016, 2015] and [removed: 2013] [added: 2014] | [removed: [49](#sF50C5371D98722DC36E86511FF44F8F3)] [added: [50](#s47E022F085AF5673A3779797EDE097FC)] |
| [Notes to consolidated financial [removed: statements](#s5DA06CF8A451E677E8476512527A5E80)] [added: statements](#s47F041E7A5955B60B2FB01AC3C9EAEBE)] | [removed: [50](#s5DA06CF8A451E677E8476512527A5E80)] [added: [51](#s47F041E7A5955B60B2FB01AC3C9EAEBE)] |
| [Selected Quarterly Financial Data [removed: (Unaudited)](#s9651504860747E641FFF6512050E7FDF)] [added: (Unaudited)](#sFF7E8EA5A9B05C15844589D9520D720A)] | [removed: [96](#s9651504860747E641FFF6512050E7FDF)] [added: [97](#sFF7E8EA5A9B05C15844589D9520D720A)] |
| Financial statement schedule for the years ended September 30, [removed: 2015, 2014] [added: 2016, 2015] and [removed: 2013] [added: 2014] | |
| [Schedule II. Valuation and Qualifying [removed: Accounts](#sE9993A4FB6502476B5D7651258D75EA3)] [added: Accounts](#s3F9CFA6F420F589DB72B03C32210CFC4)] | [removed: [103](#s151261AE4448C3EC58A16512056B0741)] [added: [105](#sD30CF6D626E5513DB4A3E328F3B37D60)] |
We have audited the accompanying consolidated balance sheets of Atmos Energy Corporation as of September 30, [removed: 2015] [added: 2016] and [removed: 2014,] [added: 2015,] and the related consolidated statements of income, comprehensive income, shareholders’ equity, and cash flows for each of the three years in the period ended September 30, [removed: 2015.][added: 2016.]
In our opinion, the financial statements referred to above present fairly, in all material respects, the consolidated financial position of Atmos Energy Corporation at September 30, [removed: 2015] [added: 2016] and [removed: 2014,] [added: 2015,] and the consolidated results of its operations and its cash flows for each of the three years in the period ended September 30, [removed: 2015,] [added: 2016,] in conformity with U.S. generally accepted accounting principles.
We also have audited, in accordance with the standards of the Public Company Accounting Oversight Board (United States), Atmos Energy Corporation’s internal control over financial reporting as of September 30, [removed: 2015,] [added: 2016,] based on criteria established in Internal Control — Integrated Framework issued by the Committee of Sponsoring Organizations of the Treadway Commission (2013 framework) and our report dated November [removed: 6, 2015] [added: 14, 2016] expressed an unqualified opinion thereon.
| | [added: 2016 | | | |] 2015 | | | | 2014 | | |
| Property, plant and equipment | $ | [removed: 8,959,702] [added: 9,987,078] | | | $ | [removed: 8,200,121] [added: 8,959,702] | |
| Construction in progress | [removed: 280,398] [added: 184,062] | | | | [removed: 247,579] [added: 280,398] | | |
| Less accumulated depreciation and amortization | [removed: 1,809,520] [added: 1,890,629] | | | | [removed: 1,721,794] [added: 1,809,520] | | |
| Net property, plant and equipment | [removed: 7,430,580] [added: 8,280,511] | | | | [removed: 6,725,906] [added: 7,430,580] | | |
| Cash and cash equivalents | [removed: 28,653] [added: 47,534] | | | | [removed: 42,258] [added: 28,653] | | |
| Accounts receivable, less allowance for doubtful accounts of [removed: $15,283] [added: $13,367] in [removed: 2015] [added: 2016] and [removed: $23,992] [added: $15,283] in [removed: 2014] [added: 2015] | [removed: 295,160] [added: 300,007] | | | | [removed: 343,400] [added: 295,160] | | |
| Gas stored underground | [removed: 236,603] [added: 233,316] | | | | [removed: 278,917] [added: 236,603] | | |
| Other current assets | [removed: 70,569 | | | | 111,265] [added: 13,000] | | |
| Goodwill | [removed: 742,702] [added: 743,407] | | | | [removed: 742,029] [added: 742,702] | | |
| Deferred charges and other assets | [removed: 288,678 | | | | 350,929] [added: 300] | | |
| Common stock, no par value (stated at $.005 per share); 200,000,000 shares authorized; issued and outstanding: [removed: 2015] [added: 2016] — [removed: 101,478,818] [added: 103,930,560] shares, [removed: 2014] [added: 2015] — [removed: 100,388,092] [added: 101,478,818] shares | $ | [removed: 507] [added: 520] | | | $ | [removed: 502] [added: 507] | |
| Additional paid-in capital | [removed: 2,230,591] [added: 2,388,027] | | | | [removed: 2,180,151] [added: 2,230,591] | | |
| Accumulated other comprehensive loss | [removed: (109,330] [added: (188,022] | | ) | | [removed: (12,393] [added: (109,330] | | ) |
| Retained earnings | [removed: 1,073,029] [added: 1,262,534] | | | | [removed: 917,972] [added: 1,073,029] | | |
| Shareholders’ equity | [removed: 3,194,797] [added: 3,463,059] | | | | [removed: 3,086,232] [added: 3,194,797] | | |
| Accounts payable and accrued liabilities | [removed: 238,942] [added: 259,434] | | | | [removed: 308,086] [added: 238,942] | | |
| Other current liabilities | [removed: 457,954] [added: 449,036] | | | | [removed: 405,869] [added: 457,954] | | |
| Short-term debt | [removed: 457,927] [added: 829,811] | | | | [removed: 196,695] [added: 457,927] | | |
| Total current liabilities | [removed: 1,154,823] [added: 1,788,281] | | | | [removed: 910,650] [added: 1,154,823] | | |
| Deferred income taxes | [removed: 1,411,315] [added: 1,603,056] | | | | [removed: 1,286,616] [added: 1,411,315] | | |
| Regulatory cost of removal obligation | [removed: 427,553] [added: 424,281] | | | | [removed: 445,387] [added: 427,553] | | |
| Pension and postretirement liabilities | [removed: 287,373] [added: 297,743] | | | | [removed: 340,963] [added: 287,373] | | |
| Deferred credits and other liabilities | [removed: 161,696] [added: 245,690] | | | | [removed: 68,870] [added: 161,696] | | |
| | [removed: 2015] [added: 2016] | | | | [removed: 2014] [added: 2015] | | | | [removed: 2013] [added: 2014] | | |
| Regulated distribution segment | $ | [removed: 2,763,835] [added: 2,291,866] | | | $ | [removed: 3,061,546] [added: 2,763,835] | | | $ | [removed: 2,399,493] [added: 3,061,546] | |
| Regulated pipeline segment | [removed: 370,112] [added: 408,833] | | | | [removed: 318,459] [added: 370,112] | | | | [removed: 268,900] [added: 318,459] | | |
| | 2016 | | | | 2015 | | |
| | 10,171,140 | | | | 9,240,100 | | |
| Other current assets | 100,829 | | | | 65,890 | | |
| Total current assets | 681,686 | | | | 626,306 | | |
| Deferred charges and other assets | 305,285 | | | | 275,484 | | |
| | $ | 10,010,889 | | | $ | 9,075,072 | |
| Long-term debt | 2,188,779 | | | | 2,437,515 | | |
| Total capitalization | 5,651,838 | | | | 5,632,312 | | |
| Current maturities of long-term debt | 250,000 | | | | — | | |
| | $ | 10,010,889 | | | $ | 9,075,072 | |
| Net income | $ | 350,104 | | | $ | 315,075 | | | $ | 289,817 | |
| Net income | — | | | — | | | | — | | | | — | | | | 350,104 | | | | 350,104 | | |
| Other comprehensive loss | — | | | — | | | | — | | | | (78,692 | | ) | | — | | | | (78,692 | | ) |
| Cumulative effect of accounting change | — | | | — | | | | — | | | | — | | | | 14,527 | | | | 14,527 | | |
| Public offering | 1,360,756 | | | 7 | | | | 98,567 | | | | — | | | | — | | | | 98,574 | | |
| Retirement savings plan | 359,414 | | | 2 | | | | 25,047 | | | | — | | | | — | | | | 25,049 | | |
| 1998 Long-term incentive plan | 598,439 | | | 3 | | | | 3,175 | | | | — | | | | — | | | | 3,178 | | |
| Balance, September 30, 2016 | 103,930,560 | | | $ | 520 | | | $ | 2,388,027 | | | $ | (188,022 | ) | | $ | 1,262,534 | | | $ | 3,463,059 | |
| Net income | $ | 350,104 | | | $ | 315,075 | | | $ | 289,817 | |
| Stock-based compensation | 14,760 | | | | 15,980 | | | | 14,721 | | |
| Other | 1,019 | | | | 359 | | | | 541 | | |
| Net cash provided by operating activities | 794,990 | | | | 811,914 | | | | 732,813 | | |
| Capital expenditures | (1,086,950 | | ) | | (963,621 | | ) | | (824,441 | | ) |
| Purchases of available-for-sale securities | (32,551 | | ) | | (29,527 | | ) | | (32,734 | | ) |
| Proceeds from sale of available-for-sale securities | 27,019 | | | | 24,889 | | | | 24,872 | | |
| Maturities of available-for-sale securities | 6,290 | | | | 6,235 | | | | 5,215 | | |
| Other, net | 6,460 | | | | 5,422 | | | | 2,109 | | |
| Net cash used in investing activities | (1,079,732 | | ) | | (956,602 | | ) | | (824,979 | | ) |
| Net increase (decrease) in short-term debt | 371,884 | | | | 261,232 | | | | (171,289 | | ) |
| Settlement of interest rate agreements | — | | | | 13,364 | | | | — | | |
| Interest rate agreements cash collateral | (25,670 | | ) | | — | | | | — | | |
| Other | (317 | | ) | | (5,522 | | ) | | — | | |
| Net cash provided by financing activities | 303,623 | | | | 131,083 | | | | 68,225 | | |
Basis of comparison — As described under Recent Accounting Pronouncements below, we reclassified debt issuance costs from deferred charges and other assets to long-term debt.
Additionally, we recorded immaterial corrections to the presentation of certain activities on our Consolidated Statement of Cash Flows for the years ended September 30, 2015 and 2014.
| | 2016 | | | | 2015 | | |
| Deferred pipeline record collection costs | 7,336 | | | | 3,118 | | |
| Other | 13,565 | | | | 6,656 | | |
| | $ | 263,623 | | | $ | 192,339 | |
| | $ | 514,725 | | | $ | 524,532 | |
November 6, 2015
| | 9,240,100 | | | | 8,447,700 | | |
| Total current assets | 630,985 | | | | 775,840 | | |
| | $ | 9,092,945 | | | $ | 8,594,704 | |
| Long-term debt | 2,455,388 | | | | 2,455,986 | | |
| Total capitalization | 5,650,185 | | | | 5,542,218 | | |
| Income from continuing operations | 315,075 | | | | 289,817 | | | | 230,698 | | |
| Income from discontinued operations, net of tax ($0, $0 and $3,986) | — | | | | — | | | | 7,202 | | |
| Gain on sale of discontinued operations, net of tax ($0, $0 and $2,909) | — | | | | — | | | | 5,294 | | |
| Income per share from discontinued operations | — | | | | — | | | | 0.14 | | |
| Balance, September 30, 2012 | 90,239,900 | | | $ | 451 | | | $ | 1,745,467 | | | $ | (47,607 | ) | | $ | 660,932 | | | $ | 2,359,243 | |
| Net income | — | | | — | | | | — | | | | — | | | | 243,194 | | | | 243,194 | | |
| Repurchase of equity awards | (133,449 | ) | | — | | | | (5,150 | | ) | | — | | | | — | | | | (5,150 | | ) |
| Outside directors stock-for-fee plan | 2,088 | | | — | | | | 80 | | | | — | | | | — | | | | 80 | | |
| Gain on sale of discontinued operations | — | | | | — | | | | (8,203 | | ) |
| Depreciation and amortization: | | | | | | | | | | | |
| Charged to other accounts | 1,209 | | | | 969 | | | | 679 | | |
| Stock-based compensation | 27,491 | | | | 25,531 | | | | 17,814 | | |
| Other | (850 | | ) | | (428 | | ) | | (2,887 | | ) |
| Net cash provided by operating activities | 836,519 | | | | 739,986 | | | | 613,127 | | |
| Capital expenditures | (975,132 | | ) | | (835,251 | | ) | | (845,033 | | ) |
| Proceeds from the sale of discontinued operations | — | | | | — | | | | 153,023 | | |
| Other, net | 377 | | | | (2,325 | | ) | | (4,904 | | ) |
| Net cash used in investing activities | (974,755 | | ) | | (837,576 | | ) | | (696,914 | | ) |
| Net increase (decrease) in short-term debt | 254,780 | | | | (165,865 | | ) | | (208,070 | | ) |
| Settlement of Treasury lock agreements | 13,364 | | | | — | | | | (66,626 | | ) |
| Net cash provided by financing activities | 124,631 | | | | 73,649 | | | | 85,747 | | |
During fiscal 2013 and fiscal 2012, we sold our regulated distribution operations serving approximately 148,000 customers in Georgia, Illinois, Iowa and Missouri.
Basis of comparison — Certain prior-year amounts have been reclassified to conform with the current year presentation.
| Other | 9,774 | | | | 9,402 | | |
| | $ | 192,339 | | | $ | 250,309 | |
| Deferred franchise fees | — | | | | 5,268 | | |
| | $ | 524,532 | | | $ | 545,759 | |
of the asset is less than the carrying value of the asset, an impairment loss equal to the excess of the asset’s carrying value over its fair value is recorded.
referred to as timing ineffectiveness.
observable market data.
We utilize models and other valuation methods to determine fair value when external sources are not available.
We believe the market prices and models used to value these assets and liabilities represent the best information available with respect to closing exchange and over-the-counter quotations, time value and volatility factors underlying the assets and liabilities.
On July 9, 2015, the FASB voted to approve a deferral of the effective date of the new standard by one year.
| Capital expenditures | $ | 680,961 | | | $ | 292,728 | | | $ | 1,443 | | | $ | — | | | $ | 975,132 | |
An excerpt. Shown here: 40 of 536 rewritten, 40 of 314 added and 40 of 263 removed. The counts are complete. For every sentence, read Item 8. Financial Statements and Supplementary Data. in the FY2016 filing and the FY2015 filing.
Item 9A. Controls and Procedures.
6 rewritten, 2 added, 2 removed, 33 unchanged
Based on this evaluation, the Company’s principal executive officer and principal financial officer have concluded that the Company’s disclosure controls and procedures were effective as of September 30, [removed: 2015] [added: 2016] to provide reasonable assurance that information required to be disclosed by us, including our consolidated entities, in the reports that we file or submit under the Exchange Act is recorded, processed, summarized, and reported within the time periods specified by the SEC’s rules and forms, including a reasonable level of assurance that such information is accumulated and communicated to our management, including our principal executive and principal financial officers, as appropriate to allow timely decisions regarding required disclosure.
Based on our evaluation under the framework in Internal Control-Integrated Framework issued by COSO and applicable Securities and Exchange Commission rules, our management concluded that our internal control over financial reporting was effective as of September 30, [removed: 2015,] [added: 2016,] in providing reasonable assurance regarding the reliability of financial reporting and the preparation of financial statements for external purposes in accordance with generally accepted accounting principles.
We have audited Atmos Energy Corporation’s internal control over financial reporting as of September 30, [removed: 2015,] [added: 2016,] based on criteria established in Internal Control — Integrated Framework issued by the Committee of Sponsoring Organizations of the Treadway Commission (2013 framework) (the COSO criteria).
In our opinion, Atmos Energy Corporation maintained, in all material respects, effective internal control over financial reporting as of September 30, [removed: 2015,] [added: 2016,] based on the COSO criteria.
We also have audited, in accordance with the standards of the Public Company Accounting Oversight Board (United States), the consolidated balance sheets as of September 30, [removed: 2015] [added: 2016] and [removed: 2014,] [added: 2015,] and the related consolidated statements of income, comprehensive income, shareholders’ equity, and cash flows for each of the three years in the period ended September 30, [removed: 2015] [added: 2016] of Atmos Energy Corporation and our report dated November [removed: 6, 2015] [added: 14, 2016] expressed an unqualified opinion thereon.
We did not make any changes in our internal control over financial reporting (as defined in Rule 13a-15(f) and 15d-15(f) under the Act) during the fourth quarter of the fiscal year ended September 30, [removed: 2015] [added: 2016] that have materially affected, or are reasonably likely to materially affect, our internal control over financial reporting.
| November 14, 2016 | | |
November 14, 2016
| November 6, 2015 | | |
November 6, 2015
Item 10. Directors, Executive Officers and Corporate Governance.
8 rewritten, 8 added, 3 removed, 30 unchanged
Information regarding directors and compliance with Section 16(a) of the Securities Exchange Act of 1934 is incorporated herein by reference to the Company’s Definitive Proxy Statement for the Annual Meeting of Shareholders on February [removed: 3, 2016.][added: 8, 2017.]
The following table sets forth certain information as of September 30, [removed: 2015,] [added: 2016,] regarding the executive officers of the Company.
| Kim R. Cocklin | [removed: 64] [added: 65] | | [removed: 9] [added: 10] | | [removed: President,] Chief Executive Officer and Director |
| Bret J. Eckert | [removed: 48] [added: 49] | | [removed: 3] [added: 4] | | Senior Vice President and Chief Financial Officer |
| Marvin L. Sweetin | [removed: 52] [added: 53] | | [removed: 15] [added: 16] | | Senior Vice President, [removed: Utility Operations] [added: Safety and Enterprise Services] |
| Louis P. Gregory | [removed: 60] [added: 61] | | [removed: 15] [added: 16] | | Senior Vice President, General Counsel and Corporate Secretary |
Cocklin was named President and [removed: designated as the] Chief Executive Officer effective October 1, [removed: 2010.][added: 2010, and Chief Executive Officer of the Company on October 1, 2015.]
Identification of the members of the Audit Committee of the Board of Directors as well as the Board of Directors’ determination as to whether one or more audit committee financial experts are serving on the Audit Committee of the Board of [added: Directors is incorporated herein by reference to the Company’s Definitive Proxy Statement for the Annual Meeting of Shareholders on February 8, 2017.]
| Michael E. Haefner | 56 | | 8 | | President and Chief Operating Officer and Director |
Mr. Haefner was appointed to the Board of Directors on November 4, 2015.
On November 3, 2016, Mr. Sweetin notified the Board of Directors of his retirement from the Company effective December 31, 2016.
David J.
Park was named Senior Vice President of Utility Operations on October 28, 2016, effective January 1, 2017.
In this role, Mr. Park will be responsible for the operations of Atmos Energy’s six utility divisions as well as gas supply.
Prior to this promotion, Mr. Park served as the President of the West Texas Division.
Mr. Park has also served as Vice President of Rates and Regulatory Affairs in the Mid-Tex Division and previously held positions in Engineering and Public Affairs.
| Michael E. Haefner | 55 | | 7 | | Executive Vice President |
On October 1, 2015, Mr. Cocklin was appointed to the newly-created position of Chief Executive Officer of the Company.
Directors is incorporated herein by reference to the Company’s Definitive Proxy Statement for the Annual Meeting of Shareholders on February 3, 2016.
Item 11. Executive Compensation.
1 rewritten, 0 added, 0 removed, 3 unchanged
Information on executive compensation is incorporated herein by reference to the Company’s Definitive Proxy Statement for the Annual Meeting of Shareholders on February [removed: 3, 2016.][added: 8, 2017.]
Item 12. Security Ownership of Certain Beneficial Owners and Management and Related Stockholder Matters.
1 rewritten, 0 added, 0 removed, 4 unchanged
Security ownership of certain beneficial owners and of management is incorporated herein by reference to the Company’s Definitive Proxy Statement for the Annual Meeting of Shareholders on February [removed: 3, 2016.][added: 8, 2017.]
Item 13. Certain Relationships and Related Transactions, and Director Independence.
2 rewritten, 0 added, 0 removed, 9 unchanged
Information on certain relationships and related transactions as well as director independence is incorporated herein by reference to the Company’s Definitive Proxy Statement for the Annual Meeting of Shareholders on February [removed: 3, 2016.][added: 8, 2017.]
Information on our principal accountant’s fees and services is incorporated herein by reference to the Company’s Definitive Proxy Statement for the Annual Meeting of Shareholders on February [removed: 3, 2016.][added: 8, 2017.]
Item 15. Exhibits and Financial Statement Schedules.
17 rewritten, 8 added, 2 removed, 69 unchanged
The exhibits numbered 10.3(a) through [removed: 10.12(c)] [added: 10.12] are management contracts or compensatory plans or arrangements.
Date: November [removed: 6, 2015][added: 14, 2016]
| /s/ KIM R. COCKLIN | | Chief Executive Officer and Director | | November [removed: 6, 2015] [added: 14, 2016] |
| /s/ MICHAEL E. HAEFNER | | President, Chief Operating Officer and Director | | November [removed: 6, 2015] [added: 14, 2016] |
| /s/ BRET J. ECKERT | | Senior Vice President and Chief Financial Officer | | November [removed: 6, 2015] [added: 14, 2016] |
| /s/ CHRISTOPHER T. FORSYTHE | | Vice President and Controller (Principal Accounting Officer) | | November [removed: 6, 2015] [added: 14, 2016] |
| /s/ ROBERT W. BEST | | Chairman of the Board | | November [removed: 6, 2015] [added: 14, 2016] |
| /s/ RICHARD W. DOUGLAS | | Director | | November [removed: 6, 2015] [added: 14, 2016] |
| /s/ RUBEN E. ESQUIVEL | | Director | | November [removed: 6, 2015] [added: 14, 2016] |
| /s/ RICHARD K. GORDON | | Director | | November [removed: 6, 2015] [added: 14, 2016] |
| /s/ ROBERT C. GRABLE | | Director | | November [removed: 6, 2015] [added: 14, 2016] |
| /s/ THOMAS C. MEREDITH | | Director | | November [removed: 6, 2015] [added: 14, 2016] |
| /s/ NANCY K. QUINN | | Director | | November [removed: 6, 2015] [added: 14, 2016] |
| /s/ RICHARD A. SAMPSON | | Director | | November [removed: 6, 2015] [added: 14, 2016] |
| /s/ STEPHEN R. SPRINGER | | Director | | November [removed: 6, 2015] [added: 14, 2016] |
| /s/ RICHARD WARE II | | Director | | November [removed: 6, 2015] [added: 14, 2016] |
Three Years Ended September 30, [removed: 2015][added: 2016]
| /s/ KELLY H. COMPTON | | Director | | November 14, 2016 |
| Kelly H. Compton | | | | |
| /s/ RAFAEL G. GARZA | | Director | | November 14, 2016 |
| Rafael G. Garza | | | | |
| | | | | |
| | | | | |
| 2016 | | | | | | | | | | | | | | | | | | | | |
| Allowance for doubtful accounts | $ | 15,283 | | | $ | 10,397 | | | $ | — | | | $ | 12,313 | | (1) | | $ | 13,367 | |
| 2013 | | | | | | | | | | | | | | | | | | | | |
| Allowance for doubtful accounts | $ | 9,425 | | | $ | 14,484 | | | $ | — | | | $ | 3,285 | | (1) | | $ | 20,624 | |
Item 14. (a)(3)
9 rewritten, 4 added, 4 removed, 60 unchanged
| 2.1 | | [removed: Asset] [added: Membership Interest] Purchase Agreement by and between Atmos Energy [removed: Corporation] [added: Holdings, Inc.] as Seller and [removed: Liberty] [added: CenterPoint] Energy [removed: (Georgia) Corp.] [added: Services, Inc.] as Buyer, dated as of [removed: August 8, 2012] [added: October 29 2016] | | Exhibit 2.1 to Form 8-K dated [removed: August 8, 2012] [added: October 29, 2016] (File No. 1-10042) |
| [removed: 10.1] [added: 10.1(a)] | | Revolving Credit Agreement, dated as of September 25, 2015 among Atmos Energy Corporation, the Lenders from time to time parties thereto, Crédit Agricole Corporate and Investment Bank as Administrative Agent, and Mizuho Bank Ltd., as Syndication Agent | | Exhibit 10.1 to Form 8-K dated October 1, 2015 (File No. 1-10042) |
| [removed: 10.5(a)*] [added: 10.12*] | | Atmos Energy Corporation [removed: Annual Incentive Plan for Management (as amended] [added: Outside Directors Stock-for-Fee Plan, Amended] and [removed: restated February 10, 2011)] [added: Restated as of October 1, 2009] | | Exhibit [removed: 10.14] [added: 10.13] to Form 10-K for fiscal year ended September 30, [removed: 2011] [added: 2010] (File No. 1-10042) |
| [removed: 10.5(b)*] [added: 10.5*] | | [removed: Amendment No 1 to the] Atmos Energy Corporation Annual Incentive Plan for Management (as amended and restated [removed: February 10, 2011)] [added: October 1, 2016)] | | [removed: Exhibit 10.8(b) to Form 10-K for fiscal year ended September 30, 2012 (File No. 1-10042)] |
| 10.7(a)* | | Atmos Energy Corporation Supplemental Executive Retirement Plan (As Amended and Restated, Effective as of [removed: June 4, 2012)] [added: January 1, 2016)] | | |
| [removed: 10.12(a)*] [added: 10.11(a)*] | | Atmos Energy Corporation 1998 Long-Term Incentive Plan (as amended and restated [removed: September 1, 2014)] [added: February 3, 2016)] | | Exhibit [removed: 10.13(a)] [added: 99.1] to Form [removed: 10-K for fiscal year ended September 30, 2014] [added: S-8 dated March 29, 2016] (File No. [removed: 1-10042)] [added: 333-210461)] |
| [removed: 10.12(b)*] [added: 10.11(b)*] | | Form of Award Agreement of Time-Lapse Restricted Stock Units under the Atmos Energy Corporation 1998 Long-Term Incentive Plan | | |
| [removed: 10.12(c)*] [added: 10.11(c)*] | | Form of Award Agreement of Performance-Based Restricted Stock Units under the Atmos Energy Corporation 1998 Long-Term Incentive Plan | | |
| 24 | | Power of Attorney | | Signature page of Form 10-K for fiscal year ended September 30, [removed: 2015] [added: 2016] |
| 10.1(b) | | First Amendment to Revolving Credit Agreement, dated as of October 5, 2016, by and among Atmos Energy Corporation, the lenders from time to time parties thereto (the "Lenders") and Credit Agricole Corporate and Investment Bank, in its capacity as administrative agent for the Lenders | | Exhibit 10.1 to Form 8-K dated October 5, 2016 (File No. 1-10042) |
| 10.1(c) | | Term Loan Agreement, dated as of September 22, 2016, by and among Atmos Energy Corporation, the Lenders from time to time parties thereto and Branch Banking and Trust Company as Administrative Agent | | Exhibit 10.1 to Form 8-K dated September 22, 2016 (File No. 1-10042) |
| 10.2 | | Equity Distribution Agreement, dated as of March 28, 2016, among Atmos Energy Corporation, Goldman, Sachs & Co., Merrill Lynch, Pierce, Fenner & Smith Incorporated and Morgan Stanley & Co. LLC. | | Exhibit 1.1 to Form 8-K dated March 28, 2016 (File No. 1-10042) |
| 10.8* | | Atmos Energy Corporation Account Balance Supplemental Executive Retirement Plan (As Amended and Restated, Effective as of January 1, 2016) | | |
| 10.2 | | Guaranty of Algonquin Power & Utilities Corp. dated August 8, 2012 | | Exhibit 10.1 to Form 8-K dated August 8, 2012 (File No. 1-10042) |
| 10.5(c)* | | Amendment No 2 to the Atmos Energy Corporation Annual Incentive Plan for Management (as amended and restated February 10, 2011) | | Exhibit 10.6(c) to Form 10-K for fiscal year ended September 30, 2013 (File No. 1-10042) |
| 10.8* | | Atmos Energy Corporation Account Balance Supplemental Executive Retirement Plan, Effective Date August 5, 2009 | | Exhibit 10.10(c) to Form 10-K for fiscal year ended September 30, 2010 (File No. 1-10042) |
| 10.11* | | Atmos Energy Corporation Outside Directors Stock-for-Fee Plan, Amended and Restated as of October 1, 2009 | | Exhibit 10.13 to Form 10-K for fiscal year ended September 30, 2010 (File No. 1-10042) |