 filings.tools
Item 5. MARKET FOR THE REGISTRANT’S COMMON EQUITY, RELATED STOCKHOLDER MATTERS AND ISSUER SALE AND PURCHASES OF EQUITY SECURITIES
7K characters. Original on sec.gov · Markdown
Item 5. MARKET FOR THE REGISTRANT’S COMMON EQUITY, RELATED STOCKHOLDER MATTERS AND ISSUER SALE AND PURCHASES OF EQUITY SECURITIES
Market Information
Broadcom common stock is listed on The Nasdaq Global Select Market under the symbol “AVGO”.
Holders
As of November 30, 2018, there were 645 holders of record of our common stock. A substantially greater number of stockholders are “street name” or beneficial holders, whose shares are held of record by banks, brokers and other financial institutions.
Dividends and Distributions
On December 6, 2018, we announced that our Board of Directors has declared a quarterly cash dividend of $2.65 per share, payable on December 28, 2018 to stockholders of record on December 19, 2018. Broadcom paid aggregate cash dividends and distributions of $2,998 million and $1,745 million in fiscal years 2018 and 2017, respectively.
Our Board reviews our dividend policy annually targeting a projected quarterly per share dividend amount for the full fiscal year, based on an assessment of our last fiscal year free cash flow (cash flows provided by operating activities less purchases of property, plant and equipment). However, the declaration and payment of any future cash dividends are at the discretion and approval of our Board and subject to our Board’s continuing determination that they are in our best interests. Future dividend payments will also depend upon factors such as our free cash flow, earnings level, capital requirements, contractual restrictions, cash position, overall financial condition and any other factors deemed relevant by our Board.
The payment of cash dividends on our common stock is subject to compliance with Delaware General Corporate Law. Also, because we are a holding company, our ability to pay cash dividends on our common stock may be limited by restrictions on our ability to obtain sufficient funds through dividends from subsidiaries, including restrictions under the terms of agreements governing our indebtedness.
Issuer Purchases of Equity Securities
In April 2018, our Board of Directors authorized the repurchase of up to $12 billion of our common stock from time to time on or prior to November 3, 2019, the end of our fiscal year 2019. On December 5, 2018, our Board of Directors increased our stock repurchase program authorization by $6 billion.
The following table presents details of our various repurchases during the fiscal quarter ended November 4, 2018:
| Period | Total Number of Shares Purchased | Average Price per Share | Total Number of Shares Purchased as Part of Publicly Announced Plan | Approximate Dollar Value of Shares That May Yet Be Purchased Under the Plan | ||||||||||
| (In millions, except per share data) | ||||||||||||||
| August 6, 2018 — September 2, 2018 | — | $ | — | — | $ | 6,275 | ||||||||
| September 3, 2018 — September 30, 2018 | 2 | $ | 240.84 | 2 | $ | 5,807 | ||||||||
| October 1, 2018 — November 4, 2018 | 4 | $ | 238.14 | 4 | $ | 4,742 | ||||||||
| Total | 6 | $ | 238.96 | 6 |
Repurchases under our stock repurchase program may be effected through a variety of methods, including open market or privately negotiated purchases in compliance with Rule 10b-18 promulgated under the Exchange Act, which may include purchases under plans complying with Rule 10b5-1 of the Exchange Act. The timing and number of shares of common stock repurchased will depend on a variety of factors, including price, general business and market conditions and alternative investment opportunities. We are not obligated to repurchase any specific number of shares of common stock, and we may suspend or discontinue our stock repurchase program at any time.
Stock Performance Graph
The following graph shows a comparison of cumulative total return for our common stock, the Standard & Poor’s 500 Stock Index, or S&P 500 Index, and the Philadelphia Semiconductor Index, or PHLX Semiconductor Index for the five fiscal years ended November 4, 2018. The total return graph and table assume that $100 was invested on November 1, 2013 (the last trading day of our fiscal year 2013) in each of Broadcom Inc. common stock, the S&P 500 Index and the PHLX Semiconductor Index and assume all dividends are reinvested. Indexes are calculated on a month-end basis.
The comparisons in the graph below are based on historical data and are not indicative of, or intended to forecast, the possible future performance of our common stock.
Comparison of Five Year Cumulative Total Return
Among Broadcom Inc., the S&P 500 Index and the PHLX Semiconductor Index
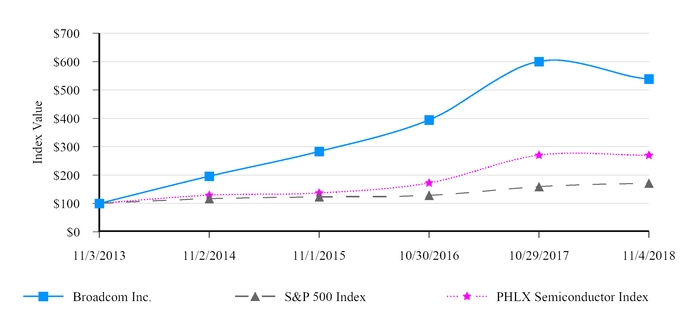
| November 3, 2013 | November 2, 2014 | November 1, 2015 | October 30, 2016 | October 29, 2017 | November 4, 2018 | |||||||||||||||||||
| Broadcom Inc. | $ | 100.00 | $ | 196.10 | $ | 283.46 | $ | 394.74 | $ | 600.59 | $ | 538.98 | ||||||||||||
| S&P 500 Index | $ | 100.00 | $ | 116.93 | $ | 123.01 | $ | 128.57 | $ | 159.28 | $ | 171.34 | ||||||||||||
| PHLX Semiconductor Index | $ | 100.00 | $ | 128.98 | $ | 136.60 | $ | 172.14 | $ | 270.13 | $ | 269.76 |
The graph and the table above shall not be deemed “filed” with the SEC for the purposes of Section 18 of the Exchange Act or otherwise subject to the liabilities of that section, nor shall it be deemed incorporated by reference in any filing made by us with the SEC, regardless of any general incorporation language in such filing.
Securities Authorized for Issuance Under Equity Compensation Plans
The information required by this item regarding securities authorized for issuance under equity compensation plans is incorporated herein by reference to the definitive Proxy Statement for our 2019 annual meeting of stockholders to be filed with the SEC within 120 days after the end of fiscal year 2018.
Previous: Item 4. MINE SAFETY DISCLOSURES · Next: Item 6. SELECTED FINANCIAL DATA