 filings.tools
Item 7. MANAGEMENT’S DISCUSSION AND ANALYSIS OF FINANCIAL CONDITION AND RESULTS OF OPERATIONS
119K characters. Original on sec.gov · Markdown
Item 7. MANAGEMENT’S DISCUSSION AND ANALYSIS OF FINANCIAL CONDITION AND RESULTS OF OPERATIONS
The following discussion should be read together with the Consolidated Financial Statements and the Notes thereto included elsewhere in this Form 10-K. This discussion contains forward-looking statements that are based on management’s current expectations, estimates and projections about the Company’s business, operations and financial performance. The cautionary statements made in this Form 10-K should be read as applying to all related forward-looking statements whenever they appear in this Form 10-K. The Company’s actual results may differ materially from those currently anticipated and expressed in such forward-looking statements as a result of a number of factors, including those that are discussed under “Forward-Looking Statements,” Item 1A—Risk Factors and elsewhere in this Form 10-K. The Company has a disclosure committee consisting of members of senior management and other key employees involved in the preparation of the Company’s SEC reports. The committee is actively involved in the review and discussion of the Company’s SEC filings. For a discussion and analysis of the Company’s financial statements for fiscal 2018 compared to fiscal 2017, please refer to Item 7—Management’s Discussion and Analysis of Financial Condition and Results of Operations in the Company’s Annual Report on Form 10-K for the year ended December 31, 2018, filed with the SEC on February 19, 2019.
Overview
American Water is the largest and most geographically diverse, publicly-traded water and wastewater utility company in the United States, as measured by both operating revenues and population served. The Company employs approximately 6,800 professionals who provide drinking water, wastewater and other related services to approximately 15 million people in 46 states. The Company’s primary business involves the ownership of utilities that provide water and wastewater services to residential, commercial, industrial, public authority, fire service and sale for resale customers, collectively presented as the “Regulated Businesses.” The Company’s utilities operate in approximately 1,700 communities in 16 states in the United States, with over 3.4 million active customers with services provided by its water and wastewater networks. Services provided by the Company’s utilities are generally subject to regulation by PUCs. The Company also operates market-based businesses that provide complementary services to residential and smaller commercial customers, the U.S. government on military installations, as well as municipalities, utilities and industrial customers, collectively presented as the “Market-Based Businesses.” These Market-Based Businesses are not subject to regulation by state PUCs. See Item 1—Business for additional information.
Financial Results
Presented in the table below are the Company’s diluted earnings per share, as determined in accordance with GAAP, and the Company’s adjusted diluted earnings per share (a non-GAAP measure):
| For the Years Ended December 31, | |||||||||||
| 2019 | 2018 | 2017 | |||||||||
| Diluted earnings per share (GAAP): | |||||||||||
| Net income attributable to common shareholders | $ | 3.43 | $ | 3.15 | $ | 2.38 | |||||
| Adjustments: | |||||||||||
| Loss on sale of Keystone operations | 0.24 | — | — | ||||||||
| Income tax impact | (0.05 | ) | — | — | |||||||
| Net adjustment | 0.19 | — | — | ||||||||
| Freedom Industries settlement activities | (0.02 | ) | (0.11 | ) | (0.12 | ) | |||||
| Income tax impact | 0.01 | 0.03 | 0.05 | ||||||||
| Net adjustment | (0.01 | ) | (0.08 | ) | (0.07 | ) | |||||
| Gain on sale of Contract Services Group contracts | — | (0.08 | ) | — | |||||||
| Income tax impact | — | 0.02 | — | ||||||||
| Net adjustment | — | (0.06 | ) | — | |||||||
| Keystone impairment charge | — | 0.31 | — | ||||||||
| Income tax impact | — | (0.08 | ) | — | |||||||
| Net loss attributable to noncontrolling interest | — | (0.01 | ) | — | |||||||
| Net adjustment | — | 0.22 | — | ||||||||
| Early extinguishment of debt at parent company | — | — | 0.03 | ||||||||
| Income tax impact | — | — | (0.01 | ) | |||||||
| Net adjustment | — | — | 0.02 | ||||||||
| Impact of re-measurement from the TCJA | — | 0.07 | 0.70 | ||||||||
| Total net adjustments | 0.18 | 0.15 | 0.65 | ||||||||
| Adjusted diluted earnings per share (non-GAAP) | $ | 3.61 | $ | 3.30 | $ | 3.03 |
For the year ended December 31, 2019, diluted earnings per share (GAAP) were $3.43, an increase of $0.28 per diluted share compared to the prior year, which includes the net adjustments presented in the table above and discussed in greater detail in the “Adjustments to GAAP” section below.
Excluding the net adjustments presented in the table above, adjusted diluted earnings per share (non-GAAP) were $3.61 for the year ended December 31, 2019, an increase of $0.31 per diluted share compared to the prior year.
These results were driven by continued growth in the Regulated Businesses from infrastructure investment, acquisitions and organic growth, and growth in the Market-Based Businesses, primarily from HOS’s 2018 acquisition of Pivotal and from MSG’s addition of two new military contracts in 2018 (Wright-Patterson Air Force Base and Fort Leonard Wood).
Adjustments to GAAP
Adjusted diluted earnings per share represents a non-GAAP financial measure and, as shown in the table above, is calculated as GAAP diluted earnings per share, excluding the impact of one or more of the following events: (i) a loss on the sale in the fourth quarter of 2019 of the Keystone operations; (ii) previously reported settlement activities related to the Freedom Industries chemical spill in West Virginia; (iii) a gain recognized in the third quarter of 2018 on the sale of the majority of CSG’s O&M contracts; (iv) a goodwill and intangible impairment charge in the third quarter of 2018 related to the Keystone operations; (v) an early extinguishment of debt charge at parent company in the third quarter of 2017; and (vi) non-cash re-measurement charges recorded in the fourth quarters of 2017 and 2018 resulting from the impact of the change in the federal corporate income tax rate on the Company’s deferred income taxes from the enactment of the TCJA.
The Company believes that this non-GAAP measure provides investors with useful information by excluding certain matters that may not be indicative of its ongoing operating results, and that providing this non-GAAP measure will allow investors to better understand the businesses’ operating performance and facilitate a meaningful year-to-year comparison of the Company’s results of operations. Although management uses this non-GAAP financial measure internally to evaluate its results of operations, the Company does not intend results reflected by this non-GAAP measure to represent results as defined by GAAP, and the reader should not consider them as indicators of performance. This non-GAAP financial measure is derived from the Company’s consolidated financial information but is not presented in the financial statements prepared in accordance with GAAP. This measure should be considered in addition to, and not as a substitute for, measures of financial performance prepared in accordance with GAAP. In addition, this non-GAAP financial measure as defined and used above, may not be comparable to similarly titled non-GAAP measures used by other companies, and, accordingly, may have significant limitations on its use.
Growth—through capital investment in infrastructure and regulated acquisitions, as well as strategic growth opportunities in the Market-Based Businesses
The Company expects to continue to grow its businesses, with the majority of its growth to be achieved in the Regulated Businesses through (i) continued capital investment in the Company’s infrastructure to provide safe, clean, reliable and affordable water and wastewater services to its customers, and (ii) regulated acquisitions to expand the Company’s services to new customers. The Company also expects to continue to grow the Market-Based Businesses, which leverages its core water and wastewater competencies. In 2019, the Company invested $1.9 billion, primarily in the Regulated Businesses, as discussed below:
Regulated Businesses Growth and Optimization
| • | $1.7 billion capital investment in the Regulated Businesses, the majority for infrastructure improvements and replacements. |
| • | $235 million to fund acquisitions in the Regulated Businesses, which added approximately 53,100 water and wastewater customers. |
| • | The Company has entered into agreements for pending acquisitions in the Regulated Businesses to add approximately 44,200 customers. |
On November 20, 2019, the Company and its New York subsidiary entered into a Stock Purchase Agreement with Liberty Utilities Co. (“Liberty”), pursuant to which Liberty will purchase all of the capital stock of the New York subsidiary (the “Stock Purchase”) for an aggregate purchase price of approximately $608 million in cash, subject to adjustment as provided in that agreement. The New York subsidiary includes all of the water and wastewater assets of the Company’s New York regulated utility operations, with approximately 125,000 customer connections in the State of New York. Algonquin Power & Utilities Corp., Liberty’s parent company, executed and delivered an absolute and unconditional guaranty of the performance of all of Liberty’s obligations under the stock purchase agreement.
The Stock Purchase is subject to various conditions, including obtaining regulatory approval, the expiration or termination of the applicable waiting period under the U.S. Hart-Scott-Rodino antitrust law and other customary closing conditions. The stock purchase agreement may be terminated by either party if the Stock Purchase is not completed by June 30, 2021, subject to extension for up to six months if all of the conditions to closing have been met, other than obtaining regulatory approvals. Liberty may also terminate the stock purchase agreement if any governmental authority initiates a condemnation or eminent domain proceeding against a majority of the consolidated properties of the New York subsidiary, taken as a whole. The Company currently estimates that the Stock Purchase is to be completed by early 2021. Accordingly, the assets and related liabilities of the New York subsidiary were classified as held for sale on the Consolidated Balance Sheets as of December 31, 2019. See Note 4—Acquisitions and Divestitures in the Notes to Consolidated Financial Statements for additional information.
Market-Based Businesses Growth and Optimization
During January 2020, HOS was selected by the San Francisco Public Utilities Commission (“SFPUC”) to offer optional water line and sewer line protection services to homeowners across the City and County of San Francisco. This arrangement provides over 100,000 eligible San Francisco homeowners, served by the SFPUC, the opportunity to purchase optional protection plans from the Company for the water line that runs from a residential property to the connection with the water meter and the sewer line that runs from the residential property to the sewer main.
MSG was awarded contracts for ownership, operation and maintenance of the water and wastewater systems at Joint Base San Antonio in Texas, effective September 26, 2019, and the United States Military Academy at West Point, New York, effective September 30, 2019. Highlights of these contract awards are detailed below:
| • | Joint Base San Antonio is comprised of Randolph Air Force Base, Fort Sam Houston, Camp Bullis and Lackland Air Force Base. The installation spans 46,539 acres, across 11 geographically separated parcels of land. The contract award includes estimated revenues of approximately $448 million over a 50-year period, subject to an annual economic price adjustment. |
| • | The United States Military Academy is located at West Point, New York, the oldest continuously operated Army post in the United States. The institution’s campus, central post and training areas expand across nearly 16,000 acres, and is home to a student body of approximately 4,400 cadets. The total contract award includes estimated revenues of approximately $519 million over a 50-year period, subject to an annual economic price adjustment. |
On December 12, 2019, as part of a strategic review undertaken by the Company, the Company sold all of its interest in its Keystone operations to a natural gas and oil industry investment group, for total cash consideration of $31 million, subject to adjustment based on post-closing working capital. As a result of the sale, the Company recorded a pre-tax loss on sale of $44 million, or $35 million after-tax, during the fourth quarter of 2019, as discussed above. See Note 4—Acquisitions and Divestitures in the Notes to Consolidated Financial Statements for additional information.
Future Growth
Looking forward, the Company expects to invest between $8.8 billion to $9.4 billion from 2020 to 2024, and between $20 billion to $22 billion from 2020 to 2029, including a range of $1.7 billion to $1.9 billion in 2020. The Company’s expected future investments include:
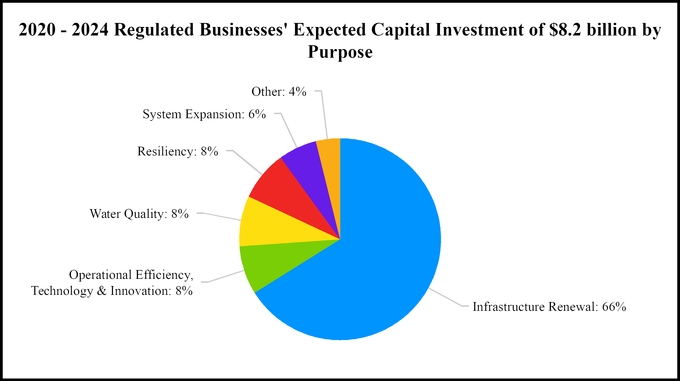
| • | capital investment for infrastructure improvements in the Regulated Businesses of $8.2 billion over the next five years, and between $18.2 billion and $19.2 billion over the next 10 years, including $1.6 billion expected in 2020; and |
| • | growth from acquisitions in the Regulated Businesses to expand the Company’s water and wastewater customer base of between $600 million to $1.2 billion over the next five years, and between $2 billion to $3 billion over the next 10 years, including a range of $100 million to $300 million expected in 2020. |
Presented in the following chart is the estimated allocation of the Company’s expected capital investment for infrastructure improvements in its Regulated Businesses over the next five years, by purpose:
Operational Excellence
The Company continues to strive for industry-leading operational efficiency, driven largely by technology. The Company’s technology investments are aimed at enhancing its customer experience and operational efficiency.
| • | In 2019: |
| • | the Regulated Businesses achieved an adjusted O&M efficiency ratio (a non-GAAP measure) of 34.5% for the year ended December 31, 2019, compared to 35.6% and 35.3% for the years ended December 31, 2018 and 2017, respectively. The improvement in the Company’s adjusted O&M efficiency ratio in 2019, when compared to 2018, was due to an increase in operating revenues as well as continued focus on operating costs of the Regulated Businesses; |
| • | the Company worked to decrease costs and deploy capital efficiently, including using trenchless technologies for pipeline rehabilitation and leveraging its buying power and strategic sourcing to drive cost savings; |
| • | the Company continued its commitment to water quality and the environment by leveraging new technologies; the Company now has advanced water quality sensors at all of its major drinking water intake sites and is automating its environmental reporting and compliance systems; and |
| • | the Company implemented other technology tools that will enhance communication, collaboration and mobility, enable further business insights and process automation, and increase self-service capabilities, to help its employees work safely and efficiently, and enhance the customer experience. |
| • | Looking forward, the Company will focus on technology and efficiency to: |
| • | be the leader in optimizing technology across the water and wastewater industry, with a focus on specific, innovative projects that will set it apart from other utilities; aiding the Company in serving its customers with greater ease, making the Company’s employees safer and helping the Company operate more efficiently; and |
| • | further improve the Company’s adjusted O&M efficiency ratio. |
The Company’s adjusted O&M efficiency ratio is defined as its operation and maintenance expenses from the Regulated Businesses, divided by the pro forma operating revenues from the Regulated Businesses, where both operation and maintenance expenses and pro forma operating revenues were adjusted to eliminate purchased water expense. Also excluded from operation and maintenance expenses are the allocable portion of non-operation and maintenance support services costs, mainly depreciation and general taxes, which are reflected in the Regulated Businesses segment as operation and maintenance expenses, but for consolidated financial reporting purposes, are categorized within other line items in the accompanying Consolidated Statements of Operations.
In addition to the adjustments discussed above, for period-to-period comparability purposes, the estimated impact of the TCJA on operating revenues for the Regulated Businesses has been presented on a pro forma basis for all periods prior to January 1, 2018, as if the lower federal corporate income tax rate was in effect for these periods. The Company also made the following adjustments to the O&M efficiency ratio: (i) excluded from operation and maintenance expenses is the impact of certain Freedom Industries chemical spill settlement activities recognized in 2017, 2018 and 2019 (see Note 16—Commitments and Contingencies in the Notes to Consolidated Financial Statements for additional information); and (ii) excluded from operation and maintenance expenses is the impact of the Company’s January 1, 2018 adoption of Accounting Standards Update 2017-07, Improving the Presentation of Net Periodic Pension Cost and Net Periodic Post-Retirement Benefit Cost (“ASU 2017-07”), for 2017, 2018 and 2019. The items discussed above were excluded from the calculation as they are not reflective of management’s ability to increase the efficiency of the Regulated Businesses.
The Company evaluates its operating performance using this ratio, and believes it is useful to investors, because it directly measures improvement in the efficiency of the Regulated Businesses. This information is derived from the Company’s consolidated financial information but is not presented in its financial statements prepared in accordance with GAAP. This information is intended to enhance an investor’s overall understanding of the Company’s operating performance. The Company’s adjusted O&M efficiency ratio is not an accounting measure that is based on GAAP, may not be comparable to other companies’ operating measures and should not be used in place of the GAAP information provided elsewhere in this Form 10-K.
Presented in the table below is the calculation of the Company’s adjusted O&M efficiency ratio and a reconciliation that compares operation and maintenance expenses and operating revenues, each as determined in accordance with GAAP, to those amounts utilized in the calculation of its adjusted O&M efficiency ratio:
| For the Years Ended December 31, | |||||||||||
| (Dollars in millions) | 2019 | 2018 | 2017 | ||||||||
| Total operation and maintenance expenses (a) | $ | 1,544 | $ | 1,479 | $ | 1,369 | |||||
| Less: | |||||||||||
| Operation and maintenance expenses—Market-Based Businesses | 393 | 362 | 337 | ||||||||
| Operation and maintenance expenses—Other (a) | (31 | ) | (42 | ) | (44 | ) | |||||
| Total operation and maintenance expenses—Regulated Businesses (a) | 1,182 | 1,159 | 1,076 | ||||||||
| Less: | |||||||||||
| Regulated purchased water expenses | 135 | 133 | 128 | ||||||||
| Allocation of non-operation and maintenance expenses | 31 | 31 | 29 | ||||||||
| Impact of Freedom Industries settlement activities (b) | (4 | ) | (20 | ) | (22 | ) | |||||
| Adjusted operation and maintenance expenses—Regulated Businesses (i) | $ | 1,020 | $ | 1,015 | $ | 941 | |||||
| Total operating revenues | $ | 3,610 | $ | 3,440 | $ | 3,357 | |||||
| Less: | |||||||||||
| Pro forma adjustment for impact of the TCJA (c) | — | — | 166 | ||||||||
| Total pro forma operating revenues | 3,610 | 3,440 | 3,191 | ||||||||
| Less: | |||||||||||
| Operating revenues—Market-Based Businesses | 539 | 476 | 422 | ||||||||
| Operating revenues—Other | (23 | ) | (20 | ) | (23 | ) | |||||
| Total operating revenues—Regulated Businesses | 3,094 | 2,984 | 2,792 | ||||||||
| Less: | |||||||||||
| Regulated purchased water revenues (d) | 135 | 133 | 128 | ||||||||
| Adjusted operating revenues—Regulated Businesses (ii) | $ | 2,959 | $ | 2,851 | $ | 2,664 | |||||
| Adjusted O&M efficiency ratio—Regulated Businesses (i) / (ii) | 34.5 | % | 35.6 | % | 35.3 | % |
| (a) | Includes the impact of the Company’s adoption of ASU 2017-07, Compensation - Retirement Benefits (Topic 715): Improving the Presentation of Net Periodic Pension Cost and Net Periodic Post-Retirement Benefit, on January 1, 2018. |
| (b) | Includes the impact of settlements in 2017 and 2018 with two of the Company’s general liability insurance carriers, and a reduction in the first quarter of 2019 of a liability, each related to the Freedom Industries chemical spill. |
| (c) | Includes the estimated impact of the TCJA on operating revenues for the Regulated Businesses for all periods presented prior to January 1, 2018, as if the lower federal corporate income tax rate was in effect for these periods. |
| (d) | The calculation assumes regulated purchased water revenues approximate regulated purchased water expenses. |
Regulatory Matters
General Rate Cases
Presented in the table below are annualized incremental revenues, assuming a constant water sales volume, resulting from general rate case authorizations that became effective during 2017 through 2019:
| (In millions) | 2019 | 2018 | 2017 | ||||||||
| General rate cases by state: | |||||||||||
| Indiana (a) | $ | 4 | $ | — | $ | — | |||||
| Kentucky (effective June 28, 2019) | 13 | — | — | ||||||||
| California (b) | 4 | 10 | 5 | ||||||||
| New York (c) | 4 | 5 | 4 | ||||||||
| West Virginia (effective February 25, 2019) | 19 | — | — | ||||||||
| Maryland (effective February 5, 2019) | 1 | — | — | ||||||||
| New Jersey (d) | — | 40 | — | ||||||||
| Missouri (effective May 28, 2018) | — | 33 | — | ||||||||
| Pennsylvania (effective January 1, 2018) | — | 62 | — | ||||||||
| Virginia (e) | — | — | 5 | ||||||||
| Iowa (effective March 27, 2017) | — | — | 4 | ||||||||
| Illinois (effective January 1, 2017) | — | — | 25 | ||||||||
| Total general rate case authorizations | $ | 45 | $ | 150 | $ | 43 |
| (a) | The Company’s Indiana subsidiary received an order approving a joint settlement agreement with all major parties with respect to its general rate case filing, authorizing annualized incremental revenues of $4 million in the first rate year, effective July 1, 2019, and $13 million in the second rate year, effective approximately May 1, 2020. |
| (b) | The Company’s California subsidiary received approval for the second rate year (2019) step increase associated with its most recent general rate case authorization, effective May 11, 2019. On December 13, 2018, a settlement in this subsidiary’s general rate case filing was approved, authorizing rates effective January 1, 2018. In 2017, step rates were effective January 13 through February 2. |
| (c) | The Company’s New York subsidiary implemented its third step increase associated with its most recent general rate case authorization, effective April 1, 2019. |
| (d) | The effective date was June 15, 2018. As part of the resolution of the general rate case, the Company’s New Jersey subsidiary’s customers received refunds for the amount of provisional rates implemented as of June 15, 2018 and collected, to the extent that such rates exceeded the final rate increase plus interest. |
| (e) | The effective date was May 24, 2017, authorizing the implementation of interim rates as of April 1, 2016. |
Pending General Rate Case Filings
There is no assurance that all or any portion of the following requests will be granted.
On December 16, 2019, the Company’s New Jersey subsidiary filed a general rate case requesting $88 million annualized incremental revenues.
On November 12, 2019, the Company’s California subsidiary filed for the third year (2020) step increase requesting $5 million associated with its most recent general case authorization. Step rates became effective on January 1, 2020, subject to refund. As of February 14, 2020, five of the seven districts’ step increases were approved representing $4 million of the $5 million request.
On July 1, 2019, the Company’s California subsidiary filed a general rate case requesting $26 million annualized incremental revenues for 2021, and increases of $10 million and $11 million in the escalation year of 2022 and the attrition year of 2023, respectively. On January 22, 2020, the Company’s California subsidiary submitted a request to delay by one year its cost of capital filing and maintain its current authorized cost of capital through 2021. If the extension is not granted, the subsidiary may file the cost of capital application by May 1, 2020 to adjust its authorized cost of capital beginning January 1, 2021.
In 2018, the Company’s Virginia subsidiary filed a general rate case requesting $5 million in annualized incremental revenues. On May 1, 2019, interim rates under bond and subject to refund were implemented and will remain in effect until a final decision is received in this general rate case.
Infrastructure Surcharges
A number of states have authorized the use of regulatory mechanisms that permit rates to be adjusted outside of a general rate case for certain costs and investments, such as infrastructure surcharge mechanisms that permit recovery of capital investments to replace aging infrastructure. Presented in the table below are annualized incremental revenues, assuming a constant water sales volume, resulting from infrastructure surcharge authorizations that became effective during 2017 through 2019:
| (In millions) | 2019 | 2018 | 2017 | ||||||||
| Infrastructure surcharges by state: | |||||||||||
| Missouri (a) | $ | 14 | $ | 6 | $ | 6 | |||||
| Pennsylvania (b) | 11 | — | 1 | ||||||||
| Tennessee (effective September 1, 2019, April 10, 2018 and March 14, 2017) | 1 | 1 | 2 | ||||||||
| New York (effective August 1, 2019) | 2 | — | — | ||||||||
| New Jersey (c) | 15 | — | 14 | ||||||||
| Illinois (effective January 1, 2019 and January 1, 2018) | 8 | 3 | — | ||||||||
| West Virginia (effective January 1, 2019, January 1, 2018 and January 1, 2017) | 2 | 3 | 2 | ||||||||
| Indiana (effective March 14, 2018 and March 22, 2017) | — | 7 | 8 | ||||||||
| Virginia (effective March 1, 2018) | — | 1 | — | ||||||||
| Total infrastructure surcharge authorizations | $ | 53 | $ | 21 | $ | 33 |
| (a) | In 2019, $5 million was effective December 21 and $9 million was effective June 24. In 2018, the effective date was December 15. In 2017, the effective date was December 15. |
| (b) | In 2019, $6 million was effective October 1, $3 million was effective July 1 and $2 million was effective April 1. In 2017, the effective date was January 1. |
| (c) | In 2019, the effective date was July 1. In 2017, $4 million was effective December 10 and $10 million was effective June 1. |
Presented in the table below are annualized incremental revenues, assuming a constant water sales volume, resulting from infrastructure surcharge authorizations that became effective after January 1, 2020:
| (In millions) | Amount | ||
| Infrastructure surcharge filings by state: | |||
| Pennsylvania (effective January 1, 2020) | $ | 10 | |
| New Jersey (effective January 1, 2020) | 10 | ||
| Illinois (effective January 1, 2020) | 7 | ||
| West Virginia (effective January 1, 2020) | 3 | ||
| Total infrastructure surcharge filings | $ | 30 |
Pending Infrastructure Surcharge Filings
On November 15, 2019, the Company’s Tennessee subsidiary filed for an infrastructure surcharge requesting $2 million in additional annualized revenues. There is no assurance that all or any portion of this request will be granted.
Tax Matters
Tax Cuts and Jobs Act
On December 22, 2017, the TCJA was signed into law, which, among other things, enacted significant and complex changes to the Code, including a reduction in the federal corporate income tax rate from 35% to 21% as of January 1, 2018, and certain other provisions related specifically to the public utility industry, including continuation of interest expense deductibility, the exclusion from utilizing bonus depreciation and the normalization of deferred income taxes. In 2018, the Company’s 14 regulatory jurisdictions began to seek to address the impacts of the TCJA. The Company has adjusted customer rates to reflect the lower income tax rate in 11 states. In one of those 11 states, a portion of the tax savings is being used to reduce certain regulatory assets. In one additional state, the Company is using the tax savings to offset additional capital investment and to reduce a regulatory asset. Proceedings in the other two regulatory jurisdictions remain pending.
The enactment of the TCJA required a re-measurement of the Company’s deferred income taxes that materially impacted its 2017 results of operations and financial position. The portion of this re-measurement related to the Regulated Businesses was substantially offset by a regulatory liability, as the Company believes it is probable that the excess accumulated deferred income taxes (“EADIT”) created by the TCJA will be used to benefit its regulated customers in future rates. Six of the Company’s regulated subsidiaries are amortizing EADIT and crediting customers, including one which is using the EADIT to offset future infrastructure investments. The Company expects the timing of the amortization of EADIT credits by the eight remaining regulated subsidiaries to be addressed in pending or future rate cases or other proceedings.
On March 23, 2018, the Consolidated Appropriations Act of 2018 (the “CAA”) was signed into law. The CAA corrects and clarifies some aspects of the TCJA related to bonus depreciation eligibility. Specifically, property that was either acquired, or as to which construction began prior to September 27, 2017, is eligible for bonus depreciation. The Company had a federal NOL carryover balance as of December 31, 2019 that is not expected to be fully utilized until 2020, which is when the Company expects that it will become a cash taxpayer for federal income tax purposes.
Legislative Updates
In Illinois, the Governor signed a 10-year extension of the Water Systems Viability Act, Illinois’ fair market value legislation, in 2018, which became effective in 2019. In addition to extending the act, the updated law removes the previous restriction on the size of water or wastewater systems that can be acquired and allows all municipalities to take advantage of the benefits of the program.
During 2019, the Company’s regulatory jurisdictions enacted the following legislation that has been approved and is effective as of December 31, 2019:
| • | Indiana Senate Enrolled Act 472 allows non-municipal utilities to benefit from full appraisal recovery of their assets in a sale. |
| • | Indiana House Enrolled Act 1406 established the first state appropriation for water infrastructure investment at $20 million per year. |
| • | Indiana Senate Enrolled Act 4 extends leveling legislation to require biannual water loss audits and establishes the state revolving fund administrator as the central coordinator for water issues in the state. |
| • | In Pennsylvania, House Bill 751, now Act 53 of 2019, allows water and wastewater utilities responsible for funding the income taxes on taxable contributions and advances to record the income taxes paid in accumulated deferred income taxes for accounting and ratemaking purposes. |
| • | In West Virginia, House Bill 117 allows qualified low income customers to apply for a 20% discount on their wastewater bill. |
Consolidated Results of Operations
Presented in the table below are the Company’s consolidated results of operations:
| For the Years Ended December 31, | |||||||||||
| 2019 | 2018 | 2017 | |||||||||
| (Dollars in millions) | |||||||||||
| Operating revenues | $ | 3,610 | $ | 3,440 | $ | 3,357 | |||||
| Operating expenses: | |||||||||||
| Operation and maintenance | 1,544 | 1,479 | 1,369 | ||||||||
| Depreciation and amortization | 582 | 545 | 492 | ||||||||
| General taxes | 280 | 277 | 259 | ||||||||
| Loss (gain) on asset dispositions and purchases | 34 | (20 | ) | (16 | ) | ||||||
| Impairment charge | — | 57 | — | ||||||||
| Total operating expenses, net | 2,440 | 2,338 | 2,104 | ||||||||
| Operating income | 1,170 | 1,102 | 1,253 | ||||||||
| Other income (expense): | |||||||||||
| Interest, net | (382 | ) | (350 | ) | (342 | ) | |||||
| Non-operating benefit costs, net | 16 | 20 | (9 | ) | |||||||
| Loss on early extinguishment of debt | (4 | ) | (4 | ) | (7 | ) | |||||
| Other, net | 33 | 19 | 17 | ||||||||
| Total other income (expense) | (337 | ) | (315 | ) | (341 | ) | |||||
| Income before income taxes | 833 | 787 | 912 | ||||||||
| Provision for income taxes | 212 | 222 | 486 | ||||||||
| Consolidated net income | 621 | 565 | 426 | ||||||||
| Net loss attributable to noncontrolling interest | — | (2 | ) | — | |||||||
| Net income attributable to common shareholders | $ | 621 | $ | 567 | $ | 426 |
The main factors contributing to the $54 million increase in net income attributable to common shareholders for the year ended December 31, 2019 are described in “Segment Results of Operations” below.
Segment Results of Operations
The Company’s operating segments are comprised of the revenue-generating components of its business for which separate financial information is internally produced and regularly used by management to make operating decisions, assess performance and allocate resources. The Company operates its business primarily through one reportable segment, the Regulated Businesses segment. The Company also operates market-based businesses that, individually, do not meet the criteria of a reportable segment in accordance with GAAP, and are collectively presented as the Market-Based Businesses, which is consistent with how management assesses the results of these businesses.
Regulated Businesses Segment
Presented in the table below is financial information for the Regulated Businesses:
| For the Years Ended December 31, | |||||||||||
| 2019 | 2018 | 2017 | |||||||||
| (Dollars in millions) | |||||||||||
| Operating revenues | $ | 3,094 | $ | 2,984 | $ | 2,958 | |||||
| Operation and maintenance | 1,182 | 1,159 | 1,076 | ||||||||
| Depreciation and amortization | 529 | 500 | 462 | ||||||||
| General taxes | 262 | 261 | 244 | ||||||||
| (Gain) on asset dispositions and purchases | (10 | ) | (7 | ) | (16 | ) | |||||
| Other income (expenses) | (262 | ) | (247 | ) | (266 | ) | |||||
| Income before income taxes | 869 | 826 | 925 | ||||||||
| Provision for income taxes | 215 | 224 | 367 | ||||||||
| Net income attributable to common shareholders | 654 | 602 | 559 |
Operating Revenues
Presented in the tables below is information regarding the main components of the Regulated Businesses’ operating revenues, with explanations for the material variances provided in the ensuing discussions:
| For the Years Ended December 31, | |||||||||||
| 2019 | 2018 | 2017 | |||||||||
| (Dollars in millions) | |||||||||||
| Water services: | |||||||||||
| Residential | $ | 1,735 | $ | 1,663 | $ | 1,644 | |||||
| Commercial | 639 | 616 | 601 | ||||||||
| Fire service | 142 | 137 | 139 | ||||||||
| Industrial | 138 | 136 | 137 | ||||||||
| Public and other | 230 | 216 | 244 | ||||||||
| Total water services | 2,884 | 2,768 | 2,765 | ||||||||
| Wastewater services | 167 | 161 | 142 | ||||||||
| Other (a) | 43 | 55 | 51 | ||||||||
| Total operating revenues | $ | 3,094 | $ | 2,984 | $ | 2,958 |
| (a) | Includes other operating revenues consisting primarily of miscellaneous utility charges, fees and rents. |
| For the Years Ended December 31, | ||||||||
| 2019 | 2018 | 2017 | ||||||
| (Gallons in millions) | ||||||||
| Billed water services volumes: | ||||||||
| Residential | 167,470 | 172,827 | 174,420 | |||||
| Commercial | 81,268 | 82,572 | 82,147 | |||||
| Industrial | 37,242 | 38,432 | 39,404 | |||||
| Fire service, public and other | 50,501 | 50,651 | 51,341 | |||||
| Total billed water services volumes | 336,481 | 344,482 | 347,312 |
In 2019, operating revenues increased $110 million primarily due to a:
| • | $132 million increase from authorized rate increases, including infrastructure surcharges, principally to fund infrastructure investment in various states; a |
| • | $20 million increase from water and wastewater acquisitions, as well as organic growth in existing systems; partially offset by a |
| • | $24 million decrease from lower water services demand, including $10 million primarily driven by unusually wet weather conditions experienced in the Northeast and Midwest during the second quarter of 2019 and ongoing customer usage reductions from conservation, partially offset by balancing accounts, primarily in the Company’s California subsidiary; and a |
| • | $17 million decrease from the impacts of the TCJA, including the Company’s Missouri subsidiary’s 2018 general rate case decision which authorized the adjustment of customer rates, effective May 28, 2018, to reflect the income tax savings resulting from the TCJA. |
Operation and Maintenance
Presented in the table below is information regarding the main components of the Regulated Businesses’ operating and maintenance expense, with explanations for material variances provided in the ensuing discussions:
| For the Years Ended December 31, | |||||||||||
| 2019 | 2018 | 2017 | |||||||||
| (Dollars in millions) | |||||||||||
| Production costs | $ | 317 | $ | 313 | $ | 298 | |||||
| Employee-related costs | 462 | 451 | 431 | ||||||||
| Operating supplies and services | 237 | 227 | 209 | ||||||||
| Maintenance materials and supplies | 74 | 81 | 70 | ||||||||
| Customer billing and accounting | 55 | 60 | 51 | ||||||||
| Other | 37 | 27 | 17 | ||||||||
| Total | $ | 1,182 | $ | 1,159 | $ | 1,076 |
Production Costs
| For the Years Ended December 31, | |||||||||||
| 2019 | 2018 | 2017 | |||||||||
| (Dollars in millions) | |||||||||||
| Purchased water | $ | 135 | $ | 133 | $ | 128 | |||||
| Fuel and power | 90 | 91 | 89 | ||||||||
| Chemicals | 54 | 52 | 47 | ||||||||
| Waste disposal | 38 | 37 | 34 | ||||||||
| Total | $ | 317 | $ | 313 | $ | 298 |
Employee-Related Costs
| For the Years Ended December 31, | |||||||||||
| 2019 | 2018 | 2017 | |||||||||
| (Dollars in millions) | |||||||||||
| Salaries and wages | $ | 363 | $ | 349 | $ | 334 | |||||
| Pensions | 12 | 19 | 14 | ||||||||
| Group insurance | 60 | 57 | 57 | ||||||||
| Other benefits | 27 | 26 | 26 | ||||||||
| Total | $ | 462 | $ | 451 | $ | 431 |
In 2019, employee-related costs increased $11 million primarily due to a $17 million increase in salaries and wages and group insurance from higher headcount and related compensation expense supporting growth in the businesses, as well as the union-represented employees’ first full year participation in the Company’s cash-based annual performance plan during 2019; partially offset by a $7 million decrease in pension expense primarily due to lower service costs.
Operating Supplies and Services
In 2019, operating supplies and services increased $10 million primarily due to higher costs for technology services, including higher software licensing costs and technical support, and expenses related to various projects in the Company’s California subsidiary, as well as an increase in other operating expenses.
Maintenance Materials and Supplies
In 2019, maintenance materials and supplies decreased $7 million primarily due to higher volume of main breaks and paving costs, driven by the colder weather experienced during the first quarter of 2018.
Customer Billing and Accounting
In 2019, customer billing and accounting decreased $5 million from a decrease in customer uncollectible expense.
Other (Operation and Maintenance)
In 2019, other (operation and maintenance) increased $10 million primarily due to a $20 million benefit recorded in the second quarter of 2018, resulting from an insurance settlement related to the Freedom Industries chemical spill in West Virginia, offset in part by (i) a $4 million reduction to the liability related to the Freedom Industries chemical spill, recorded in the first quarter of 2019, and (ii) an increase in operating revenues and O&M expense during 2018 resulting from the authorization for the Company’s West Virginia subsidiary to use a portion of the income tax savings resulting from the TCJA for accelerated recovery of certain regulatory assets.
Depreciation and Amortization
In 2019, depreciation and amortization increased $29 million primarily due to additional utility plant placed in service from investments.
Other Income (Expenses)
In 2019, other income (expenses) decreased $15 million primarily due to an increase in interest expense from the issuance of incremental long-term debt in the second quarter of 2019 and the third quarter of 2018 to support growth of the business, partially offset by interest savings from early debt redemptions and tax-exempt bond refinancings during 2019.
Provision for Income Taxes
For the year ended December 31, 2019, the Company’s provision for income taxes decreased primarily due to a lower effective income tax rate.
Market-Based Businesses
Presented in the table below is information for the Market-Based Businesses, with explanations for material variances provided in the ensuing discussions:
| For the Years Ended December 31, | |||||||||||
| 2019 | 2018 | 2017 | |||||||||
| (Dollars in millions) | |||||||||||
| Operating revenues | $ | 539 | $ | 476 | $ | 422 | |||||
| Operation and maintenance | 393 | 362 | 337 | ||||||||
| Depreciation and amortization | 37 | 29 | 18 | ||||||||
| Loss (gain) on asset dispositions and purchases | 44 | (13 | ) | — | |||||||
| Impairment charge | — | 57 | — | ||||||||
| Income before income taxes | 66 | 41 | 66 | ||||||||
| Provision for income taxes | 20 | 11 | 28 | ||||||||
| Net loss attributable to noncontrolling interest | — | (2 | ) | — | |||||||
| Net income attributable to common shareholders | 46 | 32 | 38 |
Operating Revenues
In 2019, operating revenues increased $63 million primarily due to a:
| • | $74 million increase in HOS from contract growth and from the acquisition of Pivotal, which occurred in the second quarter of 2018; and a |
| • | $20 million increase in MSG from the addition of two new contracts in 2018 (Wright-Patterson Air Force Base and Fort Leonard Wood); partially offset by a |
| • | $18 million decrease in CSG from the sale of the majority of its O&M contracts in the third quarter of 2018; and a |
| • | $15 million decrease at Keystone from the exit of the construction business in the third quarter of 2018. |
Operation and Maintenance
Presented in the table below is information regarding the main components of the Market-Based Businesses’ operating and maintenance expense, with explanations for the material variances provided in the ensuing discussions:
| For the Years Ended December 31, | |||||||||||
| 2019 | 2018 | 2017 | |||||||||
| (Dollars in millions) | |||||||||||
| Production costs | $ | 29 | $ | 32 | $ | 37 | |||||
| Employee-related costs | 109 | 104 | 97 | ||||||||
| Operating supplies and services | 128 | 142 | 121 | ||||||||
| Maintenance materials and supplies | 109 | 69 | 67 | ||||||||
| Other | 18 | 15 | 15 | ||||||||
| Total | $ | 393 | $ | 362 | $ | 337 |
In 2019, operation and maintenance expense increased $31 million primarily due to a:
| • | $40 million increase in maintenance materials and supplies primarily due to contract growth and increased claims expense in HOS; and a |
| • | $5 million increase in employee-related costs primarily in HOS and MSG due to growth in the business, partially offset by lower costs resulting from the sale of the majority of CSG’s O&M contracts and the exit of the construction business at Keystone, both occurring during the third quarter of 2018; partially offset by a |
| • | $14 million decrease in operating supplies and services primarily due to the exit of the construction business in the third quarter of 2018 at Keystone, higher advertising and marketing expense in HOS in 2018, and lower expenses due to the sale of the majority of CSG’s O&M contracts during the third quarter of 2018, as discussed above. |
Depreciation and Amortization
In 2019, depreciation and amortization increased $8 million primarily due to the acquisition of Pivotal in the second quarter of 2018.
Loss (Gain) on Asset Dispositions and Purchases
During the fourth quarter of 2019, the Company recognized a pre-tax loss on sale of $44 million, or $35 million after-tax, relating to the sale of its Keystone operations. See Note 4—Acquisitions and Divestitures in the Notes to Consolidated Financial Statements for additional information. Additionally, during the third quarter of 2018, the Company recognized a pre-tax gain of $14 million on the sale of the majority of CSG’s O&M contracts.
Impairment Charge
During the third quarter of 2018, a goodwill and intangible asset impairment charge of $57 million was recorded for Keystone, the result of operational and financial challenges encountered in the construction business, and the Company’s determination to narrow the scope of the Keystone operations to focus on its core operations of providing water transfer services. See Note 8—Goodwill and Other Intangible Assets in the Notes to Consolidated Financial Statements for additional information.
Provision for Income Taxes
In 2019, provision for income taxes increased $9 million primarily due to an increase in pre-tax income.
Liquidity and Capital Resources
The Company regularly evaluates and monitors its cash requirements for capital investments, acquisitions, operations, commitments, debt maturities, interest and dividends. The Company’s business is capital intensive, with a majority of this capital funded by cash flows from operations. When necessary, the Company also obtains funds from external sources, primarily in the debt markets and through short-term commercial paper borrowings. The Company may also access the equity capital markets to support its capital funding requirements, as needed. The Company’s access to external financing on reasonable terms depends on its credit ratings and current business conditions, including that of the utility and water utility industry in general, as well as conditions in the debt or equity capital markets, and the national and international economic and geopolitical arenas. Disruptions in the credit markets may discourage lenders from extending the terms of such commitments or agreeing to new commitments. Market disruptions may also limit the Company’s ability to issue debt and equity securities in the capital markets.
If these business, market, financial and other conditions deteriorate to the extent that the Company is no longer able to access the capital markets on reasonable terms, AWCC has access to an unsecured revolving credit facility that expires in March 2024 with aggregate bank commitments of $2.25 billion. The facility is used principally to fulfill its short-term liquidity needs by supporting AWCC’s $2.10 billion commercial paper program and to provide a sublimit of up to $150 million for letters of credit. Subject to satisfying certain conditions, the credit agreement permits AWCC to increase the maximum commitment under the facility by up to $500 million.
In order to meet short-term liquidity needs, AWCC issues commercial paper that is supported by its revolving credit facility. As of December 31, 2019, AWCC had no outstanding borrowings and $76 million of outstanding letters of credit under its revolving credit facility, with $2.25 billion available to fulfill its short-term liquidity needs, to issue letters of credit, and to provide support for $786 million in outstanding commercial paper. The Company believes that its ability to access the debt and equity capital markets, the revolving credit facility and cash flows from operations will generate sufficient cash to fund the Company’s short-term requirements. The Company believes it has sufficient liquidity and the ability to manage its expenditures, should there be a disruption of the capital and credit markets. However, there can no assurance that the lenders will be able to meet existing commitments to AWCC under the revolving credit facility, or that AWCC will be able to access the commercial paper or loan markets in the future on acceptable terms or at all. See “Credit Facilities and Short-Term Debt” below for additional information.
In addition, the Regulated Businesses receive advances and contributions from customers, home builders and real estate developers to fund construction necessary to extend service to new areas. Advances for construction are refundable for limited periods, which vary according to state regulations, as new customers begin to receive service or other contractual obligations are fulfilled. Amounts which are no longer refundable are reclassified to contributions in aid of construction.
The Company uses its capital resources, including cash, primarily to (i) fund operating and capital requirements, (ii) pay interest and meet debt maturities, (iii) pay dividends, (iv) fund acquisitions, (v) fund pension and postretirement benefit obligations, and (vi) the Company estimates, during 2020, to begin to pay federal income taxes. The Company invests a significant amount of cash on regulated capital projects where it expects to earn a long-term return on investment. Additionally, the Company operates in rate regulated environments in which the amount of new investment recovery may be limited, and where such recovery generally takes place over an extended period of time, and certain capital recovery is also subject to regulatory lag. See Item 1—Business—Regulated Businesses—Regulation and Rate Making for additional information. The Company expects to fund future maturities of long-term debt through a combination of external debt and, to the extent available, cash flows from operations. Since the Company expects its capital investments over the next few years to be greater than its cash flows from operating activities, the Company currently plans to fund the excess of its capital investments over its cash flows from operating activities for the next five years through a combination of long-term debt and equity. If necessary, the Company may delay certain capital investments or other funding requirements, or pursue financing from other sources to preserve liquidity. In this event, the Company believes it can rely upon cash flows from operations to meet its obligations and fund its minimum required capital investments for an extended period of time.
With the enactment of the TCJA and the reduction of the U.S. federal corporate income tax rate from 35% to 21%, the Company anticipates a decrease in future revenue authorizations associated with the Regulated Businesses, initially leading to lower cash flows. The Company expects this cash flow impact to decline over time, as the Regulated Businesses’ rate base grows, the result of lower deferred income tax liabilities, which offset rate base. The lower deferred income tax liabilities are mainly due to (i) a lower U.S. federal corporate income tax rate, (ii) the normalization (refunding to customers) of the re-measured deferred income tax liabilities over the remaining life of the associated assets, and (iii) the loss of future bonus depreciation deductions on capital projects that began after September 27, 2017.
One component of WIFIA is a federal credit program administered by the EPA for eligible water and wastewater infrastructure projects. The WIFIA program accelerates investment in the U.S.’s water infrastructure by providing long-term, low-cost supplemental loans for regionally and nationally significant projects. The Company is currently pursuing WIFIA financing of approximately $80 million for a project in the Company’s Missouri subsidiary.
Cash Flows Provided by Operating Activities
Cash flows provided by operating activities primarily result from the sale of water and wastewater services and, due to the seasonality of demand, are generally greater during the warmer months. The Company’s future cash flows provided by operating activities will be affected by, among other things: economic utility regulation inflation; compliance with environmental, health and safety standards; production costs; maintenance costs; customer growth; declining customer usage of water; employee-related costs, including pension funding; weather and seasonality; taxes; and overall economic conditions.
The enactment of the TCJA is accretive to the Company’s consolidated earnings over time through (i) growth in rate base for the same level of expected capital expenditures due to the impact of the lower U.S. federal corporate income tax rate and the re-measurement of its deferred income tax assets and liabilities, (ii) increased earnings in the Market-Based Businesses due to the lower U.S. federal corporate income tax rate, all partially offset by (iii) the lower tax shield on interest expense at parent company, as well as increased debt levels from lower cash flows from operations as the Company passes the lower tax rate benefits to its regulated customers. The Company believes that it will likely begin paying federal income taxes during 2020, when the Company expects its federal NOL carryforwards balance will be fully used, although this timing could be impacted by any significant changes in its future results of operations and the outcome of regulatory proceedings regarding the TCJA.
Cash flows provided by operating activities have been a reliable, steady source of funding, sufficient to meet operating requirements and fund the majority of the Company’s capital investments. The Company expects to seek access to debt and equity capital markets to meet the balance of its capital investment, if any, and fund its dividend payments, as needed. Operating cash flows can be negatively affected by changes in the Company’s rate regulated environments, changes in the Market-Based Businesses, changes in the economy, interest rates, the timing of tax payments, and the Company’s customers’ ability to pay for service in a timely manner, among other items. The Company can provide no assurance that its customers’ historical payment pattern will continue in the future. The Company’s current liabilities may exceed current assets mainly from debt maturities due within one year and the periodic use of short-term debt as a funding source, primarily to meet scheduled maturities of long-term debt, fund acquisitions and construction projects, as well as cash needs which can fluctuate significantly due to the seasonality of the business. The Company addresses cash timing differences through the aforementioned liquidity funding mechanisms.
Presented in the table below is a summary of the major items affecting the Company’s cash flows provided by operating activities:
| For the Years Ended December 31, | |||||||||||
| (In millions) | 2019 | 2018 | 2017 | ||||||||
| Net income | $ | 621 | $ | 565 | $ | 426 | |||||
| Add (less): | |||||||||||
| Depreciation and amortization | 582 | 545 | 492 | ||||||||
| Deferred income taxes and amortization of investment tax credits | 208 | 195 | 462 | ||||||||
| Non-cash impairment charge | — | 57 | — | ||||||||
| Other non-cash activities (a) | 38 | 56 | 16 | ||||||||
| Changes in working capital (b) | (1 | ) | 30 | 123 | |||||||
| Settlement of cash flow hedges | (30 | ) | — | — | |||||||
| Pension and postretirement healthcare contributions | (31 | ) | (22 | ) | (48 | ) | |||||
| Impact of Freedom Industries settlement activities | (4 | ) | (40 | ) | (22 | ) | |||||
| Net cash flows provided by operating activities | $ | 1,383 | $ | 1,386 | $ | 1,449 |
| (a) | Includes provision for losses on accounts receivable, loss (gain) on asset dispositions and purchases, pension and non-pension postretirement benefits and other non-cash, net. Details of each component can be found on the Consolidated Statements of Cash Flows. |
| (b) | Changes in working capital include changes to receivables and unbilled revenues, accounts payable and accrued liabilities, and other current assets and liabilities, net, less the settlement of cash flow hedges. |
In 2019, cash flows provided by operating activities decreased $3 million, primarily due to the settlement of cash flow hedges and increased interest costs in connection with the Company’s $1.10 billion debt offering that closed on May 13, 2019 and an increase in pension contributions. Partially offsetting these decreases was an increase in net income. The main factors contributing to the increase in net income are described in “Consolidated Results of Operations” and “Segment Results of Operations” above.
The Company expects to make pension contributions to the plan trusts of $38 million in 2020. In addition, the Company estimates that contributions will amount to $33 million, $34 million, $34 million and $32 million in 2021, 2022, 2023 and 2024, respectively. Actual amounts contributed could change materially from these estimates as a result of changes in assumptions and actual investment returns, among other factors.
Cash Flows Used in Investing Activities
Presented in the table below is a summary of the major items affecting the Company’s cash flows used in investing activities:
| For the Years Ended December 31, | |||||||||||
| (In millions) | 2019 | 2018 | 2017 | ||||||||
| Capital expenditures | $ | (1,654 | ) | $ | (1,586 | ) | $ | (1,434 | ) | ||
| Acquisitions, net of cash acquired | (235 | ) | (398 | ) | (177 | ) | |||||
| Proceeds from sale of assets | 48 | 35 | 15 | ||||||||
| Removal costs from property, plant and equipment retirements, net | (104 | ) | (87 | ) | (76 | ) | |||||
| Net cash flows used in investing activities | $ | (1,945 | ) | $ | (2,036 | ) | $ | (1,672 | ) |
In 2019, cash flows used in investing activities decreased $91 million primarily due to the acquisition of Pivotal for $365 million on June 4, 2018, partially offset by an increase in capital expenditures, principally from incremental investments associated with the replacement and renewal of the Company’s transmission and distribution infrastructure in the Regulated Businesses, as discussed below. The Company also had an increase of proceeds from sale of assets due to the sale of Keystone for $31 million, in the fourth quarter of 2019.
The Company’s infrastructure investment plan consists of both infrastructure renewal programs, where the Company replaces infrastructure, as needed, and major capital investment projects, where the Company constructs new water and wastewater treatment and delivery facilities to meet new customer growth and water quality regulations. The Company’s projected capital expenditures and other investments are subject to periodic review and revision to reflect changes in economic conditions and other factors.
Presented in the table below is a summary of the Company’s historical capital expenditures related to the upgrading of its infrastructure and systems:
| For the Years Ended December 31, | |||||||||||
| (In millions) | 2019 | 2018 | 2017 | ||||||||
| Transmission and distribution | $ | 661 | $ | 572 | $ | 551 | |||||
| Treatment and pumping | 190 | 231 | 171 | ||||||||
| Services, meter and fire hydrants | 346 | 303 | 281 | ||||||||
| General structure and equipment | 234 | 371 | 281 | ||||||||
| Sources of supply | 83 | 26 | 54 | ||||||||
| Wastewater | 140 | 83 | 96 | ||||||||
| Total capital expenditures | $ | 1,654 | $ | 1,586 | $ | 1,434 |
In 2019, the Company’s capital expenditures increased $68 million primarily due to investment in transmission and distribution infrastructure.
The Company also grows its business primarily through acquisitions of water and wastewater systems, as well as other water-related services. These acquisitions are complementary to the Company’s existing business and support continued geographical diversification and growth of its operations. Generally, acquisitions are funded initially with short-term debt, and later refinanced with the proceeds from long-term debt, once reflected in rate base.
The following is a summary of the acquisitions and dispositions affecting the Company’s cash flows from investing activities during 2019:
| • | Paid $235 million for 21 water and wastewater systems, representing in the aggregate approximately 53,100 customers. |
| • | Received $48 million for the sale of assets, including $31 million from the sale of the Keystone operations. |
As previously noted, the Company expects to invest between $8.8 billion to $9.4 billion from 2020 to 2024, with $8.2 billion of this range for infrastructure improvements in the Regulated Businesses, and between $20 billion to $22 billion from 2020 to 2029. In 2020, the Company expects to invest between a range of $1.7 billion to $1.9 billion in 2020, with $1.6 billion for infrastructure improvements in the Regulated Businesses. Also in 2020, the Company expects to invest between $100 million to $300 million for acquisitions in the Regulated Businesses.
Cash Flows from Financing Activities
Presented in the table below is a summary of the major items affecting the Company’s cash flows provided by financing activities:
| For the Years Ended December 31, | |||||||||||
| 2019 | 2018 | 2017 | |||||||||
| (In millions) | |||||||||||
| Proceeds from long-term debt | $ | 1,530 | $ | 1,358 | $ | 1,395 | |||||
| Repayments of long-term debt | (495 | ) | (526 | ) | (896 | ) | |||||
| Net short-term borrowings | (178 | ) | 60 | 55 | |||||||
| Proceeds from issuance of common stock | — | 183 | — | ||||||||
| Dividends paid | (353 | ) | (319 | ) | (289 | ) | |||||
| Anti-dilutive stock repurchases | (36 | ) | (45 | ) | (54 | ) | |||||
| Other financing activities, net (a) | 26 | 15 | (4 | ) | |||||||
| Net cash flows provided by financing activities | $ | 494 | $ | 726 | $ | 207 |
| (a) | Includes proceeds from issuances of common stock under various employee stock plans and the dividend reinvestment plan, net of taxes paid, advances and contributions for construction, net of refunds, and debt issuance costs and make-whole premiums on early debt redemption. |
In 2019, cash flows provided by financing activities decreased $232 million, primarily due to the issuance of common stock in 2018, the proceeds of which were used to finance a portion of the 2018 acquisition of Pivotal, as well as an increase in cash used for dividend payments in 2019. AWCC issued $1.10 billion of long-term debt as part of its May 13, 2019 debt offering, of which $51 million of the net proceeds was used to repay long-term debt obligations at maturity. Net proceeds from the debt offering were also used to repay pre-existing short-term borrowings, which resulted in a net cash outflow for 2019 of $178 million.
The Company’s financing activities, primarily focused on funding regulated infrastructure expenditures, regulated and market-based acquisitions and payment of dividends. These activities included the issuance of long-term and short-term debt, primarily through AWCC and in 2018, included an equity issuance for approximately 50% of the Pivotal acquisition. In addition, new infrastructure may be funded with customer advances and contributions in aid of construction, net of refunds, which amounted to $26 million, $21 million and $28 million for the years ended December 31, 2019, 2018 and 2017, respectively. Based on the needs of the Regulated Businesses and the Company, AWCC may borrow funds or issue its debt in the capital markets and then, through intercompany loans, provide those borrowings to the Regulated Businesses and parent company. The Regulated Businesses and parent company are obligated to pay their portion of the respective principal and interest to AWCC, in the amount necessary to enable AWCC to meet its debt service obligations. Parent company’s borrowings are not a source of capital for the Regulated Businesses, therefore, parent company is not able to recover the interest charges on its debt through regulated water and wastewater rates. As of December 31, 2019, AWCC has made long-term fixed rate loans and commercial paper loans to the Regulated Businesses amounting to $4.8 billion and $675 million, respectively. Additionally, as of December 31, 2019, AWCC has made long-term fixed rate loans and commercial paper loans to parent company amounting $2.4 billion and $111 million, respectively. As of December 31, 2019, parent company has made long-term fixed rate loans to the Market-Based Businesses amounting to $183 million related to the acquisition of Pivotal on June 4, 2018.
On May 13, 2019, AWCC completed a $1.10 billion senior unsecured debt offering which included the sale of $550 million aggregate principal amount of its 3.45% Senior Notes due 2029 and $550 million aggregate principal amount of its 4.15% Senior Notes due 2049. At the closing of the offering, AWCC received, after deduction of underwriting discounts and before deduction of offering expenses, net proceeds of approximately $1.09 billion. AWCC used the net proceeds to: (i) lend funds to parent company and its regulated subsidiaries; (ii) repay $25 million principal amount of AWCC’s 7.21% Series I Senior Notes at maturity on May 19, 2019; (iii) repay $26 million aggregate principal amount of subsidiary debt at maturity during the second quarter of 2019; and (iv) repay AWCC’s commercial paper obligations, and for general corporate purposes.
On May 6, 2019, the Company terminated five forward starting swap agreements with an aggregate notional amount of $510 million, realizing a net loss of $30 million, to be amortized through interest, net over 10 and 30 year periods, in accordance with the terms of the new debt issued on May 13, 2019. No ineffectiveness was recognized on hedging instruments for the years ended December 31, 2019 and 2018.
During 2019, AWCC and certain of the Company’s subsidiaries also issued tax-exempt bonds at various dates with a total principal amount of $417 million and a weighted average interest rate of 2.5%. The bonds are scheduled to mature in 2039 and contain optional or mandatory redemption dates in 2029. The proceeds from these bonds were used to repay $417 million of tax-exempt bonds with a weighted average interest rate of 5.8% and original maturities in 2039.
One of the principal market risks to which the Company is exposed is changes in interest rates. In order to manage the exposure, the Company follows risk management policies and procedures, including the use of derivative contracts such as swaps. The Company reduces exposure to interest rates by managing commercial paper and debt maturities. The Company does not enter into derivative contracts for speculative purposes and does not use leveraged instruments. The derivative contracts entered into are for periods consistent with the related underlying exposures. The Company is exposed to the risk that counterparties to derivative contracts will fail to meet their contractual obligations. The Company minimizes the counterparty credit risk on these transactions by only dealing with leading, credit-worthy financial institutions, having long-term credit ratings of “A” or better.
In May 2018, parent company and AWCC filed with the SEC a universal shelf registration statement that enables the Company to meet its capital needs through the offer and sale to the public from time to time of an unlimited amount of various types of securities, including American Water common stock, preferred stock, and other equity and hybrid securities, and AWCC debt securities, all subject to market conditions and demand, general economic conditions, and as applicable, rating status. The shelf registration statement will expire in May 2021. During 2019, 2018 and 2017, $1.10 billion, $1.33 billion, and $1.35 billion, respectively, of debt securities were issued pursuant to this and the Company’s predecessor registration statement. Additionally, during 2018 under this registration statement, the Company issued 2.32 million shares of its common stock for aggregate net proceeds of $183 million.
Presented in the table below are the issuances of long-term debt in 2019:
| Company | Type | Rate | Maturity | Amount (in millions) | ||||||
| AWCC (a) | Senior notes—fixed rate | 3.45%-4.15% | 2029-2049 | $ | 1,100 | |||||
| AWCC (a) (b) | Private activity bonds and government funded debt—fixed rate | 2.45% | 2039 | 100 | ||||||
| Other American Water subsidiaries | Private activity bonds and government funded debt—fixed rate | 0.00%-5.00% | 2021-2048 | 330 | ||||||
| Total issuances | $ | 1,530 |
| (a) | This indebtedness is considered “debt” for purposes of a support agreement between parent company and AWCC, which serves as a functional equivalent of a guarantee by parent company of AWCC’s payment obligations under such indebtedness. |
| (b) | This indebtedness has a mandatory redemption provision callable in 2029. |
Presented in the table below are the retirements and redemptions of long-term debt in 2019 through sinking fund provisions, optional redemption or payment at maturity:
| Company | Type | Rate | Maturity | Amount (in millions) | ||||||
| AWCC | Private activity bonds and government funded debt—fixed rate | 1.79%-6.25% | 2021-2031 | $ | 101 | |||||
| AWCC | Senior notes—fixed rate | 7.21% | 2019 | 25 | ||||||
| Other American Water subsidiaries | Private activity bonds and government funded debt—fixed rate | 0.00%-6.20% | 2019-2048 | 333 | ||||||
| Other American Water subsidiaries | Mortgage bonds—fixed rate | 5.48%-9.13% | 2019-2021 | 28 | ||||||
| Other American Water subsidiaries | Mandatorily redeemable preferred stock | 8.49%-9.18% | 2031-2036 | 2 | ||||||
| Other American Water subsidiaries | Term loan | 5.76%-5.81% | 2021 | 6 | ||||||
| Total retirements and redemptions | $ | 495 |
From time to time and as market conditions warrant, the Company may engage in long-term debt retirements through tender offers, open market repurchases or other viable alternatives.
In February 2015, the Board of Directors authorized an anti-dilutive stock repurchase program to mitigate the dilutive effect of shares issued through the Company’s dividend reinvestment, employee stock purchase and executive compensation activities. The program allows the Company to purchase up to 10 million shares of its outstanding common stock from time to time over an unrestricted period of time in the open market or through privately negotiated transactions. The program is conducted in accordance with Rule 10b-18 of the Exchange Act, and, to facilitate these repurchases, the Company enters into Rule 10b5-1 stock repurchase plans with a third-party broker, which allow the Company to repurchase shares of its common stock at times when it otherwise might be prevented from doing so under insider trading laws or because of self-imposed trading blackout periods. Subject to applicable regulations, the Company may, at its discretion, elect to enter into repurchase transactions or to amend or cancel the program or the stock repurchase parameters, all to manage dilution from the issuance of shares as described above. As of December 31, 2019, the Company has repurchased an aggregate of 4,860,000 shares of common stock under this program.
Credit Facilities and Short-Term Debt
AWCC has an unsecured revolving credit facility of $2.25 billion that expires in March 2024. In April 2019, AWCC and its lenders agreed to extend the termination date of the credit agreement with respect to AWCC’s revolving credit facility pursuant to its terms from March 2023 to March 2024. Subject to satisfying certain conditions, the credit agreement also permits AWCC to increase the maximum commitment under the facility by up to an aggregate of $500 million, and to request extensions of its expiration date for up to two, one-year periods, as to which one such extension request remains.
Interest rates on advances under the facility are based on a credit spread to the LIBOR rate (or applicable market replacement rate) or base rate in accordance with Moody Investors Service’s and Standard & Poor’s Financial Services’ then applicable credit rating on AWCC’s senior unsecured, non-credit enhanced debt. The facility is used principally to support AWCC’s commercial paper program and to provide up to $150 million in letters of credit. Indebtedness under the facility is considered “debt” for purposes of a support agreement between parent company and AWCC, which serves as a functional equivalent of a guarantee by parent company of AWCC’s payment obligations under the credit facility.
In March 2018, AWCC increased the maximum aggregate outstanding amount under its commercial paper program from $1.60 billion to $2.10 billion.
Presented in the table below is the aggregate credit facility commitments, letter of credit sublimit under the revolving credit facility and commercial paper limit, as well as the available capacity for each as of December 31, 2019 and 2018:
| (In millions) | Credit Facility Commitment | Available Credit Facility Capacity | Letter of Credit Sublimit | Available Letter of Credit Capacity | Commercial Paper Limit | Available Commercial Paper Capacity | |||||||||||||||||
| December 31, 2019 | $ | 2,250 | $ | 2,174 | $ | 150 | $ | 74 | $ | 2,100 | $ | 1,314 | |||||||||||
| December 31, 2018 | 2,262 | 2,177 | 150 | 69 | 2,100 | 1,146 |
The weighted average interest rate on AWCC short-term borrowings for the years ended December 31, 2019 and 2018 was approximately 2.54% and 2.28%, respectively.
Capital Structure
Presented in the table below is the percentage of the Company’s capitalization represented by the components of its capital structure as of December 31:
| 2019 | 2018 | 2017 | ||||||
| Total common shareholders’ equity | 39.2 | % | 40.4 | % | 41.0 | % | ||
| Long-term debt and redeemable preferred stock at redemption value | 55.6 | % | 52.4 | % | 49.6 | % | ||
| Short-term debt and current portion of long-term debt | 5.2 | % | 7.2 | % | 9.4 | % | ||
| Total | 100 | % | 100 | % | 100 | % |
The changes in the capital structure between periods were mainly attributable to an increase in long-term debt.
Debt Covenants
The Company’s debt agreements contain financial and non-financial covenants. To the extent that the Company is not in compliance with these covenants, an event of default may occur under one or more debt agreements and the Company or its subsidiaries may be restricted in its ability to pay dividends, issue new debt or access the revolving credit facility. The long-term debt indentures contain a number of covenants that, among other things, prohibit or restrict the Company from issuing debt secured by the Company’s assets, subject to certain exceptions. Failure to comply with any of these covenants could accelerate repayment obligations.
Covenants in certain long-term notes and the revolving credit facility require the Company to maintain a ratio of consolidated debt to consolidated capitalization (as defined in the relevant documents) of not more than 0.70 to 1.00. On December 31, 2019, the Company’s ratio was 0.61 to 1.00 and therefore the Company was in compliance with the covenants.
Security Ratings
Presented in the table below are long-term and short-term credit ratings and rating outlooks as of February 18, 2020 as issued by the following rating agencies:
| Securities | Moody’s Investors Service | Standard & Poor’s Ratings Service | ||
| Rating Outlook | Stable | Stable | ||
| Senior unsecured debt | Baa1 | A | ||
| Commercial paper | P-2 | A-1 |
On June 7, 2019, Standard & Poor’s Ratings Service affirmed the Company’s long-term ‘A’ and short-term ‘A-1’ credit ratings, with a stable outlook.
On April 1, 2019, Moody’s Investors Service changed the Company’s senior unsecured debt rating to Baa1, from A3, with a stable outlook. The Company’s commercial paper rating remained unchanged.
A security rating is not a recommendation to buy, sell or hold securities and may be subject to revision or withdrawal at any time by the assigning rating agency, and each rating should be evaluated independently of any other rating. Security ratings are highly dependent upon the ability to generate cash flows in an amount sufficient to service debt and meet investment plans. The Company can provide no assurances that its ability to generate cash flows is sufficient to maintain its existing ratings. None of the Company’s borrowings are subject to default or prepayment as a result of the downgrading of these security ratings, although such a downgrading could increase fees and interest charges under its credit facility.
As part of its normal course of business, the Company routinely enters into contracts for the purchase and sale of water, energy, chemicals and other services. These contracts either contain express provisions or otherwise permit the Company and its counterparties to demand adequate assurance of future performance when there are reasonable grounds for doing so. In accordance with the contracts and applicable contract law, if the Company is downgraded by a credit rating agency, especially if such downgrade is to a level below investment grade, it is possible that a counterparty would attempt to rely on such a downgrade as a basis for making a demand for adequate assurance of future performance, which could include a demand that the Company must provide collateral to secure its obligations. The Company does not expect to post any collateral which will have a material adverse impact on the Company’s results of operations, financial position or cash flows.
Access to the capital markets, including the commercial paper market, and respective financing costs in those markets, may be directly affected by the Company’s securities ratings. The Company primarily accesses the debt capital markets, including the commercial paper market, through AWCC. However, the Company has also issued debt through its regulated subsidiaries, primarily in the form of tax exempt securities or borrowings under state revolving funds, to lower the overall cost of debt.
Dividends and Regulatory Restrictions
For discussion of the Company’s dividends, dividend restrictions and dividend policy, see Note 9—Shareholders’ Equity in the Notes to Consolidated Financial Statements for additional information.
Insurance Coverage
The Company carries various property, casualty, cyber and financial insurance policies with limits, deductibles and exclusions that it believes are consistent with industry standards. However, insurance coverage may not be adequate or available to cover unanticipated losses or claims. Additionally, annual policy renewals can be impacted by claims experience which in turn can impact coverage terms and conditions on a going-forward basis. The Company is self-insured to the extent that losses are within the policy deductible or exceed the amount of insurance maintained. Such losses could have a material adverse effect on the Company’s short-term and long-term financial condition and its results of operations and cash flows.
Contractual Obligations and Commitments
The Company enters into contractual obligations with third parties in the ordinary course of business. Presented in the table below is information related to its contractual obligations as of December 31, 2019:
| (In millions) | Total | 1 year or less | 2-3 years | 4-5 years | More than 5 years | ||||||||||||||
| Long-term debt obligations (a) | $ | 8,692 | $ | 28 | $ | 324 | $ | 632 | $ | 7,708 | |||||||||
| Interest on long-term debt (b) | 6,064 | 375 | 726 | 685 | 4,278 | ||||||||||||||
| Operating lease obligations (c) | 152 | 14 | 24 | 14 | 100 | ||||||||||||||
| Purchase water obligations (d) | 912 | 65 | 130 | 112 | 605 | ||||||||||||||
| Other purchase obligations (e) | 915 | 915 | — | — | — | ||||||||||||||
| Pension plan obligations (f) | 171 | 38 | 67 | 66 | — | ||||||||||||||
| Other obligations (g) | 1,055 | 465 | 245 | 69 | 276 | ||||||||||||||
| Total | $ | 17,961 | $ | 1,900 | $ | 1,516 | $ | 1,578 | $ | 12,967 |
| NOTE | The above table reflects only financial obligations and commitments. Therefore, performance obligations associated with the Company’s Market-Based Businesses are not included in the above amounts. Also, uncertain tax positions of $110 million are not reflected in this table as the Company cannot predict when open tax years will close with completed examinations. See Note 14—Income Taxes in the Notes to Consolidated Financial Statements. |
| (a) | Represents sinking fund obligations, debt maturities, finance lease obligations and preferred stocks with mandatory redemption requirements. |
| (b) | Represents expected interest payments on outstanding long-term debt and interest on preferred stock with mandatory redemption requirements. Amounts reported may differ from actual due to future financing of debt. |
| (c) | Represents future minimum payments under non-cancelable operating leases, primarily for the lease of motor vehicles, buildings, land and other equipment including water facilities and systems constructed by partners under public-private partnerships. For discussion of the Company’s public-private partnerships, see Note 19—Leases in the Notes to Consolidated Financial Statements. |
| (d) | Represents future payments under water purchase agreements for minimum quantities of water. |
| (e) | Represents the open purchase orders as of December 31, 2019 for goods and services purchased in the ordinary course of business. |
| (f) | Represents contributions expected to be made to the Company’s pension plans for the years 2020 through 2024. |
| (g) | Includes an estimate of advances for construction to be refunded, capital expenditures estimated to be required under legal and binding contractual obligations, contracts entered into for energy purchases, a liability associated with a conservation agreement, and service agreements. |
Performance Obligations
The Company has entered into agreements for the provision of services to water and wastewater facilities for the U.S. military, municipalities and other customers. These obligations are not included in the table above. For discussion of the Company’s performance obligations see Note 3—Revenue Recognition in the Notes to Consolidated Financial Statements for additional information.
Critical Accounting Policies and Estimates
The preparation of financial statements in conformity with GAAP requires that management apply accounting policies and make estimates, assumptions and judgments that could affect the Company’s financial condition, results of operations and cash flows. Actual results could differ from these estimates, assumptions and judgments. Management believes that the areas described below require significant judgment in the application of accounting policy or in making estimates and assumptions in matters that are inherently uncertain and that may change in subsequent periods. Accordingly, changes in the estimates, assumptions and judgments applied to these accounting policies could have a significant impact on the Company’s financial condition, results of operations and cash flows, as reflected in the Company’s Consolidated Financial Statements. Management has reviewed the critical accounting polices described below with the Company’s Audit, Finance and Risk Committee, including the estimates, assumptions and judgments used in their application. Additional discussion regarding these critical accounting policies and their application can be found in Note 2—Significant Accounting Policies in the Notes to Consolidated Financial Statements.
Regulation and Regulatory Accounting
The Company’s regulated utilities are subject to regulation by PUCs and, as such, the Company follows the authoritative accounting principles required for rate regulated utilities, which requires the Company to reflect the effects of rate regulation in its Consolidated Financial Statements. Use of this authoritative guidance is applicable to utility operations that meet the following criteria: (i) third-party regulation of rates; (ii) cost-based rates; and (iii) a reasonable assumption that rates will be set to recover the estimated costs of providing service, plus a return on net investment, or rate base. As of December 31, 2019, the Company concluded that the operations of its utilities met the criteria.
Application of this authoritative guidance has a further effect on the Company’s financial statements as it pertains to allowable costs used in the ratemaking process. The Company makes significant assumptions and estimates to quantify amounts recorded as regulatory assets and liabilities. Such judgments include, but are not limited to, assets and liabilities related to regulated acquisitions, pension and postretirement benefits, depreciation rates and taxes. Due to timing and other differences in the collection of revenues, these authoritative accounting principles allow a cost that would otherwise be charged as an expense by a non-regulated entity, to be deferred as a regulatory asset if it is probable that such cost is recoverable through future rates. Conversely, the principles require the creation of a regulatory liability for amounts collected in rates to recover costs expected to be incurred in the future, or amounts collected in excess of costs incurred and are refundable to customers.
For each regulatory jurisdiction where the Company conducts business, the Company assesses, at the end of each reporting period, whether the regulatory assets continue to meet the criteria for probable future recovery and regulatory liabilities continue to meet the criteria for probable future settlement. This assessment includes consideration of factors such as changes in regulatory environments, recent rate orders (including recent rate orders on recovery of a specific or similar incurred cost to other regulated entities in the same jurisdiction) and the status of any pending or potential legislation. If subsequent events indicate that the regulatory assets or liabilities no longer meet the criteria for probable future recovery or probable future settlement, the Company’s Consolidated Statements of Operations and financial position could be materially affected. In addition, if the Company concludes in a future period that a separable portion of the business no longer meets the criteria, the Company is required to eliminate the financial statement effects of regulation for that part of the business, which would include the elimination of any or all regulatory assets and liabilities that had been recorded in the Consolidated Financial Statements. Failure to meet the criteria of this authoritative guidance could materially impact the Company’s Consolidated Financial Statements.
On December 22, 2017, the TCJA was signed into law, which, among other things, enacted significant and complex changes to the Code, including a reduction in the maximum U.S. federal corporate income tax rate from 35% to 21% as of January 1, 2018. The TCJA created significant excess deferred income taxes that the Company and its regulatory jurisdictions believe should be refunded to customers. As such, the Company recorded these amounts as regulatory liabilities.
As of December 31, 2019 and 2018, the Company’s regulatory asset balance was $1.1 billion and $1.2 billion, respectively, and its regulatory liability balance was $1.8 billion and $1.9 billion, respectively. See Note 7—Regulatory Assets and Liabilities in the Notes to Consolidated Financial Statements for further information regarding the Company’s significant regulatory assets and liabilities.
Revenue Recognition
Revenue from the Company’s Regulated Businesses is generated primarily from water and wastewater services delivered to customers. These contracts contain a single performance obligation, the delivery of water or wastewater services, as the promise to transfer the individual good or service is not separately identifiable from other promises within the contracts and, therefore, is not distinct. Revenues are recognized over time, as services are provided. There are generally no significant financing components or variable consideration. Revenues include amounts billed to customers on a cycle basis, and unbilled amounts calculated based on estimated usage from the date of the meter reading associated with the latest customer bill, to the end of the accounting period. The amounts that the Company has a right to invoice are determined by each customer’s actual usage, an indicator that the invoice amount corresponds directly to the value transferred to the customer.
Increases or decreases in the volumes delivered to customers and rate mix due to changes in usage patterns in customer classes in the period could be significant to the calculation of unbilled revenue. In addition, changes in the timing of meter reading schedules and the number and type of customers scheduled for each meter reading date would also have an effect on the unbilled revenue calculation. Unbilled revenue for the Company’s regulated utilities as of December 31, 2019 and 2018 was $142 million and $144 million, respectively.
The Company also recognizes revenue when it is probable that future recovery of previously incurred costs or future refunds that are to be credited to customers will occur through the ratemaking process.
Revenue from the Company’s Homeowner Services Group is generated through various protection programs in which the Company provides fixed fee services to domestic homeowners and smaller commercial customers for interior and external water and sewer lines, interior electric and gas lines, heating and cooling systems, water heaters, power surge protection and other related services. Most of the contracts have a one-year term and each service is a separate performance obligation, satisfied over time, as the customers simultaneously receive and consume the benefits provided from the service. Customers are obligated to pay for the protection programs ratably over 12 months or via a one-time, annual fee, with revenues recognized ratably over time for these services. Advances from customers are deferred until the performance obligation is satisfied.
The Company also has long-term, fixed fee contracts to operate and maintain water and wastewater systems for the U.S. government on various military installations and facilities owned by municipal and industrial customers, and prior to the sale of Keystone, the Company had shorter-term contracts that provided customized water transfer services for shale natural gas companies and customers. Billing and revenue recognition for the fixed fee revenues occurs ratably over the term of the contract, as customers simultaneously receive and consume the benefits provided by the Company. Additionally, these contracts allow the Company to make capital improvements to underlying infrastructure, which are initiated through separate modifications or amendments to the original contract, whereby stand-alone, fixed pricing is separately stated for each improvement. The Company has determined that these capital improvements are separate performance obligations, with revenue recognized over time based on performance completed at the end of each reporting period. Losses on contracts are recognized during the period in which the losses first become probable and estimable. Revenues recognized during the period in excess of billings on construction contracts are recorded as unbilled revenues, with billings in excess of revenues recorded as other current liabilities until the recognition criteria are met. Changes in contract performance and related estimated contract profitability may result in revisions to costs and revenues, and are recognized in the period in which revisions are determined. Unbilled revenue for the Market-Based Businesses as of December 31, 2019 and 2018 was $30 million and $42 million, respectively.
Accounting for Income Taxes
Significant management judgment is required in determining the provision for income taxes, primarily due to the uncertainty related to tax positions taken, as well as deferred tax assets and liabilities, valuation allowances and the utilization of NOL carryforwards.
In accordance with applicable authoritative guidance, the Company accounts for uncertain income tax positions using a benefit recognition model with a two-step approach, including a more-likely-than-not recognition threshold and a measurement approach based on the largest amount of tax benefit that is greater than 50% likely of being realized upon ultimate settlement. If it is not more-likely-than-not that the benefit of the tax position will be sustained on its technical merits, no benefit is recorded. Uncertain tax positions that relate only to timing of when an item is included on a tax return are considered to have met the recognition threshold. Management evaluates each position based solely on the technical merits and facts and circumstances of the position, assuming the position will be examined by a taxing authority having full knowledge of all relevant information. Significant judgment is required to determine whether the recognition threshold has been met and, if so, the appropriate amount of unrecognized tax benefit to be recorded in the Consolidated Financial Statements.
The Company evaluates the probability of realizing deferred tax assets quarterly by reviewing a forecast of future taxable income and its intent and ability to implement tax planning strategies, if necessary, to realize deferred tax assets. The Company also assesses its ability to utilize tax attributes, including those in the form of carryforwards, for which the benefits have already been reflected in the financial statements. The Company records valuation allowances for deferred tax assets when it concludes that it is more-likely-than-not such benefit will not be realized in future periods.
Under GAAP, specifically Accounting Standards Codification Topic 740, Income Taxes (“ASC 740”), the tax effects of changes in tax laws must be recognized in the period in which the law is enacted. ASC 740 also requires deferred tax assets and liabilities to be measured at the enacted tax rate expected to apply when temporary differences are to be realized or settled. Thus, at the date of enactment of the TCJA, the Company’s deferred taxes were re-measured based upon the new tax rate. For the Company’s regulated entities, the change in deferred taxes are recorded as either an offset to a regulatory asset or liability and may be subject to refund to customers. For the Company’s unregulated operations, the change in deferred taxes are recorded as a non-cash re-measurement adjustment to earnings.
Actual income taxes could vary from estimated amounts due to the future impacts of various items, including changes in income tax laws, the Company’s forecasted financial condition and results of operations, failure to successfully implement tax planning strategies and recovery of taxes through the regulatory process for the Regulated Businesses, as well as results of audits and examinations of filed tax returns by taxing authorities. The resulting tax balances as of December 31, 2019 and 2018 are appropriately accounted for in accordance with the applicable authoritative guidance; however, the ultimate outcome of tax matters could result in favorable or unfavorable adjustments to the Consolidated Financial Statements and such adjustments could be material. See Note 14—Income Taxes in the Notes to Consolidated Financial Statements for additional information regarding income taxes.
Accounting for Pension and Postretirement Benefits
The Company maintains noncontributory defined benefit pension plans covering eligible employees of its regulated utility and shared service operations. See Note 15—Employee Benefits in the Notes to Consolidated Financial Statements for additional information regarding the description of and accounting for the defined benefit pension plans and postretirement benefit plans.
The Company’s pension and postretirement benefit costs are developed from actuarial valuations. Inherent in these valuations are key assumptions provided by the Company to its actuaries, including the discount rate and expected long-term rate of return on plan assets. Material changes in the Company’s pension and postretirement benefit costs may occur in the future due to changes in these assumptions as well as fluctuations in plan assets. The assumptions are selected to represent the average expected experience over time and may differ in any one year from actual experience due to changes in capital markets and the overall economy. These differences will impact the amount of pension and other postretirement benefit expense that the Company recognizes. The primary assumptions are:
| • | Discount Rate—The discount rate is used in calculating the present value of benefits, which are based on projections of benefit payments to be made in the future. The objective in selecting the discount rate is to measure the single amount that, if invested at the measurement date in a portfolio of high-quality debt instruments, would provide the necessary future cash flows to pay the accumulated benefits when due. |
| • | Expected Return on Plan Assets (“EROA”)—Management projects the future return on plan assets considering prior performance, but primarily based upon the plans’ mix of assets and expectations for the long-term returns on those asset classes. These projected returns reduce the net benefit costs the Company records currently. |
| • | Rate of Compensation Increase—Management projects employees’ pay increases, which are used to project employees’ pension benefits at retirement. |
| • | Health Care Cost Trend Rate—Management projects the expected increases in the cost of health care. |
| • | Mortality—Management retained the Society of Actuaries RP-2014 mortality base table, which provides rates of mortality in 2006, but adopted the new MP-2018 mortality improvement scale to gradually adjust future mortality rates downward due to increased longevity in each year after 2006. |
The discount rate assumption, which is determined for the pension and postretirement benefit plans independently, is subject to change each year, consistent with changes in applicable high-quality, long-term corporate bond indices. The Company uses an approach that approximates the process of settlement of obligations tailored to the plans’ expected cash flows by matching the plans’ cash flows to the coupons and expected maturity values of individually selected bonds. For each plan, the discount rate was developed as the level equivalent rate that would yield the same present value as using spot rates aligned with the projected benefit payments. The discount rate for determining pension benefit obligations was 3.44%, 4.38% and 3.75% at December 31, 2019, 2018 and 2017, respectively. The discount rate for determining other postretirement benefit obligations was 3.36%, 4.32% and 3.73% at December 31, 2019, 2018 and 2017, respectively.
In selecting an EROA, the Company considered tax implications, past performance and economic forecasts for the types of investments held by the plans. The long-term EROA assumption used in calculating pension cost was 6.20% for 2019, 5.95% for 2018, and 6.49% for 2017. The weighted average EROA assumption used in calculating other postretirement benefit costs was 3.56% for 2019, 4.77% for 2018 and 5.09% for 2017.
Presented in the table below are the allocations of the pension plan assets by asset category:
| 2020 Target Allocation | Percentage of Plan Assets as of December 31, | ||||||||
| Asset Category | 2019 | 2018 | |||||||
| Equity securities | 43 | % | 45 | % | 42 | % | |||
| Fixed income | 50 | % | 48 | % | 52 | % | |||
| Real Estate | 5 | % | 7 | % | 5 | % | |||
| Real estate investment trusts (“REITs”) | 2 | % | — | % | 1 | % | |||
| Total | 100 | % | 100 | % | 100 | % |
Postretirement Medical Bargaining Plan Changes
On July 31, 2018, a new, five-year national benefits agreement was ratified, covering approximately 3,200 of the Company’s union-represented employees. Most of the benefits under this new agreement became effective on January 1, 2019, and include, among other things, union-represented employees’ participation in the Company’s cash-based annual performance plan, additional medical plan options and changes to certain retiree medical benefits, which required the Company to remeasure its other postretirement benefit plan obligation during the third quarter of 2018.
For those eligible union retirees and dependents over age 65, the current supplemental retiree medical plan will be replaced with a Health Reimbursement Arrangement (“HRA”) similar to the cap currently in place for non-union retirees. The Company is providing a subsidy allowing the post-65 retirees to purchase a Medicare supplemental plan on a private exchange network. The pre-65 coverage plan was also amended to provide a cap on future employer costs designed to limit the employer costs to 2018 levels. For pre-65 union members retiring early in 2019-2021 a supplemental benefit will be provided to alleviate the effect of the cap.
On August 31, 2018, the Postretirement Medical Benefit Plan was remeasured to reflect this plan change. The plan change resulted in a $175 million reduction in future benefits payable to plan participants, and, in combination with other experience reflected as of the remeasurement date, resulted in a $227 million reduction to the net accumulated postretirement benefit obligation. The plan amendment will be amortized over 10.2 years, the average future working lifetime to full eligibility age for all plan participants.
After the remeasurement, the Retirement and Benefit Plans Investment Committee (the “Investment Committee”), which is responsible for overseeing the investment of the Company’s pension and other postretirement benefit plans’ assets, determined that the funded status of the Postretirement Medical Bargaining Plan was in excess of that needed to pay current and future benefits.
Given the change in funded status in 2018, the Investment Committee commissioned an asset-liability study for the Postretirement Medical Bargaining Plan. This study concluded that it was prudent to decrease the investment risk in the plan due to its current funded status. The study also recommended reducing its exposure to changes in interest rates by matching the assets of the plan to the projected cash flows for future benefit payments of the liability. The Investment Committee approved the recommendations. Plan assets in excess of those securities designed to match the long-term liabilities are invested in shorter duration fixed income securities and equities.
Presented in the table below are the allocations of the other postretirement benefit plan assets by asset category:
| 2020 Target Allocation (a) | Percentage of Plan Assets as of December 31, | ||||||||
| Asset Category | 2019 | 2018 | |||||||
| Equity securities | 17 | % | 17 | % | 17 | % | |||
| Fixed income | 83 | % | 83 | % | 83 | % | |||
| Total | 100 | % | 100 | % | 100 | % |
| (a) | Includes the American Water Postretirement Medical Benefits Bargaining Plan, the New York Water Service Corporation Postretirement Medical Benefits Bargaining Plan, the American Water Postretirement Medical Benefits Non-Bargaining Plan, and the American Water Life Insurance Trust. |
The investments of the pension and postretirement welfare plan trusts include debt and equity securities held either directly or through mutual funds, commingled funds and limited partnerships. The trustee for the Company’s defined benefit pension and postretirement welfare plans uses an independent valuation firm to calculate the fair value of plan assets.
In selecting a rate of compensation increase, the Company considers past experience in light of movements in inflation rates. The Company’s rate of compensation increase was 2.97% for 2019, 3.00% for 2018 and 3.02% for 2017.
In selecting health care cost trend rates, the Company considers past performance and forecasts of increases in health care costs. As of January 1, 2018, the Company’s health care cost trend rate assumption used to calculate the periodic cost was 6.75% in 2019 gradually declining to 5.00% in 2026 and thereafter. As of December 31, 2019, the Company is projecting that medical inflation will be 6.50% in 2020 gradually declining to 5.00% in 2026 and thereafter.
The Company will use a discount rate and EROA of 3.44% and 6.50%, respectively, for estimating its 2020 pension costs. Additionally, the Company will use a discount rate and expected blended return based on weighted assets of 3.36% and 3.68%, respectively, for estimating its 2020 other postretirement benefit costs. A decrease in the discount rate or the EROA would increase the Company’s pension expense. The Company’s 2019 and 2018 pension and postretirement benefit costs were $17 million and $21 million, respectively. The Company expects to make pension and postretirement benefit contributions to the plan trusts of $38 million in 2020, and $33 million, $34 million, $34 million and $32 million in 2021, 2022, 2023 and 2024, respectively. Actual amounts contributed could change significantly from these estimates. The assumptions are reviewed annually and at any interim re-measurement of the plan obligations. The impact of assumption changes is reflected in the recorded pension and postretirement benefit amounts as they occur, or over a period of time if allowed under applicable accounting standards.
Accounting for Contingencies
The Company records loss contingencies when management determines that the outcome of future events is probable of occurring and when the amount of the loss or a range of losses can be reasonably estimated. The determination of a loss contingency is based on management’s judgment and estimates about the likely outcome of the matter, which may include an analysis of different scenarios. Liabilities are recorded or adjusted when events or circumstances cause these judgments or estimates to change. In assessing whether a loss is reasonably possible, management considers many factors, which include, but are not limited to: the nature of the litigation, claim or assessment, review of applicable law, opinions or views of legal counsel and other advisors, and the experience gained from similar cases or situations. The Company provides disclosures for material contingencies when management deems there is a reasonable possibility that a loss or an additional loss may be incurred. The Company provides estimates of reasonably possible losses when such estimates may be reasonably determined, either as a single amount or within a reasonable range.
Actual amounts realized upon settlement or other resolution of loss contingencies may be different than amounts recorded and disclosed and could have a significant impact on the liabilities, revenue and expenses recorded on the Consolidated Financial Statements. See Note 16—Commitments and Contingencies in the Notes to Consolidated Financial Statements for additional information regarding contingencies.
New Accounting Standards
See Note 2—Significant Accounting Policies in the Notes to Consolidated Financial Statements for a description of recent accounting standards.
Previous: Item 6. SELECTED FINANCIAL DATA · Next: Item 7A. QUANTITATIVE AND QUALITATIVE DISCLOSURES ABOUT MARKET RISK