 filings.tools
Item 7. Management’s Discussion and Analysis of Financial Condition and Results of Operations
97K characters. Original on sec.gov · Markdown
Item 7. Management’s Discussion and Analysis of Financial Condition and Results of Operations
Management’s Discussion and Analysis of Financial Condition and Results of Operations (“MD&A”) is designed to provide a reader of our consolidated financial statements with a narrative from the perspective of our management on our financial condition, results of operations, liquidity and certain other factors that may affect our future results. Our MD&A should be read in conjunction with the other sections of this Annual Report on Form 10-K, including Part I, Item 1A: “Risk Factors”; Part II, Item 6: “Selected Financial Data”; and Part II, Item 8: “Financial Statements and Supplementary Data.” The various sections of this MD&A contain a number of forward-looking statements, all of which are based on our current expectations and could be affected by the uncertainties and risk factors described throughout this filing. The tables in the MD&A sections below are derived from exact numbers and may have immaterial rounding differences.
Executive Overview and Key Strategic Initiatives
Our core mission is to protect life through innovative technologies that make communities safer. We are the market leader in the development, manufacture and sale of conducted electrical weapons (“CEWs”) designed for use by law enforcement, corrections, military forces, private security personnel and by private individuals for personal defense. We are also the market leader in connected wearable on-officer cameras which utilize our cloud-based digital evidence management solution which is part of our Axon network that connects devices, apps and people to serve law enforcement. Our core goal is to have every officer in the world carry a TASER, deploy an Axon camera and be connected to the Axon network.
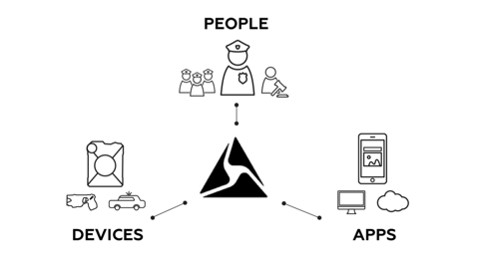
Our key strategies going into Fiscal 2017 are as follows:
| • | Devices: Launch innovative new products, scale Axon Fleet, scale existing Axon cameras and devices |
| • | Apps: Drive incremental usage, expand the product platform and deliver quality at scale |
| • | People: Drive network adoption, achieve full deployment, grow global markets and maximize service plans and product bundles. |
Execution of Our Strategy
Devices - Our TASER CEWs are one of the few weapons which can truly incapacitate a person without requiring death or serious injury. Over the past few decades, the TASER CEW has become one of the most frequently used weapons in the North American Law Enforcement Market, with injuries and deaths dropping dramatically as a result. Our Axon hardware products currently consist of our on-officer cameras that capture critical digital evidence aimed at protecting truth, a host of related accessory devices and an in-car camera variant which is in field testing preparing for 2017 launch. We believe our CEWs and Axon cameras should be standard issue equipment for all patrol officers domestically and internationally. We have created and are continuing to create service plans and product bundles to ensure agencies have the latest devices and technology at predictable annual costs.
Apps - The Axon Evidence.com platform is a central place for all agencies' digital evidence. It is an end-to-end solution for not only storing data, but also for efficiently managing and sharing that data. We are continuously seeking to develop new features such as secure sharing, audit trails, integration of other data sources, transcription and redaction services, among others. These feature sets are designed to provide the customers we serve with valuable tools to police more efficiently and effectively while enabling greater transparency with the communities in which they serve.
Our constant drive to develop innovative apps is evidenced by two recent strategic acquisitions. In December 2016, the Company launched a new artificial intelligence ("AI") group called "Axon AI." The Company acquired certain proprietary technology and
hired a team of researchers and engineers to accelerate the introduction of new AI-powered capabilities for public safety. The technology acquired is aimed at improving the accuracy, efficiency and speed of processing images and video to enable customers to gain more insight from video, photos and audio. In January 2017, the Company completed another transaction which included the acquisition of a computer-vision and deep learning system to make the visual contents in video searchable in real time. This acquisition will give customers the ability to quickly isolate and analyze the most important aspects of footage from large amounts of video data.
People - With our TASER weapons and Axon platform, we have created relationships with over 20,000 public safety agencies around the world. Some of our customers report that police officers are spending over 60% of their time on paperwork related tasks, rather than on value-add public safety work. The real opportunity is to leverage this connected platform to enable a broad suite of mobile, wearable, and data management capabilities to bring modern information technology capabilities to every law enforcement officer. Our technologies will not only allow our customers to spend more time on public safety work, but will allow for a capture to courtroom workflow of information. The ability to share files with prosecutors during discovery while maintaining a complete chain of custody and ensuring all evidence remains encrypted will provide a cohesive ecosystem that will deliver increased value to all stakeholders in the public safety and judicial communities.
Results of Operations
The following table presents data from our statements of operations as well as the percentage relationship to total net sales of items included in our statements of operations (dollars in thousands):
| Year Ended December 31, | ||||||||||||||||||||
| 2016 | 2015 | 2014 | ||||||||||||||||||
| Net sales | $ | 268,245 | 100.0 | % | $ | 197,892 | 100.0 | % | $ | 164,525 | 100.0 | % | ||||||||
| Cost of products sold and services delivered | 97,709 | 36.4 | 69,245 | 35.0 | 62,977 | 38.3 | ||||||||||||||
| Gross margin | 170,536 | 63.6 | 128,647 | 65.0 | 101,548 | 61.7 | ||||||||||||||
| Operating expenses: | ||||||||||||||||||||
| Sales, general and administrative | 108,076 | 40.3 | 69,698 | 35.2 | 54,158 | 32.9 | ||||||||||||||
| Research and development | 30,609 | 11.4 | 23,614 | 11.9 | 14,885 | 9.0 | ||||||||||||||
| Total operating expenses | 138,685 | 51.7 | 93,312 | 47.2 | 69,043 | 42.0 | ||||||||||||||
| Income from operations | 31,851 | 11.9 | 35,335 | 17.9 | 32,505 | 19.8 | ||||||||||||||
| Interest and other income (expense), net | (354 | ) | (0.1 | ) | 26 | — | (194 | ) | (0.1 | ) | ||||||||||
| Income before provision for income taxes | 31,497 | 11.7 | 35,361 | 17.9 | 32,311 | 19.6 | ||||||||||||||
| Provision for income taxes | 14,200 | 5.3 | 15,428 | 7.8 | 12,393 | 7.5 | ||||||||||||||
| Net income | $ | 17,297 | 6.4 | % | $ | 19,933 | 10.1 | % | $ | 19,918 | 12.1 | % |
Net sales to the U.S. and other countries are summarized as follows (dollars in thousands):
| Year Ended December 31, | ||||||||||||||||||||
| 2016 | 2015 | 2014 | ||||||||||||||||||
| United States | $ | 218,757 | 81.6 | % | $ | 161,803 | 81.8 | % | $ | 132,205 | 80.4 | % | ||||||||
| Other Countries | 49,488 | 18.4 | 36,089 | 18.2 | 32,320 | 19.6 | ||||||||||||||
| Total | $ | 268,245 | 100.0 | % | $ | 197,892 | 100.0 | % | $ | 164,525 | 100.0 | % |
The Company’s operations are comprised of two reportable segments: the sale of CEWs, accessories and other related products and services (the “TASER Weapons” segment); and the Axon business, focused on devices, wearables, applications, cloud and mobile products (the "Axon" segment). Within the Axon segment, the Company includes only revenues and costs attributable to that segment which include: costs of sales for both products and services, direct labor, selling expense for the sales team, product management and marketing expenses, trade shows and related expenses, finance and accounting expenses, and research and development for products included, or to be included, within the Axon segment. All other costs are included in the TASER Weapons segment. The chief operating decision maker does not review assets by segment as part of the financial information provided; therefore, no asset information is provided in the following tables.
Net Sales - For the Years Ended December 31, 2016 and 2015
Net sales by product line were as follows for the years ended December 31, 2016 and 2015 (dollars in thousands):
| Year Ended December 31, | Dollar Change | Percent Change | ||||||||||||||||||
| 2016 | 2015 | |||||||||||||||||||
| TASER Weapons segment: | ||||||||||||||||||||
| TASER X26P | $ | 72,490 | 27.0 | % | $ | 55,969 | 28.3 | % | $ | 16,521 | 29.5 | % | ||||||||
| TASER X2 | 52,665 | 19.6 | 42,746 | 21.6 | 9,919 | 23.2 | ||||||||||||||
| TASER X26 | 6,372 | 2.4 | 7,337 | 3.7 | (965 | ) | (13.2 | ) | ||||||||||||
| TASER Pulse and Bolt | 3,580 | 1.3 | 2,146 | 1.1 | 1,434 | 66.8 | ||||||||||||||
| Single cartridges | 52,305 | 19.5 | 41,674 | 21.1 | 10,631 | 25.5 | ||||||||||||||
| Extended warranties including TAP | 9,880 | 3.7 | 7,402 | 3.7 | 2,478 | 33.5 | ||||||||||||||
| Other | 5,352 | 2.0 | 5,101 | 2.6 | 251 | 4.9 | ||||||||||||||
| TASER Weapons segment | 202,644 | 75.5 | 162,375 | 82.1 | 40,269 | 24.8 | ||||||||||||||
| Axon segment: | ||||||||||||||||||||
| Axon Body | 12,911 | 4.8 | 4,029 | 2.0 | 8,882 | 220.5 | ||||||||||||||
| Axon Flex | 5,323 | 2.0 | 6,880 | 3.5 | (1,557 | ) | (22.6 | ) | ||||||||||||
| Axon Dock | 7,422 | 2.8 | 4,022 | 2.0 | 3,400 | 84.5 | ||||||||||||||
| Evidence.com | 29,260 | 10.9 | 11,765 | 5.9 | 17,495 | 148.7 | ||||||||||||||
| TASER Cam | 4,888 | 1.8 | 5,746 | 2.9 | (858 | ) | (14.9 | ) | ||||||||||||
| Extended warranties including TAP | 3,710 | 1.4 | 1,794 | 0.9 | 1,916 | 106.8 | ||||||||||||||
| Other | 2,087 | 0.8 | 1,281 | 0.6 | 806 | 62.9 | ||||||||||||||
| Axon segment | 65,601 | 24.5 | 35,517 | 17.9 | 30,084 | 84.7 | ||||||||||||||
| Total net sales | $ | 268,245 | 100.0 | % | $ | 197,892 | 100.0 | % | $ | 70,353 | 35.6 |
Net unit sales by product line were as follows:
| Year Ended December 31, | |||||||||||
| 2016 | 2015 | Unit Change | Percent Change | ||||||||
| TASER X26P | 79,218 | 62,383 | 16,835 | 27.0 | % | ||||||
| TASER X2 | 47,700 | 38,050 | 9,650 | 25.4 | |||||||
| TASER X26 | 2,655 | 4,928 | (2,273 | ) | (46.1 | ) | |||||
| TASER Pulse and Bolt | 9,549 | 8,121 | 1,428 | 17.6 | |||||||
| Cartridges | 1,979,051 | 1,694,450 | 284,601 | 16.8 | |||||||
| Axon Body | 66,154 | 17,522 | 48,632 | 277.5 | |||||||
| Axon Flex | 14,173 | 18,823 | (4,650 | ) | (24.7 | ) | |||||
| Axon Dock | 16,983 | 6,979 | 10,004 | 143.3 | |||||||
| TASER Cam | 9,566 | 11,634 | (2,068 | ) | (17.8 | ) |
Net sales were $268.2 million and $197.9 million for the years ended December 31, 2016 and 2015, respectively, an increase of $70.4 million or 35.6%. Net sales for the TASER Weapons segment were $202.6 million and $162.4 million for the years ended December 31, 2016 and 2015, respectively, an increase of $40.3 million or 24.8%. Net sales for the Axon segment were $65.6 million and $35.5 million for the years ended December 31, 2016 and 2015, respectively, an increase of $30.1 million or 84.7%. International sales were $49.5 million in 2016 compared to $36.1 million in 2015, an increase of 37.1%.
The increase in net sales for 2016 compared to 2015 in the TASER Weapons segment was primarily driven by the Company's ability to increase the frequency of upgrades through trade-in programs along with increased demand for the Company's installment payment plans, the Officer Safety Plan ("OSP") and TASER 60. These programs allow customers to pay for hardware and services
over an extended contractual life, which is typically five years. In the Axon segment, the increase in net sales was driven by the continued adoption of the Axon on-officer cameras and Evidence.com application in the law enforcement markets.
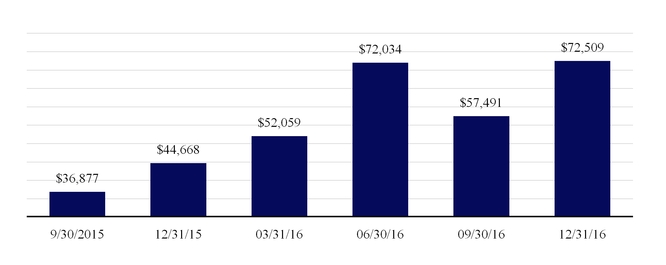
To gain more immediate feedback regarding activity for Axon products and Evidence.com services, we also review bookings for these products. We consider bookings to be a statistical measure defined as the sales contract value (not invoiced sales), net of cancellations, placed in the relevant fiscal period, regardless of when the products or services ultimately will be provided. Some bookings will be invoiced in subsequent years. Due to municipal government funding rules, certain of the future year amounts included in bookings are subject to budget appropriation or other contract cancellation clauses. Although TASER has entered into contracts for the delivery of products and services in the future and anticipates the contracts will be completed, if agencies do not appropriate money in future year budgets or enact a cancellation clause, revenue associated with these bookings will not ultimately be recognized, resulting in a future reduction to bookings. Bookings related to Evidence.com and Axon products and services, net of cancellations, increased to $254.1 million during 2016, compared to $135.1 million in 2015, an increase of 88.0%.
The chart below illustrates the Company's quarterly Axon bookings for each of the previous six fiscal quarters (in thousands):
Net Sales - Three Months Ended December 31, 2016 Compared to September 30, 2016
Net sales by product line were as follows for the three months ended December 31, 2016 and September 30, 2016 (dollars in thousands):
| Three Months Ended December 31, 2016 | Three Months Ended September 30, 2016 | Dollar Change | Percent Change | |||||||||||||||||
| TASER Weapons segment: | ||||||||||||||||||||
| TASER X26P | $ | 20,233 | 24.7 | % | $ | 18,943 | 26.4 | % | $ | 1,290 | 6.8 | % | ||||||||
| TASER X2 | 15,529 | 18.9 | 13,514 | 18.8 | 2,015 | 14.9 | ||||||||||||||
| TASER X26 | 2,042 | 2.5 | 1,549 | 2.2 | 493 | 31.8 | ||||||||||||||
| TASER Pulse and Bolt | 944 | 1.2 | 1,039 | 1.4 | (95 | ) | (9.1 | ) | ||||||||||||
| Single cartridges | 15,292 | 18.6 | 13,898 | 19.3 | 1,394 | 10.0 | ||||||||||||||
| Extended warranties including TAP | 2,778 | 3.4 | 2,645 | 3.7 | 133 | 5.0 | ||||||||||||||
| Other | 1,519 | 1.9 | 1,350 | 1.9 | 169 | 12.5 | ||||||||||||||
| TASER Weapons segment | 58,337 | 71.1 | 52,938 | 73.6 | 5,399 | 10.2 | ||||||||||||||
| Axon segment: | ||||||||||||||||||||
| Axon Body | 5,694 | 6.9 | 3,540 | 4.9 | 2,154 | 60.8 | ||||||||||||||
| Axon Flex | 564 | 0.7 | 2,316 | 3.2 | (1,752 | ) | (75.6 | ) | ||||||||||||
| Axon Dock | 2,499 | 3.0 | 2,438 | 3.4 | 61 | 2.5 | ||||||||||||||
| Evidence.com | 11,239 | 13.7 | 8,544 | 11.9 | 2,695 | 31.5 | ||||||||||||||
| TASER Cam | 1,577 | 1.9 | 696 | 1.0 | 881 | 126.6 | ||||||||||||||
| Extended warranties including TAP | 1,276 | 1.6 | 1,015 | 1.4 | 261 | 25.7 | ||||||||||||||
| Other | 891 | 1.1 | 395 | 0.5 | 496 | 125.6 | ||||||||||||||
| Axon segment | 23,740 | 28.9 | 18,944 | 26.4 | 4,796 | 25.3 | ||||||||||||||
| Total net sales | $ | 82,077 | 100.0 | % | $ | 71,882 | 100.0 | % | $ | 10,195 | 14.2 |
Net unit sales by product line were as follows:
| Three Months Ended | |||||||||||
| 12/31/2016 | 9/30/2016 | Unit Change | Percent Change | ||||||||
| TASER X26P | 20,833 | 23,259 | (2,426 | ) | (10.4 | )% | |||||
| TASER X2 | 13,003 | 12,481 | 522 | 4.2 | |||||||
| TASER X26 | 769 | 365 | 404 | 110.7 | |||||||
| TASER Pulse and Bolt | 3,027 | 1,936 | 1,091 | 56.4 | |||||||
| Cartridges | 554,395 | 544,671 | 9,724 | 1.8 | |||||||
| Axon Body | 25,177 | 25,093 | 84 | 0.3 | |||||||
| Axon Flex | 3,147 | 4,961 | (1,814 | ) | (36.6 | ) | |||||
| Axon Dock | 5,747 | 6,432 | (685 | ) | (10.6 | ) | |||||
| TASER Cam | 3,106 | 1,323 | 1,783 | 134.8 |
Net sales were $82.1 million and $71.9 million for the three months ended December 31, 2016 and September 30, 2016, respectively, an increase of $10.2 million or 14.2%. Net sales for the TASER Weapons segment were $58.3 million and $52.9 million for the three months ended December 31, 2016 and September 30, 2016, respectively, an increase of $5.4 million or 10.2%. Net sales for the Axon segment were $23.7 million and $18.9 million for the three months ended December 31, 2016 and September 30, 2016, respectively, an increase of $4.8 million or 25.3%. International sales were $18.6 million in for the three months ended December 31, 2016 compared to $11.3 million for the three months ended September 30, 2016, an increase of $7.2 million or 63.9%.
The increase in net sales in the TASER Weapons segment on a quarterly sequential basis was primarily driven by the Company's ability to increase the frequency of upgrades through trade-in programs along the increased demand in the Company's installment payment plans, OSP and TASER 60. Additionally, revenues in the fourth quarter are historically the highest of the fiscal year due to the expiration of budget appropriations which also contributed to the sequential increase.
During the fourth quarter of 2016, the Company publicly announced the introduction of its next generation point of view camera, Flex 2. This introduction led to an increase in bookings for the quarter ended December 31, 2016 as compared to September 30, 2016, as many agencies placed orders for the new model, but this adversely impacted recognized revenues, as many agencies opted to order Flex 2 instead of the original Flex units. The Company continued to receive increased orders for its Axon Body 2 cameras due to continued adoption by both domestic and international agencies. The Company also continued to experience sequential revenue increases due to increased users on its Axon platform.
Net Sales - For the Years Ended December 31, 2015 and 2014
Net sales by product line were as follows for the years ended December 31, 2015 and 2014 (dollars in thousands):
| Year Ended December 31, | Dollar Change | Percent Change | ||||||||||||||||||
| 2015 | 2014 | |||||||||||||||||||
| TASER Weapons segment: | ||||||||||||||||||||
| TASER X26P | $ | 55,969 | 28.3 | % | $ | 43,512 | 26.4 | % | $ | 12,457 | 28.6 | % | ||||||||
| TASER X2 | 42,746 | 21.6 | 28,774 | 17.5 | 13,972 | 48.6 | ||||||||||||||
| TASER X26 | 7,337 | 3.7 | 18,712 | 11.4 | (11,375 | ) | (60.8 | ) | ||||||||||||
| TASER Pulse and Bolt | 2,146 | 1.1 | 2,084 | 1.3 | 62 | 3.0 | ||||||||||||||
| Single cartridges | 41,674 | 21.1 | 38,539 | 23.4 | 3,135 | 8.1 | ||||||||||||||
| Extended warranties including TAP | 7,402 | 3.7 | 6,024 | 3.7 | 1,378 | 22.9 | ||||||||||||||
| Other | 5,101 | 2.6 | 7,968 | 4.8 | (2,867 | ) | (36.0 | ) | ||||||||||||
| TASER Weapons segment | 162,375 | 82.1 | 145,613 | 88.5 | 16,762 | 11.5 | ||||||||||||||
| Axon segment: | ||||||||||||||||||||
| Axon Body | 4,029 | 2.0 | 3,404 | 2.1 | 625 | 18.4 | ||||||||||||||
| Axon Flex | 6,880 | 3.5 | 3,981 | 2.4 | 2,899 | 72.8 | ||||||||||||||
| Axon Dock | 4,022 | 2.0 | 1,719 | 1.0 | 2,303 | 134.0 | ||||||||||||||
| Evidence.com | 11,765 | 5.9 | 4,039 | 2.5 | 7,726 | 191.3 | ||||||||||||||
| TASER Cam | 5,746 | 2.9 | 4,674 | 2.8 | 1,072 | 22.9 | ||||||||||||||
| Extended warranties including TAP | 1,794 | 0.9 | — | — | 1,794 | * | ||||||||||||||
| Other | 1,281 | 0.6 | 1,095 | 0.7 | 186 | 17.0 | ||||||||||||||
| Axon segment | 35,517 | 17.9 | 18,912 | 11.5 | 16,605 | 87.8 | ||||||||||||||
| Total net sales | $ | 197,892 | 100.0 | % | $ | 164,525 | 100.0 | % | $ | 33,367 | 20.3 |
Net unit sales by product line were as follows:
| Year Ended December 31, | |||||||||||
| 2015 | 2014 | Unit Change | Percent Change | ||||||||
| TASER X26P | 62,383 | 51,283 | 11,100 | 21.6 | % | ||||||
| TASER X2 | 38,050 | 26,901 | 11,149 | 41.4 | |||||||
| TASER X26 | 4,928 | 17,770 | (12,842 | ) | (72.3 | ) | |||||
| TASER Pulse and Bolt | 8,121 | 7,249 | 872 | 12.0 | |||||||
| Cartridges | 1,694,450 | 1,618,117 | 76,333 | 4.7 | |||||||
| Axon Flex | 18,823 | 10,034 | 8,789 | 87.6 | |||||||
| Axon Body | 17,522 | 13,219 | 4,303 | 32.6 | |||||||
| Axon Dock | 6,979 | 4,219 | 2,760 | 65.4 | |||||||
| TASER Cam | 11,634 | 9,303 | 2,331 | 25.1 |
Net sales were $197.9 million and $164.5 million for the years ended December 31, 2015 and 2014, respectively, an increase of $33.4 million or 20.3%. Net sales for the TASER Weapons segment were $162.4 million and $145.6 million for the years ended December 31, 2015 and 2014, respectively, an increase of $16.8 million or 11.5%. Net sales for the Axon segment were $35.5 million and $18.9 million for the years ended December 31, 2015 and 2014, respectively, an increase of $16.6 million or 87.8%.
The increase in net sales for 2015 compared to 2014 in the TASER Weapons segment was primarily driven by increased adoption of the TASER X26P and X2 Smart Weapons, as customers upgrade their legacy CEWs to the new models. The Company has also introduced upgrade programs to incentivize agencies to replace older CEWs with the Company's new Smart Weapons. In the Axon segment, the increase in net sales was driven by the continued adoption of the Axon on-officer cameras and Evidence.com application in the law enforcement markets. International sales were $36.1 million in 2015 compared to $32.3 million in 2014, an increase of 11.7%.
Cost of Products Sold and Services Delivered
(dollars in thousands)
| Year Ended December 31, | Year Ended December 31, | ||||||||||||||||||||||||||||
| Dollar Change | Percent Change | Dollar Change | Percent Change | ||||||||||||||||||||||||||
| 2016 | 2015 | 2015 | 2014 | ||||||||||||||||||||||||||
| TASER Weapons segment: | |||||||||||||||||||||||||||||
| Cost of products sold | $ | 61,930 | $ | 48,821 | $ | 13,109 | 26.9 | % | $ | 48,821 | $ | 47,680 | $ | 1,141 | 2.4 | % | |||||||||||||
| Cost as % of sales | 30.6 | 30.1 | 30.1 | 32.7 | |||||||||||||||||||||||||
| Axon segment: | |||||||||||||||||||||||||||||
| Cost of products sold | 29,606 | 16,201 | 13,405 | 82.7 | 16,201 | 13,233 | 2,968 | 22.4 | |||||||||||||||||||||
| Cost of services delivered | 6,173 | 4,223 | 1,950 | 46.2 | 4,223 | 2,064 | 2,159 | 104.6 | |||||||||||||||||||||
| Total cost of products sold and services delivered | 35,779 | 20,424 | 15,355 | 75.2 | 20,424 | 15,297 | 5,127 | 33.5 | |||||||||||||||||||||
| Cost as % of sales | 54.5 | 57.5 | 57.5 | 80.9 | |||||||||||||||||||||||||
| Total cost of products sold and services delivered | $ | 97,709 | $ | 69,245 | $ | 28,464 | 41.1 | $ | 69,245 | $ | 62,977 | $ | 6,268 | 10.0 | |||||||||||||||
| Cost as % of sales | 36.4 | 35.0 | 35.0 | 38.3 |
Cost of products sold and services delivered was $97.7 million and $69.2 million for the years ended December 31, 2016 and 2015, respectively, an increase of $28.5 million or 41.1%. As a percentage of net sales, cost of products sold and services delivered increased to 36.4% in 2016 compared to 35.0% in 2015. Within the TASER Weapons segment, cost of products sold increased $13.1 million, or 26.9%, to $61.9 million in 2016, compared to $48.8 million in 2015, and remained relatively consistent as a percent of sales at 30.6% from 30.1%. The overall increase in cost of products sold was attributable to higher unit sales.
Within the Axon segment, cost of products sold and services delivered was $35.8 million, an increase of $15.4 million, or 75.2% from 2015. As a percentage of net sales, cost of products sold and services delivered decreased to 54.5% in 2016 from 57.5% in 2015. The increase in cost of products sold and services delivered was driven by continued growth, increased data storage
costs as more agencies utilize Evidence.com, as well as increased costs for our professional services team. The decrease as a percentage of sales was primarily driven by improvements in Evidence.com service margins.
Cost of products sold and services delivered was $69.2 million and $63.0 million for the years ended December 31, 2015 and 2014, respectively, an increase of $6.3 million, or 10.0%. As a percentage of net sales, cost of products sold and services delivered decreased to 35.0% in 2015 compared to 38.3% in 2014. Within the TASER Weapons segment, cost of products sold increased $1.1 million, or 2.4%, to $48.8 million in 2015, compared to $47.7 million in 2014, and decreased as a percent of sales to 30.1% from 32.7%. The overall increase in cost of products sold was attributable to higher unit sales, and the decrease of cost as a percentage of sales was primarily attributable to higher average selling prices and increased leverage of fixed operating costs.
Within the Axon segment, cost of products sold and services delivered were $20.4 million, an increase of $5.1 million, or 33.5% from 2014. As a percentage of net sales, cost of products sold and services delivered decreased to 57.5% in 2015 from 80.9% in 2014. The increase in cost of products sold and services delivered was driven by growing sales in this segment, increased data storage costs as more agencies utilize Evidence.com, as well as increased costs for our professional services team. The decrease in cost of products sold and services delivered as a percentage of sales was driven by higher sales and by improvements to our Evidence.com margins.
Gross Margin
(dollars in thousands)
| Year Ended December 31, | Year Ended December 31, | ||||||||||||||||||||||||||||
| Dollar Change | Percent Change | Dollar Change | Percent Change | ||||||||||||||||||||||||||
| 2016 | 2015 | 2015 | 2014 | ||||||||||||||||||||||||||
| TASER Weapons segment | $ | 140,714 | $ | 113,554 | $ | 27,160 | 23.9 | % | $ | 113,554 | $ | 97,933 | $ | 15,621 | 16.0 | % | |||||||||||||
| Axon segment | 29,822 | 15,093 | 14,729 | 97.6 | 15,093 | 3,615 | 11,478 | 317.5 | |||||||||||||||||||||
| Total gross margin | $ | 170,536 | $ | 128,647 | $ | 41,889 | 32.6 | $ | 128,647 | $ | 101,548 | $ | 27,099 | 26.7 | |||||||||||||||
| Gross margin as % of sales | 63.6 | 65.0 | 65.0 | 61.7 |
Gross margin increased $41.9 million to $170.5 million for 2016 compared to $128.6 million for 2015. As a percentage of net sales, gross margin decreased to 63.6% for 2016 from 65.0% for 2015. The decrease in gross margin as a percentage of sales was due primarily to a change in product mix, as lower margin Axon sales became a greater percentage of the consolidated total. As a percentage of net sales, gross margin for the TASER Weapons segment was relatively consistent at 69.4% and 69.9% for 2016 and 2015, respectively, while the same measure for these years for the Axon segment were 45.5% and 42.5%, respectively. The improvement in Axon segment gross margin is primarily attributable to higher service margins due to increased users on the Evidence.com platform.
Gross margin increased $27.1 million to $128.6 million for 2015 compared to $101.5 million for 2014. As a percentage of net sales, gross margin increased to 65.0% for 2015 compared to 61.7% for 2014. The increase is attributable to stronger margins in both the TASER Weapons and Axon segments. As a percentage of net sales, gross margin for the TASER Weapons segment was 69.9% and 67.3% for 2015 and 2014, respectively, while the same measure for these years for the Axon segment were 42.5% and 19.1%, respectively. The Company experienced improvements in margins for the TASER Weapons and Axon segments individually, due to higher average selling prices and continued leverage of fixed operating costs.
Sales, General and Administrative Expenses
Sales, general and administrative (“SG&A”) expenses were comprised of the following for 2016 and 2015 (dollars in thousands):
| Year Ended December 31, | Dollar Change | Percent Change | ||||||||||||
| 2016 | 2015 | |||||||||||||
| Salaries, benefits and bonus | $ | 43,058 | $ | 25,032 | $ | 18,026 | 72.0 | % | ||||||
| Stock-based compensation | 5,707 | 4,299 | 1,408 | 32.8 | ||||||||||
| Professional, consulting and lobbying | 19,321 | 13,165 | 6,156 | 46.8 | ||||||||||
| Sales and marketing | 15,132 | 10,776 | 4,356 | 40.4 | ||||||||||
| Travel and meals | 8,970 | 5,649 | 3,321 | 58.8 | ||||||||||
| Other | 15,888 | 10,777 | 5,111 | 47.4 | ||||||||||
| Total sales, general and administrative expenses | $ | 108,076 | $ | 69,698 | $ | 38,378 | 55.1 | |||||||
| Sales, general, and administrative as a percentage of net sales | 40.3 | % | 35.2 | % |
Sales, general and administrative expenses were $108.1 million and $69.7 million for the years ended December 31, 2016 and 2015, respectively, an increase of $38.4 million, or 55.1%. As a percentage of total net sales, SG&A expenses increased to 40.3% for 2016 compared to 35.2% for 2015.
SG&A by type and by segment were as follows for the years ended December 31, 2016 and 2015 (dollars in thousands):
| Year Ended December 31, | Dollar Change | Percent Change | ||||||||||||||||||
| 2016 | 2015 | |||||||||||||||||||
| TASER Weapons segment: | ||||||||||||||||||||
| Salaries, benefits and bonus | $ | 24,534 | 22.7 | % | $ | 16,767 | 24.1 | % | $ | 7,767 | 46.3 | % | ||||||||
| Stock-based compensation | 3,339 | 3.1 | 3,187 | 4.6 | 152 | 4.8 | ||||||||||||||
| Professional, consulting and lobbying | 10,128 | 9.4 | 10,258 | 14.7 | (130 | ) | (1.3 | ) | ||||||||||||
| Sales and marketing | 8,305 | 7.7 | 5,411 | 7.8 | 2,894 | 53.5 | ||||||||||||||
| Travel and meals | 4,277 | 4.0 | 3,089 | 4.4 | 1,188 | 38.5 | ||||||||||||||
| Other | 13,034 | 12.1 | 8,928 | 12.8 | 4,106 | 46.0 | ||||||||||||||
| TASER Weapons segment | 63,617 | 58.9 | 47,640 | 68.4 | 15,977 | 33.5 | ||||||||||||||
| Axon segment: | ||||||||||||||||||||
| Salaries, benefits and bonus | 18,524 | 17.1 | 8,265 | 11.9 | 10,259 | 124.1 | ||||||||||||||
| Stock-based compensation | 2,368 | 2.2 | 1,112 | 1.6 | 1,256 | 112.9 | ||||||||||||||
| Professional, consulting and lobbying | 9,193 | 8.5 | 2,907 | 4.2 | 6,286 | 216.2 | ||||||||||||||
| Sales and marketing | 6,827 | 6.3 | 5,365 | 7.7 | 1,462 | 27.3 | ||||||||||||||
| Travel and meals | 4,693 | 4.3 | 2,560 | 3.7 | 2,133 | 83.3 | ||||||||||||||
| Other | 2,854 | 2.6 | 1,849 | 2.7 | 1,005 | 54.4 | ||||||||||||||
| Axon segment | 44,459 | 41.1 | 22,058 | 31.6 | 22,401 | 101.6 | ||||||||||||||
| Total sales, general and administrative expenses | $ | 108,076 | 100.0 | % | $ | 69,698 | 100.0 | % | $ | 38,378 | 55.1 |
Within the TASER Weapons segment, SG&A increased $16.0 million, or 33.5%, to $63.6 million from $47.6 million in 2015. Salaries, benefits, bonus and stock-based compensation in the TASER Weapons increased approximately $7.9 million in 2016 compared to 2015. This increase was primarily attributable to the Company's efforts to build the corporate infrastructure to facilitate future growth in departments such as supply chain, legal, finance and information technology. The increase in travel and meals was primarily attributable to the growth in the direct sales teams both domestically and internationally. The increase in sales and marketing of $2.9 million was primarily attributable to higher commissions of $3.2 million partially offset by a decrease in marketing related costs partially due to lower spending at the 2016 International Association of Chiefs of Police conference as compared to 2015. The increase in other expenses was made up primarily of $1.2 million in higher computer related costs, $0.3 million of higher rent expense, and $2.0 million of litigation costs incurred, including resolution expenses, that were not incurred during the same period in 2015.
Within the Axon segment, SG&A increased $22.4 million, or 101.6%, to $44.5 million in 2016 in comparison to the prior year. Salaries, benefits, bonus and stock-based compensation in the Axon segment increased $11.5 million as the Company continued to hire additional engineering, product management personnel, sales and marketing personnel and general support staff to further expand upon existing product offerings as well as the development of new apps and cloud technologies. The increase in travel and meals was primarily attributable to the growth in the direct sales teams both domestically and internationally. Of the increase in professional, consulting and lobbying, $4.1 million represented primarily increased lobbying fees aimed at securing long-term body-worn camera and service contracts, $0.8 million of increased legal costs primarily attributable to the ongoing Digital Ally lawsuit, and $0.6 million related to increased patent and trademark costs. The increase in sales and marketing of $1.5 million was primarily attributable to higher commissions of $2.4 million partially offset by a decrease of $0.9 million in marketing related costs partially due to lower spending at the 2016 International Association of Chiefs of Police conference as compared to 2015.
The Company expects to see increases in SG&A in 2017 compared to 2016 as it plans to make additional investments in customer-facing positions both domestically and internationally along with increased investments in sales and marketing.
Of the increase in SG&A above, there was increased expense associated with customer-facing positions, including: salaries, benefits, bonus and stock-based compensation, as well as sales commissions, which are included in the sales and marketing line item in the table above. Positions were added throughout the year, with the following customer-facing headcount as of the end of each year:
| As of December 31, | ||||||||
| 2016 | 2015 | 2014 | ||||||
| TASER Weapons sales representatives | 26 | 18 | 12 | |||||
| Axon sales representatives | 44 | 27 | 16 | |||||
| International sales representatives (i) | 11 | 13 | 5 | |||||
| Sales support staff | 31 | 20 | 8 | |||||
| Telesales | 42 | 27 | 17 | |||||
| Other customer-facing roles | 59 | 33 | 20 | |||||
| Total customer-facing roles | 213 | 138 | 78 |
(i) In certain international markets where the Company does not have a legal entity, it generally engages sales managers as consultants. These expenses are reflected in the consulting and lobbying caption within selling, general and administrative expenses.
Sales, general and administrative expenses were comprised of the following for 2015 and 2014 (dollars in thousands):
| Year Ended December 31, | Dollar Change | Percent Change | ||||||||||||
| 2015 | 2014 | |||||||||||||
| Salaries, benefits and bonus | $ | 25,032 | $ | 18,179 | $ | 6,853 | 37.7 | % | ||||||
| Stock-based compensation | 4,299 | 3,558 | 741 | 20.8 | ||||||||||
| Professional, consulting and lobbying | 13,165 | 8,561 | 4,604 | 53.8 | ||||||||||
| Sales and marketing | 10,776 | 8,124 | 2,652 | 32.6 | ||||||||||
| Travel and meals | 5,649 | 4,778 | 871 | 18.2 | ||||||||||
| Other | 10,777 | 10,958 | (181 | ) | (1.7 | ) | ||||||||
| Total sales, general and administrative expenses | $ | 69,698 | $ | 54,158 | $ | 15,540 | 28.7 | |||||||
| Sales, general, and administrative as a percentage of net sales | 35.2 | % | 32.9 | % |
Sales, general and administrative expenses were $69.7 million and $54.2 million for the years ended December 31, 2015 and 2014, respectively, an increase of $15.5 million, or 28.7%. As a percentage of total net sales, SG&A expenses increased to 35.2% for 2015 compared to 32.9% for 2014.
SG&A by type and by segment were as follows for the years ended December 31, 2015 and 2014 (dollars in thousands):
| Year Ended December 31, | Dollar Change | Percent Change | ||||||||||||||||||
| 2015 | 2014 | |||||||||||||||||||
| TASER Weapons segment: | ||||||||||||||||||||
| Salaries, benefits and bonus | $ | 16,767 | 24.1 | % | $ | 14,522 | 26.8 | % | $ | 2,245 | 15.5 | % | ||||||||
| Stock-based compensation | 3,187 | 4.6 | 2,598 | 4.8 | 589 | 22.7 | ||||||||||||||
| Professional, consulting and lobbying | 10,258 | 14.7 | 7,381 | 13.6 | 2,877 | 39.0 | ||||||||||||||
| Sales and marketing | 5,411 | 7.8 | 4,902 | 9.1 | 509 | 10.4 | ||||||||||||||
| Travel and meals | 3,089 | 4.4 | 3,014 | 5.6 | 75 | 2.5 | ||||||||||||||
| Other | 8,928 | 12.8 | 10,572 | 19.5 | (1,644 | ) | (15.6 | ) | ||||||||||||
| TASER Weapons segment | 47,640 | 68.4 | 42,989 | 79.4 | 4,651 | 10.8 | ||||||||||||||
| Axon segment: | ||||||||||||||||||||
| Salaries, benefits and bonus | 8,265 | 11.9 | 3,657 | 6.8 | 4,608 | 126.0 | ||||||||||||||
| Stock-based compensation | 1,112 | 1.6 | 960 | 1.8 | 152 | 15.8 | ||||||||||||||
| Professional, consulting and lobbying | 2,907 | 4.2 | 1,180 | 2.2 | 1,727 | 146.4 | ||||||||||||||
| Sales and marketing | 5,365 | 7.7 | 3,222 | 5.9 | 2,143 | 66.5 | ||||||||||||||
| Travel and meals | 2,560 | 3.7 | 1,764 | 3.3 | 796 | 45.1 | ||||||||||||||
| Other | 1,849 | 2.7 | 386 | 0.7 | 1,463 | 379.0 | ||||||||||||||
| Axon segment | 22,058 | 31.6 | 11,169 | 20.6 | 10,889 | 97.5 | ||||||||||||||
| Total sales, general and administrative expenses | $ | 69,698 | 100.0 | % | $ | 54,158 | 100.0 | % | $ | 15,540 | 28.7 |
Within the TASER Weapons segment, SG&A increased $4.7 million, or 10.8%, to $47.6 million from $43.0 million in 2014. Salaries, benefits, bonus and stock-based compensation in the TASER Weapons increased approximately $2.8 million in 2015 compared to 2014. This increase was primarily attributable to the Company's efforts to build out international and direct sales teams internally as well as increased headcount in certain administrative departments to support the overall growth of the entity. On a consolidated basis, legal, professional and accounting expenses were up $0.9 million in 2015 compared to 2014, and most of this increase was allocated to the TASER Weapons segment. Audit and tax compliance costs were up approximately $0.7 million due primarily to increased complexity in the business structure as well as overall growth of the Company. Also included in the increase in legal fees was $0.2 million of costs to secure new patents and trademarks. The increase in sales and marketing was primarily attributable to increased efforts at the 2015 International Association of Chiefs of Police ("IACP") conference as compared to 2014. The Company incurred higher consulting and lobbying expense during 2015 as compared to 2014 increasing $1.8 million to $4.2 million in 2015. The Company also engaged additional international sales consultants during 2015 to drive increased sales in targeted foreign markets. Offsetting these increases was a decrease to other expenses. The decrease in other expense was primarily the result of a litigation settlement in 2014 of $3.3 million as compared to settlements of $0.2 million in 2015.
Within the Axon segment, SG&A increased $10.9 million, or 97.5%, to $22.1 million in 2015 in comparison to the prior year. Salaries, benefits, bonus and stock-based compensation in the Axon segment increased $4.8 million as the Company continued to hire additional engineering, product management personnel, sales and marketing personnel and general support staff to further expand upon existing product offerings as well as the development of new mobile and cloud technologies. Sales and marketing expenses in the Axon segment also increased approximately $2.1 million in comparison to 2014 due primarily to increased commissions on higher sales and increased marketing efforts for Axon technologies. The increase in consulting and lobbying was due to the Axon branding campaign that took place in the third quarter of 2015 as well as increased lobbying and public relations efforts ahead of the IACP conference held in October 2015 as compared to 2014. The increase in the balance of other expenses of $1.5 million during the 2015 as compared 2014 was related to building expenses, including depreciation and amortization, and supplies. Of this amount $0.7 million related to depreciation and amortization of assets acquired in two business combinations affected during 2015.
Research and Development Expenses
Research and development ("R&D") expenses were comprised of the following for 2016 and 2015 (dollars in thousands):
| Year Ended December 31, | Dollar Change | Percent Change | ||||||||||||
| 2016 | 2015 | |||||||||||||
| Salaries, benefits and bonus | $ | 17,205 | $ | 13,013 | $ | 4,192 | 32.2 | % | ||||||
| Stock-based compensation | 3,320 | 2,576 | 744 | 28.9 | ||||||||||
| Professional and consulting | 3,212 | 3,835 | (623 | ) | (16.2 | ) | ||||||||
| Sales and marketing | 919 | 63 | 856 | 1,358.7 | ||||||||||
| Travel and meals | 969 | 1,034 | (65 | ) | (6.3 | ) | ||||||||
| Other | 4,984 | 3,093 | 1,891 | 61.1 | ||||||||||
| Total research and development expenses | $ | 30,609 | $ | 23,614 | $ | 6,995 | 29.6 | |||||||
| Research and development as a percentage of net sales | 11.4 | % | 11.9 | % |
Research and development expenses were $30.6 million and $23.6 million for the years ended December 31, 2016 and 2015, respectively, an increase of $7.0 million, or 29.6%. As a percentage of net sales, R&D decreased slightly to 11.4% in 2016 in compared to 11.9% in 2015.
R&D by type and by segment were as follows for the years ended December 31, 2016 and 2015 (dollars in thousands):
| Year Ended December 31, | Dollar Change | Percent Change | ||||||||||||||||||
| 2016 | 2015 | |||||||||||||||||||
| TASER Weapons segment: | ||||||||||||||||||||
| Salaries, benefits and bonus | $ | 2,301 | 7.5 | % | $ | 1,596 | 6.8 | % | $ | 705 | 44.2 | % | ||||||||
| Stock-based compensation | 639 | 2.1 | 394 | 1.7 | 245 | 62.2 | ||||||||||||||
| Professional and consulting | 1,167 | 3.8 | 1,196 | 5.1 | (29 | ) | (2.4 | ) | ||||||||||||
| Sales and marketing | 6 | — | 18 | 0.1 | (12 | ) | (66.7 | ) | ||||||||||||
| Travel and meals | 345 | 1.1 | 261 | 1.1 | 84 | 32.2 | ||||||||||||||
| Other | 1,429 | 4.7 | 1,005 | 4.3 | 424 | 42.2 | ||||||||||||||
| TASER Weapons segment | 5,887 | 19.2 | 4,470 | 18.9 | 1,417 | 31.7 | ||||||||||||||
| Axon segment: | ||||||||||||||||||||
| Salaries, benefits and bonus | 14,904 | 48.7 | 11,417 | 48.3 | 3,487 | 30.5 | ||||||||||||||
| Stock-based compensation | 2,681 | 8.8 | 2,182 | 9.2 | 499 | 22.9 | ||||||||||||||
| Professional and consulting | 2,045 | 6.7 | 2,639 | 11.2 | (594 | ) | (22.5 | ) | ||||||||||||
| Sales and marketing | 913 | 3.0 | 45 | 0.2 | 868 | 1,928.9 | ||||||||||||||
| Travel and meals | 624 | 2.0 | 773 | 3.3 | (149 | ) | (19.3 | ) | ||||||||||||
| Other | 3,555 | 11.6 | 2,088 | 8.8 | 1,467 | 70.3 | ||||||||||||||
| Axon segment | 24,722 | 80.8 | 19,144 | 81.1 | 5,578 | 29.1 | ||||||||||||||
| Total research and development expenses | $ | 30,609 | 100.0 | % | $ | 23,614 | 100.0 | % | $ | 6,995 | 29.6 |
Within the TASER Weapons segment, R&D expenses increased $1.4 million, or 31.7%, to $5.9 million in 2016. Salaries, benefits, bonus and stock-based compensation in the TASER Weapons increased approximately $1.0 million in 2016 compared to 2015. The increase for 2016 compared to 2015 is primarily driven by additional headcount as the Company continued to invest in the development of new CEW related technologies.
Within the Axon segment, R&D expenses increased $5.6 million, or 29.1%, to $24.7 million in 2016 from the prior year. The Company's Axon segment was responsible for approximately 81% of the overall expenses in R&D. Of the $5.6 million increase in R&D for the Axon segment, $4.0 million related to salaries and benefits, inclusive of bonus and stock-based compensation. The increase in sales and marketing of $0.9 million related to contractual earn-outs for legacy MediaSolv employees, who work in R&D, that are recorded as commissions expense, as they are tied to executed sales contracts. The Company remained focused on growing the Axon segment as it added headcount and external resources to develop new products and services to further advance its scalable cloud-connected device platform. These increases were partially offset by decreases in professional and consulting of $0.6 million related primarily to the Company being more selective in the utilization of consultants versus hiring additional internal
resources. The biggest portion of the increase in other R&D expenses related to tooling and supplies that made up $0.8 million of the overall increase. The remaining increase was attributable to the overall growth in of the Axon R&D department.
Research and development expenses were comprised of the following for 2015 and 2014 (dollars in thousands):
| Year Ended December 31, | Dollar Change | Percent Change | ||||||||||||
| 2015 | 2014 | |||||||||||||
| Salaries, benefits and bonus | $ | 13,013 | $ | 8,077 | $ | 4,936 | 61.1 | % | ||||||
| Stock-based compensation | 2,576 | 1,820 | 756 | 41.5 | ||||||||||
| Professional and consulting | 3,835 | 1,998 | 1,837 | 91.9 | ||||||||||
| Sales and marketing | 63 | 45 | 18 | 40.0 | ||||||||||
| Travel and meals | 1,034 | 694 | 340 | 49.0 | ||||||||||
| Other | 3,093 | 2,251 | 842 | 37.4 | ||||||||||
| Total research and development expenses | $ | 23,614 | $ | 14,885 | $ | 8,729 | 58.6 | |||||||
| Research and development as a percentage of net sales | 11.9 | % | 9.0 | % |
Research and development expenses were $23.6 million and $14.9 million for the years ended December 31, 2015 and 2014, respectively, an increase of $8.7 million, or 58.6%. As a percentage of net sales, R&D increased to 11.9% in 2015 in comparison to 9.0% in 2014.
R&D by type and by segment were as follows for the years ended December 31, 2015 and 2014 (dollars in thousands):
| Year Ended December 31, | Dollar Change | Percent Change | ||||||||||||||||||
| 2015 | 2014 | |||||||||||||||||||
| TASER Weapons segment: | ||||||||||||||||||||
| Salaries, benefits and bonus | $ | 1,596 | 6.8 | % | $ | 1,689 | 11.3 | % | $ | (93 | ) | (5.5 | )% | |||||||
| Stock-based compensation | 394 | 1.7 | 280 | 1.9 | 114 | 40.7 | ||||||||||||||
| Professional and consulting | 1,196 | 5.1 | 730 | 4.9 | 466 | 63.8 | ||||||||||||||
| Sales and marketing | 18 | 0.1 | 27 | 0.2 | (9 | ) | (33.3 | ) | ||||||||||||
| Travel and meals | 261 | 1.1 | 223 | 1.5 | 38 | 17.0 | ||||||||||||||
| Other | 1,005 | 4.3 | 923 | 6.2 | 82 | 8.9 | ||||||||||||||
| TASER Weapons segment | 4,470 | 18.9 | 3,872 | 26.0 | 598 | 15.4 | ||||||||||||||
| Axon segment: | ||||||||||||||||||||
| Salaries, benefits and bonus | 11,417 | 48.3 | 6,388 | 42.9 | 5,029 | 78.7 | ||||||||||||||
| Stock-based compensation | 2,182 | 9.2 | 1,540 | 10.3 | 642 | 41.7 | ||||||||||||||
| Professional and consulting | 2,639 | 11.2 | 1,268 | 8.5 | 1,371 | 108.1 | ||||||||||||||
| Sales and marketing | 45 | 0.2 | 18 | 0.1 | 27 | 150.0 | ||||||||||||||
| Travel and meals | 773 | 3.3 | 471 | 3.2 | 302 | 64.1 | ||||||||||||||
| Other | 2,088 | 8.8 | 1,328 | 8.9 | 760 | 57.2 | ||||||||||||||
| Axon segment | 19,144 | 81.1 | 11,013 | 74.0 | 8,131 | 73.8 | ||||||||||||||
| Total research and development expenses | $ | 23,614 | 100.0 | % | $ | 14,885 | 100.0 | % | $ | 8,729 | 58.6 |
Within the TASER Weapons segment, R&D expenses increased $0.6 million, or 15.4%, to $4.5 million in 2015, which was primarily driven by internal efforts and consulting expenses related to development of future CEW products.
Within the Axon segment, R&D expenses increased $8.1 million, or 73.8%, to $19.1 million in 2015 from the prior year. The increase for 2015 compared to 2014 was primarily driven by additional headcount and higher consulting fees as the Company continued its efforts to launch new product lines and SaaS offerings to strengthen its competitive advantage in these emerging technologies.
Interest and Other Income (Expense), Net
Interest and other income (expense), net was $(0.4) million for the year ended December 31, 2016 compared to income of $26,000 and $0.2 million for the years ended December 31, 2015 and 2014, respectively. Other income and expense amounts for 2016, 2015 and 2014 consisted primarily of investment interest income and foreign currency transaction adjustments. For the year ended December 31, 2016, interest income of $0.7 million was more than offset by losses on foreign currency of $1.1 million.
Provision for Income Taxes
The provision for income taxes was $14.2 million for the year ended December 31, 2016. The effective income tax rate for 2016 was 45.1%. The effect of state income taxes of $0.9 million and the tax effects of intercompany transactions of $0.6 million were offset by a benefit of $1.9 million for research and development credits in the current year. The difference between statutory and foreign tax rates of $1.5 million was largely driven by losses incurred in a foreign entity for which no tax benefit will be realized. In addition, a valuation allowance in the amount of $1.8 million was recorded as of December 31, 2016 related to certain research and development tax credits that may not be utilized prior to expiration and losses in certain foreign jurisdictions in which there is a cumulative loss.
The provision for income taxes was $15.4 million for the year ended December 31, 2015. The effective income tax rate for 2015 was 43.7%. The effect of state income tax of $1.1 million was largely offset by a benefit of $1.0 million of research and development credits in the current year. The difference between statutory and foreign tax rates of $2.4 million was largely driven by losses incurred in a newly formed foreign entity for which no tax benefit will be realized, partially reduced by a tax benefit for newly formed foreign entities for which the statutory tax rate is lower than the U.S. statutory tax rate. In addition, valuation allowance in the amount of $1.2 million was recorded.
The provision for income taxes was $12.4 million for the year ended December 31, 2014. The effective income tax rate for 2014 was 38.4%. The effect of state income tax of $1.4 million was largely offset by a benefit of $0.6 million from incentive stock option deductions as well as $0.5 million of research and development credits in the current year. When an employee exercises ISOs and sells the related stock prior to the end of the mandatory holding period, the associated expense becomes a reduction to the Company’s taxable income.
Net Income
Our net income decreased by $2.6 million to $17.3 million for the year ended December 31, 2016 compared to $19.9 million in 2015. Net income per basic share was $0.33 and $0.32 per diluted share, respectively, for 2016 compared to $0.37 and $0.36 per basic and diluted share, respectively, for 2015.
Our net income was $19.9 million for each of the years ended December 31, 2015 and 2014. Net income per basic and diluted share was $0.37 and $0.36 for 2015, respectively, compared to $0.38 and $0.37 per basic and diluted share for 2014, respectively.
Liquidity and Capital Resources
Summary
As of December 31, 2016, we had $40.7 million of cash and cash equivalents, a decrease of $18.9 million from the end of 2015.
Cash Flows
The following table summarizes our cash flows from operating, investing and financing activities (in thousands):
| Year Ended December 31, | |||||||||||
| 2016 | 2015 | 2014 | |||||||||
| Operating activities | $ | 17,925 | $ | 46,445 | $ | 35,432 | |||||
| Investing activities | (3,045 | ) | (36,009 | ) | (24,581 | ) | |||||
| Financing activities | (34,661 | ) | 603 | (4,840 | ) | ||||||
| Effect of exchange rate changes on cash and cash equivalents | 906 | 120 | 85 | ||||||||
| Net increase (decrease) in cash and cash equivalents | $ | (18,875 | ) | $ | 11,159 | $ | 6,096 |
Operating activities
Net cash provided by operating activities in 2016 of $17.9 million consisted of $17.3 million in net income, the net add-back of non-cash income statement items totaling $8.9 million and a negative $8.2 million net change in operating assets and liabilities. Included in the non-cash items are $3.7 million in depreciation and amortization expense, $9.4 million in stock-based compensation expense, and $1.3 million of bond premium amortization. These additions were partially offset by an $1.4 million reduction related to excess tax benefit from stock-based compensation and $5.2 million related to deferred income taxes. The most significant increase to the portion of cash from operating activities related to the changes in operating assets and liabilities was a $34.3 million increase in deferred revenue. Of the increase, $8.1 million resulted from additional extended warranty sales, $15.6 million resulted from increased hardware deferred revenue from TASER Assurance Program ("TAP") and OSP sales, and $10.5 million related to prepayments for Axon services. The Company also had increases in cash provided from operating activities of $17.6 million for increases in accounts payable and accrued liabilities related primarily to increased inventory purchases. These increases were offset by increased prepaid expenses and other current assets of $29.1 million, inventory of $18.7 million and accounts and notes receivable of $13.3 million during 2016. The increases in accounts and notes receivable were due to increased sales during 2016, and increases in inventory resulted from higher anticipated sales for 2017. Long-term accounts receivable increased by $16.4 million during 2016 for sales made under OSP and TASER 60. The increase in prepaid expenses and other asset accounts during 2016 was driven primarily increased prepaid commissions of $1.8 million attributable to higher sales, increased balances under corporate-owed life insurance policies of $1.1 million, $3.3 million of restricted cash related primarily to a customer contract requiring certain contractual payments to be deposited in escrow until approved for release, and $1.7 million of long-term contingent consideration deposited in escrow in connection with a business combination that was completed in December 2016.
Net cash provided by operating activities in 2015 of $46.4 million consisted of $19.9 million in net income, the net add-back of non-cash income statement items totaling $6.3 million, and a positive $20.2 million net change in operating assets and liabilities. Included in the non-cash items was $3.3 million in depreciation and amortization expense, $7.3 million in stock-based compensation expense, and $1.7 million of bond premium amortization. Those additions were partially offset by a $6.9 million reduction related to excess tax benefit from stock-based compensation that was treated as a financing activity for cash flow purposes. The most significant increase to the portion of cash from operating activities related to the changes in operating assets and liabilities was a $15.3 million increase to deferred revenue. Of the increase in deferred revenue, $4.0 million resulted from additional extended warranty sales, $7.3 million resulted from increased hardware deferred revenue from the Company's TAP and OSP sales programs, and $4.0 million related to prepayments for Axon SaaS and related services. The Company also had increases in cash provided from operating activities of $4.2 million and $3.1 million for decreases in accounts and notes receivable and inventory, respectively. In addition, the $5.9 million increase to cash from operating activities related to increases in accounts payable, accrued and other liabilities that was primarily caused by current income tax expense, which would have resulted in an increase to income tax payable, if it had not been reduced by the excess tax benefit from stock-based compensation discussed above. Those increases were partially offset by increased prepaid expenses and other current assets of $8.6 million during 2015. The increase in other asset accounts during 2015 was driven by primarily by increased prepaid commissions of $2.5 million, increased long-term accounts receivable of $1.2 million for sales made under OSP, increased balances under corporate-owed life insurance policies of $1.1 million, and a deposit made with a foreign component manufacturer of $2.6 million related to future services.
Net cash provided by operating activities in 2014 of $35.4 million consisted of $19.9 million in net income, the net add-back of non-cash income statement items totaling $9.6 million and a positive $5.9 million net change in operating assets and liabilities. Included in the non-cash items was $4.3 million in depreciation and amortization expense and $5.6 million in stock-based compensation expense. Those additions were partially offset by an $8.0 million reduction related to excess tax benefit from stock-based compensation that was treated as a financing activity for cash flow purposes. The most significant increase to the portion of cash from operating activities related to the changes in operating assets and liabilities is a $15.5 million increase to deferred revenue. Of the increase in deferred revenue, $6.1 million resulted from additional extended warranty sales, $3.9 million resulted from increased hardware deferred revenue from TAP sales, and $5.3 million related to prepayments for Axon SaaS services. In addition, the $9.5 million increase to cash from operating activities related to increases in accounts payable, accrued and other liabilities that was primarily caused by current income tax expense, which would have resulted in an increase to income tax payable, if it had not been reduced by the excess tax benefit from stock-based compensation discussed above. Those increases to operating cash flow were partially offset by an increase in accounts and notes receivable of $8.4 million due to higher sales in the fourth quarter of 2014 compared to the same quarter in 2013, and an increase in inventory of $9.4 million.
Investing activities
Primarily as a result of investing cash generated from operating activities, we used $3.0 million in investing activities in 2016. Calls and maturities on our investments, net of purchases, were $8.9 million. During 2016, we invested $3.5 million for the
acquisition of developed technology and hiring of personnel to form the Axon Artificial Intelligence group. The Company also invested $8.4 million in the purchase of property and equipment and intangibles, net of proceeds related to disposals.
Primarily as a result of investing cash generated from operating activities, the Company used $36.0 million for investing activities in 2015. Purchases of investments, net of calls and maturities, were $18.4 million. During 2015, net cash of $11.2 million was used for the acquisitions of MediaSolv Solutions Corporation and Tactical Safety Responses LTD. The Company also invested $6.5 million in the purchase of property and equipment and intangibles.
During the year ended December 31, 2014, the Company used $24.6 million for investing activities. Purchases of investments, net of calls and maturities, were $21.9 million. The Company also invested $2.7 million in the purchase of property and equipment and intangibles.
Financing activities
Net cash used by financing activities was $34.7 million for the year ended December 31, 2016. During 2016, the Company repurchased $33.7 million of its common stock, which was purchased for a weighted average cost of $18.90 per share, inclusive of applicable administrative costs. Additionally, the Company paid payroll taxes of $1.8 million on behalf of employees who net-settled stock awards during the period. These decreases were partially offset by $0.5 million of proceeds from the exercise of stock options, and $1.4 million of excess tax benefit from stock-based compensation. The purchase of common stock was made under a stock repurchase program authorized by TASER’s Board of Directors.
Net cash used by financing activities was $0.6 million for the year ended December 31, 2015. During 2015, the Company repurchases $7.6 million of the Company’s common stock, which was purchased for a weighted average cost of $25.86 per share. The Company also paid payroll taxes of $1.4 million on behalf of employees who net-settled stock awards during the year. These decreases were partially offset by $2.7 million of proceeds from the exercise of stock options, and $6.9 million of excess tax benefit from stock proceeds. The purchase of common stock was made under a stock repurchase program authorized by TASER’s Board of Directors.
Net cash used by financing activities was $4.8 million for the year ended December 31, 2014. The repurchase of $22.4 million of the Company’s common stock, which was purchased for a weighted average cost of $12.99 per share, was partially offset by $11.0 million of proceeds from the exercise of stock options, and $8.0 million of excess tax benefit from stock proceeds. The purchase of common stock was made under a stock repurchase program authorized by TASER’s Board of Directors.
Liquidity and Capital Resources
Our most significant source of liquidity continues to be funds generated by operating activities and available cash and cash equivalents. In addition, our $10.0 million revolving credit facility is available for additional working capital needs or investment opportunities. Under the terms of the line of credit, available borrowings are reduced by outstanding letters of credit. The line is secured by substantially all of the assets of the Company, and bears interest at varying rates, currently LIBOR plus 1.5% or Prime less 0.75%. As of December 31, 2016, we had letters of credit outstanding of $2.7 million, leaving the net amount available for borrowing of $7.3 million. The facility matures on July 31, 2017. There can be no assurance that we will continue to generate cash flows at or above current levels or that we will be able to maintain our ability to borrow under our revolving credit facility. At December 31, 2016 and 2015, there were no borrowings under the line.
Our agreement with the bank requires us to comply with certain financial and other covenants including maintenance of a minimum leverage ratio and fixed charge coverage ratio. The leverage ratio (ratio of total liabilities to tangible net worth) can be no greater than 1:1, and the fixed charge coverage ratio can be no less than 1.25:1, based upon a trailing twelve-month period. At December 31, 2016, the Company’s tangible net worth ratio was 1.02:1 and its fixed charge coverage ratio was 2.30:1. The Company's violation of the leverage ratio requirement was waived as of December 31, 2016.
Based on our strong balance sheet and the fact that we had just $0.2 million in total long-term debt and capital lease obligations at December 31, 2016, we believe financing will be available, both through our existing credit line and possible additional financing. However, there is no assurance that such funding will be available on terms acceptable to us, or at all.
We believe funds generated from our expected results of operations, as well as available cash and investments, will be sufficient to finance our operations and strategic initiatives for 2017 and the foreseeable future. From time to time, our board of directors considers repurchases of our common stock. Further repurchases of our common stock will take place on the open market, will be financed with available cash and are subject to authorization as well as market and business conditions.
Contractual Obligations
The following table outlines our future contractual financial obligations by period in which payment is expected, as of December 31, 2016 (dollars in thousands):
| Total | Less than 1 Year | 1 - 3 Years | 3 - 5 Years | More than 5 Years | ||||||||||||||||
| Non-cancelable operating leases | $ | 5,117 | $ | 1,440 | $ | 1,924 | $ | 1,249 | $ | 504 | ||||||||||
| Capital leases including interest | 141 | 36 | 72 | 33 | — | |||||||||||||||
| Open purchase orders | 46,035 | 46,035 | — | — | — | |||||||||||||||
| Total contractual obligations | $ | 51,293 | $ | 47,511 | $ | 1,996 | $ | 1,282 | $ | 504 |
Open purchase orders in the above table primarily represent cancelable purchase orders with key vendors, which are included in this table due to the Company’s strategic relationships with these vendors.
We are subject to U.S. Federal income tax as well as income taxes imposed by several states and foreign jurisdictions. As of December 31, 2016, we had $4.1 million of gross unrecognized tax benefits related to uncertain tax positions. The settlement period for our long-term income tax liabilities cannot be determined; however, the liabilities are not expected to significantly increase or decrease within the next 12 months.
Off-Balance Sheet Arrangements
The discussion of off-balance sheet arrangements in Note 9 to the consolidated financial statements included in Part II, Item 8 of this Annual Report on Form 10-K is incorporated by reference herein.
Critical Accounting Estimates
We have identified the following accounting estimates as critical to our business operations and the understanding of our results of operations. The preparation of this Annual Report on Form 10-K requires us to make estimates and assumptions that affect the reported amount of assets and liabilities, disclosure of contingent assets and liabilities at the date of our consolidated financial statements, and the reported amounts of revenue and expenses during the reporting period. While we don’t believe that a change in these estimates is reasonably likely, there can be no assurance that our actual results will not differ from these estimates. The effect of these estimates on our business operations is discussed below.
Product Warranties
The Company warranties its CEWs and Axon devices from manufacturing defects on a limited basis for a period of one year after purchase and, thereafter, will replace any defective unit for a fee. Estimated costs for our standard warranty are charged to cost of products sold and services delivered when revenue is recorded for the related product. We estimate future warranty costs based on historical data related to returns and warranty costs on a quarterly basis and apply this rate to current product anticipated returns from our customers. We have also historically increased our reserve amount if we become aware of a component failure that could result in larger than anticipated returns from our customers. The accrued warranty liability is reviewed quarterly to evaluate whether it sufficiently reflects the remaining warranty obligations based on the anticipated expenditures over the balance of the warranty obligation period, and adjustments are made when actual warranty claim experience differs from estimates. As of December 31, 2016 and 2015, our reserve for warranty returns was approximately $0.8 million and $0.3 million, respectively. Warranty expense (recoveries) in the years ended December 31, 2016, 2015 and 2014 was $0.6 million, $(0.1) million and $0.4 million, respectively. The increase in warranty reserve and related expense as of and for the year ended ended December 31, 2016 was primarily driven by additional warranty reserves related to the introduction of the Axon Body 2 on-officer camera, its related Axon Dock and related parts and accessories. The Company provided a supplemental reserve of approximately $0.6 million for uncertainties surrounding potential return rates due to these products first being sold in 2016 without well-established return rates, which is standard for new products the Company introduces. The Company has been closely monitoring actual returns, and will adjust its estimates in subsequent periods, accordingly. Additionally, as the Company continues investing in the development of new technologies it will continue to assess the adequacy of its reserves related to inherent uncertainties with new product offerings.
Revenue related to separately-priced extended warranties is recorded as deferred revenue at its contractual amount and subsequently recognized in net sales on a straight-line basis over the delivery period. Costs related to extended warranties are charged to cost of products sold and services delivered when incurred.
Inventory
Inventories are stated at the lower of cost or market, with cost determined using the weighted average cost of raw materials, which approximates the first-in, first-out (“FIFO”) method, and an allocation of manufacturing labor and overhead costs. The allocation of manufacturing labor and overhead costs includes management’s judgments of what constitutes normal capacity of our production facilities and a determination of what costs are considered to be abnormal fixed production costs, which are expensed as current period charges. Provisions are made to reduce potentially excess, obsolete or slow-moving inventories to their net realizable value. These provisions are based on our best estimates after considering historical demand, projected future demand, inventory purchase commitments, industry and market trends and conditions and other factors. During the year ended December 31, 2016, the Company recorded provisions for obsolete inventory of approximately $1.2 million compared to $0.5 million during 2015. The increase in provisions made during 2016 was primarily attributable to Axon Body 1 and Axon Flex 1 on-officer cameras due to the introduction of the second generation of these products during 2016.
Revenue Recognition, Deferred Revenue and Accounts and Notes Receivable
We derive our revenue from two primary sources: (1) the sale of physical products, including our CEWs, Axon cameras, corresponding hardware extended warranties, and related accessories such as Axon Docks, cartridges and batteries, and (2) subscription to our Evidence.com digital evidence management SaaS (including data storage fees and other ancillary services), which includes varying levels of support. To a lesser extent, we also recognize training and other revenue. Revenue is recognized when persuasive evidence of an arrangement exists, delivery has occurred or services have been rendered, title has transferred, the price is fixed and collectability is reasonably assured. Contractual arrangements may contain explicit customer acceptance provisions, and under such arrangements, the Company defers recognition of revenue until formal customer acceptance is received. Extended warranty revenue, SaaS revenue and related data storage revenue are recognized ratably over the term of the contract.
Revenue arrangements with multiple deliverables are divided into separate units and revenue is allocated using the relative selling price method based upon vendor-specific objective evidence of selling price or third-party evidence of the selling prices if vendor-specific objective evidence of selling prices does not exist. If neither vendor-specific objective evidence nor third-party evidence exists, management uses its best estimate of selling price. The majority of the Company’s allocations of arrangement consideration under multiple element arrangements are performed using vendor-specific objective evidence by utilizing prices charged to customers for deliverables when sold separately. The Company’s multiple element arrangements may include future CEWs and/or Axon devices to be delivered at defined points within a multi-year contract, and in those arrangements, the Company allocates total arrangement consideration over the life of the multi-year contract to future deliverables using management’s best estimate of selling price. The Company has not utilized third-party evidence of selling price.
For the the years ended December 31, 2016, 2015 and 2014, the composition of revenue recognized from arrangements containing multiple elements and those not containing multiple elements was as follows:
| For the Year Ended December 31, 2016 | ||||||||||||||||||||
| TASER Weapons | Axon | Total | ||||||||||||||||||
| Arrangements with multiple elements | $ | 34,558 | 17.1 | % | $ | 56,270 | 85.8 | % | $ | 90,828 | 33.9 | % | ||||||||
| Arrangements without multiple elements | 168,086 | 82.9 | 9,331 | 14.2 | 177,417 | 66.1 | ||||||||||||||
| Total | $ | 202,644 | 100.0 | % | $ | 65,601 | 100.0 | % | $ | 268,245 | 100.0 | % |
| For the Year Ended December 31, 2015 | ||||||||||||||||||||
| TASER Weapons | Axon | Total | ||||||||||||||||||
| Arrangements with multiple elements | $ | 11,141 | 6.9 | % | $ | 26,489 | 74.6 | % | $ | 37,630 | 19.0 | % | ||||||||
| Arrangements without multiple elements | 151,234 | 93.1 | 9,028 | 25.4 | 160,262 | 81.0 | ||||||||||||||
| Total | $ | 162,375 | 100.0 | % | $ | 35,517 | 100.0 | % | $ | 197,892 | 100.0 | % |
| For the Year Ended December 31, 2014 | ||||||||||||||||||||
| TASER Weapons | Axon | Total | ||||||||||||||||||
| Arrangements with multiple elements | $ | 5,972 | 4.1 | % | $ | 12,149 | 64.2 | % | $ | 18,121 | 11.0 | % | ||||||||
| Arrangements without multiple elements | 139,641 | 95.9 | 6,763 | 35.8 | 146,404 | 89.0 | ||||||||||||||
| Total | $ | 145,613 | 100.0 | % | $ | 18,912 | 100.0 | % | $ | 164,525 | 100.0 | % |
Evidence.com, Axon cameras and related accessories are sometimes sold separately, but in most instances are sold together. In these instances, customers typically purchase and pay for the equipment and one year of Evidence.com in advance. Additional years of service are generally billed annually over a specified service term, which has typically ranged from one to five years. Axon equipment represents a deliverable that is provided to the customer at the time of sale, while Evidence.com services are provided over the specified term of the contract. Generally, the Company recognizes revenue for the Axon equipment at the time of the sale consistent with the discussion of multiple deliverable arrangements above. Revenue for Evidence.com is deferred at the time of the sale and recognized over the service period. At times the Company subsidizes the cost of Axon devices provided to customers to secure long-term Evidence.com service contracts. In such circumstances, revenue related to the Axon devices recognized at the time of delivery is limited to the amount collected from the customer that is not contingent upon the delivery of future Evidence.com services. The Company recognizes the remaining allocated revenue related to subsidized Axon devices over the remaining period it provides the contracted Evidence.com services.
Deferred revenue consists of payments received in advance related to products and services for which the criteria for revenue recognition have not yet been met. Deferred revenue that will be recognized during the succeeding twelve month period is recorded as current deferred revenue and the remaining portion is recorded as long-term. Deferred revenue does not include future revenue from multi-year contracts for which no invoice has yet been created. We generally bill customers in annual installments.
Sales are typically made on credit and we generally do not require collateral. We perform ongoing credit evaluations of our customers’ financial condition and maintain an allowance for estimated potential losses. Uncollectible accounts are written off when deemed uncollectible, and accounts and notes receivable are presented net of an allowance for doubtful accounts. This allowance represents our best estimate and is based on our judgment after considering a number of factors including third-party credit reports, actual payment history, customer-specific financial information and broader market and economic trends and conditions. In the event that actual uncollectible amounts differ from our estimates, additional expense could be necessary.
Valuation of Goodwill, Intangibles and Long-lived Assets
The recoverability of the goodwill is evaluated and tested for impairment at least annually during the fourth quarter or more often, if and when circumstances indicate that goodwill may not be recoverable. Finite-lived intangible assets and other long-lived assets are amortized over their useful lives. We evaluate whether events and circumstances have occurred that indicate the remaining estimated useful life of long-lived assets and intangible assets may warrant revision or that the remaining balance of these assets, including intangible assets with indefinite lives, may not be recoverable.
Circumstances that might indicate long-lived assets might not be recoverable could include, but are not limited to, a change in the product mix, a change in the way products are created, produced or delivered, or a significant change in the way our products are branded and marketed. When performing a review for recoverability, we estimate the future undiscounted cash flows expected to result from the use of the assets and their eventual disposition. The amount of the impairment loss, if impairment exists, is calculated based on the excess of the carrying amounts of the assets over their estimated fair value computed using discounted cash flows.
Income Taxes
We recognize federal, state and foreign current tax liabilities or assets based on our estimate of taxes payable or refundable in the current fiscal year by tax jurisdiction. We also recognize federal, state and foreign deferred tax assets or liabilities, as appropriate, for our estimate of future tax effects attributable to temporary differences and carry forwards.
We recognize the tax benefit from an uncertain tax position only if it is more likely than not that the tax position will be sustained based on the technical merits of the position. The tax benefits recognized in the consolidated financial statements from such positions are measured based on the largest benefit that has a greater than fifty percent likelihood of being realized upon ultimate resolution. Management must also assess whether uncertain tax positions as filed could result in the recognition of a liability for possible interest and penalties if any. We have completed research and development tax credit studies which identified approximately $11.4 million in tax credits for federal, Arizona and California income tax purposes related to the 2003 through 2016 tax years, net of the federal benefit on the Arizona and California research and development tax credits. Management determined that it was more likely than not that the full benefit of the research and development tax credit would not be sustained on examination and accordingly, has established a liability for unrecognized tax benefits of $3.9 million as of December 31, 2016. In addition, we established a $0.1 million liability related to uncertain tax positions for certain state income tax liabilities, for a total unrecognized tax benefit at December 31, 2016 of $4.0 million. Management does not expect the amount of the unrecognized tax benefit liability to change significantly within the next 12 months. Should the unrecognized tax benefit of $4.0 million be recognized, the Company’s effective tax rate would be favorably impacted. Our estimates are based on the information available to us at the time we prepare the income tax provisions. Our income tax returns are subject to audit by federal, state, and local
governments, generally years after the returns are filed. These returns could be subject to material adjustments or differing interpretations of the tax laws.
Our calculation of current and deferred tax assets and liabilities is based on certain estimates and judgments and involves dealing with uncertainties in the application of complex tax laws. Our estimates of current and deferred tax assets and liabilities may change based, in part, on added certainty or finality to an anticipated outcome, changes in accounting or tax laws in the U.S. and overseas, or changes in other facts or circumstances. In addition, we recognize liabilities for potential U.S. tax contingencies based on our estimate of whether, and the extent to which, additional taxes may be due. If we determine that payment of these amounts is unnecessary, or if the recorded tax liability is greater than our current assessment, we may be required to recognize an income tax benefit, or additional income tax expense, respectively, in our consolidated financial statements.
In preparing our consolidated financial statements, management assesses the likelihood that our deferred tax assets will be realized from future taxable income. In evaluating our ability to recover our deferred income tax assets, management considers all available positive and negative evidence, including operating results, ongoing tax planning and forecasts of future taxable income on a jurisdiction by jurisdiction basis. A valuation allowance is established if we determine that it is more likely than not that some portion or all of the net deferred tax assets will not be realized.
Although management believes that its tax estimates are reasonable, the ultimate tax determination involves significant judgments that could become subject to audit by tax authorities in the ordinary course of business. As of December 31, 2016, the Company would need to generate approximately $44.3 million of pre-tax book income in order to realize the net deferred tax assets for which a benefit has been recorded. This estimate considers the reversal of approximately $10.6 million of gross deferred tax liabilities, $4.0 million tax-effected. We also have state net operating losses ("NOLs") of $1.8 million, which produce deferred tax assets of $68,000, which expire at various dates between 2029 and 2034. We anticipate the Company’s future income to continue to trend upward from our 2016 results, with sufficient pre-tax book income to realize a large portion of our deferred tax assets. However, based on specific income projections in years in which certain tax assets are set to expire, and cumulative losses in certain foreign tax jurisdictions, a reserve of approximately $3.5 million has been recorded as a valuation allowance against deferred tax assets as of December 31, 2016.
Stock-Based Compensation
We have historically granted stock-based compensation to key employees and non-employee directors as a means of attracting and retaining highly qualified personnel. We have historically utilized restricted stock units and stock options; however, no stock options were issued during 2016, 2015 or 2014. The fair value of restricted stock units is estimated as the closing price of our common stock on the date of grant. We estimate the fair value of granted stock options by using the Black-Scholes-Merton option pricing model, which requires the input of highly subjective assumptions. These assumptions include estimating the length of time employees will retain their stock options before exercising them (expected term), the estimated volatility of our common stock price over the expected term and the number of options that will ultimately not vest (forfeitures). The expense for both restricted stock units and stock options is recorded over the life of the grant, net of forfeitures.
We have granted a total of approximately 1.7 million performance-based awards (options and restricted stock units) of which approximately 0.4 million are outstanding as of December 31, 2016, the vesting of which is contingent upon the achievement of certain performance criteria including the successful development and market acceptance of future product introductions as well as our future sales targets and operating performance. These awards will vest and compensation expense will be recognized based on management’s best estimate of the probability of the performance criteria being satisfied using the most currently available projections of future product adoption and operating performance, adjusted at each balance sheet date. Changes in the subjective and probability-based assumptions can materially affect the estimate of fair value of stock-based compensation and consequently, the related amount recognized in our statements of operations.
Contingencies and Accrued Litigation Expense
We are subject to the possibility of various loss contingencies including product-related litigation, arising in the ordinary course of business. We consider the likelihood of loss or impairment of an asset or the incurrence of a liability, as well as our ability to reasonably estimate the amount of loss in determining loss contingencies. An estimated loss contingency is accrued when it is probable that an asset has been impaired or a liability has been incurred and the amount of loss can be reasonably estimated. We regularly evaluate current information available to us to determine whether such accruals should be adjusted and whether new accruals are required.
Previous: Item 6. Selected Financial Data · Next: Item 7A. Quantitative and Qualitative Disclosures About Market Risk