 filings.tools
Item 5. Market for Registrant’s Common Equity, Related Stockholder Matters and Issuer Purchases of Equity Securities
4K characters. Original on sec.gov · Markdown
Item 5. Market for Registrant’s Common Equity, Related Stockholder Matters and Issuer Purchases of Equity Securities
Market and Stockholder Information
Our common stock trades on The NASDAQ Global Select Market under the symbol “BIIB.” The following table shows the high and low sales price for our common stock as reported by The NASDAQ Global Select Market for each quarter in the years ended December 31, 2014 and 2013:
| Common Stock Price | |||||||||||||||
| 2014 | 2013 | ||||||||||||||
| High | Low | High | Low | ||||||||||||
| First Quarter | $ | 358.89 | $ | 270.62 | $ | 192.92 | $ | 139.72 | |||||||
| Second Quarter | $ | 322.25 | $ | 272.02 | $ | 242.64 | $ | 191.80 | |||||||
| Third Quarter | $ | 349.00 | $ | 298.31 | $ | 248.95 | $ | 203.55 | |||||||
| Fourth Quarter | $ | 361.93 | $ | 290.85 | $ | 298.82 | $ | 221.07 |
As of January 30, 2015, there were approximately 816 stockholders of record of our common stock.
In addition, as of January 30, 2015, 30 stockholders of record of Biogen, Inc. common stock have yet to exchange their shares of Biogen, Inc. common stock for our common stock as contemplated by the merger of Biogen, Inc. and IDEC Pharmaceuticals Corporation in November 2003.
Dividends
We have not paid cash dividends since our inception. While we historically have not paid cash dividends and do not have a current intention to pay cash dividends, we continually review our capital allocation strategies, including, among other things, payment of cash dividends, stock repurchases, or acquisitions.
Issuer Purchases of Equity Securities
The following table summarizes our common stock repurchase activity during the fourth quarter of 2014:
| Period | Total Number of Shares Purchased (#) | Average Price Paid per Share ($) | Total Number of Shares Purchased as Part of Publicly Announced Programs (#) | Maximum Number of Shares That May Yet Be Purchased Under Our Programs | |||||||
| October 2014 | 7,862 | 297.72 | 7,771 | 2,939,869 | |||||||
| November 2014 | 1,395,731 | 314.38 | 1,395,731 | 1,544,138 | |||||||
| December 2014 | 279,982 | 305.98 | 279,982 | 1,264,156 | |||||||
| Total | 1,683,575 | 312.90 |
On February 11, 2011, we announced that our Board of Directors authorized the repurchase of up to 20.0 million shares of common stock. This authorization does not have an expiration date. As of December 31, 2014, approximately 18.7 million shares of our common stock at a cost of $2,770.0 million have been repurchased under this authorization and approximately 1.3 million shares of our common stock remain available for repurchase.
Stock Performance Graph
The graph below compares the five-year cumulative total stockholder return on our common stock, the S&P 500 Index, the Nasdaq Pharmaceutical Index and the Nasdaq Biotechnology Index assuming the investment of $100.00 on December 31, 2009 with dividends being reinvested. The stock price performance in the graph below is not necessarily indicative of future price performance.
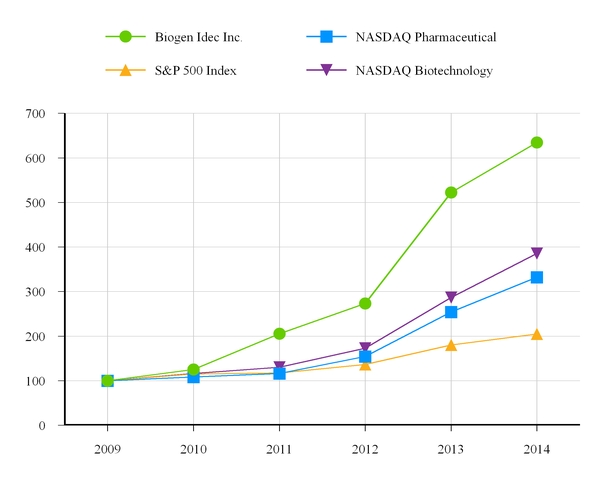
| 2009 | 2010 | 2011 | 2012 | 2013 | 2014 | |||||||
| Biogen Idec Inc. | 100.00 | 125.33 | 205.70 | 273.59 | 522.56 | 634.49 | ||||||
| NASDAQ Pharmaceutical | 100.00 | 108.40 | 116.03 | 154.38 | 254.51 | 332.21 | ||||||
| S&P 500 Index | 100.00 | 115.06 | 117.49 | 136.30 | 180.44 | 205.14 | ||||||
| NASDAQ Biotechnology | 100.00 | 116.06 | 130.08 | 172.67 | 286.67 | 385.29 |
Previous: Item 4. Mine Safety Disclosures · Next: Item 6. Selected Financial Data