 filings.tools
Item 7. Management’s Discussion and Analysis of Financial Condition and Results of Operations
109K characters. Original on sec.gov · Markdown
Item 7. Management’s Discussion and Analysis of Financial Condition and Results of Operations
The following discussion should be read in conjunction with our consolidated financial statements and related notes beginning on page F-1 of this report. Certain totals may not sum due to rounding.
Executive Summary
Introduction
Biogen is a global biopharmaceutical company focused on discovering, developing, manufacturing and delivering therapies to patients for the treatment of neurodegenerative diseases, hematologic conditions and autoimmune disorders.
Our marketed products include TECFIDERA, AVONEX, PLEGRIDY, TYSABRI and FAMPYRA for multiple sclerosis (MS), ELOCTATE for hemophilia A and ALPROLIX for hemophilia B, and FUMADERM for the treatment of severe plaque psoriasis. We also have a collaboration agreement with Genentech, Inc. (Genentech), a wholly-owned member of the Roche Group, which entitles us to certain business and financial rights with respect to RITUXAN for the treatment of non-Hodgkin's lymphoma, chronic lymphocytic leukemia (CLL) and other conditions, GAZYVA indicated for the treatment of CLL, and other potential anti-CD20 therapies.
Our current revenues depend upon continued sales of our principal products. We may be substantially dependent on sales from our principal products for many years, including an increasing reliance on sales and growth of TECFIDERA as we continue to expand into additional markets. In the longer term, our revenue growth will be dependent upon the successful clinical development, regulatory approval and launch of new commercial products as well as additional indications for our existing products, our ability to obtain and maintain patents and other rights related to our marketed products and assets originating from our research and development efforts, and successful execution of external business development opportunities. As part of our ongoing research and development efforts, we have devoted significant resources to conducting clinical studies to advance the development of new pharmaceutical products and to explore the utility of our existing products in treating disorders beyond those currently approved in their labels. In addition to our innovative drug development efforts, we aim to leverage our manufacturing capabilities and scientific expertise to extend our mission to improve the lives of patients living with serious diseases through the development, manufacture and marketing of biosimilars through
Samsung Bioepis, our joint venture with Samsung BioLogics Co. Ltd. (Samsung Biologics).
Financial Highlights
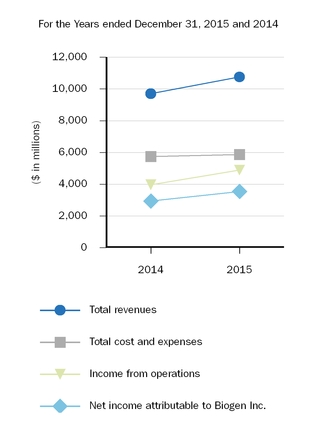
Diluted earnings per share attributable to Biogen Inc. were $15.34 for 2015, representing an increase of 24.0% over the same period in 2014.
As described below under “Results of Operations,” our income from operations for the year ended December 31, 2015, reflects the following:
| • | Total revenues were $10,763.8 million for 2015, representing an increase of 10.9% over the same period in 2014. |
| • | Product revenues, net totaled $9,188.5 million for 2015, representing an increase of 12.0% over the same period in 2014. This increase was driven by a 25.1% increase in worldwide TECFIDERA revenues as well as revenue from our recent product additions PLEGRIDY, ELOCTATE and ALPROLIX, partially offset by a decrease in worldwide AVONEX and TYSABRI revenues. In addition, product revenues, net for 2015, compared to the same period in 2014, were negatively impacted by foreign currency exchange losses of $388.1 million, partially offset by comparative net gains recognized under our foreign currency hedging program of $166.3 million. |
| • | Our share of RITUXAN and GAZYVA operating profits totaled $1,339.2 million for 2015, representing an increase of 12.0% over the same period in 2014. This increase was primarily due to a 4% increase in U.S. product sales of RITUXAN and price increases. |
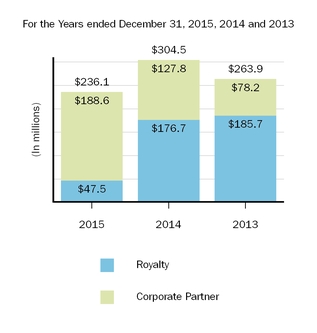
| • | Other revenues totaled $236.1 million for 2015, representing a decrease of 22.5% from the same period in 2014. This decrease was driven by a 73.1% decrease in royalty revenues primarily due to the expiration of U.S. patent rights that gave rise to royalty payments related to ANGIOMAX, partially offset by a 47.6% increase in corporate partner revenues primarily due to an increase in contract manufacturing activities. |
| • | Total cost and expenses totaled $5,872.8 million for 2015, representing an increase of 2.2% compared to the same period in 2014. This increase was driven by a 6.3% increase in research and development expense, a 5.9% increase in cost of sales, losses recognized on fair value remeasurement of contingent consideration as well as the recognition of a $93.4 million charge related to our recent corporate restructuring. These increases were partially offset by a 21.9% decrease in the amortization of acquired intangible assets and a 5.3% decrease in selling, general and administrative expenses. |
We generated $3,716.1 million of net cash flows from operations for 2015, which were primarily driven by earnings. Cash, cash equivalents and marketable securities totaled approximately $6,188.9 million as of December 31, 2015.
On September 15, 2015, we issued senior unsecured notes for an aggregate principal amount of $6.0 billion.
During the year ended December 31, 2015, we repurchased and retired approximately 16.8 million shares of common stock at a cost of $5.0 billion under our share repurchase programs.
Restructuring
On October 21, 2015, we announced a corporate restructuring, which includes the termination of certain pipeline programs and an 11% reduction in workforce. For additional information, please read Restructuring set forth below in this Management's Discussion and Analysis of Financial Condition and Results of Operations.
Acquisitions
On February 12, 2015, we completed the acquisition of all of the outstanding stock of Convergence Pharmaceuticals (Convergence), a clinical-stage biopharmaceutical company with a focus on developing product candidates for neuropathic pain. For additional information related to this transaction, please read Note 2, Acquisitions to our consolidated financial statements included in this report.
Collaborative and Other Relationships
On July 2, 2015, we announced a collaboration and license agreement to develop gene-based therapies for multiple ophthalmic diseases with Applied Genetic Technologies Corporation (AGTC).
On September 9, 2015, we announced an agreement with Mitsubishi Tanabe Pharma Corporation (MTPC) to exclusively license amiselimod (MT-1303), a late stage experimental medicine with potential in multiple autoimmune indications. Amiselimod is an oral compound that targets the sphingosine 1-phosphate receptor.
For additional information related to these transactions, please read Note 19, Collaborative and Other Relationships to our consolidated financial statements included in this report.
Business Environment
The biopharmaceutical industry and the markets in which we operate are intensely competitive. Many of our competitors are working to develop or have commercialized products similar to those we market or are developing. In addition, the commercialization of certain of our own approved MS products, products of our collaborators and pipeline product candidates may negatively impact future sales of our existing MS products. Our products may also face increased competitive pressures from the introduction of generic versions, prodrugs of existing therapeutics or biosimilars of existing products and other technologies, such as gene therapies.
In addition, sales of our products are dependent, in large part, on the availability and extent of coverage, pricing and reimbursement from government health administration authorities, private health insurers and other organizations.
For additional information related to our competition and pricing risks that could negatively impact our products, please read the “Risk Factors” section of this report.
Results of Operations
Revenues
Revenues are summarized as follows:
| For the Years Ended December 31, | % Change | ||||||||||||||||
| 2015 compared to 2014 | 2014 compared to 2013 | ||||||||||||||||
| (In millions, except percentages) | 2015 | 2014 | 2013 | ||||||||||||||
| Product Revenues: | |||||||||||||||||
| United States | $ | 6,545.8 | $ | 5,566.7 | $ | 3,581.0 | 17.6 | % | 55.5 | % | |||||||
| Rest of world | 2,642.7 | 2,636.7 | 1,961.3 | 0.2 | % | 34.4 | % | ||||||||||
| Total product revenues | 9,188.5 | 8,203.4 | 5,542.3 | 12.0 | % | 48.0 | % | ||||||||||
| Unconsolidated joint business revenues | 1,339.2 | 1,195.4 | 1,126.0 | 12.0 | % | 6.2 | % | ||||||||||
| Other revenues | 236.1 | 304.5 | 263.9 | (22.5 | )% | 15.4 | % | ||||||||||
| Total revenues | $ | 10,763.8 | $ | 9,703.3 | $ | 6,932.2 | 10.9 | % | 40.0 | % |
Product Revenues
Product revenues are summarized as follows:
| For the Years Ended December 31, | % Change | ||||||||||||||||
| 2015 compared to 2014 | 2014 compared to 2013 | ||||||||||||||||
| (In millions, except percentages) | 2015 | 2014 | 2013 | ||||||||||||||
| Multiple Sclerosis: | |||||||||||||||||
| TECFIDERA | $ | 3,638.4 | $ | 2,909.2 | $ | 876.1 | 25.1 | % | 232.1 | % | |||||||
| Interferon* | 2,968.7 | 3,057.6 | 3,005.5 | (2.9 | )% | 1.7 | % | ||||||||||
| TYSABRI | 1,886.1 | 1,959.5 | 1,526.5 | (3.7 | )% | 28.4 | % | ||||||||||
| FAMPYRA | 89.7 | 80.2 | 74.0 | 11.8 | % | 8.4 | % | ||||||||||
| Hemophilia: | |||||||||||||||||
| ELOCTATE | 319.7 | 58.4 | — | 447.4 | % | ** | |||||||||||
| ALPROLIX | 234.5 | 76.0 | — | 208.6 | % | ** | |||||||||||
| Other product revenues: | |||||||||||||||||
| FUMADERM | 51.4 | 62.5 | 60.2 | (17.8 | )% | 3.8 | % | ||||||||||
| Total product revenues | $ | 9,188.5 | $ | 8,203.4 | $ | 5,542.3 | 12.0 | % | 48.0 | % |
- Interferon includes AVONEX and PLEGRIDY.
** Percentage not meaningful.
Multiple Sclerosis (MS)
TECFIDERA
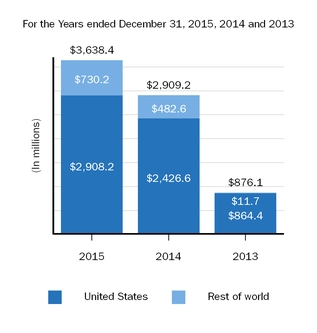
For 2015 compared to 2014, the increase in U.S. TECFIDERA revenues was primarily due to an increase in unit sales volume of 13% as TECFIDERA penetrated the U.S. market, and increases in gross price partially offset by higher discounts and allowances.
For 2014 compared to 2013, the increase in U.S. TECFIDERA revenues was primarily due to increases in unit sales volume.
For 2015 compared to 2014, the increase in rest of world TECFIDERA revenues was primarily due to increases in unit sales volume in existing markets and in additional markets as we continue to launch the product and expand our presence around the world. These increases were partially offset by pricing reductions in Germany as described below. Rest of world TECFIDERA revenues for 2015 compared to 2014 were negatively impacted by foreign currency exchange losses totaling $74.1 million. These foreign currency exchange losses were partially offset by comparative net gains recognized under our foreign currency hedging program totaling $47.5 million.
For 2014 compared to 2013, rest of world TECFIDERA revenues increased as sales in Germany began in the first quarter of 2014.
Under German legislation related to the pricing of new drug products introduced in the German market, pricing is unregulated for the first 12 months after launch. We launched TECFIDERA in Germany in February 2014, and our unregulated pricing ended in the first quarter of 2015, at which time we began recognizing revenue at the fixed price established through our negotiations with the German regulatory authorities. The negotiated annual price is fixed for three years.
While we continue to see a strong uptake of TECFIDERA in newly launched territories, total market growth and patient switch rates in our maturing markets, such as the U.S. and Germany, have returned to historical averages for MS.
Interferon
AVONEX
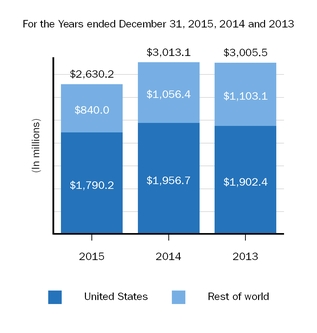
For 2015 compared to 2014, the decrease in U.S. AVONEX revenues was primarily due to a decrease in unit sales volume of 17%, which was attributable in part to patients transitioning to PLEGRIDY and oral MS therapies, including TECFIDERA, partially offset by gross price increases.
For 2014 compared to 2013, the increase in U.S. AVONEX revenues was primarily due to price increases, partially offset by a decrease in unit sales volume of 10%, which was attributable in part to patients transitioning to PLEGRIDY and oral MS therapies, including TECFIDERA.
For 2015 compared to 2014, the decrease in rest of world AVONEX revenues was primarily due to a decrease in unit sales volume of 11% primarily in Europe, attributable to patients transitioning to PLEGRIDY and oral MS therapies, including TECFIDERA. Rest of world AVONEX revenues for 2015 compared to 2014, were negatively impacted by foreign currency exchange losses of $153.1 million. These foreign currency exchange losses were partially offset by comparative net gains recognized under our foreign currency hedging program of $58.4 million.
For 2014 compared to 2013, the decrease in rest of world AVONEX revenues was due to a 7% decrease in unit sales volume in Europe primarily attributable to patients transitioning to oral therapies including TECFIDERA, partially offset by a 6% increase in unit demand in the emerging markets region. Rest of world AVONEX revenue for 2014 compared to 2013 also reflects the negative impact of foreign currency exchange rate changes experienced in 2014, partially offset by gains recognized in relation to the settlement of certain cash flow hedge instruments under our foreign currency hedging program.
We expect that AVONEX revenues will continue to decline as a result of competition from our own products, including PLEGRIDY and TECFIDERA, and other MS therapies.
PLEGRIDY
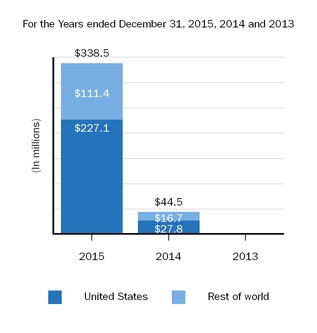
For 2015 compared to 2014, the increase in PLEGRIDY revenues was primarily due to increases in unit sales volume. Sales of PLEGRIDY began in the E.U. and the U.S. in the third and fourth quarters of 2014, respectively.
We expect that PLEGRIDY revenues will increase as PLEGRIDY becomes commercially available in additional markets and as patients transition to PLEGRIDY from AVONEX and other therapies.
TYSABRI
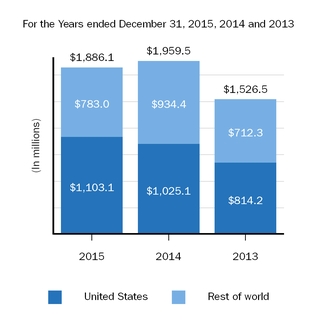
For 2015 compared to 2014, the increase in U.S. TYSABRI revenues was primarily due to an increase in unit sales volume of 4% and increases in gross price partially offset by higher discounts and allowances.
For 2014 compared to 2013, the increase in U.S. TYSABRI revenues was primarily due to price increases and our recognition, starting in April 2013, of 100% of net revenues on TYSABRI in-market sales due to our acquisition of the remaining rights to TYSABRI from Elan, partially offset by a 4% decrease in unit sales volume.
Based on data reported by Elan for 2013 and our sales to third-party customers, total U.S. TYSABRI in-market sales were $958.3 million. For 2014 compared to 2013, the increase in U.S. TYSABRI in-market sales was primarily due to price increases, partially offset by patients transitioning to oral MS therapies, including TECFIDERA.
For 2015 compared to 2014, the decrease in rest of world TYSABRI revenues was due to pricing reductions in some European countries and the prior year recognition of $53.5 million of revenue previously deferred in Italy relating to the pricing agreement with the Italian National Medicines Agency (Agenzia Italiana del Farmaco or AIFA) as discussed below. Rest of world TYSABRI revenues for 2015 compared to 2014 were negatively impacted by foreign currency exchange losses of $136.3 million. These foreign currency exchange losses were partially offset by comparative net gains recognized under our foreign currency hedging program of $45.9 million.
For 2014 compared to 2013, the increase in rest of world TYSABRI revenues was primarily due to the recognition of $53.5 million of revenue previously deferred in Italy relating to the pricing agreement with AIFA as discussed below, volume increases in Europe of 10% and in our emerging markets region of 18% and a favorable net price in Germany as the mandatory rebate percentage was reduced. Rest of world TYSABRI revenue for 2014 compared to 2013 also reflects the negative impact of foreign currency exchange rate changes experienced in 2014, partially offset by gains recognized in relation to the settlement of certain cash flow hedge instruments under our foreign currency hedging program.
We remain in discussions with AIFA about a resolution relating to a claim that sales of TYSABRI in Italy exceeded a reimbursement limit established pursuant to a Price Determination Resolution granted by AIFA in December 2006 for the period from mid-February 2009 through January 2013. We could recognize approximately EUR40 million in revenue upon resolution of this matter. For information regarding our agreement with AIFA relating to sales of TYSABRI in Italy, please read Note 17, Other Consolidated Financial Statement Detail to our consolidated financial statements included in this report.
We expect that TYSABRI revenues will continue to face competition from additional treatments for MS and certain other pipeline products, including ZINBRYTA and ocrelizumab.
Hemophilia
ELOCTATE

For 2015 compared to 2014, the increase in ELOCTATE revenues was primarily due to increases in unit sales volume. Sales of ELOCTATE in the U.S. and Japan began in the third quarter of 2014 and in the first quarter of 2015, respectively.
ALPROLIX
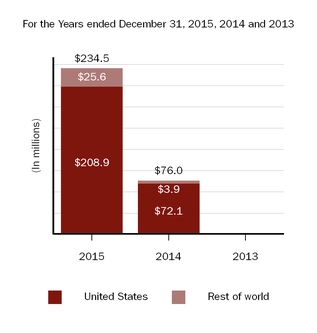
For 2015 compared to 2014, the increase in ALPROLIX revenues was primarily due to increases in unit sales volume. Sales of ALPROLIX in the U.S. and Japan began in the second and fourth quarters of 2014, respectively.
We expect continued growth with ELOCTATE as there remains a significant portion of the patient population that can benefit from long-acting therapies. We also expect moderating patient additions for ALPROLIX.
Unconsolidated Joint Business Revenues
Revenues from unconsolidated joint business are summarized as follows:
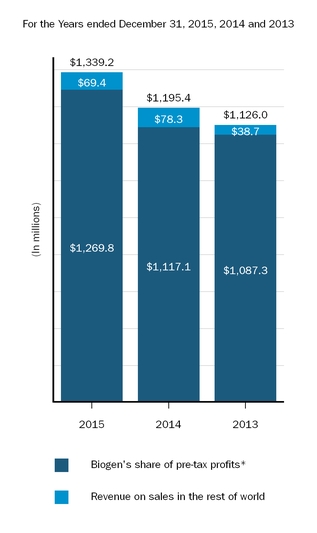
*Biogen's share of pre-tax profits includes the reimbursement of selling and development expenses.
Biogen’s Share of Pre-tax Profits in the U.S. for RITUXAN and GAZYVA
The following table provides a summary of amounts comprising our share of pre-tax profits on RITUXAN and GAZYVA in the U.S.:
| For the Years Ended December 31, | |||||||||||
| (In millions) | 2015 | 2014 | 2013 | ||||||||
| Product revenues, net | $ | 3,847.9 | $ | 3,556.6 | $ | 3,425.8 | |||||
| Cost and expenses | 673.7 | 771.1 | 615.9 | ||||||||
| Pre-tax profits in the U.S. | $ | 3,174.2 | $ | 2,785.5 | $ | 2,809.9 | |||||
| Biogen's share of pre-tax profits* | $ | 1,269.8 | $ | 1,117.1 | $ | 1,087.3 |
For 2015 compared to 2014, the increase in U.S. product revenues was primarily due to a 4% increase in RITUXAN unit sales volume and price increases, partially offset by higher discounts and allowances.
For 2014 compared to 2013, the increase in U.S. product revenues was primarily due to price increases and an increase in RITUXAN unit sales volume, partially offset by the 2013 recognition of $94.9 million in net revenues resulting from the July 2013 issuance by the Department of Health and Human Services of its final rule on the Exclusion of Orphan Drugs for Certain Covered Entities Under 340B Program. The issuance of the final rule by the Department of Health and Human Services did not have an impact on the amount we recorded as revenues from unconsolidated joint business in our consolidated statements of income because, through June 30, 2013, we had been increasing our share of profits in the U.S. to reflect our interpretation of the proposed 340B rule. The final rule was consistent with our prior interpretation.
Collaboration costs and expenses for 2015 compared to 2014 decreased primarily due to the 2014 recognition of $53.9 million of additional Branded Pharmaceutical Drug (BPD) fee expense as well as lower RITUXAN cost of sales, partially offset by higher GAZYVA sales and marketing expenses. During 2014 the Internal Revenue Service issued final regulations related to the BPD fee, which had the effect of changing the recognition of the fee for accounting purposes, from the period in which the fee was paid, to the period when the sale occurs. As a result of these final regulations, we recognized an incremental BPD fee in 2014 for the periods 2013 through the end of the third quarter of 2014. The final regulations did not change the timing of payments.
Collaboration costs and expenses for 2014 compared to 2013 increased primarily due to the recognition of $53.9 million of additional BPD fee expense, as discussed above, as well as GAZYVA sales and marketing and research and development expenses. Upon the first marketing approval of GAZYVA by the FDA in the U.S., we began recognizing all activity, including sales and marketing and research and development expenses related to the GAZYVA program in unconsolidated joint business in our consolidated statements of income. Prior to its first regulatory approval, we recognized our share of GAZYVA development and commercialization expenses as research and development expense and selling, general and administrative expense, respectively, in our consolidated statements of income.
We expect our share of RITUXAN pre-tax profits in the U.S. to decrease to 39% from 40% if GAZYVA is approved by the FDA in RITUXAN-refractory indolent non-Hodgkin’s lymphoma. For additional information related to our collaboration with Genentech, including information regarding the pre-tax profit sharing formula and its impact on future unconsolidated joint business revenues, please read Note 19, Collaborative and Other Relationships to our consolidated financial statements included in this report.
Revenue on Sales in the Rest of World for RITUXAN
Revenue on sales in the rest of world for RITUXAN consists of our share of pre-tax co-promotion profits on RITUXAN in Canada and royalty revenue on sales outside the U.S. and Canada. For 2015 compared to 2014, revenue on sales in the rest of world for RITUXAN decreased as a result of lower pre-tax co-promotion profits on RITUXAN in Canada and patent expirations.
For 2014 compared to 2013, revenue on sales in the rest of world for RITUXAN increased primarily due to the prior year recognition of a $41.2 million charge for damages and interest awarded to Hoechst in its arbitration with Genentech.
The royalty period for sales in the rest of world is 11 years from the first commercial sale of such product on a country-by-country basis. The royalty periods for the substantial portion of the royalty-bearing sales in the rest of world markets expired during 2012 and 2013. We expect future revenue on sales of RITUXAN in the rest of world will be limited to our share of pre-tax co-promotion profits in Canada.
Other Revenues
Royalty Revenues
We receive royalties from net sales on products related to patents that we have out-licensed. Prior to 2015, our most significant source of royalty revenue had been derived from net worldwide sales of ANGIOMAX, which was out-licensed to The Medicines Company. On December 15, 2014 we ceased recognizing royalty revenues from U.S. sales of ANGIOMAX, contemporaneous with the U.S. patent’s expiration.
For 2015 compared to 2014, royalty revenues decreased primarily due to the expiration of U.S. patent rights that gave rise to royalty payments related to ANGIOMAX.
For 2014 compared to 2013, royalty revenues decreased due to a decrease in the net worldwide sales of ANGIOMAX subject to royalty payments.
Corporate Partner Revenues
Our corporate partner revenues include amounts earned under contract manufacturing agreements, including revenues related to our arrangements with Samsung Bioepis and other strategic partners.
For 2015 compared to 2014, the increase in corporate partner revenues was primarily due to higher contract manufacturing revenue and the start of product shipments to Sobi in relation to our collaboration agreement as Sobi has assumed final development and commercialization of ALPROLIX and ELOCTATE in Europe, North Africa, Russia, and certain markets in the Middle East.
For 2014 compared to 2013, the increase in corporate partner revenues was primarily due to higher contract manufacturing revenue and increased revenue from our biosimilar arrangements, partially offset by lower revenue associated with our Zevalin supply agreement. Zevalin is a program we sold in 2007 but continued to manufacture in accordance with the amendment to our Zevalin supply agreement. We completed our manufacturing obligation under this amendment in the third quarter of 2014.
For additional information on our relationships with Samsung Bioepis and Sobi, please read Note 19, Collaborative and Other Relationships to our consolidated financial statements included in this report.
Reserves for Discounts and Allowances
Revenues from product sales are recorded net of applicable discounts, allowances and other governmental allowances including those associated with the implementation of pricing actions in certain international markets where we operate.
Reserves established for these discounts and allowances are classified as reductions of accounts receivable (if the amount is payable to our customer) or a liability (if the amount is payable to a party other than our customer). These reserves are based on estimates of the amounts earned or to be claimed on the related sales. Our estimates take into consideration our historical experience, current contractual and statutory requirements, specific known market events and trends, and forecasted customer buying and payment patterns. Actual amounts may ultimately differ from our estimates. If actual results vary, we adjust these estimates, which will have an effect on earnings in same the period. To date, such adjustments have not been significant.
Reserves for discounts, contractual adjustments and returns that reduced gross product revenues are summarized as follows:
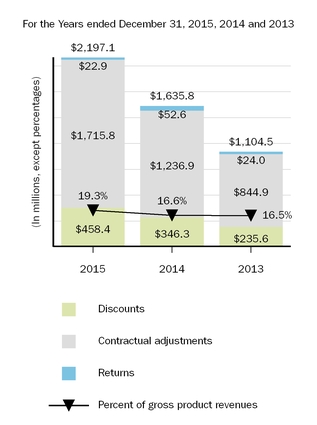
Reserves for discounts and allowances increased in each of the past three years due to increased sales associated with launches of TECFIDERA, PLEGRIDY, ELOCTATE and ALPROLIX. In addition, we began recognizing reserves for discounts and allowances for U.S. TYSABRI revenue in the second quarter of 2013 following our acquisition of all remaining rights to TYSABRI from Elan.
Discounts
Discounts include trade term discounts and wholesaler incentives.
For 2015 compared to 2014, the increase in discounts was primarily driven by our recent product additions, gross price increases as well as increases in contractual rates.
For 2014 compared to 2013, the increase in discounts was primarily driven by our recent product additions.
Contractual Adjustments
Contractual adjustments relate to Medicaid and managed care rebates, co-payment assistance (copay), Veterans Administration (VA), Public Health Service (PHS) discounts, specialty pharmacy program fees and other government rebates or applicable allowances.
For 2015 compared to 2014, the increase in contractual adjustments was primarily due to our recent product additions, higher Medicaid and other governmental rebates and allowances in the U.S., and managed care rebates as a result of an increase in contracted business and gross prices.
For 2014 compared to 2013, the increase in contractual adjustments was primarily due to our recent product additions, increases in managed care rebates, U.S. governmental rebates and allowances as a result of price increases and additional managed care contracts.
Returns
Product return reserves are established for returns made by wholesalers. In accordance with contractual terms, wholesalers are permitted to return product for reasons such as damaged or expired product. The majority of wholesaler returns are due to product expiration. Reserves for product returns are recorded in the period the related revenue is recognized, resulting in a reduction to product sales.
For 2015 compared to 2014, return reserves decreased primarily due to a reduction in return rates based on recent experiences of returned products.
For 2014 compared to 2013, return reserves increased primarily due to our acquisition of all remaining rights to TYSABRI, the start of commercial sales of TECFIDERA and increased return rates for prior year AVONEX shipments.
For additional information related to our reserves, please read Note 4, Reserves for Discounts and Allowances to our consolidated financial statements included in this report.
Cost and Expenses
A summary of total cost and expenses is as follows:
| For the Years Ended December 31, | % Change | ||||||||||||||||
| 2015 compared to 2014 | 2014 compared to 2013 | ||||||||||||||||
| (In millions, except percentages) | 2015 | 2014 | 2013 | ||||||||||||||
| Cost of sales, excluding amortization of acquired intangible assets | $ | 1,240.4 | $ | 1,171.0 | $ | 857.7 | 5.9 | % | 36.5 | % | |||||||
| Research and development | 2,012.8 | 1,893.4 | 1,444.1 | 6.3 | % | 31.1 | % | ||||||||||
| Selling, general and administrative | 2,113.1 | 2,232.3 | 1,712.1 | (5.3 | )% | 30.4 | % | ||||||||||
| Amortization of acquired intangible assets | 382.6 | 489.8 | 342.9 | (21.9 | )% | 42.8 | % | ||||||||||
| Restructuring charges | 93.4 | — | — | ** | ** | ||||||||||||
| Collaboration profit sharing | — | — | 85.4 | ** | (100.0 | )% | |||||||||||
| (Gain) loss on fair value remeasurement of contingent consideration | 30.5 | (38.9 | ) | (0.5 | ) | (178.4 | )% | ** | |||||||||
| Total cost and expenses | $ | 5,872.8 | $ | 5,747.7 | $ | 4,441.6 | 2.2 | % | 29.4 | % |
** Percentage not meaningful.
Cost of Sales, Excluding Amortization of Acquired Intangible Assets (Cost of Sales)
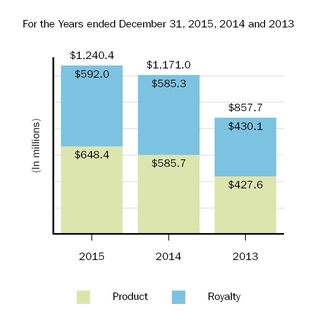
Product Cost of Sales
For 2015 compared to 2014, the increase in product cost of sales was primarily driven by increased contract manufacturing production and higher unit sales volume of our marketed products, including newly launched products.
For 2014 compared to 2013, the increase in product cost of sales was driven by higher unit sales volume, including due to recent product launches and our contract and biosimilars manufacturing arrangements.
Inventory amounts written down as a result of excess, obsolescence, unmarketability or other reasons totaled $41.9 million, $50.6 million, and $47.3 million for the years ended December 31, 2015, 2014, and 2013, respectively.
Royalty Cost of Sales
For 2015 compared to 2014, the increase in royalty cost of sales was primarily driven by the increase in royalties due to Sobi on increased sales of our hemophilia products and an increase in the contractual rate of TYSABRI contingent payments due to Perrigo Company plc (Perrigo), which is based on the expected level of annual worldwide net sales of TYSABRI, partially offset by a decrease in TYSABRI revenues and the expiration of certain third-party royalties related to TYSABRI. For additional information on the contingent payments due to Perrigo, please read Note 2, Acquisitions to our consolidated financial statements included in this report.
For 2014 compared to 2013, the increase in royalty cost of sales was primarily driven by our acquisition of all remaining rights to TYSABRI, partially offset by the expiration of a third-party royalty related to AVONEX.
Research and Development
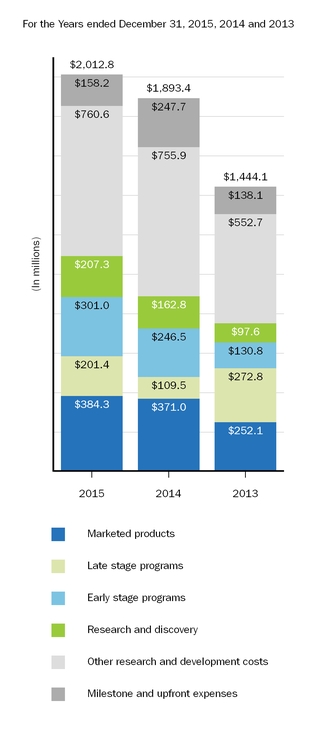
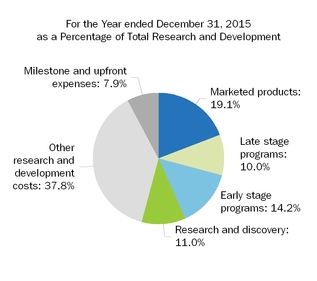
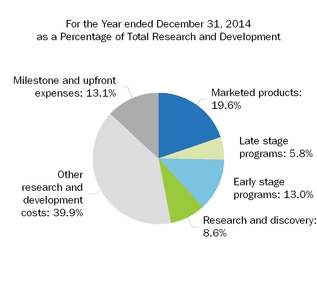
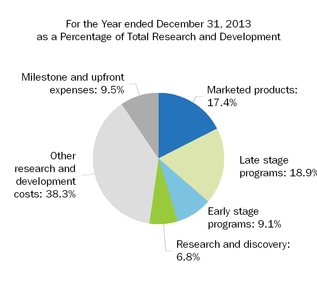
Research and development expense incurred in support of our marketed products includes costs associated with product lifecycle management activities including, if applicable, costs associated with the development of new indications for existing products. Late stage programs are programs in Phase 3 development or in registration stage. Early stage programs are programs in Phase 1 or Phase 2 development. Research and discovery represents costs incurred to support our discovery research and translational science efforts. Other research and development costs consist of indirect costs incurred in support of overall research and development activities and non-specific programs, including activities that benefit multiple programs, such as management costs as well as depreciation and other facility-based expenses. Costs are reflected in the development stage based upon the program status when incurred. Therefore, the same program could be reflected in different development stages in the same year. For several of our programs, the research and development activities are part of our collaborative and other relationships. Our costs reflect our share of the total costs incurred.
For 2015 compared to 2014, the increase in research and development expense was primarily related to increases in costs incurred in connection with our late and early stage programs and research and discovery, partially offset by a decrease in milestone and upfront expenses and the positive impact of foreign currency translation of $34.0 million.
The increase in spending associated with our late stage programs for 2015 compared to 2014 was primarily driven by costs incurred to advance our aducanumab program for Alzheimer's disease and the nusinersen program for the treatment of SMA, partially offset by a decrease in costs related to ZINBRYTA, which is in registration stage, and the approvals of PLEGRIDY and ELOCTATE in 2014.
The increase in spending associated with our early stage programs for 2015 compared to 2014 was primarily due to costs incurred in connection with our aducanumab program for Alzheimer's disease, which advanced to a late stage program during the third quarter of 2015, the BAN2401 program for Alzheimer’s disease related to our collaboration with Eisai and our Raxatrigine program for trigeminal neuralgia (TGN). These increases were partially offset by a decrease in costs incurred in connection with the nusinersen program for the treatment of SMA as the program advanced to a late stage program during the first quarter of 2015.
For 2014 compared to 2013, the increase in research and development expense was primarily related to increases in costs incurred in connection with our early stage programs, milestone and upfront expenses, research and discovery and marketed products, partially offset by a decrease in costs incurred in connection with our late stage programs.
Research and development expense related to our early stage programs increased in 2014 compared to 2013 primarily due to costs incurred in the advancement of our Anti-LINGO program in MS, our aducanumab program for Alzheimer’s disease, the BAN2401 program for Alzheimer’s disease related to our collaboration agreement with Eisai and an increase in spending incurred in connection with our development of STX-100 for the treatment of idiopathic pulmonary fibrosis.
The increase in spending associated with marketed products in 2014 compared to 2013 is related to ALPROLIX, ELOCTATE and PLEGRIDY, which were approved in 2014, and costs associated with TYSABRI, which previously were shared with Elan prior to our acquisition of all remaining rights to TYSABRI from Elan in April 2013.
The decrease in spending associated with our late stage product candidates in 2014 compared to 2013 was driven by approvals of ALPROLIX, ELOCTATE and PLEGRIDY in 2014 and GAZYVA in the fourth quarter of 2013, partially offset by costs incurred in the development of nusinersen for the treatment of SMA.
We intend to continue committing significant resources to targeted research and development opportunities where there is a significant unmet need and where the drug candidate has the potential to be highly differentiated. Specifically, we intend to continue to invest in our MS pipeline, our aducanumab program, the BAN2401 and E2609 programs, the nusinersen program, the amiselimod program and our Raxatrigine program.
Milestone and Upfront Expenses included in Research and Development Expense
Research and development expense for 2015 includes $60.0 million recorded upon entering into our collaboration with MTPC, $48.1 million recorded upon entering into our collaboration with AGTC, $30.0 million recorded as milestones in relation to our collaboration agreements with Ionis and $16.0 million paid to AbbVie related to milestones for the development of ZINBRYTA as a result of filing with the FDA and EMA during the year. For additional information about these transactions, please read Note 19, Collaborative and Other Relationships to our consolidated financial statements included in this report.
Research and development expense for 2014 includes $139.3 million recorded in connection with our collaboration agreement with Eisai, $25.0 million recorded as milestones in relation to our collaboration agreements with Ionis and an aggregate of $60.0 million related to upfront payments made to Sangamo and Google Inc. and for other strategic business arrangements.
Included in total research and development expense in 2013 were charges of $75.0 million related to an upfront payment made to Ionis in September 2013 upon entering into a six year research collaboration with Ionis under which we both agreed to perform research and then seek to develop and commercialize antisense or other therapeutics for the treatment of neurological disorders, $36.0 million related to upfront and milestone payments made to Samsung Bioepis in December 2013 upon entering into a development and commercialization agreement and a $10.0 million milestone payment made to Ionis related to the selection and advancement of IONIS-DMPKRx to treat mytonic dystrophy (DM1).
These payments are classified as research and development expense as the programs they relate to have not achieved regulatory approval.
Selling, General and Administrative
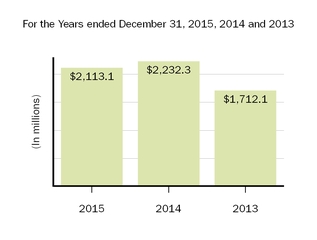
For 2015 compared to 2014, the decrease in selling, general and administrative expenses was driven by a decrease in corporate giving, incentive compensation and the positive impact of foreign currency translation of $87.6 million, partially offset by an increase of $38.9 million of BPD fee expense.
For 2014 compared to 2013, the increase in selling, general and administrative expenses was primarily driven by costs associated with developing commercial capabilities for our recent product launches in 2014 along with an increase in sales and marketing activities in support of our MS products. The successful commercialization of new and potential new products requires significant investments, such as sales force build and
development, training, marketing, and other related activities. The increase in selling, general, and administrative expense was also driven by an increase in corporate giving and the recognition of $21.9 million of additional BPD fee expense.
Amortization of Acquired Intangible Assets

Our amortization expense is based on the economic consumption of intangible assets. Our most significant intangible assets are related to our AVONEX and TYSABRI products. Annually, during our long-range planning cycle, we perform an analysis of anticipated lifetime revenues of AVONEX and TYSABRI. This analysis is also updated whenever events or changes in circumstances would significantly affect the anticipated lifetime revenues of either product.
For 2015 compared to 2014, the decrease in amortization of acquired intangible assets was primarily driven by a decrease in AVONEX revenues during the comparative periods and the impact of higher expected lifetime revenues of AVONEX due to a slower than previously expected adoption of PLEGRIDY. Amortization of acquired intangible assets during 2014 included total impairment charges of $50.9 million related to one of our out-licensed patents and one of our in-process research and development (IPR&D) intangible assets.
For 2014 compared to 2013, the change in amortization of acquired intangible assets was primarily driven by a $60.2 million increase in amortization of acquired and in-licensed rights and patents as we recognized a full year of expense related to our TYSABRI rights in 2014 versus nine months of expense in 2013, total impairment charges of $50.9 million related to one of our out-licensed patents and one of our IPR&D intangible assets, and lower expected lifetime revenues of AVONEX.
Our most recent long range planning cycle was completed in the third quarter of 2015. Based upon this analysis,the estimated future amortization of acquired intangible assets is expected to be as follows:
| (In millions) | As of December 31, 2015 | ||
| 2016 | $ | 346.4 | |
| 2017 | 318.6 | ||
| 2018 | 291.0 | ||
| 2019 | 275.1 | ||
| 2020 | 269.1 | ||
| Total | $ | 1,500.2 |
We monitor events and expectations regarding product performance. If new information indicates that the assumptions underlying our most recent analysis are substantially different than those utilized in our current estimates, our analysis would be updated and may result in a significant change in the anticipated lifetime revenues of the relevant process. The occurrence of an adverse event could substantially increase the amount of amortization expense associated with our acquired intangible assets as compared to previous periods or our current expectations, which may result in a significant negative impact on our future results of operations.
For additional information related to the amortization of acquired intangible assets, please read Note 6, Intangible Assets and Goodwill to our consolidated financial statements included in this report.
Impairment of Intangible Assets
We record charges associated with impairments of intangible assets in amortization of intangible assets. Impairment charges related to our intangible assets during 2015 and 2013 were insignificant.
During 2014, we recorded a charge of $34.7 million related to the impairment of one of our out-licensed patents to reflect a change in its estimated fair value, due to a change in the underlying competitive market for that product.
During 2014, we updated the probabilities of success related to the early stage programs acquired through our recent acquisitions. This change in probability of success, combined with a delay in one of the projects, resulted in an impairment loss of $16.2 million.
For additional information, please read Note 6, Intangible Assets and Goodwill to our consolidated financial statements included in this report.
IPR&D
Overall, the value of our acquired IPR&D assets is dependent upon a number of variables, including estimates of future revenues and the effects of competition, the level of anticipated development costs and the probability and timing of successfully advancing a particular research program from a clinical trial phase to the next. We are continually reevaluating our estimates concerning these variables and evaluating industry data regarding the productivity of clinical research and the development process. Changes in our estimates of items may result in a significant change to our valuation of these assets.
The field of developing treatments for idiopathic pulmonary fibrosis (IPF) and neuropathic pain, such as TGN, are highly competitive and can be affected by rapid changes to the market. There can be no assurance that we will be able to successfully develop STX-100 for the treatment of IPF or Raxatrigine for the treatment of TGN or that a successfully developed therapy will be able to secure sufficient pricing in a competitive market. We review amounts capitalized as acquired IPR&D for impairment at least annually, as of October 31, and whenever events or changes in circumstances indicate that the carrying value of the assets might not be recoverable. Our most recent impairment assessment as of October 31, 2015 resulted in no impairments.
Restructuring Charges
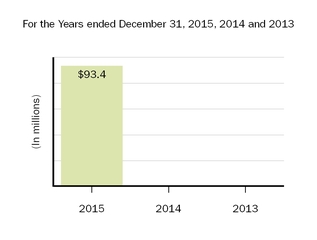
On October 21, 2015, we announced a corporate restructuring, which includes the termination of certain pipeline programs and an 11% reduction in workforce. These changes are expected to reduce the current annual run rate of operating expenses by approximately $250 million.
We expect to reinvest the savings resulting from the restructuring to support the advancement of our high potential pipeline candidates, including our programs in Alzheimer’s disease, Anti-LINGO for MS, nusinersen for SMA, Raxatrigine and amiselimod, an oral S1P modulator, and to support key commercial activities, including TECFIDERA. We also have discontinued several programs, including our Phase 3 program for TECFIDERA in secondary progressive MS (SPMS), the development of anti-TWEAK in lupus nephritis, and certain activities in immunology and fibrosis research.
We anticipate making cash payments totaling approximately $120 million under this program, which includes approximately $15.9 million related to previously accrued 2015 incentive compensation, for a total net expected restructuring charge of $105 million. These amounts will be substantially incurred and paid by the end of 2016.
We recognized $93.4 million of these charges during the fourth quarter of 2015, of which $86.2 million was related to our workforce reduction and $7.2 million was related to the pipeline program terminations.
The following table summarizes the charges and spending related to our restructuring efforts during 2015:
| (In millions) | Workforce Reduction | Pipeline Programs | Total | ||||||||
| Restructuring charges incurred during the fourth quarter of 2015 | $ | 86.2 | $ | 7.2 | $ | 93.4 | |||||
| Previously accrued incentive compensation | 15.9 | — | 15.9 | ||||||||
| Reserves established | 102.1 | 7.2 | 109.3 | ||||||||
| Amounts paid through December 31, 2015 | (68.4 | ) | (3.6 | ) | (72.0 | ) | |||||
| Restructuring reserve as of December 31, 2015 | $ | 33.7 | $ | 3.6 | $ | 37.3 |
Collaboration Profit Sharing
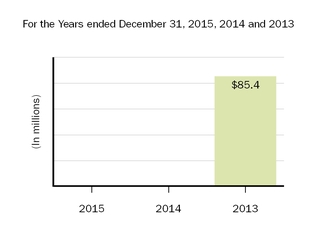
Upon the closing of our acquisition of all remaining rights to TYSABRI, our collaboration agreement with Elan was terminated, and we no longer record collaboration profit sharing. Collaboration profit sharing previously included the portion of rest of world net operating profits to be shared with Elan under the terms of our collaboration agreement for the development, manufacture and commercialization of TYSABRI. The amount also included the reimbursement for our portion of third-party royalties paid by Elan on behalf of the collaboration relating to rest of world sales. For additional information about this collaboration, please read Note 19, Collaborative and Other Relationships to our consolidated financial statements included in this report.
(Gain) Loss on Fair Value Remeasurement of Contingent Consideration
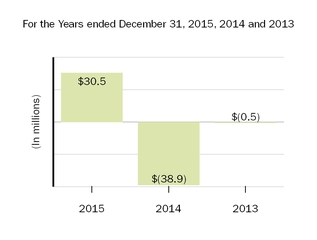
The consideration for certain of our business combinations includes future payments that are contingent upon the occurrence of a particular factor or factors. We record an obligation for such contingent consideration payments at fair value on the acquisition date. We then revalue our contingent consideration obligations each reporting period. Changes in the fair value of our contingent consideration obligations, other than changes due to payments, are recognized as a (gain) loss on fair value remeasurement of contingent consideration in our consolidated statements of income.
The loss on fair value remeasurement of contingent consideration for 2015 was primarily due to changes in the expected timing and probabilities of success related to the achievement of certain developmental milestones and in the discount rate.
The gain on fair value remeasurement of contingent consideration for 2014 was primarily due to an adjustment to the value of our contingent consideration liabilities as we updated the probabilities of success related to the early stage programs acquired through our recent acquisitions. For additional information, please read Note 7, Fair Value Measurements to our consolidated financial statements included in this report.
Other Income (Expense), Net
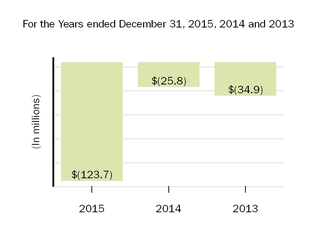
For 2015 compared to 2014, the change in other income (expense), net was primarily due to an increase in interest expense as a result of the issuance of our senior unsecured notes (2015 Senior Notes), higher foreign exchange losses and a decrease in net gains recognized on the sale of our strategic investments and marketable securities. For additional information, please read Note 17, Other Consolidated Financial Statement Detail, to our consolidated financial statements included in this report.
For 2014 compared to 2013, the change in other income (expense), net was due to lower non-income based state taxes, an increase in interest income due to higher average cash, cash equivalents and marketable securities balances, lower foreign exchange losses and decreased interest expense as we repaid our 6.0% Senior Notes in March 2013, partially offset by lower gains on investments.
We expect interest expense will continue to increase as a result of our issuance of the 2015 Senior Notes. For additional information related to our 2015 Senior Notes, please read Note 11, Indebtedness, to our consolidated financial statements included in this report.
Income Tax Provision
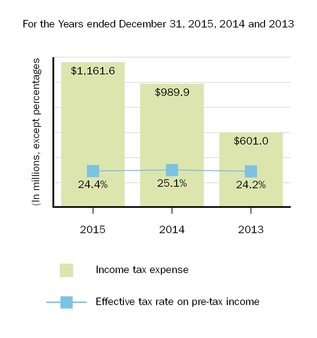
Our effective tax rate fluctuates from year to year due to the global nature of our operations. The factors that most significantly impact our effective tax rate include variability in the allocation of our taxable earnings among multiple jurisdictions, changes in tax laws, the amount and characterization of our research and development expenses, the levels of certain deductions and credits, acquisitions, and licensing transactions.
Our effective tax rate for 2015 compared to 2014 benefited from lower anticipated taxes on foreign earnings and reflects a $27.0 million benefit from the 2015 remeasurement of one of our uncertain tax positions, described below.
Our effective tax rate for 2014 compared to 2013 increased primarily as a result of the absence of a benefit related to the 2013 change in our uncertain tax position related to our U.S. federal manufacturing deduction and our unconsolidated joint business described below under "Accounting for Uncertainty in Income Taxes", lower current year expenses eligible for the orphan drug credit and a lower relative manufacturing deduction due to unqualified products, partially offset by a higher percentage of our 2014 income being earned outside the U.S.
Accounting for Uncertainty in Income Taxes
During 2013, we received updated technical guidance from the IRS concerning the calculation of our U.S. federal manufacturing deduction and overall tax classification of our unconsolidated joint business for the current and prior year filings. Based on this guidance we reevaluated the level of our unrecognized benefits related to uncertain tax positions and recorded a $49.8 million income tax benefit. This benefit was for a previously unrecognized position and related to years 2005 through 2012. We recorded an offsetting expense of $11.3 million for non-income based state taxes, which was recorded in other income (expense) in our consolidated statements of income. This uncertain tax position was then remeasured in 2015 resulting in a $27.0 million benefit related to the state tax impacts of the IRS technical guidance.
For more information on our uncertain tax positions and income tax rate reconciliation for 2015, 2014 and 2013, please read Note 16, Income Taxes to our consolidated financial statements included in this report.
Share in Equity in Loss of Investee, Net of Tax
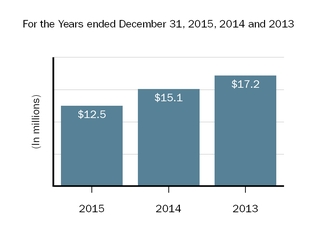
In February 2012, we entered into an agreement with Samsung Biologics, establishing an entity, Samsung Bioepis, to develop, manufacture and market biosimilar pharmaceuticals. We account for this investment under the equity method of accounting. We recognize our share of the results of operations related to our investment in Samsung Bioepis one quarter in arrears.
During 2015, our share of losses exceeded the carrying value of our investment. We suspended recognizing additional losses and will continue to do so unless we commit to providing additional funding.
For 2015 compared to 2014, the decrease in our equity in loss of investee, net of tax, was due to the suspension of equity method investment losses due to our share of losses exceeding the carrying value of our investment in 2015 and a decrease in our ownership interest.
For 2014 compared to 2013, the decrease in equity in loss of investee, net of tax was due to the joint venture's clinical trial activity, partially offset by our recognition of a gain as Samsung Bioepis secured additional equity financing from Samsung Biologics from a financing in which we did participate.
For additional information related to this transaction, please read Note 19, Collaborative and Other Relationships to our consolidated financial statements included in this report.
Noncontrolling Interest
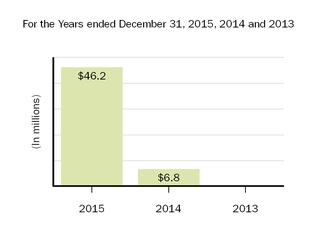
For 2015 compared to 2014, the change in net income (loss) attributable to noncontrolling interests, net of tax, was primarily related to a $60.0 million milestone payment made to Neurimmune SubOne AG (Neurimmune), partially offset by increases in research expenses attributable to noncontrolling interests.
For 2014 compared to 2013, the change in net income attributable to noncontrolling interests, net of tax, was related to a $10.0 million milestone payment made to Neurimmune and the consolidation of the research activities of Ataxion, Inc.
For additional information about Neurimmune, please read Note 18, Investments in Variable Interest Entities to our consolidated financial statements included in this report.
Financial Condition, Liquidity and Capital Resources
Our financial condition is summarized as follows:
| As of December 31, | % Change | |||||||||
| (In millions, except percentages) | 2015 | 2014 | 2015 compared to 2014 | |||||||
| Financial assets: | ||||||||||
| Cash and cash equivalents | $ | 1,308.0 | $ | 1,204.9 | 8.6 | % | ||||
| Marketable securities — current | 2,120.5 | 640.5 | 231.1 | % | ||||||
| Marketable securities — non-current | 2,760.4 | 1,470.7 | 87.7 | % | ||||||
| Total cash, cash equivalents and marketable securities | $ | 6,188.9 | $ | 3,316.0 | 86.6 | % | ||||
| Borrowings: | ||||||||||
| Current portion of notes payable and other financing arrangements | $ | 4.8 | $ | 3.1 | 54.8 | % | ||||
| Notes payable and other financing arrangements | 6,521.5 | 580.3 | ** | |||||||
| Total borrowings | $ | 6,526.3 | $ | 583.4 | ** | |||||
| Working Capital: | ||||||||||
| Current assets | $ | 6,700.3 | $ | 4,535.0 | 47.7 | % | ||||
| Current liabilities | (2,577.7 | ) | (2,218.1 | ) | 16.2 | % | ||||
| Total working capital | $ | 4,122.6 | $ | 2,316.9 | 77.9 | % |
** Percentage not meaningful.
For the year ended December 31, 2015, certain significant cash flows were as follows:
| • | $5,930.5 million in proceeds from the issuance of our 2015 Senior Notes; |
| • | $3,716.1 million in net cash flows provided by operating activities; |
| • | $5.0 billion used for share repurchases; |
| • | $1,674.8 million in total payments for income taxes; |
| • | $850.0 million in contingent payments made to former shareholders of Fumapharm AG and holders of their rights; |
| • | $643.0 million used for purchases of property, plant and equipment, including $104.8 million related to the acquisition of Eisai's drug product manufacturing facility in Research Triangle Park (RTP), North Carolina and $62.5 million related to the acquisition of land in Solothurn, Switzerland; |
| • | $198.8 million net cash paid for the acquisition of Convergence; |
| • | $184.0 million used for upfront payments made to AGTC and MTPC; and |
| • | $60.0 million milestone payment made to Neurimmune. |
For the year ended December 31, 2014, certain significant cash flows were as follows:
| • | $2,942.1 million in net cash flows provided by operating activities; |
| • | $1,163.2 million in total payments for income taxes; |
| • | $886.8 million used for share repurchases; |
| • | $375.0 million in contingent payments made to former shareholders of Fumapharm AG and holders of their rights; |
| • | $287.8 million used for purchases of property, plant and equipment; and |
| • | $286.3 million used for upfront and milestone payments in collaborative arrangements. |
Overview
We have historically financed our operating and capital expenditures primarily through cash flows earned through our operations. On September 15, 2015, we issued our 2015 Senior Notes for an aggregate principal amount of $6.0 billion. We expect to continue funding our current and planned operating requirements principally through our cash flows from operations, as well as our existing cash resources and proceeds received from our 2015 Senior Notes. We believe that our existing funds, when combined with cash generated from operations and our access to additional financing resources, if needed, are sufficient to satisfy our operating, working capital, strategic alliance, milestone payment, capital expenditure and debt service requirements for the foreseeable future. In addition, we may choose to opportunistically return cash to shareholders and pursue other business initiatives, including acquisition and licensing activities. We may, from time to time, also seek additional funding through a combination of new collaborative agreements, strategic alliances and additional equity and debt financings or from other sources should we identify a significant new opportunity.
The undistributed cumulative foreign earnings of certain of our foreign subsidiaries, exclusive of earnings that would result in little or no net income tax expense under current U.S. tax law or which has already been subject to tax under U.S. tax law, are invested indefinitely outside the U.S.
Of the total cash, cash equivalents and marketable securities at December 31, 2015, approximately $3.5 billion was generated in foreign jurisdictions and is primarily intended for use in our foreign operations or in connection with business development transactions outside of the U.S. In managing our day-to-day liquidity in the U.S., we do not rely on the unrepatriated earnings as a source of funds and we have not provided for U.S. federal or state income taxes on these undistributed foreign earnings.
For additional information related to certain risks that could negatively impact our financial position or future results of operations, please read the “Risk Factors” and “Quantitative and Qualitative Disclosures About Market Risk” sections of this report.
Share Repurchase Programs
In May 2015, our Board of Directors authorized a program to repurchase up to $5.0 billion of our common stock (2015 Share Repurchase Program). As of December 31, 2015, the 2015 Share Repurchase Program was completed and we repurchased and retired approximately 16.8 million shares of common stock at a cost of $5.0 billion during the year ended December 31, 2015.
In February 2011, our Board of Directors authorized a program to repurchase up to 20.0 million of our common stock (2011 Share Repurchase Program), which has been used principally to offset common stock issuances under our share-based compensation plans. The 2011 Share Repurchase Program does not have an expiration date. During 2014, we purchased approximately 2.9 million shares of common stock at a cost of $886.8 million under our 2011 Share Repurchase Program. We did not repurchase any shares of common stock under our 2011 Share Repurchase Program during the year ended December 31, 2015 and have approximately 1.3 million shares remaining available for repurchase under this authorization.
Cash, Cash Equivalents and Marketable Securities
Until required for another use in our business, we typically invest our cash reserves in bank deposits, certificates of deposit, commercial paper, corporate notes, U.S. and foreign government instruments and other interest bearing marketable debt instruments in accordance with our investment policy. It is our policy to mitigate credit risk in our cash reserves and marketable securities by maintaining a well-diversified portfolio that limits the amount of exposure as to institution, maturity, and investment type.
The increase in cash, cash equivalents and marketable securities at December 31, 2015 from December 31, 2014 is primarily due to the issuance of our 2015 Senior Notes and net cash flows provided by operating activities, offset by purchases of our common stock, contingent payments made to former shareholders of Fumapharm AG and holders of their rights, net purchases of property, plant and equipment and the acquisition of Convergence.
Borrowings
On September 15, 2015, we issued senior unsecured notes for an aggregate principal amount of $6.0 billion, consisting of the following:
| • | $1.5 billion of 2.90% Senior Notes due September 15, 2020, valued at 99.792% of par; |
| • | $1.0 billion of 3.625% Senior Notes due September 15, 2022, valued at 99.920% of par; |
| • | $1.75 billion of 4.05% Senior Notes due September 15, 2025, valued at 99.764% of par; and |
| • | $1.75 billion of 5.20% Senior Notes due September 15, 2045, valued at 99.294% of par. |
In addition to the 2015 Senior Notes, we have $550.0 million aggregate principal amount of 6.875% Senior Notes due March 1, 2018 that were originally priced at 99.184% of par.
The discounts are amortized as additional interest expense over the period from issuance through maturity.
In August 2015, we entered into a $1.0 billion, 5-year senior unsecured revolving credit facility under which we are permitted to draw funds for working capital and general corporate purposes. The terms of the revolving credit facility include a financial covenant that requires us not to exceed a maximum consolidated leverage ratio. As of December 31, 2015, we had no outstanding borrowings and were in compliance with all covenants under this facility.
In connection with our 2006 distribution agreement with Fumedica, we issued notes totaling 61.4 million Swiss Francs which were payable to Fumedica in varying amounts from June 2008 through June 2018. Our remaining note payable to Fumedica had a carrying value of 8.9 million Swiss Francs ($9.0 million) and 11.6 million Swiss Francs ($11.7 million) as of December 31, 2015 and 2014, respectively.
For a summary of the fair values of our outstanding borrowings as of December 31, 2015 and 2014, please read Note 7, Fair Value Measurements to our consolidated financial statements included in this report.
Working Capital
We define working capital as current assets less current liabilities. In accordance with ASU No. 2015-17, at December 31, 2015 we reclassified $137.1 million of our deferred tax assets classified as current to noncurrent and $1.6 million of our deferred tax liabilities classified as current to noncurrent in our December 31, 2014 consolidated balance sheet, to conform our prior year presentation to our current year presentation. For additional information related to ASU No. 2015-17, please read Note 1, Summary of Significant Accounting Policies: New Accounting Pronouncements to our consolidated financial statements included in this report.
The increase in working capital at December 31, 2015 from December 31, 2014 reflects an increase in total current assets of $2,165.3 million, partially offset by an increase in current liabilities of $359.6 million. The increase in total current assets was primarily driven by an increase in cash, cash equivalents and marketable securities due to the issuance of our 2015 Senior Notes and an increase in cash from operating activities, partially offset by purchases of our common stock. The increase in total current liabilities primarily resulted from an increase in taxes payable and an increase in accrued expenses and other due to increases in the amount of short-term contingent consideration expected to be paid and revenue-related reserves for discounts and allowances.
Cash Flows
The following table summarizes our cash flow activity:
| For the Years Ended December 31, | % Change | ||||||||||||||||
| 2015 compared to 2014 | 2014 compared to 2013 | ||||||||||||||||
| (In millions, except percentages) | 2015 | 2014 | 2013 | ||||||||||||||
| Net cash flows provided by operating activities | $ | 3,716.1 | $ | 2,942.1 | $ | 2,345.1 | 26.3 | % | 25.5 | % | |||||||
| Net cash flows used in by investing activities | $ | (4,553.6 | ) | $ | (1,543.0 | ) | $ | (1,604.7 | ) | 195.1 | % | (3.8 | )% | ||||
| Net cash flows provided by (used in) financing activities | $ | 986.4 | $ | (755.9 | ) | $ | (716.5 | ) | (230.5 | )% | 5.5 | % |
Operating Activities
Cash flows from operating activities represent the cash receipts and disbursements related to all of our activities other than investing and financing activities. We expect cash provided from operating activities will continue to be our primary source of funds to finance operating needs and capital expenditures for the foreseeable future.
Operating cash flow is derived by adjusting our net income for:
| • | Non-cash operating items such as depreciation and amortization, impairment charges and share-based compensation charges; |
| • | Changes in operating assets and liabilities which reflect timing differences between the receipt and payment of cash associated with transactions and when they are recognized in results of operations; and |
| • | Changes associated with the fair value of contingent payments associated with our acquisitions of businesses and payments related to collaborations. |
For 2015 compared to 2014, the increase in cash provided by operating activities was primarily driven by higher net income and accounts receivable collections, partially offset by income tax payments.
For 2014 compared to 2013, the increase in cash provided by operating activities was primarily driven by higher net income, partially offset by an increase in accounts receivable resulting from increased product revenue.
Investing Activities
For 2015 compared to 2014, the increase in net cash flows used in investing activities was primarily due to an increase in net purchases of marketable securities, an increase in the total amount of contingent consideration paid to the former shareholders of Fumapharm AG, an increase in purchases of property, plant and equipment and cash paid for the acquisition of Convergence.
For 2014 compared to 2013, the decrease in net cash flows used in investing activities was primarily due to the prior year acquisition of all remaining rights to TYSABRI from Elan and a decrease in the net purchases of marketable securities, partially offset by the payment of contingent consideration to former shareholders of Fumapharm AG.
Financing Activities
For 2015 compared to 2014, the change in net cash flows provided by financing activities was primarily due to the issuance of our 2015 Senior Notes, partially offset by an increase in the amount of common stock we repurchased.
For 2014 compared to 2013, the increase in net cash flows used in financing activities was primarily due to an increase in the amount of common stock we repurchased, partially offset by the prior year repayment of the aggregate principal amount of our 6.0% Senior Notes.
Contractual Obligations and Off-Balance Sheet Arrangements
Contractual Obligations
The following table summarizes our contractual obligations as of December 31, 2015, excluding amounts related to uncertain tax positions, funding commitments, contingent development, regulatory and commercial milestone payments, TYSABRI contingent payments and contingent consideration related to our business combinations, as described below.
| Payments Due by Period | |||||||||||||||||||
| (In millions) | Total | Less than 1 Year | 1 to 3 Years | 3 to 5 Years | After 5 Years | ||||||||||||||
| Capital leases (1) | $ | 20.7 | $ | 2.0 | $ | 18.7 | $ | — | $ | — | |||||||||
| Non-cancellable operating leases (2), (3) | 672.3 | 69.9 | 131.3 | 117.3 | 353.8 | ||||||||||||||
| Long-term debt obligations (4) | 10,563.7 | 282.6 | 1,095.9 | 1,983.3 | 7,201.9 | ||||||||||||||
| Purchase and other obligations (5) | 380.9 | 258.5 | 79.4 | 24.0 | 19.0 | ||||||||||||||
| Defined benefit obligation | 70.1 | — | — | — | 70.1 | ||||||||||||||
| Total contractual obligations | $ | 11,687.0 | $ | 611.0 | $ | 1,306.6 | $ | 2,124.6 | $ | 7,644.8 |
| (1) | During 2015 we amended our existing lease related to Eisai's oral solid dose products manufacturing facility in RTP, North Carolina, where we manufacture our and Eisai's oral solid dose products. Amounts reflected within the table above include the future contractual commitments. For additional information, please read Note 10, Property, Plant and Equipment to our consolidated financial statements included in this report. |
| (2) | We lease properties and equipment for use in our operations. Amounts reflected within the table above detail future minimum rental commitments under non-cancelable operating leases as of December 31 for each of the periods presented. In addition to the minimum rental commitments, these leases may require us to pay additional amounts for taxes, insurance, maintenance and other operating expenses. |
| (3) | Obligations are presented net of sublease income expected to be received for the vacated portion of our Weston, Massachusetts facility. For additional information, please read Note 10, Property, Plant and Equipment to our consolidated financial statements included in this report. |
| (4) | Long-term debt obligations are primarily related to our Senior Notes, including principal and interest payments. |
| (5) | Purchase and other obligations primarily includes our obligations to purchase direct materials and also includes approximately $126.4 million in contractual commitments for the construction of a biologics manufacturing facility in Solothurn, Switzerland and approximately $14.7 million related to the fair value of net liabilities on derivative contracts. |
Tax Related Obligations
We exclude liabilities pertaining to uncertain tax positions from our summary of contractual obligations as we cannot make a reliable estimate of the period of cash settlement with the respective taxing authorities. As of December 31, 2015, we have approximately $45.4 million of net liabilities associated with uncertain tax positions.
Other Funding Commitments
As of December 31, 2015, we have several on-going clinical studies in various clinical trial stages. Our most significant clinical trial expenditures are to contract research organizations (CROs). The contracts with CROs are generally cancellable, with notice, at our option. We have recorded accrued expenses of approximately $25.0 million on our consolidated balance sheet for expenditures incurred by CROs as of December 31, 2015. We have approximately $559.0 million in cancellable future commitments based on existing CRO contracts as of December 31, 2015.
Contingent Development, Regulatory and Commercial Milestone Payments
Based on our development plans as of December 31, 2015, we could make potential future milestone payments to third parties of up to approximately $2.8 billion as part of our various collaborations, including licensing and development programs. Payments under these agreements generally become due and payable upon achievement of certain development, regulatory or commercial milestones. Because the achievement of these milestones had not occurred as of December 31, 2015, such contingencies have not been recorded in our financial statements. Amounts related to contingent milestone payments are not considered contractual obligations as they are contingent on the successful achievement of certain development, regulatory approval and commercial milestones.
We anticipate that we may pay approximately $150.0 million of milestone payments in 2016, provided various development, regulatory or commercial milestones are achieved.
TYSABRI Contingent Payments
In 2013, we acquired from Elan full ownership of all remaining rights to TYSABRI that we did not already own or control. Under the terms of the acquisition agreement, we are obligated to make contingent payments to Elan of 18% on annual worldwide net sales up to $2.0 billion and 25% on annual worldwide net sales that exceed $2.0 billion. Royalty payments to Elan and other third parties are recognized as cost of sales in our consolidated statements of income. Elan was acquired by Perrigo in December 2013. Following that acquisition, we began making these royalty payments to Perrigo.
Contingent Consideration related to Business Combinations
In connection with our acquisitions of Convergence, Stromedix, Inc. (Stromedix), Biogen International Neuroscience GmbH (formerly Biogen Idec International Neuroscience GmbH) (BIN), Biogen Hemophilia Inc. (formerly Biogen Idec Hemophilia Inc.) (BIH) and Fumapharm AG, we agreed to make additional payments based upon the achievement of certain milestone events.
As the acquisitions of Convergence, Stromedix and BIN, formerly Panima Pharmaceuticals AG, occurred after January 1, 2009, we record contingent consideration liabilities at their fair value on the acquisition date and revalue these obligations each reporting period. We may pay up to approximately $1.3 billion in remaining milestones related to these acquisitions. For additional information related to our acquisition of Convergence please read Note 2, Acquisitions, to our consolidated financial statements included in this report.
BIH
In connection with our acquisition of BIH, formerly Syntonix, in 2007, we agreed to pay up to an additional $80.0 million if certain milestone events associated with the development of BIH’s lead product, ALPROLIX are achieved. The final $20.0 million contingent payment will occur if, prior to the tenth anniversary of the closing date, a marketing authorization is granted by the EMA for ALPROLIX. This payment will be accounted for as an increase to intangible assets if achieved. In June 2015, the EMA validated our MAA for ALPROLIX for the treatment of hemophilia B.
Fumapharm AG
In 2006, we acquired Fumapharm AG. As part of this acquisition we acquired FUMADERM and TECFIDERA (together, Fumapharm Products). We are required to make contingent payments to former shareholders of Fumapharm AG or holders of their rights based on the attainment of certain cumulative sales levels of Fumapharm Products and the level of total net sales of Fumapharm Products in the prior twelve month period, as defined in the acquisition agreement.
During 2015, we paid $850.0 million in contingent payments as we reached the $4.0 billion, $5.0 billion and $6.0 billion cumulative sales levels related to the Fumapharm Products in the fourth quarter of 2014, second quarter of 2015 and third quarter of 2015, respectively, and accrued $300.0 million upon reaching $7.0 billion in total cumulative sales of Fumapharm Products in the fourth quarter of 2015.
We will owe an additional $300.0 million contingent payment for every additional $1.0 billion in cumulative sales level of Fumapharm Products reached if the prior 12 months sales of the Fumapharm Products exceed $3.0 billion, until such time as the cumulative sales level reaches $20.0 billion, at which time no further contingent payments shall be due. These payments will be accounted for as an increase to goodwill as incurred, in accordance with the accounting standard applicable to business combinations when we acquired Fumapharm. Any portion of the payment which is tax deductible will be recorded as a reduction to goodwill. Payments are due within 60 days following the end of the quarter in which the applicable cumulative sales level has been reached.
Other Off-Balance Sheet Arrangements
We do not have any relationships with entities often referred to as structured finance or special purpose entities that were established for the purpose of facilitating off-balance sheet arrangements. As such, we are not exposed to any financing, liquidity, market or credit risk that could arise if we had engaged in such relationships. We consolidate variable interest entities if we are the primary beneficiary.
Legal Matters
For a discussion of legal matters as of December 31, 2015, please read Note 20, Litigation to our consolidated financial statements included in this report.
Critical Accounting Estimates
The preparation of our consolidated financial statements, which have been prepared in accordance with accounting principles generally accepted in the U.S. (U.S. GAAP), requires us to make estimates, judgments and assumptions that may affect the reported amounts of assets, liabilities, equity, revenues and expenses, and related disclosure of contingent assets and liabilities. On an on-going basis we evaluate our estimates, judgments and methodologies. We base our estimates on historical experience and on various other assumptions that we believe are reasonable, the results of which form the basis for making judgments about the carrying values of assets, liabilities and equity and the amount of revenue and expenses. Actual results may differ from these estimates under different assumptions or conditions.
Revenue Recognition and Related Allowances
We recognize revenue when all of the following criteria are met: persuasive evidence of an arrangement exists; delivery has occurred or services have been rendered; our price to the customer is fixed or determinable; and collectability is reasonably assured.
Product Revenues
Revenues from product sales are recognized when title and risk of loss have passed to the customer, which is typically upon delivery. The timing of distributor orders and shipments can cause variability in earnings.
Reserves for Discounts and Allowances
We establish reserves for trade term discounts, wholesaler incentives, Medicaid rebates, copay, VA and PHS discounts, managed care rebates, product returns and other governmental rebates or applicable allowances, including those associated with the implementation of pricing actions in certain of the international markets in which we operate. These reserves are based on estimates of the amounts earned or to be claimed on the related sales. Our estimates take into consideration our historical experience, current contractual and statutory requirements, specific known market events and trends, industry data and forecasted customer buying and payment patterns. If actual results vary, we may need to adjust these estimates, which could have an effect on earnings in the period of the adjustment.
In addition to the discounts and rebates described above and classified as a reduction of revenue, we also maintain certain customer service contracts with distributors and other customers in the distribution channel that provide us with inventory management, data and distribution services, which are generally reflected as a reduction of revenue. To the extent we can demonstrate a separable benefit and fair value for these services, we classify these payments within selling, general and administrative expenses.
Revenues from Unconsolidated Joint Business
Revenues from unconsolidated joint business consists of (i) our share of pre-tax profits and losses in the U.S. for RITUXAN and GAZYVA; (ii) reimbursement of our selling and development expenses in the U.S. for RITUXAN; and (iii) revenue on sales in the rest of world for RITUXAN, which consist of our share of pre-tax co-promotion profits in Canada and royalty revenue on sales outside the U.S. and Canada by the Roche Group and its sublicensees. Pre-tax co-promotion profits on RITUXAN are calculated and paid to us by Genentech in the U.S. and by the Roche Group in Canada. Pre-tax co-promotion profits consist of U.S. and Canadian net sales to third-party customers less the cost to manufacture, third-party royalty expenses, distribution, selling, and marketing expenses, and joint development expenses incurred by Genentech, the Roche Group and us. We record our share of the pre-tax co-promotion profits on RITUXAN in Canada and royalty revenues on sales outside the U.S. on a cash basis as we do not have the ability to estimate these profits or royalty revenue in the period incurred. Additionally, our share of the pre-tax profits on RITUXAN and GAZYVA in the U.S. includes estimates made by Genentech and those estimates are subject to change. Actual results may differ from our estimates.
Concentrations of Credit Risk
The majority of our receivables arise from product sales in the U.S. and Europe and are primarily due from wholesale distributors, public hospitals and other government entities. We monitor the financial performance and creditworthiness of our large customers so that we can properly assess and respond to changes in their credit profile. We continue to monitor these conditions, including the volatility associated with international economies and the relevant financial markets, and assess their possible impact on our business. Credit and economic conditions in the E.U. continue to remain uncertain, which has, from time to time, led to long collection periods for our accounts receivable and greater collection risk in certain countries.
Where our collections continue to be subject to significant payment delays due to government funding and reimbursement practices and a portion of these receivables are routinely being collected beyond our contractual payment terms and over periods in excess of one year, we have discounted our receivables and reduced related revenues based on the period of time that we estimate those amounts will be paid, to the extent such period exceeds one year, using the country’s market-based borrowing rate for such period. The related receivables are classified at the time of sale as non-current assets.
To date, we have not experienced any significant losses with respect to the collection of our accounts receivable. If economic conditions worsen and/or the financial condition of our customers were to further deteriorate, our risk of collectability may increase, which may result in additional allowances and/or significant bad debts.
For additional information related to our concentration of credit risk associated with our accounts receivable balances, please read the subsection entitled “Credit Risk” in the “Quantitative and Qualitative Disclosures About Market Risk” section of this report.
Capitalization of Inventory Costs
We capitalize inventory costs associated with our products prior to regulatory approval, when, based on management’s judgment, future commercialization is considered probable and the future economic benefit is expected to be realized. We consider numerous attributes in evaluating whether the costs to manufacture a particular product should be capitalized as an asset. We assess the regulatory approval process and where the particular product stands in relation to that approval process, including any known safety or efficacy concerns, potential labeling restrictions and other impediments to approval. We evaluate our anticipated research and development initiatives and constraints relating to the product and the indication in which it will be used. We consider our manufacturing environment including our supply chain in determining logistical constraints that could hamper approval or commercialization. We consider the shelf life of the product in relation to the expected timeline for approval and we consider patent related or contract issues that may prevent or delay commercialization. We also base our judgment on the viability of commercialization, trends in the marketplace and market acceptance criteria. Finally, we consider the reimbursement strategies that may prevail with respect to the product and assess the economic benefit that we are likely to realize. We expense previously capitalized costs related to pre-approval inventory upon a change in such judgment, due to, among other potential factors, a denial or significant delay of approval by necessary regulatory bodies. All changes in judgment in relation to pre-approval inventory have historically been insignificant.
Acquired Intangible Assets, including In-process Research and Development (IPR&D)
Effective January 1, 2009, when we purchase a business, the acquired IPR&D is measured at fair value, capitalized as an intangible asset and tested for impairment at least annually, as of October 31, until commercialization, after which time the IPR&D is amortized over its estimated useful life. If we acquire an asset or group of assets that do not meet the definition of a business under applicable accounting standards, the acquired IPR&D is expensed on its acquisition date. Future costs to develop these assets are recorded to research and development expense as they are incurred.
We have acquired, and expect to continue to acquire, intangible assets through the acquisition of biotechnology companies or through the consolidation of variable interest entities. These intangible assets primarily consist of technology associated with human therapeutic products and IPR&D product candidates. When significant identifiable intangible assets are acquired, we generally engage an independent third-party valuation firm to assist in determining the fair values of these assets as of the acquisition date. Management will determine the fair value of less significant identifiable intangible assets acquired. Discounted cash flow models are typically used in these valuations, and these models require the use of significant estimates and assumptions including but not limited to:
| • | estimating the timing of and expected costs to complete the in-process projects; |
| • | projecting regulatory approvals; |
| • | estimating future cash flows from product sales resulting from completed products and in process projects; and |
| • | developing appropriate discount rates and probability rates by project. |
We believe the fair values assigned to the intangible assets acquired are based upon reasonable estimates and assumptions given available facts and circumstances as of the acquisition dates.
If these projects are not successfully developed, the sales and profitability of the company may be adversely affected in future periods. Additionally, the value of the acquired intangible assets may become impaired. We believe that the foregoing assumptions used in the IPR&D analysis were reasonable at the time of the respective acquisition. No assurance can be given, however, that the underlying assumptions used to estimate expected project sales, development costs or profitability, or the events associated with such projects, will transpire as estimated.
Certain IPR&D programs have a fair value that is not significantly in excess of carrying value, including our program for the treatment of TGN. Such programs could become impaired if assumptions used in determining the fair value change.
Impairment and Amortization of Long-lived Assets and Accounting for Goodwill
Long-lived Assets Other than Goodwill
Long-lived assets to be held and used include property, plant and equipment as well as intangible assets, including IPR&D and trademarks. Property, plant and equipment are reviewed for impairment whenever events or changes in circumstances indicate that the carrying amount of the assets may not be recoverable. We review our intangible assets with indefinite lives for impairment annually, as of October 31, and whenever events or changes in circumstances indicate that the carrying value of an asset may not be recoverable.
When performing our impairment assessment, we calculate the fair value using the same methodology as described above under "Acquired Intangible Assets, including In-process Research and Development (IPR&D)". If the carrying value of our intangible assets with indefinite lives exceeds its fair value, then the intangible asset is written-down to its fair value.
Our most significant intangible assets are our acquired and in-licensed rights and patents and developed technology. Acquired and in-licensed rights and patents primarily relates to our acquisition of all remaining rights to TYSABRI from Elan. Developed technology primarily relates to our AVONEX product, which was recorded in connection with the merger of Biogen, Inc. and IDEC Pharmaceuticals Corporation in 2003. We amortize the intangible assets related to TYSABRI and AVONEX using the economic consumption method based on revenue generated from the products underlying the related intangible assets. An analysis of the anticipated lifetime revenues of TYSABRI and AVONEX is performed annually during our long range planning cycle, which is generally updated in the third quarter of each year, and whenever events or changes in circumstances
would significantly affect the anticipated lifetime revenues of TYSABRI or AVONEX.
Impairment charges related to our long-lived assets during 2015 and 2013 were insignificant. For additional information on the impairment charges related to our long-lived assets during 2014, please read Note 6, Intangible Assets and Goodwill to our consolidated financial statements included in this report.
Goodwill
Goodwill relates largely to amounts that arose in connection with the merger of Biogen, Inc. and IDEC Pharmaceuticals Corporation in 2003 and amounts that are being paid in connection with the acquisition of Fumapharm AG. Our goodwill balances represent the difference between the purchase price and the fair value of the identifiable tangible and intangible net assets when accounted for using the purchase method of accounting.
We assess our goodwill balance within our single reporting unit annually, as of October 31, and whenever events or changes in circumstances indicate the carrying value of goodwill may not be recoverable to determine whether any impairment in this asset may exist and, if so, the extent of such impairment. We compare the fair value of our reporting unit to its carrying value. If the carrying value of the net assets assigned to the reporting unit exceeds the fair value of our reporting unit, then we would need to determine the implied fair value of our reporting unit’s goodwill. If the carrying value of our reporting unit’s goodwill exceeds its implied fair value, then we would record an impairment loss equal to the difference.
We completed our required annual impairment test in the fourth quarters of 2015, 2014 and 2013, respectively, and determined in each of those periods that the carrying value of goodwill was not impaired. In each year, the fair value of our reporting unit, which includes goodwill, was significantly in excess of the carrying value of our reporting unit.
Investments, including Fair Value Measures and Impairments
We invest in various types of securities, including short-term and long-term marketable securities, principally corporate notes, government securities including government sponsored enterprise mortgage-backed securities and credit card and auto loan asset-backed securities, in which our excess cash balances are invested.
In accordance with the accounting standard for fair value measurements, we have classified our financial assets as Level 1, 2 or 3 within the fair value hierarchy. Fair values determined by Level 1 inputs utilize quoted prices (unadjusted) in active markets for identical assets that we have the ability to access. Fair values determined by Level 2 inputs utilize data points that are observable such as quoted prices, interest rates, yield curves and foreign currency spot rates. Fair values determined by Level 3 inputs utilize unobservable data points for the asset.
As noted in Note 7, Fair Value Measurements to our consolidated financial statements, a majority of our financial assets have been classified as Level 2. These assets have been initially valued at the transaction price and subsequently valued utilizing third-party pricing services. The pricing services use many observable market inputs to determine value, including reportable trades, benchmark yields, credit spreads, broker/dealer quotes, bids, offers, current spot rates and other industry and economic events. We validate the prices provided by our third-party pricing services by understanding the models used, obtaining market values from other pricing sources and analyzing pricing data in certain instances.
Impairment
We conduct periodic reviews to identify and evaluate each investment that has an unrealized loss, in accordance with the meaning of other-than-temporary impairment and its application to certain investments. An unrealized loss exists when the current fair value of an individual security is less than its amortized cost basis. Unrealized losses on available-for-sale debt securities that are determined to be temporary, and not related to credit loss, are recorded, net of tax, in accumulated other comprehensive income.
For available-for-sale debt securities with unrealized losses, management performs an analysis to assess whether we intend to sell or whether we would more likely than not be required to sell the security before the expected recovery of the amortized cost basis. Where we intend to sell a security, or may be required to do so, the security’s decline in fair value is deemed to be other-than-temporary and the full amount of the unrealized loss is reflected within earnings as an impairment loss.
Regardless of our intent to sell a security, we perform additional analysis on all securities with unrealized losses to evaluate losses associated with the creditworthiness of the security. Credit losses are identified where we do not expect to receive cash flows sufficient to recover the amortized cost basis of a security and are reflected within earnings as an impairment loss.
Share-Based Compensation
We make certain assumptions in order to value and record expense associated with awards made under our share-based compensation arrangements. Changes in these assumptions may lead to variability with respect to the amount of expense we recognize in connection with share-based payments.
Determining the appropriate valuation model and related assumptions requires judgment, and includes estimating the expected market price of our stock on vesting date and stock price volatility as well as the term of the expected awards. Determining the appropriate amount to expense based on the anticipated achievement of performance targets requires judgment, including forecasting the achievement of future financial targets. The estimate of expense is revised periodically based on the probability of achieving the required performance targets and adjustments are made throughout the performance as appropriate. The cumulative impact of any revision is reflected in the period of change.
We also estimate forfeitures over the requisite service period when recognizing share-based compensation expense based on historical rates and forward-looking factors; these estimates are adjusted to the extent that actual forfeitures differ, or are expected to materially differ, from our estimates.
Contingent Consideration
For acquisitions completed before January 1, 2009, we record contingent consideration resulting from a business combination when the contingency is resolved. For acquisitions completed after January 1, 2009, we record contingent consideration resulting from a business combination at its fair value on the acquisition date. Each reporting period thereafter, we revalue these obligations and record increases or decreases in their fair value as an adjustment to contingent consideration expense within the consolidated statement of income. Changes in the fair value of the contingent consideration obligations can result from changes to one or multiple inputs including adjustments to the discount rates and achievement and timing of any cumulative sales-based and development milestones, or changes in the probability of certain clinical events and changes in the assumed probability associated with regulatory approval. These fair value measurements represent Level 3 measurements as they are based on significant inputs not observable in the market.
Significant judgment is employed in determining the appropriateness of these assumptions as of the acquisition date and for each subsequent period. Accordingly, changes in assumptions described above, could have a material impact on the amount of contingent consideration expense we record in any given period.
Restructuring Charges
We have made estimates and judgments regarding the amount and timing of our restructuring expense and liability, including current and future period termination benefits, pipeline program termination costs and other exit costs to be incurred when related actions take place. Severance and other related costs are reflected in our consolidated statements of income as a component of total restructuring charges incurred. Actual results may differ from these estimates.
Income Taxes
We prepare and file income tax returns based on our interpretation of each jurisdiction’s tax laws and regulations. In preparing our consolidated financial statements, we estimate our income tax liability in each of the jurisdictions in which we operate by estimating our actual current tax expense together with assessing temporary differences resulting from differing treatment of items for tax and financial reporting purposes. These differences result in deferred tax assets and liabilities, which are included in our consolidated balance sheets. Significant management judgment is required in assessing the realizability of our deferred tax assets. In performing this assessment, we consider whether it is more likely than not that some portion or all of the deferred tax assets will not be realized. The ultimate realization of deferred tax assets is dependent upon the generation of future taxable income during the periods in which those temporary differences become deductible. In making this determination, under the applicable financial accounting standards, we are allowed to consider the scheduled reversal of deferred tax liabilities, projected future taxable income, and the effects of tax planning strategies. Our estimates of future taxable income include, among other items, our estimates of future income tax deductions related to the exercise of stock options. In the event that actual results differ from our estimates, we adjust our estimates in future periods and we may need to establish a valuation allowance, which could materially impact our financial position and results of operations.
All tax effects associated with intercompany transfers of assets within our consolidated group, both current and deferred, are recorded as a prepaid tax or deferred charge and recognized through the consolidated statement of income when the asset transferred is sold to a third-party or otherwise recovered through amortization of the asset's remaining economic life. If the asset transferred becomes impaired, for example through the discontinuation of a research program, we will expense any remaining deferred charge or prepaid tax. As of December 31, 2015, the total deferred charges and prepaid taxes were $697.9 million.
We account for uncertain tax positions using a “more-likely-than-not” threshold for recognizing and resolving uncertain tax positions. We evaluate uncertain tax positions on a quarterly basis and consider various factors, that include, but are not limited to, changes in tax law, the measurement of tax positions taken or expected to be taken in tax returns, the effective settlement of matters subject to audit, information obtained during in process audit activities and changes in facts or circumstances related to a tax position. We adjust the level of the liability to reflect any subsequent changes in the relevant facts surrounding the uncertain positions. Our liabilities for uncertain tax positions can be relieved only if the contingency becomes legally extinguished through either payment to the taxing authority or the expiration of the statute of limitations, the recognition of the benefits associated with the position meet the “more-likely-than-not” threshold or the liability becomes effectively settled through the examination process. We consider matters to be effectively settled once the taxing authority has completed all of its required or expected examination procedures, including all appeals and administrative reviews, we have no plans to appeal or litigate any aspect of the tax position, and we believe that it is highly unlikely that the taxing authority would examine or re-examine the related tax position. We also accrue for potential interest and penalties related to unrecognized tax benefits in income tax expense.
We earn a significant amount of our operating income outside the U.S. As a result, a portion of our cash, cash equivalents, and marketable securities are held by foreign subsidiaries. We currently do not intend or foresee a need to repatriate these funds. We expect existing domestic cash, cash equivalents, marketable securities and cash flows from operations to continue to be sufficient to fund our domestic operating activities and cash commitments for investing and financing activities for the foreseeable future.
As of December 31, 2015, our non-U.S. subsidiaries’ undistributed foreign earnings included in consolidated retained earnings and other basis differences aggregated to approximately $6.0 billion. All undistributed foreign earnings of non-U.S. subsidiaries, exclusive of earnings that would result in little or no net income tax expense or which were previously taxed under current U.S. tax law, are reinvested indefinitely in operations outside the U.S. This determination is made on a jurisdiction-by-jurisdiction basis and takes into the account the liquidity requirements in both the U.S. and within our foreign subsidiaries.
If we decide to repatriate funds in the future to execute our growth initiatives or to fund any other liquidity needs, the resulting tax consequences would negatively impact our results of operations through a higher effective tax rate and dilution of our earnings. The residual U.S. tax liability, if cumulative amounts were repatriated, would be between $1.5 billion to $2.0 billion as of December 31, 2015.
New Accounting Standards
For a discussion of new accounting standards please read Note 1, Summary of Significant Accounting Principles to our consolidated financial statements included in this report.
Previous: Item 6. Selected Financial Data · Next: Item 7A. Quantitative and Qualitative Disclosures About Market Risk