 filings.tools
Biogen 10-K 2016-12-31
Filed 2017-02-02. 21 sections, 658K characters. Original on sec.gov · Markdown · JSON
Cover and table of contents
10-K 1 biib-20161231x10k.htm 10-K
UNITED STATES SECURITIES AND EXCHANGE COMMISSION
Washington, D.C. 20549
Form 10-K
| x | ANNUAL REPORT PURSUANT TO SECTION 13 OR 15(d) OF THE SECURITIES EXCHANGE ACT OF 1934 |
| For the fiscal year ended December 31, 2016 |
or
| o | TRANSITION REPORT PURSUANT TO SECTION 13 OR 15(d) OF THE SECURITIES EXCHANGE ACT OF 1934 |
Commission file number: 0-19311
BIOGEN INC.
(Exact name of registrant as specified in its charter)
| Delaware | 33-0112644 | |
| (State or other jurisdiction of incorporation or organization) | (I.R.S. Employer Identification No.) |
225 Binney Street, Cambridge, Massachusetts 02142
(617) 679-2000
(Address, including zip code, and telephone number, including area code, of Registrant’s principal executive offices)
Securities registered pursuant to Section 12(b) of the Act:
| Title of Each Class | Name of Each Exchange on Which Registered | |
| Common Stock, $0.0005 par value | The Nasdaq Global Select Market |
Securities registered pursuant to Section 12(g) of the Act:
None
Indicate by check mark if the registrant is a well-known seasoned issuer, as defined in Rule 405 of the Securities Act. Yes x No o
Indicate by check mark if the registrant is not required to file reports pursuant to Section 13 or 15(d) of the Act. Yes o No x
Indicate by check mark whether the registrant (1) has filed all reports required to be filed by Section 13 or 15(d) of the Securities Exchange Act of 1934 during the preceding 12 months (or for such shorter period that the registrant was required to file such reports), and (2) has been subject to such filing requirements for the past 90 days. Yes x No o
Indicate by check mark whether the registrant has submitted electronically and posted on its corporate Web site, if any, every Interactive Data File required to be submitted and posted pursuant to Rule 405 of Regulation S-T during the preceding 12 months (or for such shorter period that the registrant was required to submit and post such files): Yes x No o
Indicate by check mark if disclosure of delinquent filers pursuant to Item 405 of Regulation S-K is not contained herein, and will not be contained, to the best of the registrant’s knowledge, in definitive proxy or information statements incorporated by reference in Part III of this Form 10-K or any amendment to this Form 10-K. x
Indicate by check mark whether the registrant is a large accelerated filer, an accelerated filer, a non-accelerated filer, or a smaller reporting company. See the definitions of “large accelerated filer,” “accelerated filer” and “smaller reporting company” in Rule 12b-2 of the Exchange Act.
| Large accelerated filer x | Accelerated filer o | Non-accelerated filer o | Smaller reporting company o | |||
| (Do not check if a smaller reporting company) |
Indicate by check mark whether the registrant is a shell company (as defined in Rule 12b-2 of the Act). Yes o No x
The aggregate market value of the registrant’s common stock held by non-affiliates of the registrant (without admitting that any person whose shares are not included in such calculation is an affiliate) computed by reference to the price at which the common stock was last sold as of the last business day of the registrant’s most recently completed second fiscal quarter was $52,843,669,823.
As of January 27, 2017, the registrant had 215,951,945 shares of common stock, $0.0005 par value, outstanding.
DOCUMENTS INCORPORATED BY REFERENCE
Portions of the definitive proxy statement for our 2017 Annual Meeting of Stockholders are incorporated by reference into Part III of this report.
BIOGEN INC.
ANNUAL REPORT ON FORM 10-K
For the Year Ended December 31, 2016
TABLE OF CONTENTS
NOTE REGARDING FORWARD-LOOKING STATEMENTS
This report contains forward-looking statements that are being made pursuant to the provisions of the Private Securities Litigation Reform Act of 1995 (the Act) with the intention of obtaining the benefits of the “Safe Harbor” provisions of the Act. These forward-looking statements may be accompanied by such words as “anticipate,” “believe,” “could,” “estimate,” “expect,” “forecast,” “intend,” “may,” “plan,” “potential,” “project,” “target,” “will” and other words and terms of similar meaning. Reference is made in particular to forward-looking statements regarding:
| • | the anticipated amount, timing and accounting of revenues, contingent payments, milestone, royalty and other payments under licensing, collaboration or acquisition agreements, tax positions and contingencies, collectability of receivables, pre-approval inventory, cost of sales, research and development costs, compensation and other selling, general and administrative expenses, amortization of intangible assets, foreign currency exchange risk, estimated fair value of assets and liabilities, and impairment assessments; |
| • | expectations, plans and prospects relating to sales, pricing, growth and launch of our marketed and pipeline products; |
| • | the potential impact of increased product competition in the markets in which we compete; |
| • | the spin off of our hemophilia business, including its anticipated benefits, costs and tax treatment; |
| • | the anticipated amount and timing of payments under the Settlement and License Agreement with Forward Pharma A/S (Forward Pharma) and the timing, outcome and impact of administrative, regulatory, legal and other proceedings related to our patents and other proprietary intellectual property rights under our agreement with Forward Pharma; |
| • | patent terms, patent term extensions, patent office actions and expected availability and period of regulatory exclusivity; |
| • | the costs and timing of potential clinical trials, filing and approvals, and the potential therapeutic scope of the development and commercialization of our and our collaborators’ pipeline products; |
| • | the drivers for growing our business, including our plans and intent to commit resources relating to business development opportunities and research and development programs; |
| • | potential costs and expenses incurred in connection with corporate restructurings and to execute business transformation and optimization initiatives; |
| • | our manufacturing capacity, use of third-party contract manufacturing organizations and plans and timing relating to the expansion of our manufacturing capabilities, including anticipated investments and activities in new manufacturing facilities; |
| • | the expected financial impact of ceasing manufacturing activities and vacating our biologics manufacturing facility in Cambridge, MA and warehouse space in Somerville, MA; |
| • | the potential impact on our results of operations and liquidity of the United Kingdom's (U.K.'s) intent to voluntarily depart from the European Union (E.U.); |
| • | the impact of the continued uncertainty of the credit and economic conditions in certain countries in Europe and our collection of accounts receivable in such countries; |
| • | the potential impact of healthcare reform in the United States (U.S.) and measures being taken worldwide designed to reduce healthcare costs to constrain the overall level of government expenditures, including the impact of pricing actions and reduced reimbursement for our products; |
| • | the timing, outcome and impact of administrative, regulatory, legal and other proceedings related to patents and other proprietary and intellectual property rights, tax audits, assessments and settlements, pricing matters, sales and promotional practices, product liability and other matters; |
| • | lease commitments, purchase obligations and the timing and satisfaction of other contractual obligations; |
| • | our ability to finance our operations and business initiatives and obtain funding for such activities; and |
| • | the impact of new laws and accounting standards. |
These forward-looking statements involve risks and uncertainties, including those that are described in the “Risk Factors” section of this report and elsewhere in this report, that could cause actual results to differ materially from those reflected in such statements. You should not place undue reliance on these statements. Forward-looking statements speak only as of the date of this report. Except as required by law, we do not undertake any obligation to publicly update any forward-looking statements, whether as a result of new information, future developments or otherwise.
NOTE REGARDING COMPANY AND PRODUCT REFERENCES
References in this report to:
| • | “Biogen,” the “company,” “we,” “us” and “our” refer to Biogen Inc. and its consolidated subsidiaries; |
| • | “RITUXAN” refers to both RITUXAN (the trade name for rituximab in the U.S., Canada and Japan) and MabThera (the trade name for rituximab outside the U.S., Canada and Japan); |
| • | "ELOCTATE" refers to both ELOCTATE (the trade name for Antihemophilic Factor (Recombinant), Fc Fusion Protein in the U.S., Canada and Japan) and ELOCTA (the trade name for Antihemophilic Factor (Recombinant), Fc Fusion Protein in the E.U.); and |
| • | “ANGIOMAX” refers to both ANGIOMAX (the trade name for bivalirudin in the U.S., Canada and Latin America) and ANGIOX (the trade name for bivalirudin in Europe). |
NOTE REGARDING TRADEMARKS
AVONEX®, BENEPALI®, FLIXABI®, PLEGRIDY®, RITUXAN®, TECFIDERA®, TYSABRI® and ZINBRYTA® are registered trademarks of Biogen. FUMADERMTM and SPINRAZATM are trademarks of Biogen. ALPROLIX®, ELOCTATE®, ENBREL®, FAMPYRATM, GAZYVA®, HUMIRA®, OCREVUS®, REMICADE® and other trademarks referenced in this report are the property of their respective owners.
PART I
Item 1. Business
Overview
Biogen is a global biopharmaceutical company focused on discovering, developing, manufacturing and delivering therapies to people living with serious neurological, rare and autoimmune diseases.
Our marketed products include TECFIDERA, AVONEX, PLEGRIDY, TYSABRI, ZINBRYTA and FAMPYRA for multiple sclerosis (MS), FUMADERM for the treatment of severe plaque psoriasis and SPINRAZA for the treatment of spinal muscular atrophy (SMA). We also have certain business and financial rights with respect to RITUXAN for the treatment of non-Hodgkin's lymphoma, chronic lymphocytic leukemia (CLL) and other conditions, GAZYVA indicated for the treatment of CLL and follicular lymphoma and other potential anti-CD20 therapies under a collaboration agreement with Genentech, Inc. (Genentech), a wholly-owned member of the Roche Group (Roche Group).
We support our drug discovery and development efforts through the commitment of significant resources to discovery, research and development programs and business development opportunities, particularly within areas of our scientific, manufacturing and technical capabilities. For nearly two decades we have led in the research and development of new therapies to treat MS, resulting in our leading portfolio of MS treatments. Now our research is focused on additional improvements in the treatment of MS, such as the development of next generation therapies for MS, with a goal to reverse or possibly repair damage caused by the disease. We are also applying our scientific expertise to solve some of the most challenging and complex diseases, including Alzheimer's disease, Parkinson's disease and amyotrophic lateral sclerosis (ALS), and are employing innovative technologies to discover potential treatments for rare and genetic disorders, including new ways of treating diseases through gene therapy.
Our innovative drug development and commercialization activities are complemented by our biosimilar therapies that expand access to medicines and reduce the cost burden for healthcare systems. We are leveraging our manufacturing capabilities and know-how to develop, manufacture and market biosimilars through Samsung Bioepis, our joint venture with Samsung BioLogics Co. Ltd. (Samsung Biologics). Under this agreement, we are currently manufacturing and commercializing two anti-tumor necrosis factor (TNF) biosimilars in certain European Union (E.U.) countries.
Key Developments
During 2016 we had a number of key developments affecting our business.
Corporate Matters
Hemophilia Spin-Off
In May 2016 we announced our intention to spin off our hemophilia business, Bioverativ Inc. (Bioverativ), as an independent, publicly traded company. Bioverativ will focus on the discovery, development and commercialization of therapies for treatment of hemophilia and other blood disorders, including ELOCTATE for the treatment of hemophilia A and ALPROLIX for the treatment of hemophilia B. Bioverativ will also assume all of our rights and obligations under our collaboration agreement with Swedish Orphan Biovitrum AB (Sobi) and our collaboration and license agreement with Sangamo Biosciences Inc. (Sangamo).
On February 1, 2017, we completed the distribution of all the then outstanding shares of common stock of Bioverativ to Biogen stockholders, who received one share of Bioverativ common stock for every two shares of Biogen common stock. As a result of the distribution, Bioverativ is now an independent public company whose shares of common stock are trading under the symbol "BIVV" on the Nasdaq Global Select Market.
The financial results of Bioverativ are included in our consolidated results of operations and financial position in our audited consolidated financial statements for the periods presented in this Form 10-K. The financial results of Bioverativ will be excluded from our consolidated results of operations and financial position commencing February 1, 2017. For additional information regarding the separation of Bioverativ, please read Note 26, Subsequent Events to our consolidated financial statements included in this report.
Management Changes
During 2016 we appointed several new executives, each of whom has significant experience in the biopharmaceutical industry and is a leader in his or her functional area. These include Michel Vounatsos, Chief Executive Officer, Michael D. Ehlers, Executive Vice President, Research and Development and Paul McKenzie, Executive Vice President, Pharmaceutical Operations and Technology. For additional information related to these and our other Executive Officers, please read "Our Executive Officers" included in this report.
Cost Saving Initiatives
In 2016 we initiated cost saving measures intended to realign our organizational structure in anticipation of the changes in roles and workforce resulting from our decision to spin off our hemophilia business, as well as to achieve further targeted cost reductions.
In December 2016 after an evaluation of our manufacturing capacity and needs, we ceased manufacturing at our Cambridge, MA manufacturing facility and subleased our rights to this facility to Brammer Bio MA, LLC (Brammer). In addition to the sublease, Brammer purchased certain leasehold improvements and other assets at this facility and agreed to provide certain manufacturing and other transition and support services to us.
TECFIDERA Settlement and License Agreement
In January 2017 we agreed to enter into a settlement and license agreement with Forward Pharma A/S (Forward Pharma). The settlement and license agreement provides us an irrevocable license to all intellectual property owned by Forward Pharma and results in the termination of the German Infringement Litigation. Under the terms of the settlement and license agreement with Forward Pharma, we agreed to pay Forward Pharma $1.25 billion in cash. During the fourth quarter of 2016 we recognized a pre-tax charge of $454.8 million related to this matter. For more information on the settlement and license agreement please read Note 21, Commitments and Contingencies to our consolidated financial statements included in this report.
Product/Pipeline Developments
| Multiple Sclerosis | |
| TYSABRI (natalizumab) | |
| l | In June 2016 the European Commission (EC) approved a variation to the marketing authorization of TYSABRI, which extended its indication to include relapsing-remitting MS patients with highly active disease activity despite a full and adequate course of treatment with at least one disease modifying therapy. TYSABRI was previously indicated only for patients who had failed to respond to beta-interferon or glatiramer acetate in the E.U. |
| ZINBRYTA (daclizumab) | |
| l | ZINBRYTA was approved for the treatment of relapsing forms of MS in the U.S. in May 2016 and the E.U. in July 2016. |
| Opicinumab (Anti-LINGO-1) | |
| l | In June 2016 we reported top-line results from SYNERGY, our Phase 2 trial evaluating opicinumab in people with relapsing forms of MS. Opicinumab did not meet the primary endpoint or its secondary efficacy endpoint. However, based on these results, there was a subset of patients within the study that we believe have potential to benefit from treatment, and we are therefore planning another Phase 2 clinical trial related to opicinumab. |
| Neurodegeneration | |
| Aducanumab (BIIB037) | |
| l | In June 2016 we announced that aducanumab, our investigational treatment for early Alzheimer’s disease, was accepted into the European Medicines Agency's (EMA's) Priority Medicines (PRIME) program. PRIME aims to bring treatments to patients more quickly by enhancing the EMA's support for the development of investigational medicines for diseases without available treatments or in need of better treatment options. |
| l | In September 2016 aducanumab was granted "Fast Track" designation by the U.S. Food and Drug Administration (FDA). T |
Showing the first 8K of 106K characters. Open the full section
Item 1A. Risk Factors
We are substantially dependent on revenues from our principal products.
Our current revenues depend upon continued sales of our principal products, and, unless we develop or acquire rights to new products and technologies, we may be substantially dependent on sales from our principal products for many years. Further, following the completion of the spin-off of our hemophilia business, our revenues will be further reliant and concentrated on sales of our MS products in an increasingly competitive market, and revenue from sales of our product for spinal muscular atrophy. Any of the following negative developments relating to any of our principal products may adversely affect our revenues and results of operations or could cause a decline in our stock price:
| • | safety or efficacy issues; |
| • | the introduction or greater acceptance of competing products; |
| • | constraints and additional pressures on product pricing or price increases, including those resulting from governmental or regulatory requirements, increased competition, or changes in, or implementation of, reimbursement policies and practices of payors and other third parties; or |
| • | adverse legal, administrative, regulatory or legislative developments. |
SPINRAZA was recently approved by the FDA, and is in the early stages of commercial launch. In addition to risks associated with new product launches and the other factors described in these “Risk Factors”, our ability to successfully commercialize SPINRAZA may be adversely affected due to:
| • | our limited marketing experience within the spinal muscular atrophy market, which may impact our ability to develop relationships with the associated medical and scientific community; |
| • | the lack of readiness of healthcare providers to treat patients with spinal muscular atrophy; |
| • | the effectiveness of our commercial strategy for marketing SPINRAZA; and |
| • | our ability to maintain a positive reputation among patients, healthcare providers and others in the spinal muscular atrophy community, which may be impacted by pricing and reimbursement decisions relating to SPINRAZA. |
If we fail to compete effectively, our business and market position would suffer.
The biopharmaceutical industry and the markets in which we operate are intensely competitive. We compete in the marketing and sale of our products, the development of new products and processes, the acquisition of rights to new products with commercial potential and the hiring and retention of personnel. We compete with biotechnology and pharmaceutical companies that have a greater number of products on the market and in the product pipeline, greater financial and other resources and other technological or competitive advantages. One or more of our competitors may benefit from significantly greater sales and marketing capabilities, may develop products that are accepted more widely than ours or may receive patent protection that dominates, blocks or adversely affects our product development or business.
Our products are also susceptible to competition from generics and biosimilars in many markets. Generic versions of drugs and biosimilars are likely to be sold at substantially lower prices than branded products. Accordingly, the introduction of generic or biosimilar versions of our marketed products likely would significantly reduce both the price that we receive for such marketed products and the volume of products that we sell, which may have an adverse impact on our results of operations.
In the MS market, we face intense competition as the number of products and competitors continues to expand. Due to our significant reliance on sales of our MS products, our business may be harmed if we are unable to successfully compete in the MS market. More specifically, our ability to compete, maintain and grow our share in the MS market may be adversely affected due to a number of factors, including:
| • | the introduction of more efficacious, safer, less expensive or more convenient alternatives to our MS products, including our own products and products of our collaborators; |
| • | the introduction of lower-cost biosimilars, follow-on products or generic versions of branded MS products sold by our competitors, and the possibility of future competition from generic versions or prodrugs of existing therapeutics or from off-label use by physicians of therapies indicated for other conditions to treat MS patients; |
| • | patient dynamics, including the size of the patient population and our ability to attract new patients to our therapies; |
| • | damage to physician and patient confidence in any of our MS products or to our sales and reputation as a result of label changes or adverse experiences or events that may occur with patients treated with our MS products; |
| • | inability to obtain appropriate pricing and reimbursement for our MS products compared to our competitors in key international markets; or |
| • | our ability to obtain and maintain patent, data or market exclusivity for our MS products. |
Sales of our products depend, to a significant extent, on adequate coverage, pricing and reimbursement from third-party payors, which are subject to increasing and intense pressure from political, social, competitive and other sources. Our inability to maintain adequate coverage, or a reduction in pricing or reimbursement, could have an adverse effect on our business, revenues and results of operations and could cause a decline in our stock price.
Sales of our products are dependent, in large part, on the availability and extent of coverage, pricing and reimbursement from government health administration authorities, private health insurers and other organizations. When a new pharmaceutical product is approved, the availability of government and private reimbursement for that product may be uncertain, as is the pricing and amount for which that product will be reimbursed.
Pricing and reimbursement for our products may be adversely affected by a number of factors, including:
| • | changes in, and implementation of, federal, state or foreign government regulations or private third-party payors' reimbursement policies; |
| • | pressure by employers on private health insurance plans to reduce costs; and |
| • | consolidation and increasing assertiveness of payors, including managed care organizations, health insurers, pharmacy benefit managers, government health administration authorities, private health insurers and other organizations, seeking price discounts or rebates in connection with the placement of our products on their formularies and, in some cases, the imposition of restrictions on access or coverage of particular drugs or pricing determined based on perceived value. |
Our ability to set the price for our products can vary significantly from country to country and as a result so can the price of our products. Certain countries set prices by reference to the prices in other countries where our products are marketed. Thus, our inability to secure adequate prices in a particular country may not only limit the revenue from our products within that country, but may also adversely affect our ability to obtain acceptable prices in other markets. This may create the opportunity for third-party cross-border trade or influence our decision to sell or not to sell a product, thus adversely affecting our geographic expansion plans and revenues.
Our failure to maintain adequate coverage, pricing, or reimbursement for our products would have an adverse effect on our business, revenues and resu
Showing the first 8K of 65K characters. Open the full section
Item 1B. Unresolved Staff Comments
None.
Item 2. Properties
Below is a summary of our owned and leased properties as of December 31, 2016.
Massachusetts
In Cambridge, Massachusetts, we own approximately 508,000 square feet of real estate space, consisting of a building that houses a research laboratory and a cogeneration plant totaling approximately 263,000 square feet and a building that contains research, development and quality laboratories which total approximately 245,000 square feet.
In addition, we lease a total of approximately 1,250,000 square feet in Massachusetts, which is summarized as follows:
| • | 893,000 square feet in Cambridge, Massachusetts, which is comprised of a 67,000 square foot biologics manufacturing facility, which is subleased by Brammer, and 826,000 square feet for our corporate headquarters, laboratory and additional office space; and |
| • | 357,000 square feet of office space in Weston, Massachusetts, of which 175,000 square feet has been subleased through the remaining term of our lease agreement. |
Our Massachusetts lease agreements expire at various dates through the year 2028.
North Carolina
In RTP, North Carolina, we own approximately 834,000 square feet of real estate space, which is summarized as follows:
| • | 357,000 square feet of laboratory and office space; |
| • | 175,000 square feet related to a large-scale biologics manufacturing facility; |
| • | 105,000 square feet related to a biologics manufacturing facility; |
| • | 84,000 square feet of warehouse space and utilities; |
| • | 70,000 square feet related to a parenteral fill-finish facility; and |
| • | 43,000 square feet related to a large-scale purification facility. |
In addition, we lease 188,000 square feet of a facility in RTP, North Carolina from Eisai to manufacture our and Eisai's oral solid dose products and 40,000 square feet of warehouse space in Durham, North Carolina.
Denmark
We own a large-scale biologics manufacturing facility totaling approximately 228,000 square feet located in Hillerød, Denmark.
We also own approximately 306,000 square feet of additional space, which is summarized as follows:
| • | 139,000 square feet of warehouse, utilities and support space; |
| • | 70,000 square feet related to a label and packaging facility; |
| • | 50,000 square feet related to a laboratory facility; and |
| • | 47,000 square feet of administrative space. |
Switzerland
In December 2015 we acquired land in Solothurn, Switzerland where we are building a biologics manufacturing facility in the Commune of Luterbach over the next several years.
Other International
We lease office space in Zug, Switzerland, our international headquarters, the U.K., Germany, France, Denmark and numerous other countries. Our international lease agreements expire at various dates through the year 2028.
Item 3. Legal Proceedings
For a discussion of legal matters as of December 31, 2016, please read Note 20, Litigation to our consolidated financial statements included in this report, which is incorporated into this item by reference.
Item 4. Mine Safety Disclosures
Not applicable.
PART II
Item 5. Market for Registrant’s Common Equity, Related Stockholder Matters and Issuer Purchases of Equity Securities
Market and Stockholder Information
Our common stock trades on The NASDAQ Global Select Market under the symbol “BIIB.” The following table shows the high and low sales price for our common stock as reported by The NASDAQ Global Select Market for each quarter in the years ended December 31, 2016 and 2015:
| Common Stock Price | |||||||||||||||
| 2016 | 2015 | ||||||||||||||
| High | Low | High | Low | ||||||||||||
| First Quarter | $ | 301.02 | $ | 242.07 | $ | 480.18 | $ | 334.40 | |||||||
| Second Quarter | $ | 292.69 | $ | 223.02 | $ | 432.88 | $ | 368.88 | |||||||
| Third Quarter | $ | 333.65 | $ | 240.07 | $ | 412.24 | $ | 265.00 | |||||||
| Fourth Quarter | $ | 329.83 | $ | 268.00 | $ | 311.65 | $ | 254.00 |
As of January 27, 2017, there were approximately 700 stockholders of record of our common stock.
Dividends
We have not paid cash dividends since our inception. While we historically have not paid cash dividends and do not have a current intention to pay cash dividends, we continually review our capital allocation strategies, including, among other things, payment of cash dividends, stock repurchases or acquisitions.
Issuer Purchases of Equity Securities
In July 2016 our Board of Directors authorized a program to repurchase up to $5.0 billion of our common stock (2016 Share Repurchase Program). This authorization does not have an expiration date. Repurchased shares will be retired.
The following table summarizes our common stock repurchase activity under our 2016 Share Repurchase Program during the fourth quarter of 2016:
| Period | Total Number of Shares Purchased (#) | Average Price Paid per Share ($) | Total Number of Shares Purchased as Part of Publicly Announced Programs (#) | Maximum Approximate Dollar Value of Shares That May Yet Be Purchased Under Our Programs ($ in millions) | ||||||||
| October 2016 | 1,254,818 | 298.71 | 1,254,818 | $ | 4,276.3 | |||||||
| November 2016 | 939,046 | 294.24 | 939,046 | $ | 4,000.0 | |||||||
| December 2016 | — | — | — | $ | 4,000.0 | |||||||
| Total | 2,193,864 | 296.80 |
As of December 31, 2016, we repurchased and retired approximately 3.3 million shares of common stock at a cost of $1.0 billion under the 2016 Share Repurchase Program.
In February 2011 our Board of Directors authorized a program to repurchase up to 20.0 million shares of our common stock (2011 Share Repurchase Program), which has been used principally to offset common stock issuances under our share-based compensation plans. The 2011 Share Repurchase Program does not have an expiration date. We did not repurchase any shares of common stock under our 2011 Share Repurchase Program during the year ended December 31, 2016, and have approximately 1.3 million shares remaining available for repurchase under this authorization.
Stock Performance Graph
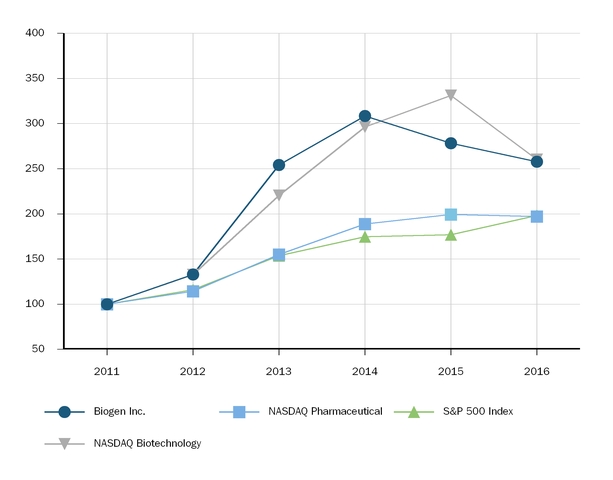
The graph below compares the five-year cumulative total stockholder return on our common stock, the S&P 500 Index, the Nasdaq Pharmaceutical Index and the Nasdaq Biotechnology Index assuming the investment of $100.00 on December 31, 2011 with dividends being reinvested. The stock price performance in the graph below is not necessarily indicative of future price performance.
| 2011 | 2012 | 2013 | 2014 | 2015 | 2016 | |||||||
| Biogen Inc. | 100.00 | 133.00 | 254.04 | 308.45 | 278.37 | 257.68 | ||||||
| NASDAQ Pharmaceutical | 100.00 | 114.32 | 155.11 | 188.95 | 199.22 | 197.05 | ||||||
| S&P 500 Index | 100.00 | 116.00 | 153.57 | 174.60 | 177.01 | 198.18 | ||||||
| NASDAQ Biotechnology | 100.00 | 132.74 | 220.37 | 296.19 | 331.05 | 260.37 |
Item 6. Selected Financial Data
BIOGEN INC. AND SUBSIDIARIES
SELECTED FINANCIAL DATA
| Our results of operations are summarized as follows: | |||||||||||||||||||
| For the Years Ended December 31, | |||||||||||||||||||
| 2016 | 2015 | 2014 | 2013 | 2012 | |||||||||||||||
| (In millions, except per share amounts) | (d) (e) | (d) | (f) | (g) | (h) | ||||||||||||||
| Results of Operations | |||||||||||||||||||
| Product revenues, net (a) | $ | 9,817.9 | $ | 9,188.5 | $ | 8,203.4 | $ | 5,542.3 | $ | 4,166.1 | |||||||||
| Revenues from anti-CD20 therapeutic programs | 1,314.5 | 1,339.2 | 1,195.4 | 1,126.0 | 1,137.9 | ||||||||||||||
| Other revenues | 316.4 | 236.1 | 304.5 | 263.9 | 212.5 | ||||||||||||||
| Total revenues | 11,448.8 | 10,763.8 | 9,703.3 | 6,932.2 | 5,516.5 | ||||||||||||||
| Total cost and expenses | 6,298.4 | 5,872.8 | 5,747.7 | 4,441.6 | 3,707.4 | ||||||||||||||
| Gain on sale of rights | — | — | 16.8 | 24.9 | 46.8 | ||||||||||||||
| Income from operations | 5,150.4 | 4,891.0 | 3,972.4 | 2,515.5 | 1,855.9 | ||||||||||||||
| Other income (expense), net | (217.4 | ) | (123.7 | ) | (25.8 | ) | (34.9 | ) | (0.7 | ) | |||||||||
| Income before income tax expense and equity in loss of investee, net of tax | 4,933.0 | 4,767.3 | 3,946.6 | 2,480.6 | 1,855.1 | ||||||||||||||
| Income tax expense | 1,237.3 | 1,161.6 | 989.9 | 601.0 | 470.6 | ||||||||||||||
| Equity in loss of investee, net of tax | — | 12.5 | 15.1 | 17.2 | 4.5 | ||||||||||||||
| Net income | 3,695.7 | 3,593.2 | 2,941.6 | 1,862.3 | 1,380.0 | ||||||||||||||
| Net income (loss) attributable to noncontrolling interests, net of tax | (7.1 | ) | 46.2 | 6.8 | — | — | |||||||||||||
| Net income attributable to Biogen Inc. | $ | 3,702.8 | $ | 3,547.0 | $ | 2,934.8 | $ | 1,862.3 | $ | 1,380.0 | |||||||||
| Diluted Earnings Per Share | |||||||||||||||||||
| Diluted earnings per share attributable to Biogen Inc. | $ | 16.93 | $ | 15.34 | $ | 12.37 | $ | 7.81 | $ | 5.76 | |||||||||
| Weighted-average shares used in calculating diluted earnings per share attributable to Biogen Inc. | 218.8 | 231.2 | 237.2 | 238.3 | 239.7 | ||||||||||||||
| Our financial condition is summarized as follows: | |||||||||||||||||||
| As of December 31, | |||||||||||||||||||
| 2016 | 2015 | 2014 | 2013 | 2012 | |||||||||||||||
| (In millions) | |||||||||||||||||||
| Financial Condition | |||||||||||||||||||
| Cash, cash equivalents and marketable securities | $ | 7,724.5 | $ | 6,188.9 | $ | 3,316.0 | $ | 1,848.5 | $ | 3,742.4 | |||||||||
| Total assets | $ | 22,876.8 | $ | 19,504.8 | $ | 14,314.7 | $ | 11,863.3 | $ | 10,130.1 | |||||||||
| Notes payable and other financing arrangements, less current portion (b) | $ | 6,512.7 | $ | 6,521.5 | $ | 580.3 | $ | 592.4 | $ | 687.4 | |||||||||
| Total Biogen Inc. shareholders’ equity (c) | $ | 12,140.1 | $ | 9,372.8 | $ | 10,809.0 | $ | 8,620.2 | $ | 6,961.5 |
In addition to the following notes, the financial data included within the tables above should be read in conjunction with our consolidated financial statements and related notes and the “Management’s Discussion and Analysis of Financial Condition and Results of Operations” sections of this report and our previously filed Form 10-Ks.
| (a) | Product revenues, net reflect the impact of the following product launches: |
| • | Commercial sales of SPINRAZA began in the fourth quarter of 2016. |
| • | Under the terms of our collaboration agreement with AbbVie, we began to recognize revenues on sales of ZINBRYTA to third parties in the E.U. in the third quarter of 2016. |
| • | Under the terms of our commercial agreement with Samsung Bioepis, we began to recognize revenues on sales of BENEPALI and FLIXABI to third parties in the E.U. in the first quarter of 2016 and third quarter of 2016, respectively. |
| • | Commercial sales of ALPROLIX commenced in the second quarter of 2014 and commercial sales of ELOCTATE and PLEGRIDY commenced in the third quarter of 2014. |
| • | TECFIDERA began in April 2013. |
| (b) | Notes payable and other financing arrangements reflects the issuance of our senior unsecured notes for an aggregate principal amount of $6.0 billion in September 2015, and the 2013 repayment of our 6.0% notes that were issued in 2008 for an aggregate principal amount of $450.0 million. |
| (c) | Total Biogen Inc.'s shareholders' equity reflects the repurchase of approximately 32.8 million shares of our common stock at a cost of approximately $8.3 billion between 2012 and 2016: |
| • | During 2016 we repurchased and retired approximately 3.3 million shares of our common stock at a cost of $1.0 billion under our 2016 Share Repurchase Program. |
| • | During 2015 we repurchased and retired approximately 16.8 million shares of our common stock at a cost of $5.0 billion under our 2015 Share Repurchase Program. |
| • | During 2014, 2013 and 2012 we repurchased approximately 2.9 million, 2.0 million and 7.8 million shares, respectively of our common stock at a cost of approximately $2.3 billion under our 2011 Share Repurchase Program of which approximately 3.7 million of these shares were retired. |
| (d) | Total cost and expenses for the years ended December 31, 2016 and 2015, include restructuring charges of $33.1 million and $93.4 million, respectively. In addition, total cost and expenses for the year ended December 31, 2016, also include charges to cost of sales totaling $52.4 million of expenses incurred as a result of our determination to vacate and cease manufacturing in our small-scale biologics facility in Cambridge, MA as well as vacate our warehouse in Somerville, MA. Total cost and expenses for year ended December 31, 2016, also include $18.1 million of costs incurred directly related to our separation of our hemophilia business into an independent, publicly traded company. |
| (e) | Total cost and expenses for the year ended December 31, 2016, includes a pre-tax charge of $454.8 million related to the January 2017 settlement and license agreement with Forward Pharma A/S (Forward Pharma). |
| (f) | In June 2014 AIFA approved a resolution affirming that there is no reimbursement limit from and after February 2013. As a result, we recognized $53.5 million of TYSABRI revenues in the second quarter of 2014 related to the periods beginning February 2013 that were previously deferred. |
| (g) | Our share of revenues from anti-CD20 therapeutic programs reflects charges of $49.7 million in 2013 for damages and interest awarded to Hoechst in Genentech's arbitration with Hoechst for RITUXAN. |
| (h) | Commencing in the second quarter of 2013 product and total revenues include 100% of net revenues related to sales of TYSABRI as a result of our acquisition of all remaining rights to TYSABRI from Elan Pharma International, Ltd (Elan), an affiliate of Elan Corporation, plc. Upon the closing, our collaboration agreement was terminated, and we no longer record collaboration profit sharing expense. We recognized collaboration profit sharing expense of $85.4 million and $317.9 million during the years ended December 31, 2013 and 2012, respectively. |
Item 7. Management’s Discussion and Analysis of Financial Condition and Results of Operations
The following discussion should be read in conjunction with our consolidated financial statements and related notes beginning on page F-1 of this report. Certain totals may not sum due to rounding.
Executive Summary
Introduction
Biogen is a global biopharmaceutical company focused on discovering, developing, manufacturing and delivering therapies to people living with serious neurological, rare and autoimmune diseases.
Our marketed products include TECFIDERA, AVONEX, PLEGRIDY, TYSABRI, ZINBRYTA and FAMPYRA for multiple sclerosis (MS), FUMADERM for the treatment of severe plaque psoriasis and SPINRAZA for the treatment of spinal muscular atrophy (SMA). We also have certain business and financial rights with respect to RITUXAN for the treatment of non-Hodgkin's lymphoma, chronic lymphocytic leukemia (CLL) and other conditions, GAZYVA indicated for the treatment of CLL and follicular lymphoma, and other potential anti-CD20 therapies under a collaboration agreement with Genentech, Inc. (Genentech), a wholly-owned member of the Roche Group.
In May 2016 we announced our intention to spin off our hemophilia business, Bioverativ Inc. (Bioverativ), as an independent, publicly traded company. Bioverativ will focus on the discovery, development and commercialization of therapies for the treatment of hemophilia and other blood disorders, including ELOCTATE for the treatment of hemophilia A and ALPROLIX for the treatment of hemophilia B. Bioverativ will also assume all of our rights and obligations under our collaboration agreement with Swedish Orphan Biovitrum AB (Sobi) and our collaboration and license agreement with Sangamo Biosciences Inc. (Sangamo).
On February 1, 2017, we completed the distribution of all the then outstanding shares of common stock of Bioverativ to Biogen stockholders, who received one share of Bioverativ common stock for every two shares of Biogen common stock. As a result of the distribution, Bioverativ is now an independent public company whose shares of common stock are trading under the symbol "BIVV"
on the Nasdaq Global Select Market.
The financial results of Bioverativ are included in our consolidated results of operations and financial position in our audited consolidated financial statements for the periods presented in this Form 10-K. The financial results of Bioverativ will be excluded from our consolidated results of operations and financial position commencing February 1, 2017. For additional information regarding the separation of Bioverativ, please read Note 26, Subsequent Events to our consolidated financial statements included in this report.
Our current revenues depend upon continued sales of our principal products and, unless we develop, acquire rights to, and commercialize new products and technologies, we may be substantially dependent on sales from our principal products for many years. Further, following the completion of the spin-off of our hemophilia business, our revenues will be further reliant and concentrated on sales of our MS products in an increasingly competitive market.
In the longer term, our revenue growth will be dependent upon the successful clinical development, regulatory approval and launch of new commercial products as well as additional indications for our existing products, our ability to obtain and maintain patents and other rights related to our marketed products, assets originating from our research and development efforts and successful execution of external business development opportunities.
We support our drug discovery and development efforts through the commitment of significant resources to discovery, research and development programs and business development opportunities, particularly within areas of our scientific, manufacturing and technical capabilities. For nearly two decades we have led in the research and development of new therapies to treat MS, resulting in our leading portfolio of MS treatments. Now our research is focused on additional improvements in the treatment of MS, such as, the development of next generation therapies for MS with a goal to reverse or possibly repair damage caused by the disease. We are also applying our scientific expertise to solve some of the most challenging and complex diseases, including Alzheimer's disease, Parkinson's disease and amyotrophic lateral sclerosis (ALS), and are employing innovative technologies to discover potential treatments for rare and genetic disorders, including new ways of treating diseases through gene therapy.
Our innovative drug development and commercialization activities are complemented by our biosimilar therapies that expand access to medicines and reduce the cost burden for healthcare systems. We are leveraging our manufacturing capabilities and know-how by developing, manufacturing and marketing
biosimilars through Samsung Bioepis, our joint venture with Samsung BioLogics Co. Ltd. (Samsung Biologics). Under our commercial agreement with Samsung Bioepis, we market and sell BENEPALI, an etanercept biosimilar referencing ENBREL, and FLIXABI, an infliximab biosimilar referencing REMICADE, in the European Union (E.U.).
Financial Highlights
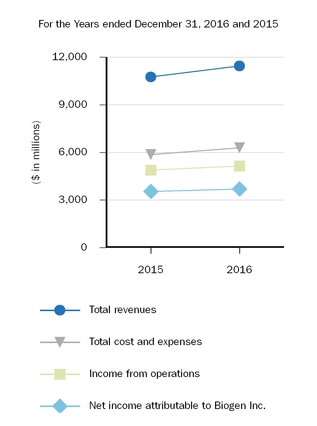
Diluted earnings per share attributable to Biogen Inc. were $16.93 for 2016, representing an increase of 10.4% over the same period in 2015.
As described below under “Results of Operations,” our income from operations for the year ended December 31, 2016, reflects the following:
| • | Total revenues were $11,448.8 million for 2016, representing an increase of 6.4% over the same period in 2015. |
| • | Product revenues, net totaled $9,817.9 million for 2016, representing an increase of 6.8% over the same period in 2015. This increase was driven by a 9.1% increase in worldwide TECFIDERA revenues, a 52.8% increase in worldwide hemophilia revenues, a 4.1% increase in worldwide TYSABRI revenues and revenues from BENEPALI. These increases are partially offset by a 5.8% decrease in worldwide Interferon revenues. Product revenues, net for |
2016, compared to the same period in 2015, were also negatively impacted by a $167.8 million decrease in hedge gains recognized under our foreign currency hedging program in comparative periods.
| • | Revenues from anti-CD20 therapeutic programs totaled $1,314.5 million for 2016, representing a decrease of 1.8% over the same period in 2015. |
| • | Other revenues totaled $316.4 million for 2016, representing an increase of 34.0% from the same period in 2015. This increase was primarily driven by an increase in other corporate revenues, which includes amounts earned with respect to our contract manufacturing activities. |
| • | Total cost and expenses totaled $6,298.4 million for 2016, representing an increase of 7.2%, compared to the same period in 2015. This increase was driven by a $454.8 million litigation settlement and license charge and a 19.2% increase in cost of sales, which includes a charge of $45.5 million for accelerated depreciation as a result of the determination to cease manufacturing in Cambridge, MA and vacate our biologics manufacturing facility in Cambridge, MA and warehouse space in Somerville, MA. These increases were partially offset by a 7.8% decrease in selling, general and administrative expenses and a decrease in restructuring charges. |
We generated $4,522.4 million of net cash flows from operations for 2016, which were primarily driven by earnings. Cash, cash equivalents and marketable securities totaled approximately $7,724.5 million as of December 31, 2016.
During the year ended December 31, 2016, we repurchased and retired approximately 3.3 million shares of common stock at a cost of $1.0 billion under our share repurchase programs.
Collaborative and Other Relations
Showing the first 8K of 118K characters. Open the full section
Item 7A. Quantitative and Qualitative Disclosures About Market Risk
Market Risk
We are subject to certain risks which may affect our results of operations, cash flows and fair values of assets and liabilities, including volatility in foreign currency exchange rates, interest rate movements, pricing pressures worldwide and weak economic conditions in the foreign markets in which we operate. We manage the impact of foreign currency exchange rates and interest rates through various financial instruments, including derivative instruments such as foreign currency forward contracts, interest rate lock contracts and interest rate swap contracts. We do not enter into financial instruments for trading or speculative purposes. The counter-parties to these contracts are major financial institutions and there is no significant concentration of exposure with any one counter-party.
Foreign Currency Exchange Risk
Our results of operations are subject to foreign currency exchange rate fluctuations due to the global nature of our operations. We have operations or maintain distribution relationships in the U.S., Europe, Canada, Asia, Central and South America. In addition, we recognize our share of pre-tax co-promotion profits on RITUXAN in Canada. As a result, our financial position, results of operations and cash flows can be affected by market fluctuations in foreign exchange rates, primarily with respect to the Euro, British pound sterling, Canadian dollar, Swiss franc, Danish krone and Japanese yen.
While the financial results of our global activities are reported in U.S. dollars, the functional currency for most of our foreign subsidiaries is their respective local currency. Fluctuations in the foreign currency exchange rates of the countries in which we do business will affect our operating results, often in ways that are difficult to predict. In particular, as the U.S. dollar strengthens versus other currencies, the value of non-U.S. revenue will decline when reported in U.S. dollars. The impact to net income as a result of a strengthening U.S. dollar will be partially mitigated by the value of non-U.S. expense which will also decline when reported in U.S. dollars. As the U.S. dollar weakens versus other currencies, the value of non-U.S. revenue and expenses will increase when reported in U.S. dollars.
We have established revenue and operating expense hedging and balance sheet risk management programs to protect against volatility of future foreign currency cash flows and changes in fair value caused by volatility in foreign exchange rates.
In June 2016 the U.K. voted in a referendum to voluntarily depart from the E.U., known as Brexit. The macroeconomic impact on our results of operations from this vote remains unknown. To date, the foreign exchange impact has been negligible since we hedged the balance sheet foreign currency exchange risk.
Revenue and Operating Expense Hedging Program
Our foreign currency hedging program is designed to mitigate, over time, a portion of the impact resulting from volatility in exchange rate changes on revenues and operating expenses. We use foreign currency forward contracts to manage foreign currency risk, with the majority of our forward contracts used to hedge certain forecasted revenue and operating expense transactions denominated in foreign currencies in the next 18 months. We do not engage in currency speculation. For a more detailed disclosure of our revenue and operating expense hedging program, please read Note 9, Derivative Instruments to our consolidated financial statements included in this report.
Our ability to mitigate the impact of exchange rate changes on revenues and net income diminishes as significant exchange rate fluctuations are sustained over extended periods of time. In particular, devaluation or significant deterioration of foreign currency exchange rates are difficult to mitigate and likely to negatively impact earnings. The cash flows from these contracts are reported as operating activities in our consolidated statements of cash flows.
Balance Sheet Risk Management Hedging Program
We also use forward contracts to mitigate the foreign currency exposure related to certain balance sheet items. The primary objective of our balance sheet risk management program is to mitigate the exposure of foreign currency denominated net monetary assets of foreign affiliates. In these instances, we principally utilize currency forward contracts. We have not elected hedge accounting for the balance sheet related items. The cash flows from these contracts are reported as operating activities in our consolidated statement of cash flows.
The following quantitative information includes the impact of currency movements on forward contracts used in our revenue, operating expense and balance sheet hedging programs. As of December 31, 2016 and 2015, a hypothetical adverse 10% movement in foreign currency rates compared to the U.S. dollar across all maturities would result in a hypothetical decrease in the fair value of forward contracts of approximately $172.0 million and $185.0 million, respectively. The estimated fair value change was determined by measuring the impact of the hypothetical exchange rate movement on outstanding forward contracts. Our use of this methodology to quantify the market risk of such instruments is subject to assumptions and the actual impact could be significantly different. The quantitative information about market risk is limited because it does not take into account all foreign currency operating transactions.
Interest Rate Risk
Our investment portfolio includes cash equivalents and short-term investments. The fair value of our marketable securities is subject to change as a result of potential changes in market interest rates. The potential change in fair value for interest rate sensitive instruments has been assessed on a hypothetical 100 basis point adverse movement across all maturities. As of December 31, 2016 and 2015, we estimate that such hypothetical 100 basis point adverse movement would result in a hypothetical loss in fair value of approximately $50.0 million and $43.0 million, respectively, to our interest rate sensitive instruments. The fair values of our investments were determined using third-party pricing services or other market observable data.
To achieve a desired mix of fixed and floating interest rate debt, we entered into interest rate swap contracts during 2015 for certain of our fixed-rate debt. These derivative contracts effectively converted a fixed-rate interest coupon to a floating-rate LIBOR-based coupon over the life of the respective note. As of December 31, 2016 and 2015, a 100 basis-point adverse movement (increase in LIBOR) would increase annual interest expense by approximately $6.8 million in each case.
Pricing Pressure
Governments in some international markets in which we operate have implemented measures aimed at reducing healthcare costs to constrain the overall level of government expenditures. These implemented measures vary by country and include, among other things, mandatory rebates and discounts, prospective and possible retroactive price reductions and suspensions on price increases of pharmaceuticals.
In addition, certain countries set prices by reference to the prices in other countries where our products are marketed. Thus, our inability to secure favorable prices in a particular country may impair our ability to obtain acceptable prices in existing and potential new markets, which may limit market growth. The continued implementation of pricing actions throughout Europe may also lead to higher levels of parallel trade.
In the U.S., federal and state legislatures, health agencies and third-party payors continue to focus on containing the cost of health care. Legislative and regulatory proposals, enactments to reform health care insurance programs and increasing pressure from social sources could significantly influence the manner in which our products are prescribed and purchased. It is possible that additional federal health care reform measures will be adopted in the future, which could result in increased pricing pressure and reduced reimbursement for our products and otherwise have an adverse impact on our financial position or results of operations.
There is also significant economic pressure on state budgets that may result in states increasingly seeking to achieve budget savings through mechanisms that limit coverage or payment for our drugs. Managed care organizations are also continuing to seek price discounts and, in some cases, to impose restrictions on the coverage of particular drugs.
Credit Risk
We are subject to credit risk from our accounts receivable related to our product sales. The majority of our accounts receivable arise from product sales in the U.S. and Europe with concentrations of credit risk limited due to the wide variety of customers and markets using our products, as well as their dispersion across many different geographic areas. Our accounts receivable are primarily due from wholesale distributors, public hospitals, specialty pharmacies and other government entities. We monitor the financial performance and creditworthiness of our customers so that we can properly assess and respond to changes in their credit profile. We operate in certain countries where weakness in economic conditions can result in extended collection periods. We continue to monitor these conditions, including the volatility associated with international economies and the relevant financial markets, and assess their possible impact on our business. To date, we have not experienced any significant losses with respect to the collection of our accounts receivable.
Credit and economic conditions in the E.U. continue to remain uncertain, which has, from time to time, led to long collection periods for our accounts receivable and greater collection risk in certain countries.
We believe that our allowance for doubtful accounts was adequate as of December 31, 2016 and 2015. However, if significant changes occur in the availability of government funding or the reimbursement practices of these or other governments, we may not be able to collect on amounts due to us from customers in such countries and our results of operations could be adversely affected.
Item 8. Financial Statements and Supplementary Data
The information required by this Item 8 is contained on pages F-1 through F-75 of this report and is incorporated herein by reference.
Item 9. Changes in and Disagreements with Accountants on Accounting and Financial Disclosure
None.
Item 9A. Controls and Procedures
Disclosure Controls and Procedures and Internal Control over Financial Reporting
Controls and Procedures
We have carried out an evaluation, under the supervision and with the participation of our management, including our principal executive officer and principal financial officer, of the effectiveness of the design and operation of our disclosure controls and procedures (as defined in Rules 13a-15(e) and 15d-15(e) under the Securities Exchange Act of 1934, as amended), as of December 31, 2016. Based upon that evaluation, our principal executive officer and principal financial officer concluded that, as of the end of the period covered by this report, our disclosure controls and procedures are effective in ensuring that (a) the information required to be disclosed by us in the reports that we file or submit under the Securities Exchange Act is recorded, processed, summarized and reported within the time periods specified in the SEC’s rules and forms, and (b) such information is accumulated and communicated to our management, including our principal executive officer and principal financial officer, as appropriate to allow timely decisions regarding required disclosure. In designing and evaluating our disclosure controls and procedures, our management recognized that any controls and procedures, no matter how well designed and operated, can provide only reasonable assurance of achieving the desired control objectives, and our management necessarily was required to apply its judgment in evaluating the cost-benefit relationship of possible controls and procedures.
Changes in Internal Control over Financial Reporting
There were no changes in our internal control over financial reporting during the quarter ended December 31, 2016 that have materially affected, or are reasonably likely to materially affect, our internal control over financial reporting.
Management’s Annual Report on Internal Control over Financial Reporting
Our management is responsible for establishing and maintaining adequate internal control over our financial reporting. Internal control over financial reporting is defined in Rules 13a-15(f) and 15d-15(f) under the Securities Exchange Act as a process designed by, or under the supervision of, a company’s principal executive and principal financial officers and effected by a company’s board of directors, management and other personnel to provide reasonable assurance regarding the reliability of financial reporting and the preparation of financial statements for external purposes in accordance with
U.S. GAAP. Our internal control over financial reporting includes those policies and procedures that:
| • | pertain to the maintenance of records that, in reasonable detail, accurately and fairly reflect our transactions and dispositions of our assets; |
| • | provide reasonable assurance that transactions are recorded as necessary to permit preparation of financial statements in accordance with U.S. GAAP, and that our receipts and expenditures are being made only in accordance with authorizations of our management and directors; and |
| • | provide reasonable assurance regarding prevention or timely detection of unauthorized acquisition, use or disposition of our assets that could have a material effect on our financial statements. |
Because of its inherent limitations, internal control over financial reporting may not prevent or detect misstatements. Projections of any evaluation of effectiveness to future periods are subject to the risk that controls may become inadequate because of changes in conditions, or that the degree of compliance with the policies or procedures may deteriorate.
Our management assessed the effectiveness of our internal control over financial reporting as of December 31, 2016. In making this assessment, management used the criteria set forth by the Committee of Sponsoring Organizations of the Treadway Commission (COSO) in its 2013 Internal Control — Integrated Framework.
Based on our assessment, our management has concluded that, as of December 31, 2016, our internal control over financial reporting is effective based on those criteria.
The effectiveness of our internal control over financial reporting as of December 31, 2016 has been audited by PricewaterhouseCoopers LLP, an independent registered public accounting firm, as stated in their attestation report, which is included herein.
Item 9B. Other Information
None.
PART III
Item 10. Directors, Executive Officers and Corporate Governance
The information concerning our executive officers is set forth under the heading “Our Executive Officers” in Part I of this report. The text of our code of business conduct, which includes the code of ethics that applies to our principal executive officer, principal financial officer, principal accounting officer or controller, and persons performing similar functions, is posted on our website, www.biogen.com, under the “Corporate Governance” subsection of the “About Us” section of the site. We intend to make all required disclosures regarding any amendments to, or waivers from, provisions of our code of business conduct at the same location of our website.
The response to the remainder of this item is incorporated by reference from the discussion responsive thereto in the sections entitled “Proposal 1 - Election of Directors,” “Corporate Governance at Biogen,” “Stock Ownership - Section 16(a) Beneficial Ownership Reporting Compliance” and “Miscellaneous - Stockholder Proposals” contained in the proxy statement for our 2017 annual meeting of stockholders.
Item 11. Executive Compensation
The response to this item is incorporated by reference from the discussion responsive thereto in the sections entitled “Executive Compensation Matters” and “Corporate Governance at Biogen” contained in the proxy statement for our 2017 annual meeting of stockholders.
Item 12. Security Ownership of Certain Beneficial Owners and Management and Related Stockholder Matters
The response to this item is incorporated by reference from the discussion responsive thereto in the sections entitled “Stock Ownership” and “Equity Compensation Plan Information” contained in the proxy statement for our 2017 annual meeting of stockholders.
Item 13. Certain Relationships and Related Transactions, and Director Independence
The response to this item is incorporated by reference from the discussion responsive thereto in the sections entitled “Certain Relationships and Related Person Transactions” and “Corporate Governance at Biogen” contained in the proxy statement for our 2017 annual meeting of stockholders.
Item 14. Principal Accounting Fees and Services
The response to this item is incorporated by reference from the discussion responsive thereto in the section entitled “Proposal 2 — Ratification of the Selection of our Independent Registered Public Accounting Firm” contained in the proxy statement for our 2017 annual meeting of stockholders.
PART IV
Item 15. Exhibits and Financial Statement Schedules
a. (1) Consolidated Financial Statements:
The following financial statements are filed as part of this report:
| Financial Statements | Page Number | |
| Consolidated Statements of Income | F-2 | |
| Consolidated Statements of Comprehensive Income | F-3 | |
| Consolidated Balance Sheets | F-4 | |
| Consolidated Statements of Cash Flows | F-5 | |
| Consolidated Statements of Equity | F-6 | |
| Notes to Consolidated Financial Statements | F-9 | |
| Report of Independent Registered Public Accounting Firm | F-75 |
Certain totals may not sum due to rounding.
(2) Financial Statement Schedules
Schedules are omitted because they are not applicable, or are not required, or because the information is included in the consolidated financial statements and notes thereto.
(3) Exhibits
The exhibits listed on the Exhibit Index beginning on page A-1, which is incorporated herein by reference, are filed or furnished as part of this report or are incorporated into this report by reference.
SIGNATURES
Pursuant to the requirements of Section 13 or 15(d) of the Securities Exchange Act of 1934, the registrant has duly caused this report to be signed on its behalf by the undersigned, thereunto duly authorized.
| BIOGEN INC. | |
| By: | /S/ MICHEL VOUNATSOS |
| Michel Vounatsos | |
| Chief Executive Officer |
Date: February 2, 2017
Pursuant to the requirements of the Securities Exchange Act of 1934, this report has been signed below by the following persons on behalf of the registrant and in the capacities and on the dates indicated.
| Name | Capacity | Date | ||
| /S/ MICHEL VOUNATSOS | Director and Chief Executive Officer (principal executive officer) | February 2, 2017 | ||
| Michel Vounatsos | ||||
| /S/ PAUL J. CLANCY | Executive Vice President, Finance and Chief Financial Officer (principal financial officer) | February 2, 2017 | ||
| Paul J. Clancy | ||||
| /S/ GREGORY F. COVINO | Vice President, Finance, Chief Accounting Officer (principal accounting officer) | February 2, 2017 | ||
| Gregory F. Covino | ||||
| /S/ STELIOS PAPADOPOULOS | Director and Chairman of the Board of Directors | February 2, 2017 | ||
| Stelios Papadopoulos | ||||
| /S/ ALEXANDER J. DENNER | Director | February 2, 2017 | ||
| Alexander J. Denner | ||||
| /S/ CAROLINE D. DORSA | Director | February 2, 2017 | ||
| Caroline D. Dorsa | ||||
| /S/ NANCY L. LEAMING | Director | February 2, 2017 | ||
| Nancy L. Leaming | ||||
| /S/ RICHARD C. MULLIGAN | Director | February 2, 2017 | ||
| Richard C. Mulligan | ||||
| /S/ ROBERT W. PANGIA | Director | February 2, 2017 | ||
| Robert W. Pangia | ||||
| /S/ BRIAN S. POSNER | Director | February 2, 2017 | ||
| Brian S. Posner | ||||
| /S/ ERIC K. ROWINSKY | Director | February 2, 2017 | ||
| Eric K. Rowinsky | ||||
| /S/ LYNN SCHENK | Director | February 2, 2017 | ||
| Lynn Schenk | ||||
| /S/ STEPHEN A. SHERWIN | Director | February 2, 2017 | ||
| Stephen A. Sherwin |
BIOGEN INC. AND SUBSIDIARIES
CONSOLIDATED FINANCIAL STATEMENTS
| Page Number | ||
| Consolidated Statements of Income | F-2 | |
| Consolidated Statements of Comprehensive Income | F-3 | |
| Consolidated Balance Sheets | F-4 | |
| Consolidated Statements of Cash Flows | F-5 | |
| Consolidated Statements of Equity | F-6 | |
| Notes to Consolidated Financial Statements | F-9 | |
| Report of Independent Registered Public Accounting Firm | F-75 |
F- 1
BIOGEN INC. AND SUBSIDIARIES
CONSOLIDATED STATEMENTS OF INCOME
(In millions, except per share amounts)
| For the Years Ended December 31, | |||||||||||
| 2016 | 2015 | 2014 | |||||||||
| Revenues: | |||||||||||
| Product, net | $ | 9,817.9 | $ | 9,188.5 | $ | 8,203.4 | |||||
| Revenues from anti-CD20 therapeutic programs | 1,314.5 | 1,339.2 | 1,195.4 | ||||||||
| Other | 316.4 | 236.1 | 304.5 | ||||||||
| Total revenues | 11,448.8 | 10,763.8 | 9,703.3 | ||||||||
| Cost and expenses: | |||||||||||
| Cost of sales, excluding amortization of acquired intangible assets | 1,478.7 | 1,240.4 | 1,171.0 | ||||||||
| Research and development | 1,973.3 | 2,012.8 | 1,893.4 | ||||||||
| Selling, general and administrative | 1,947.9 | 2,113.1 | 2,232.3 | ||||||||
| Amortization of acquired intangible assets | 385.6 | 382.6 | 489.8 | ||||||||
| Restructuring charges | 33.1 | 93.4 | — | ||||||||
| Loss (gain) on fair value remeasurement of contingent consideration | 14.8 | 30.5 | (38.9 | ) | |||||||
| Collaboration profit (loss) sharing | 10.2 | — | — | ||||||||
| TECFIDERA litigation settlement and license charges | 454.8 | — | — | ||||||||
| Total cost and expenses | 6,298.4 | 5,872.8 | 5,747.7 | ||||||||
| Gain on sale of rights | — | — | 16.8 | ||||||||
| Income from operations | 5,150.4 | 4,891.0 | 3,972.4 | ||||||||
| Other income (expense), net | (217.4 | ) | (123.7 | ) | (25.8 | ) | |||||
| Income before income tax expense and equity in loss of investee, net of tax | 4,933.0 | 4,767.3 | 3,946.6 | ||||||||
| Income tax expense | 1,237.3 | 1,161.6 | 989.9 | ||||||||
| Equity in loss of investee, net of tax | — | 12.5 | 15.1 | ||||||||
| Net income | 3,695.7 | 3,593.2 | 2,941.6 | ||||||||
| Net (loss) income attributable to noncontrolling interests, net of tax | (7.1 | ) | 46.2 | 6.8 | |||||||
| Net income attributable to Biogen Inc. | $ | 3,702.8 | $ | 3,547.0 | $ | 2,934.8 | |||||
| Net income per share: | |||||||||||
| Basic earnings per share attributable to Biogen Inc. | $ | 16.96 | $ | 15.38 | $ | 12.42 | |||||
| Diluted earnings per share attributable to Biogen Inc. | $ | 16.93 | $ | 15.34 | $ | 12.37 | |||||
| Weighted-average shares used in calculating: | |||||||||||
| Basic earnings per share attributable to Biogen Inc. | 218.4 | 230.7 | 236.4 | ||||||||
| Diluted earnings per share attributable to Biogen Inc. | 218.8 | 231.2 | 237.2 |
See accompanying notes to these consolidated financial statements.
F- 2
BIOGEN INC. AND SUBSIDIARIES
CONSOLIDATED STATEMENTS OF COMPREHENSIVE INCOME
(In millions)
| For the Years Ended December 31, | |||||||||||
| 2016 | 2015 | 2014 | |||||||||
| Net income attributable to Biogen Inc. | $ | 3,702.8 | $ | 3,547.0 | $ | 2,934.8 | |||||
| Other comprehensive income: | |||||||||||
| Unrealized gains (losses) on securities available for sale: | |||||||||||
| Unrealized gains (losses) recognized during the period, net of tax | (10.6 | ) | (1.7 | ) | 0.4 | ||||||
| Less: reclassification adjustment for (gains) losses included in net income, net of tax | 0.6 | 1.3 | (6.4 | ) | |||||||
| Unrealized gains (losses) on securities available for sale, net of |
Showing the first 8K of 322K characters. Open the full section