 filings.tools
Item 5. MARKET FOR THE REGISTRANT’S COMMON EQUITY, RELATED STOCKHOLDER MATTERS AND ISSUER PURCHASES OF EQUITY SECURITIES.
5K characters. Original on sec.gov · Markdown
Item 5. MARKET FOR THE REGISTRANT’S COMMON EQUITY, RELATED STOCKHOLDER MATTERS AND ISSUER PURCHASES OF EQUITY SECURITIES.
Bristol Myers Squibb common stock is traded on the New York Stock Exchange (Symbol: BMY).
Holders of Common Stock
The number of record holders of our common stock at January 31, 2023 was 32,895.
The number of record holders is based upon the actual number of holders registered on our books at such date based on information provided by EQ Shareowner Services, our transfer agent, and does not include holders of shares in “street names” or persons, partnerships, associations, corporations or other entities identified in security position listings maintained by depository trust companies.
Equity Compensation Plan Information
Information required by this item will be contained in our 2023 Proxy Statement under the heading “Items to be Voted Upon—Item 2—Advisory Vote to Approve the Compensation of our Named Executive Officers—Equity Compensation Plan Information,” which information is incorporated herein by reference.
Performance Graph
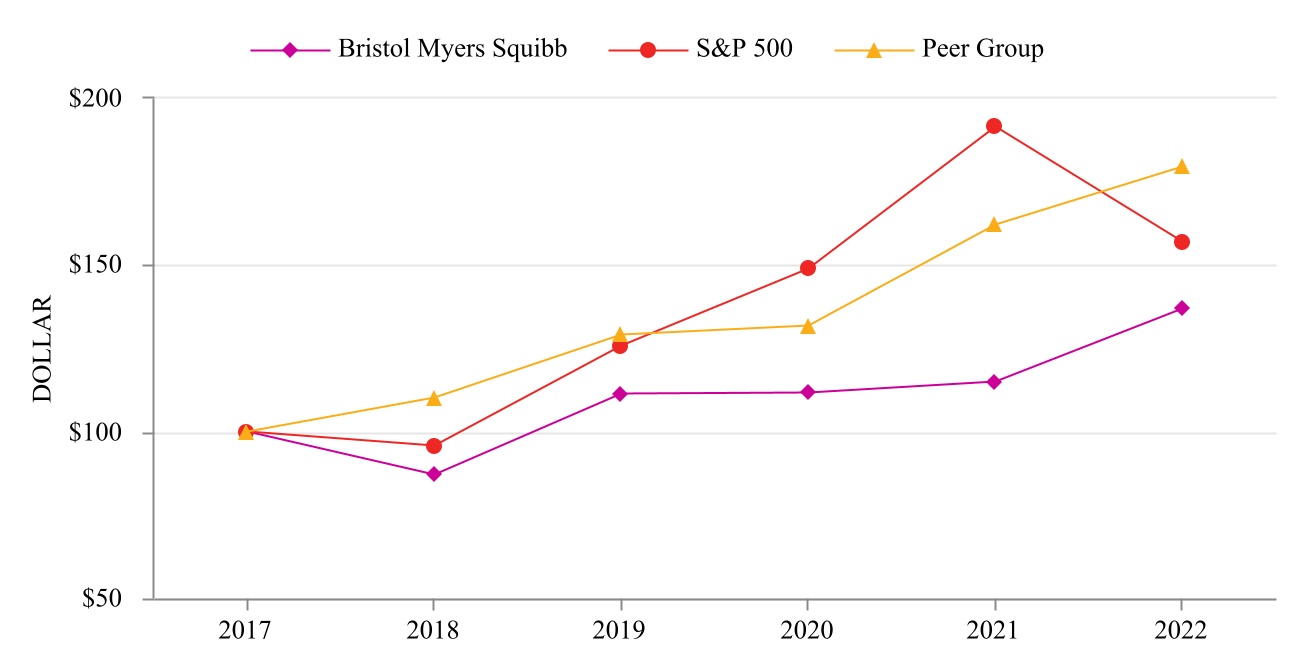
The following graph compares the cumulative total stockholders’ returns of our common shares with the cumulative total stockholders’ returns of the companies listed in the Standard & Poor’s 500 Index ("S&P 500 Index") and a composite peer group of major pharmaceutical companies comprised of AbbVie, Amgen, AstraZeneca, Biogen, Gilead, GlaxoSmithKline, Johnson & Johnson, Lilly, Merck, Novartis, Pfizer, Roche and Sanofi. The graph assumes $100 investment on December 31, 2017 in each of our common shares, the S&P 500 Index and the stock of our peer group companies, including reinvestment of dividends, for the years ended December 31, 2018, 2019, 2020, 2021 and 2022. The stock price performance on the following graph is not necessarily indicative of future stock price performance.
| 2017 | 2018 | 2019 | 2020 | 2021 | 2022 | ||||||||||||||||||||||||||||||
| Bristol Myers Squibb | $ | 100.00 | $ | 87.10 | $ | 111.27 | $ | 111.72 | $ | 114.94 | $ | 136.75 | |||||||||||||||||||||||
| S&P 500 | 100.00 | 95.62 | 125.72 | 148.85 | 191.58 | 156.88 | |||||||||||||||||||||||||||||
| Peer Group | 100.00 | 110.03 | 129.02 | 131.63 | 162.01 | 179.43 |
Issuer Purchases of Equity Securities
The following table summarizes the surrenders of our equity securities during the three months ended December 31, 2022:
| Period | Total Number of Shares Purchased**(a)** | Average Price Paid per Share**(a)** | Total Number of Shares Purchased as Part of Publicly Announced Programs**(b)** | Approximate Dollar Value of Shares that May Yet Be Purchased Under the Programs**(b)** | |||||||||||||||||||
| Dollars in Millions, Except Per Share Data | |||||||||||||||||||||||
| October 1 to 31, 2022 | 11,337,688 | $ | 70.51 | 11,329,164 | $ | 8,669 | |||||||||||||||||
| November 1 to 30, 2022 | 13,988,212 | 78.23 | 13,963,667 | 7,577 | |||||||||||||||||||
| December 1 to 31, 2022 | 5,150,025 | 79.98 | 5,095,948 | 7,169 | |||||||||||||||||||
| Three months ended December 31, 2022 | 30,475,925 | 30,388,779 |
(a) Includes shares repurchased as part of publicly announced programs and shares of common stock surrendered to the Company to satisfy tax withholding obligations in connection with the vesting of awards under our long-term incentive program.
(b) In May 2010, the Board of Directors authorized the repurchase of up to $3.0 billion of our common stock. Following this authorization, the Board subsequently approved additional authorizations, including most recently, in February 2020, January 2021 and December 2021, in the amount $5.0 billion, $2.0 billion and $15.0 billion, respectively, to the share repurchase authorization. The remaining share repurchase capacity under the program was approximately $7.2 billion as of December 31, 2022. Refer to “Item 1. Financial Statements—Note 17. Equity” for information on the share repurchase program.
Previous: Item 4. MINE SAFETY DISCLOSURES. · Next: Item 6. [RESERVED]