 filings.tools
Item 5. Market for Registrant’s Common Equity, Related Security Holder Matters and Issuer Purchases of Equity Securities
4K characters. Original on sec.gov · Markdown
Item 5. Market for Registrant’s Common Equity, Related Security Holder Matters and Issuer Purchases of Equity Securities
| --- | --- |
Market Information
Berkshire’s Class A and Class B common stock are listed for trading on the New York Stock Exchange, trading symbol: BRK.A and BRK.B. The following table sets forth the high and low sales prices per share, as reported on the New York Stock Exchange Composite List during the periods indicated:
| 2017 | 2016 | |||||||||||||||||||||||||||||||
| Class A | Class B | Class A | Class B | |||||||||||||||||||||||||||||
| High | Low | High | Low | High | Low | High | Low | |||||||||||||||||||||||||
| First Quarter | $ | 266,445 | $ | 237,983 | $ | 177.86 | $ | 158.61 | $ | 215,130 | $ | 186,900 | $ | 143.40 | $ | 123.55 | ||||||||||||||||
| Second Quarter | 257,944 | 242,180 | 171.95 | 160.93 | 221,985 | 205,074 | 148.03 | 136.65 | ||||||||||||||||||||||||
| Third Quarter | 275,945 | 252,254 | 184.00 | 168.00 | 226,490 | 211,500 | 151.05 | 140.95 | ||||||||||||||||||||||||
| Fourth Quarter | 301,000 | 270,250 | 200.50 | 180.44 | 250,786 | 213,030 | 167.25 | 141.92 |
Shareholders
Berkshire had approximately 2,100 record holders of its Class A common stock and 19,800 record holders of its Class B common stock at February 12, 2018. Record owners included nominees holding at least 410,000 shares of Class A common stock and 1,339,000,000 shares of Class B common stock on behalf of beneficial-but-not-of-record owners.
Dividends
Berkshire has not declared a cash dividend since 1967.
Common Stock Repurchase Program
Berkshire’s Board of Directors has approved a common stock repurchase program permitting Berkshire to repurchase its Class A and Class B shares at prices no higher than a 20% premium over the book value of the shares. The program allows share repurchases in the open market or through privately negotiated transactions and does not specify a maximum number of shares to be repurchased. There were no share repurchases under the program in 2017.
Stock Performance Graph
The following chart compares the subsequent value of $100 invested in Berkshire common stock on December 31, 2012 with a similar investment in the Standard & Poor’s 500 Stock Index and in the Standard & Poor’s Property – Casualty Insurance Index.**
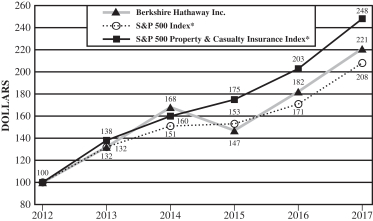
| * | Cumulative return for the Standard & Poor’s indices based on reinvestment of dividends. |
|---|
| ** | It would be difficult to develop a peer group of companies similar to Berkshire. The Corporation owns subsidiaries engaged in a number of diverse business activities of which the most important is the property and casualty insurance business and, accordingly, management has used the Standard & Poor’s Property—Casualty Insurance Index for comparative purposes. |
|---|
K-30
Table of Contents
Previous: Item 4. Mine Safety Disclosures · Next: Item 6. Selected Financial Data