 filings.tools
Brown & Brown (BRO) 10-K risk factor changes: FY2011 vs FY2010
The 2011-12-31 10-K against the 2010-12-31 one, compared heading by heading and sentence by sentence. One of these filings carries no fiscal year tag, so its year is the calendar year of the period end.
Item 1A0 rewritten0 added261 removed0 unchanged
All filing items327 rewritten1,883 added1,699 removed624 unchanged
Summary
counted, not written
- Item 1A headings could not be compared: the parser did not find an Item 1A in both filings.
- Sentence by sentence, 1,883 added, 1,699 removed, 327 rewritten and 624 unchanged across 21 items that differ.
- Not in this year's filing: Item 1A. Risk Factors; Item 1. Business.; Item 3. Legal Proceedings.; Item 1B. Unresolved Staff Comments.; Item 2. Properties.; Item 8. Financial Statements and Supplementary Data..
Sentences by item
21 items, with every count and a link to each item that changed
Underlined words on a shaded ground are new in FY2011; struck-through words were in FY2010. Sentences that are wholly new or wholly gone are labelled rather than marked.
Item 1A. Risk Factors
0 rewritten, 0 added, 261 removed, 0 unchanged
Dropped this year
| --- | --- |
WE CANNOT ACCURATELY FORECAST OUR COMMISSION REVENUES BECAUSE OUR COMMISSIONS DEPEND ON PREMIUM RATES CHARGED BY INSURANCE COMPANIES, WHICH HISTORICALLY HAVE VARIED AND, AS A RESULT, HAVE BEEN DIFFICULT TO PREDICT.
We are primarily engaged in the insurance agency, wholesale brokerage, and insurance programs business, and derive revenues principally from commissions paid by insurance companies.
Commissions are based upon a percentage of premiums paid by customers for insurance products.
The amount of such commissions is therefore highly dependent on premium rates charged by insurance companies.
We do not determine insurance premiums.
Premium rates are determined by insurance companies based on a fluctuating market.
Historically, property and casualty premiums have been cyclical in nature and have varied widely based on market conditions.
As traditional risk-bearing insurance companies continue to outsource the production of premium revenue to non-affiliated brokers or agents such as us, those insurance companies may seek to further reduce their expenses by reducing the commission rates payable to those insurance agents or brokers.
The reduction of these commission rates, along with general volatility and/or declines in premiums, may significantly affect our profitability.
Because we do not determine the timing or extent of premium pricing changes, we cannot accurately forecast our commission revenues, including whether they will significantly decline.
As a result, we may have to adjust our budgets for future acquisitions, capital expenditures, dividend payments, loan repayments and other expenditures to account for unexpected changes in revenues, and any decreases in premium rates may adversely affect the results of our operations.
CURRENT U.S. ECONOMIC CONDITIONS AND THE SHIFT AWAY FROM TRADITIONAL INSURANCE MARKETS MAY CONTINUE TO ADVERSLY AFFECT OUR BUSINESS.
Since late 2007, global consumer confidence has eroded amidst concerns over declining asset values, potential inflation, volatility in energy costs, geopolitical issues, the availability and cost of credit, high unemployment, and the stability and solvency of financial institutions, financial markets, businesses, and sovereign nations.
These concerns have slowed economic growth and resulted in a recession in the United States.
Economic conditions have had a negative impact on our results of operations during the years since 2008 due to reduced customer demand.
If these economic conditions continue or worsen, a number of negative effects on our business could result, including further declines in values of insurable exposure units, further declines in insurance premium rates, and the financial insolvency, or reduced ability to pay, of certain of our customers.
Any of these effects could decrease our net revenue and profitability.
In addition, there has been an increase in alternative insurance markets, such as self-insurance, captives, risk retention groups and non-insurance capital markets.
While we compete in these segments on a fee-for-service basis, we cannot be certain that such alternative markets will provide the same level of profitability as traditional insurance markets.
WE COULD INCUR SUBSTANTIAL LOSSES FROM OUR CASH AND INVESTMENT ACCOUNTS IF ONE OF THE FINANCIAL INSTITUTIONS THAT WE USE FAILS OR IS TAKEN OVER BY THE U.S. FEDERAL DEPOSIT INSURANCE CORPORATION (“FDIC”).
Traditionally, we have maintained cash and investment balances, including restricted cash held in premium trust accounts, at various depository institutions in amounts that are significantly in excess of the limits insured by the FDIC.
While we began in the Fall of 2008 re-focusing our investment and cash management strategy by moving more of our cash into non-interest bearing accounts (which are FDIC-insured until December 31, 2012, but not subject to any limits) and money market accounts (a portion of which became FDIC insured in the Fall of 2008), we still maintain cash and investment balances in excess of the limits insured by FDIC.
As the credit crisis persists, the financial strength of some depository institutions has diminished and this trend may continue.
If one or more of the depository institutions with which we maintain significant cash balances were to fail, our ability to access these funds might be temporarily or permanently limited, and we could face material liquidity problems and potential material financial losses.
##### [Table of Contents](#toc)
OUR BUSINESS, AND THEREFORE OUR RESULTS OF OPERATIONS AND FINANCIAL CONDITION, MAY BE ADVERSELY AFFECTED BY THE FURTHER DISRUPTION IN THE U.S.-BASED CREDIT MARKETS AND BY FURTHER INSTABILITY OF FINANCIAL SYSTEMS.
The disruption in the U.S.-based credit markets, the repricing of credit risk and the deterioration of the financial and real estate markets over the past few years have created increasingly difficult conditions for financial institutions and certain insurance companies.
These conditions include significant losses, greater volatility, significantly less liquidity, widening of credit spreads and a lack of price transparency in certain markets.
While these conditions have somewhat abated since the Fall of 2008, it is difficult to predict when these conditions will completely end and the extent to which our markets, products and business will be adversely affected.
The unprecedented disruptions in the credit and financial markets had a significant material adverse impact on a number of financial institutions and limited access to capital and credit for many companies.
Although we are not currently experiencing any limitation of access to our revolving credit facility (which matures in 2013) and are not aware of any issues impacting the ability or willingness of our lenders under such facility to honor their commitments to extend us credit, the failure of a lender could adversely affect our ability to borrow on that facility, which over time could negatively impact our ability to consummate significant acquisitions or make other significant capital expenditures.
Continued adverse conditions in the credit markets in future years could adversely affect the availability and terms of future borrowings or renewals or refinancings.
We also have a significant amount of trade accounts receivable from some insurance companies with which we place insurance.
If those insurance companies were to experience liquidity problems or other financial difficulties, we could encounter delays or defaults in payments owed to us, which could have a significant adverse impact on our financial condition and results of operations.
OUR BUSINESS, AND THEREFORE OUR RESULTS OF OPERATIONS AND FINANCIAL CONDITION, MAY BE ADVERSELY AFFECTED BY ECONOMIC CONDITIONS THAT RESULT IN REDUCED INSURER CAPACITY.
Our results of operations depend on the continued capacity of insurance carriers to underwrite risk and provide coverage, which depends in turn on insurance companies’ ability to procure reinsurance.
We have no control over these matters.
To the extent that reinsurance becomes less widely available, we may not be able to procure the amount or types of coverage that our customers desire and the coverage we are able to procure may be more expensive or limited.
INFLATION MAY ADVERSELY AFFECT OUR BUSINESS OPERATIONS IN THE FUTURE.
An excerpt. Shown here: all 0 rewritten, all 0 added and 40 of 261 removed. The counts are complete. For every sentence, read Item 1A. Risk Factors in the FY2010 filing.
Item 7. Management’s Discussion and Analysis of Financial Condition and Results of Operations.
218 rewritten, 154 added, 95 removed, 291 unchanged
As an insurance intermediary, our principal sources of [removed: revenue] [added: revenues] are commissions paid by insurance companies and, to a lesser extent, fees paid directly by customers.
As of January [removed: 2011,] [added: 2012,] our senior leadership group included eight executive officers with regional responsibility for oversight of designated operations within the [removed: Company.][added: Company and four regional vice presidents in our Retail Division that report directly to one of our executive officers.]
In 2009, our [removed: revenue] [added: revenues] dropped to $967.9 million, then increased 0.6% to $973.5 million [added: and 4.1% to $1.014 billion] in [removed: 2010.][added: 2010 and 2011, respectively.]
Our revenues grew from $95.6 million in 1993 to [removed: $973.5 million] [added: $1.014 billion] in [removed: 2010,] [added: 2011,] reflecting a compound annual growth rate of [removed: 14.6%.][added: 14.0%.]
In the same period, we increased net income from $8.0 million to [removed: $161.8] [added: $164.0] million in [removed: 2010,] [added: 2011,] a compound annual growth rate of [removed: 19.3%.][added: 18.3%.]
The past [removed: four] [added: five] years have posed significant challenges for us and for our industry in the form of a prevailing decline in insurance premium rates, commonly referred to as a “soft market;” increased significant governmental involvement in the Florida insurance marketplace since 2007, resulting in a substantial loss of [removed: revenue] [added: revenues] for us; and, beginning in the second half of 2008 and throughout [removed: 2010,] [added: 2011,] increased pressure on the values of insurable exposure units as the consequence of the general weakening of the economy in the United States.
[removed: Beginning in] [added: From] the first quarter of 2007 through the fourth quarter of [removed: 2010] [added: 2011] we experienced negative internal revenue growth each quarter.
This was due primarily to the “soft market,” and, beginning in the second half of 2008 and throughout [removed: 2010,] [added: 2011,] the decline in insurable exposure units, which further reduced our commissions and fees revenue.
We [removed: have] [added: had] a wholesale brokerage operation that [removed: focuses] [added: focused] on placing property and casualty insurance products for that home-building segment.
While insurance premium rates continued to decline for most lines of coverage during [removed: 2010,] [added: 2011,] the rate of decline [removed: appeared to be slowing.][added: slowed, and in some cases increased for certain lines of coverages such as coastal property.]
In [removed: 2009] [added: 2010] and [removed: 2010,] [added: 2011,] continued declining exposure units had a greater negative impact on our commissions and fees [removed: revenue] [added: revenues] than declining insurance premium rates.
Over the last three years, profit-sharing contingent commissions have averaged approximately [removed: 5.6%] [added: 5.0%] of the previous year’s total commissions and fees revenue.
For the twelve-month periods ended December 31, [removed: 2009] [added: 2010] and [removed: 2008,] [added: 2009,] we earned [removed: $15.9] [added: $13.4] million and [removed: $13.4] [added: $15.9] million, respectively, from GSCs.
Fee revenues, as a percentage of our total commissions and fees, represented [removed: 14.6%] [added: 16.4%] in [removed: 2010, 13.3%] [added: 2011, 14.6%] in [removed: 2009] [added: 2010] and [removed: 13.7%] [added: 13.3%] in [removed: 2008.][added: 2009.]
[removed: It] [added: Citizens raised its insurance rates again in 2011 and] is expected [removed: that Citizens will] [added: to] continue to increase its insurance rates [removed: during 2011 and, as a result, the impact of Citizens should continue to lessen] in [removed: 2011.][added: 2012.]
In 2007, Citizens became the principal direct competitor of the insurance companies that underwrite the condominium program administered by one of our indirect subsidiaries, Florida Intracoastal Underwriters, Limited Company (“FIU”), and the excess and surplus lines insurers represented by [removed: our] wholesale brokers such as Hull & Company, Inc., another of our subsidiaries.
Consequently, these operations lost significant amounts of [removed: revenue] [added: revenues] to Citizens.
From 2008 through [removed: 2010,] [added: 2011,] Citizens’ impact was not as dramatic as it had been in 2007; FIU’s core [removed: revenues] [added: commissions and fees] decreased [removed: 9.2% in] [added: 16.8% during] this [added: 2008 to 2011] period.
Citizens continued to be competitive against the excess and surplus lines insurers, and therefore Citizens negatively affected the revenues of our Florida-based wholesale brokerage operations, such as Hull & Company, Inc., from 2007 through [removed: 2010,] [added: 2011,] although the impact [removed: is] [added: has been] decreasing [removed: from year to] [added: each] year.
Citizens’ impact on our Florida Retail Division was less severe than on our National Programs and Wholesale Brokerage [removed: Divisions,] [added: Divisions] because our retail offices have the ability to place business with Citizens, although at slightly lower commission rates and with greater difficulty than is the case with other insurance companies.
For the [removed: fourth] [added: fifth] consecutive year, we experienced negative internal growth of our commissions and fees revenue as a direct result of the general weakness of the economy since the second half of 2008 and the continuing “soft market.” Our [removed: total] [added: core organic] commissions and fees revenue [removed: excluding] [added: which excludes] the effect of recent acquisitions, profit-sharing contingencies and sales of books of business over the last twelve [removed: months reflected] [added: months, reflects] a negative internal growth rate of [removed: (4.7)%.][added: (2.6)%, or $23.3 million of net lost revenues.]
[removed: However, including] [added: In fact, total revenues in 2011 increased 4.1% over 2010 due to] the revenues from new [removed: acquisitions, increased profit-sharing contingencies,] [added: acquisitions] and the increase in other [removed: income, total revenues in 2010 increased 0.6% over 2009.][added: income.]
Income before income taxes in [removed: 2010] [added: 2011] increased over [removed: 2009] [added: 2010] by [removed: 4.5%,] [added: 1.7%,] or [removed: $11.3] [added: $4.4] million, to [removed: $266.1] [added: $270.5] million.
From 1993 through [removed: 2010,] [added: 2011,] we acquired [removed: 367] [added: 420] insurance intermediary operations, [removed: including] [added: excluding] acquired books of business (customer accounts).
The economic outlook in [added: 2011 and] 2010 improved slightly over 2009 and as a result, certain sellers viewed [added: 2011 and] 2010 as a better time in which to join our organization, and consequently, we were able to close a greater number of acquisitions.
| | | Number of Acquisitions | | | | | | | | [removed: Estimated Annual Revenues] [added: Estimated Annual] | | | | Net [removed: Cash Paid] [added: Cash] | | | | [removed: Notes Issued] [added: Notes] | | | | [removed: Liabilities Assumed] [added: Liabilities] | | | | Recorded [removed: Earn-out Payable] [added: Earn-out] | | | | [removed: Aggregate Purchase Price] [added: Aggregate Purchase] | | |
RESULTS OF OPERATIONS FOR THE YEARS ENDED DECEMBER 31, [removed: 2010, 2009] [added: 2011, 2010] AND [removed: 2008][added: 2009]
| | | [removed: 2010] [added: 2011] | | | | [removed: Percent Change] [added: Percent Change] | | | | [removed: 2009] [added: 2010] | | | | [removed: Percent Change] [added: Percent Change] | | | | [removed: 2008] [added: 2009] | | |
| Core commissions and fees | | $ | [removed: 912,185] [added: 962,764] | | | | [removed: (0.5] [added: 5.5] | [removed: )%] [added: %] | | $ | [removed: 917,226] [added: 912,185] | | | | [removed: 0.8] [added: (0.5] | [removed: %] [added: )%] | | $ | [removed: 909,564] [added: 917,226] | |
| Profit-sharing contingent commissions | | | [removed: 54,732] [added: 43,198] | | | | [removed: 14.9] [added: (21.1] | [removed: %] [added: )%] | | | [removed: 47,637] [added: 54,732] | | | | [removed: (15.6] [added: 14.9] | [removed: )%] [added: %] | | | [removed: 56,419] [added: 47,637] | |
| Investment income | | | [removed: 1,326] [added: 1,267] | | | | [removed: 14.2] [added: (4.4] | [removed: %] [added: )%] | | | [removed: 1,161] [added: 1,326] | | | | [removed: (80.9] [added: 14.2] | [removed: )%] [added: %] | | | [removed: 6,079] [added: 1,161] | |
| Other income, net | | | [removed: 5,249] [added: 6,313] | | | | [removed: 183.3] [added: 20.3] | % | | | [removed: 1,853] [added: 5,249] | | | | [removed: (66.3] [added: 183.3] | [removed: )%] [added: %] | | | [removed: 5,492] [added: 1,853] | |
| Total revenues | | | [removed: 973,492] [added: 1,013,542] | | | | [removed: 0.6] [added: 4.1] | % | | | [removed: 967,877] [added: 973,492] | | | | [removed: (1.0] [added: 0.6] | [removed: )%] [added: %] | | | [removed: 977,554] [added: 967,877] | |
| Employee compensation and benefits | | | [removed: 487,820] [added: 508,675] | | | | [removed: 0.6] [added: 4.3] | % | | | [removed: 484,680] [added: 487,820] | | | | [removed: (0.2] [added: 0.6] | [removed: )%] [added: %] | | | [removed: 485,783] [added: 484,680] | |
| Non-cash stock-based compensation | | | [removed: 6,845] [added: 11,194] | | | | [removed: (7.0] [added: 63.5] | [removed: )%] [added: %] | | | [removed: 7,358] [added: 6,845] | | | | [removed: 0.6] [added: (7.0] | [removed: %] [added: )%] | | | [removed: 7,314] [added: 7,358] | |
| Other operating expenses | | | [removed: 135,851] [added: 144,079] | | | | [removed: (5.3] [added: 6.1] | [removed: )%] [added: %] | | | [removed: 143,389] [added: 135,851] | | | | [removed: 4.4] [added: (5.3] | [removed: %] [added: )%] | | | [removed: 137,352] [added: 143,389] | |
| Amortization | | | [removed: 51,442] [added: 54,755] | | | | [removed: 3.2] [added: 6.4] | % | | | [removed: 49,857] [added: 51,442] | | | | [removed: 6.9] [added: 3.2] | % | | | [removed: 46,631] [added: 49,857] | |
| Depreciation | | | [removed: 12,639] [added: 12,392] | | | | [removed: (4.5] [added: (2.0] | )% | | | [removed: 13,240] [added: 12,639] | | | | [removed: (0.3] [added: (4.5] | )% | | | [removed: 13,286] [added: 13,240] | |
| Interest | | | [removed: 14,471] [added: 14,132] | | | | [removed: (0.9] [added: (2.3] | )% | | | [removed: 14,599] [added: 14,471] | | | | [removed: (0.6] [added: (0.9] | )% | | | [removed: 14,690] [added: 14,599] | |
| Change in estimated acquisition earn-out payables | | | [removed: (1,674] [added: (2,206] | ) | | | [removed: —] [added: 31.8] | % | | | [removed: —] [added: (1,674] | [added: )] | | | — | % | | | — | |
In February 2011, Anthony M.
Grippa, Thomas Keith Huval and Richard A.
Knudson, Jr. were promoted to be Regional Vice Presidents.
In April 2011, Nick Dereszynski was also promoted to be a Regional Vice President.
Additionally, in January, 2012, Anthony Strianese was promoted to be a Regional President, and Chris L.
Walker was promoted to be a Regional Executive Vice President.
For the first time in the last five years, we are observing some upward pressure on general insurance premium rates.
For 2012, we believe that there may be a modest and gradual increase in many insurance premium rates.
Although we do not anticipate any significant increases in exposure units during 2012, we believe that the 2012 decline will be less than recent years and this lack of decline may enable us to begin to experience positive internal growth of our commissions and fees revenue at some point in 2012.
Even though our negative internal growth of our commissions and fees revenue improved over each sequential quarter for the third and fourth quarters of 2011, we do not believe that trend will necessarily continue in the first half of 2012 due to persisting inconsistencies in the insurance premium rate environment.
Core organic commissions and fees attempts to express the current year’s core commissions and fees on a comparable basis with the prior year’s core commissions and fees.
The resulting net change reflects the aggregate changes from (i) net new and lost accounts, (ii) net changes in our clients’ exposure units, and (iii) net changes in insurance premium rates.
The net changes in each of these three components can be determined for each of our customers.
However, because our agency management accounting systems do not aggregate such data, it is not reportable.
Core organic commissions and fees can reflect either “positive” growth with a net increase in revenues, or “negative” with a net decrease in revenues.
As of December 31, 2011, we accrued and earned $12.1 million from GSCs during 2011, most of which will be collected in the first quarter of 2012.
Our commission revenues from Citizens for 2011, 2010 and 2009 were approximately $7.8 million, $8.3 million, and $8.7 million, respectively.
If, as expected, Citizens continues to attempt to reduce its insured exposures, the financial impact of Citizens on our business should continue to be reduced in 2012.
The net lost revenues of $23.3 million is a significant improvement from the comparable net lost revenues of $42.7 million and $46.5 million in 2010 and 2009, respectively.
This improvement is principally attributable to the slowing of the rates of decline in both exposure units and insurance premium rates.
Even though we continue to experience negative growth in our core organic commissions and fees, we have succeeded in acquiring insurance operations that we believe are incrementally higher quality in each of the last three years.
We completed 38 acquisitions in 2011, which represents an increase over the 33 and 11 acquisitions made in 2010 and 2009, respectively.
The estimated annualized revenues from the 2011 acquisitions were $88.7 million, which is up from the $70.6 million and $26.5 million that we acquired in 2010 and 2009, respectively.
The trend of increased acquisitions over the last three years continues into 2012 with our acquisition of Arrowhead, which is a national insurance program manager and one of the largest managing general agents (“MGA”) in the property and casualty insurance industry with estimated 2011 revenues of approximately $107.5 million.
However, that net increase of $4.4 million includes $14.4 million of income before income taxes related to new acquisitions that were stand-alone offices, and therefore, income before income taxes from those offices that existed in same time periods of 2011 and 2010 (including the new acquisitions that “folded in” to those offices) decreased by only $9.9 million.
This net decrease of $9.9 million reflects $16.8 million of reduced total revenues but offset by $6.9 million of continued cost savings and broad-based operational efficiencies.
Additionally, $4.2 million of the net $9.9 million decrease in income before income taxes from those offices that existed in same periods of 2011 and 2010, was due to the increased non-cash stock-based compensation which related to new grants under our Stock Incentive Plan (“SIP”) that will vest in six to ten years, subject to grantees achievement of certain performance criteria, and the achievement of consolidated EPS growth at certain levels by us, over a five-year measurement period ending December 31, 2015.
| | | Asset | | | | Stock | | | | Revenues | | | | Paid | | | | Issued | | | | Assumed | | | | Payable | | | | Price | | |
| 2011 | | | 37 | | | | 1 | | | $ | 88.7 | | | $ | 167.4 | | | $ | 1.2 | | | $ | 15.7 | | | $ | 30.5 | | | $ | 214.8 | |
On January 9, 2012, we completed the acquisition of Arrowhead pursuant to a merger agreement dated December 15, 2011 (the “Merger Agreement”).
Under the Merger Agreement, the total cash purchase price of $395.0 million is subject to adjustments for options to purchase shares of Arrowhead’s common stock, working capital, sharing of net operating tax losses, Arrowhead’s preferred stock units, transaction expenses, and closing debt.
In addition, within 60 days following the third anniversary of the acquisition’s closing date, we will pay to certain persons who were Arrowhead equityholders as of the closing date additional earn-out payments equal, collectively, to $5.0 million, subject to certain adjustments based on the “cumulative EBITDA” of Arrowhead and all of its subsidiaries, as calculated under the Merger Agreement, during the final year of the three-year period following the acquisition’s closing date.
Arrowhead is a national insurance program manager and one of the largest managing general agents (“MGAs”) in the property and casualty insurance industry.
We completed our most recent evaluation of impairment for goodwill as of November 30, 2011 and determined that the fair value of goodwill and amortizable intangible assets substantially exceeds the carrying value of such assets.
Profit-sharing contingent commissions decreased $11.5 million to $43.2 million in 2011, with the decrease primarily due to reductions in amounts paid to offices in our National Programs and Wholesale Brokerage Divisions.
The remaining $0.3 million of net lost core commissions and fees revenue related to $2.7 million reduction in our National Programs Division, which was partially offset by $1.9 million growth in our Wholesale Brokerage Division and $0.6 million growth in our Services Division.
The declines in profit-sharing contingent commissions and core organic commissions and fees during 2011 were more than offset by the addition of $78.2 million of core commission and fee revenues from acquired operations.
In 2010, commissions and fees revenue, including profit-sharing contingent commissions, increased 0.2%, or $2.1 million over 2009.
The declines in core organic commissions and fees during 2010 were nearly offset by the addition of $39.2 million of core commission and fee revenues from acquired operations.
Investment income of $1.3 million in 2011 was effectively flat as compared with 2010.
| --- | --- |
In July 2010, J.
Scott Penny was promoted to the position of Regional President, and in January 2011, he was named Chief Acquisitions Officer.
Also in January, 2011, Linda S.
Downs and Charles H.
Lydecker were promoted to be Regional Presidents As previously announced, Jim W.
Henderson, Vice Chairman and Chief Operating Officer, retired from the Company in August 2010, and Kenneth D.
Kirk, Regional President, and Thomas E.
Riley, Regional President and Chief Acquisitions Officer, ceased employment with the Company in January 2011.
Although we do not anticipate any significant changes to the insurance premium rates during 2011, there appears to be a very gradual improvement in the rate of decline of exposure units which we expect will continue into 2011.
As of December 31, 2010, we earned $13.4 million from GSCs during 2010.
Most of this total will not be collected until the first quarter of 2011.
Of the $11.3 million increase, $5.6 million related to increased revenues with the remaining increase attributable to improved cost efficiencies, primarily in the area of rent expense and legal costs.
| | | Asset | | | | Stock | | | | | | | | | | | | | | | | | | | | | | | | | | |
| 2008 | | | 43 | | | | 2 | | | $ | 120.2 | | | $ | 255.8 | | | $ | 8.3 | | | $ | 14.6 | | | $ | — | | | $ | 278.7 | |
| | | | | | | | | | | | | | | | | | | | | |
The decrease in our non-Florida retail and wholesale brokerage operations in 2009 was $35.1 million, but that was substantially offset by Proctor’s strong revenue growth of $13.4 million.
Other income consists primarily of gains and losses from the sale and disposition of assets.
The increase in the percentage in 2009 from 2008 was the result of the continued reduction of compensation expense due to headcount reductions.
We estimate that the incremental cost of these new SIP grants in 2011 will be approximately $5.1 million.
Of the $1.4 million increase, $3.0 million resulted from additional legal fees, but those costs were partially offset by broad-based reductions relating to travel and entertainment expenses, supplies, and postage and delivery expenses.
Amortization expense increased $1.6 million, or 3.2%, in 2010, $3.2 million, or 6.9%, in 2009, and $6.2 million, or 15.3%, in 2008.
Depreciation decreased (4.5)% in 2010 and (0.3)% in 2009 but increased 4.1% in 2008.
The decreases in 2010 and 2009 were primarily due to reduced acquisition activity.
The increase in 2008 was primarily due to the purchase of new computers, related equipment and software, corporate aircraft and the depreciation of fixed assets associated with acquisitions completed that year.
Interest expense increased $0.9 million, or 6.4%, in 2008 over 2007 primarily as a result of the additional $25.0 million that was borrowed in February 2008.
For acquisitions consummated after January 1, 2009, $32.3 million was initially recorded as estimated acquisition earn-out payables.
During 2010, the fair value of the estimated acquisition earn-out payables was re-evaluated on a quarterly basis and reduced, in aggregate, by $1.7 million, which resulted in a credit to the Consolidated Statement of Income.
Additionally, the interest expense accretion to the Consolidated Statement of Income for 2010 and 2009 was $0.9 million and $0.1 million, respectively.
The higher effective annual tax rate in 2009 compared with 2008 was primarily the result of reduced benefits from tax-exempt interest income, and increased amounts of business conducted in states having higher state tax rates.
Total core commissions and fees are our total commissions and fees less (i) profit-sharing contingent commissions (revenue derived from special revenue-sharing commissions from insurance companies based upon the volume and the growth and/or profitability of the business placed with such companies during the prior year), and (ii) divested business (commissions and fees generated from offices, books of business or niches sold by the Company or terminated).
| | | | | | | | | | | | | | | | | | | | | | | | | | | | | |
| Florida Retail | | $ | 151,113 | | | $ | 155,928 | | | $ | (4,815 | ) | | | (3.1 | )% | | $ | 1,509 | | | $ | (6,324 | ) | | | (4.1 | )% |
| National Retail | | | 314,330 | | | | 308,461 | | | | 5,869 | | | | 1.9 | % | | | 15,895 | | | | (10,026 | ) | | | (3.3 | )% |
| Western Retail | | | 93,876 | | | | 98,249 | | | | (4,373 | ) | | | (4.5 | )% | | | 6,200 | | | | (10,573 | ) | | | (10.8 | )% |
| Professional Programs | | | 41,686 | | | | 44,588 | | | | (2,902 | ) | | | (6.5 | )% | | | — | | | | (2,902 | ) | | | (6.5 | )% |
| Special Programs | | | 124,089 | | | | 133,704 | | | | (9,615 | ) | | | (7.2 | )% | | | 740 | | | | (10,355 | ) | | | (7.7 | )% |
| | | | | | | | | |
| Florida Retail | | $ | 155,817 | | | $ | 167,508 | | | $ | (11,691 | ) | | | (7.0 | )% | | $ | 6,203 | | | $ | (17,894 | ) | | | (10.7 | )% |
| National Retail | | | 309,386 | | | | 293,748 | | | | 15,638 | | | | 5.3 | % | | | 32,713 | | | | (17,075 | ) | | | (5.8 | )% |
An excerpt. Shown here: 40 of 218 rewritten, 40 of 154 added and 40 of 95 removed. The counts are complete. For every sentence, read Item 7. Management’s Discussion and Analysis of Financial Condition and Results of Operations. in the FY2011 filing and the FY2010 filing.
Item 7A. Quantitative and Qualitative Disclosures About Market Risk.
2 rewritten, 1,176 added, 0 removed, 7 unchanged
Our invested assets are held as cash and cash equivalents, restricted cash and investments, available-for-sale [removed: marketable] equity securities, [removed: non-marketable] equity securities and certificates of deposit.
The fair values of our cash and cash equivalents, restricted cash and investments, and certificates of deposit at December 31, [removed: 2010] [added: 2011] and [removed: 2009] [added: 2010] approximated their respective carrying values due to their short-term duration and, therefore, such market risk is not considered to be material.
| ITEM | 8. Financial Statements and Supplementary Data. |
| --- | --- |
Index to Consolidated Financial Statements
| | | | | |
| --- | --- | --- | --- | --- |
| | | Page No. | | |
| [Consolidated Statements of Income for the years ended December 31, 2011, 2010 and 2009](#tx233092_27) | | | 42 | |
| [Consolidated Balance Sheets as of December 31, 2011 and 2010](#tx233092_28) | | | 43 | |
| [Consolidated Statements of Shareholders’ Equity for the years ended December 31, 2011, 2010 and 2009](#tx233092_29) | | | 44 | |
| [Consolidated Statements of Cash Flows for the years ended December 31, 2011, 2010 and 2009](#tx233092_30) | | | 45 | |
| [Notes to Consolidated Financial Statements for the years ended December 31, 2011, 2010 and 2009](#tx233092_31) | | | 46 | |
| [Note 1: Summary of Significant Accounting Policies](#tx233092_32) | | | 46 | |
| [Note 2: Business Combinations](#tx233092_33) | | | 49 | |
| [Note 3: Goodwill](#tx233092_34) | | | 53 | |
| [Note 4: Amortizable Intangible Assets](#tx233092_35) | | | 53 | |
| [Note 5: Investments](#tx233092_36) | | | 54 | |
| [Note 6: Fixed Assets](#tx233092_37) | | | 54 | |
| [Note 7: Accrued Expenses and Other Liabilities](#tx233092_38) | | | 54 | |
| [Note 8: Long-Term Debt](#tx233092_39) | | | 55 | |
| [Note 9: Income Taxes](#tx233092_40) | | | 56 | |
| [Note 10: Employee Savings Plan](#tx233092_41) | | | 58 | |
| [Note 11: Stock-Based Compensation](#tx233092_42) | | | 58 | |
| [Note 12: Supplemental Disclosures of Cash Flow Information](#tx233092_43) | | | 61 | |
| [Note 13: Commitments and Contingencies](#tx233092_44) | | | 62 | |
| [Note 14: Quarterly Operating Results (Unaudited)](#tx233092_45) | | | 63 | |
| [Note 15: Segment Information](#tx233092_46) | | | 63 | |
| [Note 16: Subsequent Events](#tx233092_47) | | | 64 | |
| | | | | |
| [Reports of Independent Registered Public Accounting Firm](#tx233092_48) | | | 66 | |
| [Management’s Report on Internal Control Over Financial Reporting](#tx233092_49) | | | 68 | |
##### [Table of Contents](#toc)
BROWN & BROWN, INC.
CONSOLIDATED STATEMENTS OF
INCOME
| | | | | | | | | | | | | |
| --- | --- | --- | --- | --- | --- | --- | --- | --- | --- | --- | --- | --- |
| | | Year Ended December 31, | | | | | | | | | | |
| _(in thousands, except per share data)_ | | 2011 | | | | 2010 | | | | 2009 | | |
| REVENUES | | | | | | | | | | | | |
| Commissions and fees | | $ | 1,005,962 | | | $ | 966,917 | | | $ | 964,863 | |
An excerpt. Shown here: all 2 rewritten, 40 of 1,176 added and all 0 removed. The counts are complete. For every sentence, read Item 7A. Quantitative and Qualitative Disclosures About Market Risk. in the FY2011 filing and the FY2010 filing.
Item 1. Business.
0 rewritten, 0 added, 195 removed, 0 unchanged
Dropped this year
| --- | --- |
General
We are a diversified insurance agency, wholesale brokerage, insurance programs and service organization with origins dating from 1939, headquartered in Daytona Beach and Tampa, Florida.
We market and sell to our customers insurance products and services, primarily in the property, casualty and employee benefits areas.
As an agent and broker, we do not assume underwriting risks.
Instead, we provide our customers with quality, non-investment insurance contracts, as well as other targeted, customized risk management products and services.
We are compensated for our services primarily by commissions paid by insurance companies and by fees paid by customers for certain services.
Commissions are usually a percentage of the premium paid by the insured.
Commission rates generally depend upon the type of insurance, the particular insurance company and the nature of the services provided by us.
In some cases, we share commissions with other agents or brokers who have acted jointly with us in a transaction.
We may also receive from an insurance company a “profit-sharing contingent commission,” which is a profit-sharing commission based primarily on underwriting results, but may also contain considerations for volume, growth and/or retention.
Fee revenues are generated primarily by: (1) our Services Division, which provides insurance-related services, including third-party claims administration and comprehensive medical utilization management services in both the workers’ compensation and all-lines liability arenas, as well as Medicare set-aside services and Social Security disability and Medicare benefits advocacy services, and (2) our National Programs and Wholesale Brokerage Divisions, which earn fees primarily for the issuing of insurance policies on behalf of insurance carriers.
The amount of our revenue from commissions and fees is a function of, among other factors, continued new business production, retention of existing customers, acquisitions and fluctuations in insurance premium rates and “insurable exposure units,” which are units that insurance companies use to measure or express insurance exposed to risk (such as property values, sales and payroll levels).
As of December 31, 2010, our activities were conducted in 205 locations in 37 states as follows and one office in London, England:
| | | | | | | | | | | | | | | | | |
| --- | --- | --- | --- | --- | --- | --- | --- | --- | --- | --- | --- | --- | --- | --- | --- | --- |
| Florida | | | 39 | | | Kentucky | | | 5 | | | New Hampshire | | | 2 | |
| New York | | | 15 | | | New Mexico | | | 5 | | | Oregon | | | 2 | |
| New Jersey | | | 13 | | | Oklahoma | | | 5 | | | Tennessee | | | 2 | |
| Texas | | | 13 | | | Virginia | | | 5 | | | Wisconsin | | | 2 | |
| California | | | 11 | | | Arkansas | | | 3 | | | Delaware | | | 1 | |
| Georgia | | | 8 | | | Michigan | | | 3 | | | Hawaii | | | 1 | |
| Indiana | | | 8 | | | Minnesota | | | 3 | | | Kansas | | | 1 | |
| Pennsylvania | | | 8 | | | North Carolina | | | 3 | | | Missouri | | | 1 | |
| Washington | | | 8 | | | South Carolina | | | 3 | | | Nebraska | | | 1 | |
| Louisiana | | | 7 | | | Arizona | | | 2 | | | Ohio | | | 1 | |
| Colorado | | | 6 | | | Massachusetts | | | 2 | | | West Virginia | | | 1 | |
| Illinois | | | 6 | | | Montana | | | 2 | | | | | | | |
| Connecticut | | | 5 | | | Nevada | | | 2 | | | | | | | |
Industry Overview
Premium pricing within the property and casualty insurance underwriting (risk-bearing) industry has historically been cyclical, displaying a high degree of volatility based on prevailing economic and competitive conditions.
From the mid-1980s through 1999, the property and casualty insurance industry experienced a “soft market” during which the underwriting capacity of insurance companies expanded, stimulating an increase in competition and a decrease in premium rates and related commissions.
The dampening effect of this softness in rates on our revenues was somewhat offset by our acquisitions and new business production.
As a result of increasing “loss ratios” (the comparison of incurred losses plus adjustment expenses against earned premiums) of insurance companies through 1999, premium rates generally increased beginning in the first quarter of 2000 and continuing into 2003.
During 2003, increases in premium rates began to moderate and, in certain lines of insurance, premium rates decreased.
In 2004, as general premium rates continued to moderate, the insurance industry experienced the worst hurricane season since 1992 (when Hurricane Andrew hit south Florida).
The insured losses from the 2004 hurricane season were absorbed relatively easily by the insurance industry and the general insurance premium rates continued to soften during 2005.
During the third quarter of 2005, the insurance industry experienced the worst hurricane season ever recorded.
As a result of the significant losses incurred by insurance companies from these hurricanes, insurance premium rates in 2006 increased on coastal property, primarily in the southeastern region of the United States.
In the other regions of the United States, insurance premium rates generally declined during 2006.
An excerpt. Shown here: all 0 rewritten, all 0 added and 40 of 195 removed. The counts are complete. For every sentence, read Item 1. Business. in the FY2010 filing.
Item 3. Legal Proceedings.
0 rewritten, 0 added, 2 removed, 0 unchanged
Dropped this year
| --- | --- |
See Note 13 to the Consolidated Financial Statements for information regarding our legal proceedings.
Cover and table of contents
32 rewritten, 498 added, 6 removed, 109 unchanged
For the fiscal year ended December 31, [removed: 2010][added: 2011]
| Florida | | [removed: ] [added: ] | | 59-0864469 |
Securities registered pursuant to Section 12(g) of the [removed: Act: None][added: Act:]
Indicate by check mark if disclosure of delinquent filers pursuant to Item 405 of Regulation S-K [added: (§ 232.405 of this chapter)] is not contained herein, and will not be contained, to the best of the registrant’s knowledge, in definitive proxy or information statements incorporated by reference in Part III of this Form 10-K or any amendment to this Form 10-K.
The aggregate market value of the voting [removed: Common Stock, $0.10 par value,] [added: common stock] held by non-affiliates of the registrant, computed by reference to the [removed: last reported] price at which the stock was last sold on June 30, [removed: 2010] [added: 2011] (the last business day of the registrant’s most recently completed second fiscal quarter) was [removed: $2,221,154,930.][added: $2,989,330,854.]
The number of outstanding shares of the registrant’s Common Stock, $0.10 par value, [removed: outstanding] as of February [removed: 22, 2011] [added: 20, 2012] was [removed: 142,557,243][added: 143,352,216]
Portions of Brown & Brown, Inc.’s Proxy Statement for the [removed: 2011] [added: 2012] Annual Meeting of Shareholders are incorporated by reference into Part III of this Report.
| Item 1. | | [removed: [Business](#tx134158_2)] [added: [Business](#tx233092_2)] | | | 4 | |
| [removed: Item 1A. | | [Risk Factors](#tx134158_3) | | | 9] [added: ITEM] | [added: 1A. Risk Factors] |
| Item 1B. | | [Unresolved Staff [removed: Comments](#tx134158_4)] [added: Comments](#tx233092_4)] | | | [removed: 18] [added: 17] | |
| Item 2. | | [removed: [Properties](#tx134158_5)] [added: [Properties](#tx233092_5)] | | | [removed: 18] [added: 17] | |
| Item 3. | | [Legal [removed: Proceedings](#tx134158_6)] [added: Proceedings](#tx233092_6)] | | | 18 | |
| Item 5. | | [Market for [removed: the] Registrant’s Common Equity, Related Stockholder Matters and Issuer Purchases of Equity [removed: Securities](#tx134158_9)] [added: Securities](#tx233092_9)] | | | [removed: 18] [added: 19] | |
| Item 6. | | [Selected Financial [removed: Data](#tx134158_10)] [added: Data](#tx233092_10)] | | | [removed: 21] [added: 22] | |
| Item 7. | | [Management’s Discussion and Analysis of Financial Condition and Results of [removed: Operations](#tx134158_11)] [added: Operations](#tx233092_11)] | | | [removed: 22] [added: 23] | |
| Item 7A. | | [Quantitative and Qualitative Disclosures about Market [removed: Risk](#tx134158_12)] [added: Risk](#tx233092_12)] | | | [removed: 39] [added: 40] | |
| Item 8. | | [Financial Statements and Supplementary [removed: Data](#tx134158_13)] [added: Data](#tx233092_13)] | | | [removed: 40] [added: 41] | |
| Item 9. | | [Changes in and Disagreements With Accountants on Accounting and Financial [removed: Disclosure](#tx134158_14)] [added: Disclosure](#tx233092_14)] | | | [removed: 66] [added: 69] | |
| Item 9A. | | [Controls and [removed: Procedures](#tx134158_15)] [added: Procedures](#tx233092_15)] | | | [removed: 66] [added: 69] | |
| Item 9B. | | [Other [removed: Information](#tx134158_16)] [added: Information](#tx233092_16)] | | | [removed: 67] [added: 70] | |
| [Part [removed: III](#tx134158_17)] [added: III](#tx233092_17)] | | | | | | |
| Item 10. | | [Directors, Executive Officers and Corporate [removed: Governance](#tx134158_18)] [added: Governance](#tx233092_18)] | | | [removed: 67] [added: 70] | |
| Item 11. | | [Executive [removed: Compensation](#tx134158_19)] [added: Compensation](#tx233092_19)] | | | [removed: 67] [added: 70] | |
| Item 12. | | [Security Ownership of Certain Beneficial Owners and Management and Related Stockholder [removed: Matters](#tx134158_20)] [added: Matters](#tx233092_20)] | | | [removed: 67] [added: 70] | |
| Item 13. | | [Certain Relationships and Related Transactions, and Director [removed: Independence](#tx134158_21)] [added: Independence](#tx233092_21)] | | | [removed: 67] [added: 70] | |
| Item 14. | | [Principal Accounting Fees and [removed: Services](#tx134158_22)] [added: Services](#tx233092_22)] | | | [removed: 67] [added: 70] | |
| Item 15. | | [removed: [Exhibits and] [added: [Exhibits,] Financial Statement [removed: Schedules](#tx134158_24)] [added: Schedules](#tx233092_24)] | | | [removed: 68] [added: 71] | |
| [Exhibit [removed: Index](#tx134158_26)] [added: Index](#tx233092_26)] | | | | | | |
| | • | | Projections of [removed: revenue,] [added: revenues,] income, losses, cash flows, capital expenditures; |
| | • | | The occurrence of adverse economic conditions, an adverse regulatory climate, or a disaster in California, Florida, Georgia, Indiana, Louisiana, [added: Massachusetts,] Michigan, New Jersey, New York, Pennsylvania, Texas and Washington, because a significant portion of business written by Brown & Brown is for customers located in these states; |
| | • | | Our ability to forecast liquidity needs through at least the end of [removed: 2011;] [added: 2012;] |
| | • | | The integration of our operations with those of businesses or assets we have [removed: acquired] [added: acquired, including our January 2012 acquisition of Arrowhead General Insurance Agency Superholding Corporation (“Arrowhead”),] or may acquire in the future and the failure to realize the expected benefits of such [added: acquisition and] integration; |
10-K 1 d233092d10k.htm FORM10K
None
FOR THE FISCAL YEAR ENDED DECEMBER 31, 2011
| [Part I](#tx233092_1) | | | | | | |
| Item 1A. | | [Risk Factors](#tx233092_3) | | | 9 | |
| Item 4. | | [Mine Safety Disclosures](#tx233092_7) | | | 18 | |
| [Part II](#tx233092_8) | | | | | | |
| [Part IV](#tx233092_23) | | | | | | |
| [Signatures](#tx233092_25) | | | | | 74 | |
| ITEM | 1. Business. |
| --- | --- |
General
We are a diversified insurance agency, wholesale brokerage, insurance programs and service organization with origins dating from 1939, headquartered in Daytona Beach and Tampa, Florida.
We market and sell to our customers insurance products and services, primarily in the property, casualty and employee benefits areas.
As an agent and broker, we do not assume underwriting risks.
Instead, we provide our customers with quality, non-investment insurance contracts, as well as other targeted, customized risk management products and services.
We are compensated for our services primarily by commissions paid by insurance companies and by fees paid by customers for certain services.
Commissions are usually a percentage of the premium paid by the insured.
Commission rates generally depend upon the type of insurance, the particular insurance company and the nature of the services provided by us.
In some cases, we share commissions with other agents or brokers who have acted jointly with us in a transaction.
We may also receive from an insurance company a “profit-sharing contingent commission,” which is a profit-sharing commission based primarily on underwriting results, but may also contain considerations for volume, growth and/or retention.
Fee revenues are generated primarily by: (1) our Services Division, which provides insurance-related services, including third-party claims administration and comprehensive medical utilization management services in both the workers’ compensation and all-lines liability arenas, as well as Medicare set-aside services and Social Security disability and Medicare benefits advocacy services, and (2) our National Programs and Wholesale Brokerage Divisions, which earn fees primarily for the issuing of insurance policies on behalf of insurance carriers.
The amount of our revenues from commissions and fees is a function of, among other factors, continued new business production, retention of existing customers, acquisitions and fluctuations in insurance premium rates and “insurable exposure units,” which are units that insurance companies use to measure or express insurance exposed to risk (such as property values, sales and payroll levels).
As of December 31, 2011, our activities were conducted in 230 locations in 36 states as follows and one office in London, England:
| | | | | | | | | | | | | | | | | |
| --- | --- | --- | --- | --- | --- | --- | --- | --- | --- | --- | --- | --- | --- | --- | --- | --- |
| Florida | | | 42 | | | Oklahoma | | | 5 | | | South Carolina | | | 3 | |
| Texas | | | 17 | | | Connecticut | | | 4 | | | North Carolina | | | 2 | |
| New York | | | 15 | | | Massachusetts | | | 4 | | | Wisconsin | | | 2 | |
| Washington | | | 15 | | | Michigan | | | 4 | | | Delaware | | | 1 | |
| California | | | 14 | | | Tennessee | | | 4 | | | Hawaii | | | 1 | |
| New Jersey | | | 12 | | | Virginia | | | 4 | | | Kansas | | | 1 | |
| Georgia | | | 10 | | | Arizona | | | 3 | | | Missouri | | | 1 | |
| Pennsylvania | | | 10 | | | Arkansas | | | 3 | | | Nevada | | | 1 | |
| Louisiana | | | 9 | | | Minnesota | | | 3 | | | Ohio | | | 1 | |
| Colorado | | | 7 | | | Montana | | | 3 | | | West Virginia | | | 1 | |
| Indiana | | | 7 | | | New Hampshire | | | 3 | | | | | | | |
| Illinois | | | 6 | | | New Mexico | | | 3 | | | | | | | |
| Kentucky | | | 6 | | | Oregon | | | 3 | | | | | | | |
Arrowhead Acquisition
10-K 1 d10k.htm FORM 10K
| [Part I](#tx134158_1) | | | | | | |
| Item 4. | | [Removed and Reserved](#tx134158_7) | | | 18 | |
| [Part II](#tx134158_8) | | | | | | |
| [Part IV](#tx134158_23) | | | | | | |
| [Signatures](#tx134158_25) | | | | | 70 | |
An excerpt. Shown here: all 32 rewritten, 40 of 498 added and all 6 removed. The counts are complete. For every sentence, read Cover and table of contents in the FY2011 filing and the FY2010 filing.
Item 4. Mine Safety Disclosures.
0 rewritten, 2 added, 1 removed, 1 unchanged
Not applicable.
##### [Table of Contents](#toc)
| --- | --- |
Item 5. Market for Registrant’s Common Equity, Related Stockholder Matters and Issuer Purchases of Equity Securities.
14 rewritten, 16 added, 15 removed, 46 unchanged
On February 22, [removed: 2011,] [added: 2012,] there were [removed: 142,557,243] [added: 143,352,216] shares of our common stock outstanding, held by approximately [removed: 1,314] [added: 1,270] shareholders of record.
The following table sets forth information as of December 31, [removed: 2010,] [added: 2011,] with respect to compensation plans under which the Company’s equity securities are authorized for issuance:
| Plan Category | | Number of securities [removed: to be] [added: to be] issued upon exercise [removed: of outstanding options, warrants] [added: of outstanding options, warrants] and rights (a)(1) | | | | [removed: Weighted-average exercise] [added: Weighted-average exercise] price [removed: of outstanding options, warrants] [added: of outstanding options, warrants] and rights (b)(2) | | | | Number of [removed: securities remaining] [added: securities remaining] available [removed: for future] [added: for future] issuance [removed: under equity] [added: under equity] compensation [removed: plans (excluding securities reflected] [added: plans (excluding securities reflected] in column (a)) (c)(3) | | |
| Brown & Brown, Inc. 2000 Incentive Stock Option Plan | | | [removed: 1,875,170] [added: 1,384,537] | | | $ | [removed: 17.53] [added: 17.58] | | | | — | |
| Brown & Brown, Inc. 2010 Stock Incentive Plan | | | N/A | | | | N/A | | | | [removed: 6,340,384] [added: 4,718,044] | |
| Brown & Brown, Inc. 1990 Employee Stock Purchase Plan | | | N/A | | | | N/A | | | | [removed: 2,785,310] [added: 2,297,258] | |
| (1) | In addition to the number of securities listed in this column, [removed: 3,429,968] [added: 3,382,677] shares are issuable upon the vesting of restricted stock granted under the Brown & Brown, Inc. Stock Performance Plan and the Brown & Brown, Inc. 2010 Stock Incentive Plan, which represents the maximum number of shares that can vest based on the achievement of certain performance criteria. |
We did not sell any unregistered securities during [removed: 2010.][added: 2011.]
The following table presents information with respect to our purchases of our common stock during the three months ended December 31, [removed: 2010.][added: 2011.]
| Period | | Total Number [removed: of Shares] [added: of Shares] Purchased(1) | | | | Average Price [removed: Paid per] [added: Paid per] Share | | | | Total Number [removed: of Shares Purchased as] [added: of Shares Purchased as] Part [removed: of Publicly Announced Plans] [added: of Publicly Announced Plans] or Programs | | | | Approximate [removed: Dollar Value] [added: Dollar Value] of Shares [removed: that May] [added: that May] Yet [removed: Be Purchased] [added: Be Purchased] Under [removed: the Plans] [added: the Plans] or Programs | | |
The returns of each company have been weighted according to such companies’ respective stock market capitalizations as of December 31, [removed: 2005] [added: 2006] for the purposes of arriving at a peer group average.
The total return calculations are based upon an assumed $100 investment on December 31, [removed: 2005,] [added: 2006,] with all dividends reinvested.
[removed: ][added: 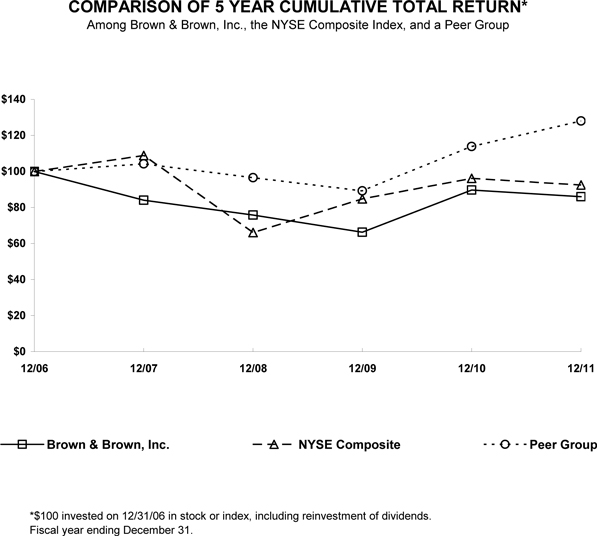]
| COMPANY/INDEX/MARKET | | [removed: 12/31/2005 | | | |] 12/31/2006 | | | | 12/30/2007 | | | | 12/29/2008 | | | | 12/31/2009 | | | | 12/31/2010 | | | [added: | 12/31/2011 | | |]
| 2011 | | | | | | | | | | | | |
| First Quarter | | $ | 26.60 | | | $ | 23.56 | | | $ | 0.08 | |
| Second Quarter | | $ | 27.07 | | | $ | 24.84 | | | $ | 0.08 | |
| Third Quarter | | $ | 26.10 | | | $ | 17.19 | | | $ | 0.08 | |
| Fourth Quarter | | $ | 23.31 | | | $ | 16.77 | | | $ | 0.085 | |
On October 19, 2011, our Board of Directors approved a common stock repurchase plan to authorize the repurchase of up to $100.0 million worth of shares of the Company’s common stock during the subsequent twelve months.
We did not repurchase any shares of our common stock under the repurchase plan during the fourth quarter of 2011.
We are under no commitment or obligation to repurchase any particular amount of our common stock under the plan, and we may suspend the repurchase plan at any time at our discretion.
| Total | | | 1,384,537 | | | $ | 17.58 | | | | 7,015,302 | |
| October 1, 2011 to October 31, 2011 | | | 4,204 | | | $ | 21.35 | | | | — | | | $ | — | |
| November 1, 2011 to November 30, 2011 | | | 505 | | | $ | 21.46 | | | | — | | | $ | — | |
| December 1, 2011 to December 31, 2011 | | | 17,734 | | | $ | 21.82 | | | | — | | | $ | — | |
| Total | | | 22,443 | | | $ | 21.73 | | | | — | | | $ | — | |
| Brown & Brown, Inc. | | $ | 100.00 | | | $ | 84.10 | | | $ | 75.86 | | | $ | 66.27 | | | $ | 89.68 | | | $ | 86.01 | |
| NYSE Composite Index | | $ | 100.00 | | | $ | 108.87 | | | $ | 66.13 | | | $ | 84.83 | | | $ | 96.19 | | | $ | 92.50 | |
| Peer Group | | $ | 100.00 | | | $ | 104.28 | | | $ | 96.54 | | | $ | 89.25 | | | $ | 113.89 | | | $ | 128.05 | |
| | | | | | | | | | | | | |
| 2009 | | | | | | | | | | | | |
| First Quarter | | $ | 21.50 | | | $ | 14.95 | | | $ | 0.075 | |
| Second Quarter | | $ | 20.30 | | | $ | 17.57 | | | $ | 0.075 | |
| Third Quarter | | $ | 20.00 | | | $ | 18.33 | | | $ | 0.075 | |
| Fourth Quarter | | $ | 19.81 | | | $ | 17.10 | | | $ | 0.0775 | |
| Total | | | 1,875,170 | | | $ | 17.53 | | | | 9,125,694 | |
| October 1, 2010 to October 31, 2010 | | | 25,804 | | | $ | 22.16 | | | | — | | | $ | — | |
| November 1, 2010 to November 30, 2010 | | | — | | | $ | — | | | | — | | | $ | — | |
| December 1, 2010 to December 31, 2010 | | | 381,626 | | | $ | 24.12 | | | | — | | | $ | — | |
| Total | | | 407,430 | | | $ | 24.00 | | | | — | | | $ | — | |
| | | | | | | | | | | | | | | | | | | | | | | | | |
| Brown & Brown, Inc. | | | 100.00 | | | | 93.02 | | | | 78.23 | | | | 70.56 | | | | 61.64 | | | | 83.42 | |
| NYSE Market Index | | | 100.00 | | | | 120.47 | | | | 131.15 | | | | 79.67 | | | | 102.20 | | | | 115.88 | |
| Peer Group | | | 100.00 | | | | 101.01 | | | | 105.33 | | | | 97.52 | | | | 90.16 | | | | 115.05 | |
Item 6. Selected Financial Data.
30 rewritten, 6 added, 1 removed, 22 unchanged
The following selected Consolidated Financial Data for each of the five fiscal years in the period ended December 31, [removed: 2010] [added: 2011] have been derived from our Consolidated Financial Statements.
| | [added: 2011] | [added: | | |] 2010 | | | | 2009 | | | | 2008 | | | | 2007 | | | | [removed: 2006 | | |]
| Commissions and fees | | $ | [removed: 966,917] [added: 1,005,962] | | | $ | [removed: 964,863] [added: 966,917] | | | $ | [removed: 965,983] [added: 964,863] | | | $ | [removed: 914,650] [added: 965,983] | | | $ | [removed: 864,663] [added: 914,650] | |
| Investment income | | | [added: 1,267 | | | |] 1,326 | | | | 1,161 | | | | 6,079 | | | | 30,494 | (1) | [removed: | | 11,479 | |]
| Other income, net | | | [removed: 5,249] [added: 6,313] | | | | [removed: 1,853] [added: 5,249] | | | | [removed: 5,492] [added: 1,853] | | | | [removed: 14,523] [added: 5,492] | | | | [removed: 1,862] [added: 14,523] | |
| Total revenues | | | [removed: 973,492] [added: 1,013,542] | | | | [removed: 967,877] [added: 973,492] | | | | [removed: 977,554] [added: 967,877] | | | | [removed: 959,667] [added: 977,554] | | | | [removed: 878,004] [added: 959,667] | |
| Employee compensation and benefits | | | [removed: 487,820] [added: 508,675] | | | | [removed: 484,680] [added: 487,820] | | | | [removed: 485,783] [added: 484,680] | | | | [removed: 444,101] [added: 485,783] | | | | [removed: 404,891] [added: 444,101] | |
| Non-cash stock-based compensation | | | [removed: 6,845] [added: 11,194] | | | | [removed: 7,358] [added: 6,845] | | | | [removed: 7,314] [added: 7,358] | | | | [removed: 5,667] [added: 7,314] | | | | [removed: 5,416] [added: 5,667] | |
| Other operating expenses | | | [removed: 135,851] [added: 144,079] | | | | [removed: 143,389] [added: 135,851] | | | | [removed: 137,352] [added: 143,389] | | | | [removed: 131,371] [added: 137,352] | | | | [removed: 126,492] [added: 131,371] | |
| Amortization | | | [removed: 51,442] [added: 54,755] | | | | [removed: 49,857] [added: 51,442] | | | | [removed: 46,631] [added: 49,857] | | | | [removed: 40,436] [added: 46,631] | | | | [removed: 36,498] [added: 40,436] | |
| Depreciation | | | [removed: 12,639] [added: 12,392] | | | | [removed: 13,240] [added: 12,639] | | | | [removed: 13,286] [added: 13,240] | | | | [removed: 12,763] [added: 13,286] | | | | [removed: 11,309] [added: 12,763] | |
| Interest | | | [removed: 14,471] [added: 14,132] | | | | [removed: 14,599] [added: 14,471] | | | | [removed: 14,690] [added: 14,599] | | | | [removed: 13,802] [added: 14,690] | | | | [removed: 13,357] [added: 13,802] | |
| Change in estimated acquisition earn-out payables | | | [removed: (1,674] [added: (2,206] | ) | | | [removed: —] [added: (1,674] | [added: )] | | | — | | | | — | | | | — | |
| Total expenses | | | [removed: 707,394] [added: 743,021] | | | | [removed: 713,123] [added: 707,394] | | | | [removed: 705,056] [added: 713,123] | | | | [removed: 648,140] [added: 705,056] | | | | [removed: 597,963] [added: 648,140] | |
| Income before income taxes | | | [removed: 266,098] [added: 270,521] | | | | [removed: 254,754] [added: 266,098] | | | | [removed: 272,498] [added: 254,754] | | | | [removed: 311,527] [added: 272,498] | | | | [removed: 280,041] [added: 311,527] | |
| Income taxes | | | [removed: 104,346] [added: 106,526] | | | | [removed: 101,460] [added: 104,346] | | | | [removed: 106,374] [added: 101,460] | | | | [removed: 120,568] [added: 106,374] | | | | [removed: 107,691] [added: 120,568] | |
| Net income | | $ | [removed: 161,752] [added: 163,995] | | | $ | [removed: 153,294] [added: 161,752] | | | $ | [removed: 166,124] [added: 153,294] | | | $ | [removed: 190,959] [added: 166,124] | | | $ | [removed: 172,350] [added: 190,959] | |
| Net income per share — diluted | | $ | [removed: 1.12] [added: 1.13] | | | $ | [removed: 1.08] [added: 1.12] | | | $ | [removed: 1.17] [added: 1.08] | | | $ | [removed: 1.35] [added: 1.17] | | | $ | [removed: 1.22] [added: 1.35] | |
| Weighted average number of shares outstanding — diluted | | | [removed: 139,318] [added: 140,264] | | | | [removed: 137,507] [added: 139,318] | | | | [removed: 136,884] [added: 137,507] | | | | [removed: 136,357] [added: 136,884] | | | | [removed: 135,886] [added: 136,357] | |
| Dividends declared per share | | $ | [removed: 0.3125] [added: 0.3250] | | | $ | [removed: 0.3025] [added: 0.3125] | | | $ | [removed: 0.2850] [added: 0.3025] | | | $ | [removed: 0.2500] [added: 0.2850] | | | $ | [removed: 0.2100] [added: 0.2500] | |
| Total assets | | $ | [removed: 2,400,814] [added: 2,607,011] | | | $ | [removed: 2,224,226] [added: 2,400,814] | | | $ | [removed: 2,119,580] [added: 2,224,226] | | | $ | [removed: 1,960,659] [added: 2,119,580] | | | $ | [removed: 1,807,952] [added: 1,960,659] | |
| Long-term debt | | $ | [removed: 250,067] [added: 250,033] | | | $ | [removed: 250,209] [added: 250,067] | | | $ | [removed: 253,616] [added: 250,209] | | | $ | [removed: 227,707] [added: 253,616] | | | $ | [removed: 226,252] [added: 227,707] | |
| Total shareholders’ equity (2) | | $ | [removed: 1,506,344] [added: 1,643,963] | | | $ | [removed: 1,369,874] [added: 1,506,344] | | | $ | [removed: 1,241,741] [added: 1,369,874] | | | $ | [removed: 1,097,458] [added: 1,241,741] | | | $ | [removed: 929,345] [added: 1,097,458] | |
| Total shares outstanding at year-end | | | [removed: 142,795] [added: 143,352] | | | | [removed: 142,076] [added: 142,795] | | | | [removed: 141,544] [added: 142,076] | | | | [removed: 140,673] [added: 141,544] | | | | [removed: 140,016] [added: 140,673] | |
| Number of full-time equivalent employees [added: at year-end] | | | [removed: 5,286] [added: 5,557] | | | | [removed: 5,206] [added: 5,286] | | | | [removed: 5,398] [added: 5,206] | | | | [removed: 5,047] [added: 5,398] | | | | [removed: 4,733] [added: 5,047] | |
| Total [removed: revenue] [added: revenues] per average number of employees [added: (3)] | | $ | [removed: 185,586] [added: 186,949] | | | $ | [removed: 182,549] [added: 185,568] | | | $ | [removed: 187,181] [added: 182,549] | | | $ | [removed: 196,251] [added: 187,181] | | | $ | [removed: 189,368] [added: 196,251] | |
| Stock price at year-end | | $ | [removed: 23.94] [added: 22.63] | | | $ | [removed: 17.97] [added: 23.94] | | | $ | [removed: 20.90] [added: 17.97] | | | $ | [removed: 23.50] [added: 20.90] | | | $ | [removed: 28.21] [added: 23.50] | |
| Stock price earnings multiple at year-end [added: (4)] | | | [removed: 21.38] [added: 20.03] | | | | [removed: 16.64] [added: 21.38] | | | | [removed: 17.86] [added: 16.64] | | | | [removed: 17.41] [added: 17.86] | | | | [removed: 23.12] [added: 17.41] | |
| Return on beginning shareholders’ equity [added: (5)] | | | [removed: 12] [added: 11] | % | | | 12 | % | | | [removed: 15] [added: 12] | % | | | [removed: 21] [added: 15] | % | | | [removed: 23] [added: 21] | % |
| (2) | Shareholders’ equity as of December 31, [added: 2011,] 2010, 2009, 2008, [removed: 2007,] and [removed: 2006] [added: 2007] included $7, [added: $7,] $5, $13, [removed: $13,] and [removed: $9,144,] [added: $13,] respectively, as a result of the Company’s accounting for certain equity securities and interest rate swap agreement. |
| (3) | Represents total revenues divided by the average of the number of full-time equivalent employees at the beginning of the year and the number of full-time equivalent employees at the end of the year. |
| --- | --- |
| (4) | Represents net income divided by total shareholders’ equity as of the beginning of the year. |
| --- | --- |
| (5) | Stock price at year-end divided by net income per share-diluted. |
| --- | --- |
| Book value per share at year-end | | $ | 10.55 | | | $ | 9.64 | | | $ | 8.77 | | | $ | 7.80 | | | $ | 6.64 | |
Item 9. Changes in and Disagreements With Accountants on Accounting and Financial Disclosure.
1 rewritten, 0 added, 0 removed, 1 unchanged
There were no changes in or disagreements with accountants on accounting and financial disclosure in [removed: 2010.][added: 2011.]
Item 9A. Controls and Procedures.
4 rewritten, 0 added, 8 removed, 18 unchanged
We carried out an evaluation required by Rules 13a-15 and 15d-15 under the Exchange Act (the “Evaluation”), under the supervision and with the participation of our Chief Executive Officer (“CEO”) and Chief Financial Officer (“CFO”), of the effectiveness of our disclosure controls and procedures as defined in Rule 13a-15 and 15d-15 under the Exchange Act (“Disclosure Controls”) as of December 31, [removed: 2010.][added: 2011.]
In conducting Brown & Brown’s evaluation of the effectiveness of its internal controls over financial reporting, Brown & Brown has excluded the following acquisitions completed by Brown & Brown during [removed: 2010: Medical Settlement Protocols; DiMartino Associates, Inc; Crowe Paradis Holding Company et.al.; Thomas R Jones,] [added: 2011: Balcos Insurance, Inc., United Benefit Services Insurance Agency LLC et al., Fitzharris Agency,] Inc. [removed: and Martin] [added: et al, Public Employee] Benefits [removed: Consulting, LLC] [added: Solution, LLC, Sitzmann, Morris & Lavis Insurance Agency, Inc. et al., Snapper Shuler Kenner, Inc. et al, Industry Consulting Group, Inc. and Colonial Claims Corporation et al] (collectively the [removed: “2010] [added: “2011] Excluded Acquisitions”), which were acquired during [removed: 2010] [added: 2011] and whose financial statements constitute [removed: 7.3 %] [added: 6.7%] and 5.5% of net and total assets, respectively, [removed: 2.0%] [added: 1.8%] of revenues, and [removed: 2.1%] [added: 2.7%] of net income of the consolidated financial statement amounts as of and for the year ended December 31, [removed: 2010.][added: 2011.]
There has not been any change in our internal control over financial reporting identified in connection with the Evaluation that occurred during the quarter ended December 31, [removed: 2010] [added: 2011] that has materially affected, or is reasonably likely to materially affect, those controls.
Exhibits 31.1 and 31.2 are the Certifications of the [added: acting] CEO and the CFO, respectively.
Management’s Report on Internal Control Over Financial Reporting
Our management is responsible for establishing and maintaining adequate internal control over financial reporting, as such term is defined in Exchange Act Rule 13a-15(f).
Our internal control system was designed to provide reasonable assurance to our management and board of directors regarding the preparation and fair presentation of published financial statements.
All internal control systems, no matter how well designed, have inherent limitations.
Therefore, even those systems determined to be effective can provide only reasonable assurance with respect to financial statement preparation and presentation.
Under the supervision and with the participation of our management, including our principal executive officer and principal financial officer, we conducted an evaluation of the effectiveness of our internal control over financial reporting based on the framework in _Internal Control — Integrated Framework_ issued by the Committee of Sponsoring Organizations of the Treadway Commission.
Based on our evaluation under the framework in _Internal Control — Integrated Framework_, our management concluded that our internal control over financial reporting was effective as of December 31, 2010.
Management’s Report on Internal Control Over Financial Reporting and the Report of Independent Registered Public Accounting Firm on internal control over financial reporting are set forth in Part II, Item 8 of this Annual Report on Form 10-K and are included herein by reference.
Item 9B. Other Information.
0 rewritten, 1 added, 13 removed, 2 unchanged
None
On January 19, 2011, we granted restricted stock shares under our 2010 Stock Incentive Plan (“SIP”) to Powell Brown and Cory Walker, each of whom is one of our Named Executive Officers.
Full ownership of these shares will not vest until the satisfaction of several conditions of vesting.
The first condition is a performance condition based on the compounded annual growth rate (“CAGR”) of our earnings per share (“EPS”) over a five-year performance measurement period ending December 31, 2015.
If the CAGR of our EPS during the performance measurement period equals or exceeds seven and one-half percent (7.5%), the first condition of vesting is met with respect to the shares.
Alternatively, if the CAGR of our EPS during the performance measurement period does not equal at least seven and one-half percent (7.5%), all of the shares will be forfeited.
The restricted stock grants contain an additional provision that would apply in the event of extraordinary performance.
If the CAGR of our EPS during the performance measurement period equals or exceeds ten percent (10%), the number of shares awarded to Powell Brown and Cory Walker and treated as having met the EPS performance condition would be increased by fifty percent (50%).
Once the first condition of vesting is met with respect to any portion of the shares, the grantee is entitled to receive dividends and to vote that portion of the shares.
For purposes of the additional vesting conditions, the restricted stock grants are divided into two equal portions described as Vesting Category 1 and Vesting Category 2.
If additional shares are awarded as a result of extraordinary performance as described above, the additional shares are governed by the same second condition of vesting that applies to Vesting Category 2.
For Vesting Category 1, the second condition of vesting provides for vesting in three (3) equal installments, on January 1 of 2017, 2018 and 2019, respectively, if the grantee remains continuously employed by the Company from the date of grant until December 31 of the calendar year ending immediately prior to each such date, or, if earlier, until the attainment of age 64, or disability or death, in which case a pro rata portion of the shares that have met the performance conditions described above would vest.
For Vesting Category 2, the second condition of vesting is continued employment with us for a period of ten (10) years following the date of grant or, if earlier, until the attainment of age 64, or disability or death, in which case a pro rata portion of the shares that have met the performance conditions described above would vest.
If and when such second conditions of vesting are met, the vested shares in Vesting Category 1 and Vesting Category 2 (including any additional shares awarded as a result of extraordinary performance) will be delivered, and the market value of such shares as of the vesting date will be taxed as ordinary income to the recipients.
Item 10. Directors, Executive Officers and Corporate Governance.
1 rewritten, 1 added, 0 removed, 2 unchanged
The information required by this item regarding directors and executive officers is incorporated herein by reference to our definitive Proxy Statement to be filed with the SEC in connection with the Annual Meeting of Shareholders to be held in [removed: 2011] [added: 2012] (the [removed: “2011] [added: “2012] Proxy Statement”) under the headings “Management” and “Section 16(a) Beneficial Ownership Reporting.” We have adopted a code of ethics that applies to our principal executive officer, principal financial officer, and controller.
Any amendments to, or waiver from, any provision of the Code of Business Conduct and Ethics will be posted on our website at the above address.
Item 11. Executive Compensation.
1 rewritten, 0 added, 0 removed, 1 unchanged
The information required by this item is incorporated herein by reference to the [removed: 2011] [added: 2012] Proxy Statement under the heading “Executive Compensation.”
Item 12. Security Ownership of Certain Beneficial Owners and Management and Related Stockholder Matters.
1 rewritten, 0 added, 0 removed, 1 unchanged
The information required by this item is incorporated herein by reference to the [removed: 2011] [added: 2012] Proxy Statement under the heading “Security Ownership of Management and Certain Beneficial Owners.”
Item 13. Certain Relationships and Related Transactions, and Director Independence.
1 rewritten, 0 added, 0 removed, 1 unchanged
The information required by this item is incorporated herein by reference to the [removed: 2011] [added: 2012] Proxy Statement under the heading “Management — Certain Relationships and Related Transactions.”
Item 14. Principal Accounting Fees and Services.
1 rewritten, 0 added, 0 removed, 3 unchanged
The information required by this item is incorporated herein by reference to the [removed: 2011] [added: 2012] Proxy Statement under the heading “Fees Paid to Deloitte & Touche LLP.”
Item 15. Exhibits and Financial Statement Schedules.
21 rewritten, 29 added, 30 removed, 119 unchanged
| 10.1(a) | | Lease of the Registrant for office space at 220 South Ridgewood Avenue, Daytona Beach, Florida dated August 15, 1987 (incorporated by reference to Exhibit 10a(3) to Form 10-K for the year ended December 31, 1993), as amended by Letter Agreement dated June 26, 1995; First Amendment to Lease dated August 2, 1999; Second Amendment to Lease dated December 11, 2001; Third Amendment to Lease dated August 8, 2002; Fourth Amendment to Lease dated October 26, 2004 (incorporated by reference to Exhibit 10.2(a) to Form 10-K for the year ended December 31, 2005); Fifth Amendment to Lease dated [removed: 2006;] [added: 2006 (incorporated by reference to Exhibit 10.1(a) to Form 10-K for the year ended December 31, 2010);] and Sixth Amendment to Lease dated August 17, 2009 [added: (incorporated by reference to Exhibit 10.1(a) to Form 10-K for the year ended December 31, 2010).] |
| [removed: 10.1(b)] [added: 10.1(c)] | | Lease Agreement for office space at [removed: 3101 W. Martin Luther King, Jr. Blvd., Tampa, Florida,] [added: Riedman Tower, Rochester, New York,] dated [removed: July 1, 2004 and effective May 9,] [added: December 31,] 2005, between [removed: Highwoods/Florida Holdings, L.P.,] [added: Riedman Corporation,] as [removed: landlord] [added: landlord,] and [added: a subsidiary of] the Registrant, as tenant (incorporated by reference to Exhibit [removed: 10.2(b)] [added: 10.2(c)] to Form 10-K for the year ended December 31, [removed: 2005).] [added: 2005), as amended by Amendment to Lease Agreement dated December 31, 2010 (incorporated by reference to Exhibit 10.1(c) to Form 10-K for the year ended December 31, 2010).] |
| [removed: 10.4(b)] [added: 10.13] | | [removed: Employment Agreement,] [added: Third Amendment to Amended and Restated Revolving and Term Loan Agreement] dated as of [removed: October 8, 1996,] [added: January 30, 2007 by and] between the Registrant and [removed: J. Powell Brown] [added: SunTrust Bank] (incorporated by reference to Exhibit [removed: 10.4(c)] [added: 10.17] to Form 10-K for the year ended December 31, [removed: 2007).] [added: 2006).] |
| [removed: 10.4(c)] [added: 10.4(f)] | | Employment Agreement, dated as of [removed: August 1, 1994,] [added: January 12, 1998,] between the Registrant and [removed: Cory T. Walker] [added: C. Roy Bridges, as amended by the amendment effective May 10, 2011] (incorporated by reference to Exhibit [removed: 10.4(f)] [added: 10.4] to Form [removed: 10-K] [added: 10-Q] for the [removed: year] [added: quarter] ended [removed: December] [added: March] 31, [removed: 2009).] [added: 2011).] |
| 10.4(d) | | [removed: Employment Agreement,] [added: Separation Agreement and Release] dated [removed: as of May 11, 1995,] [added: January 12, 2011] between the Registrant and Thomas E. Riley (incorporated by reference to Exhibit [removed: 10.4(g)] [added: 10.1] to Form [removed: 10-K for the year ended December 31, 2009).] [added: 8-K filed January 19, 2011).] |
| [removed: 10.4(e)] [added: 10.4(g)] | | [removed: Employment Agreement, dated as of June 1, 2010,] [added: Performance Cash Incentive Award Agreement] between the Registrant and [removed: Kenneth D. Kirk] [added: C. Roy Bridges dated May 10, 2011] (incorporated by reference to Exhibit [removed: 10.1] [added: 10.3] to Form 10-Q for the quarter ended [removed: June 30, 2010).] [added: March 31, 2011).] |
| [removed: 10.4(f)] [added: 10.12] | | [removed: Portions of Employment] [added: Second Amendment to Amended and Restated Revolving and Term Loan] Agreement dated [removed: April 28, 1993] [added: as of December 22, 2006 by and] between the Registrant and [removed: Jim W. Henderson] [added: SunTrust Bank] (incorporated by reference to Exhibit [removed: 10m] [added: 10.15] to Form 10-K for the year ended December 31, [removed: 1993).] [added: 2006).] |
| [removed: 10.6(b)] [added: 10.15] | | [removed: Registrant’s] [added: Form of Performance-Based] Stock [removed: Performance] [added: Grant Agreement under 2010 Stock Incentive] Plan [removed: as amended, effective January 23, 2008] (incorporated by reference to Exhibit [removed: 10.6(b)] [added: 10.16] to Form 10-K for the year ended December 31, [removed: 2007).] [added: 2010).] |
| [removed: 10.8] [added: 10.10] | | [removed: International Swap Dealers Association, Inc. Master] [added: Amended and Restated Revolving and Term Loan] Agreement dated as of [removed: December 5,] [added: January 3,] 2001 [removed: between SunTrust Bank] [added: by] and [added: among] the Registrant and [removed: letter agreement dated December 6, 2001, regarding confirmation of interest rate transaction] [added: SunTrust Bank] (incorporated by reference to Exhibit [removed: 10p] [added: 4a] to Form 10-K for the year ended December 31, [removed: 2001).] [added: 2000).] |
| [removed: 10.9] [added: 10.8] | | Note Purchase Agreement, dated as of July 15, 2004, among the Registrant and the listed purchasers of the 5.57% Series A Senior Notes due September 15, 2011 and 6.08% Series B Senior Notes due July 15, 2014 (incorporated by reference to Exhibit 4.1 to Form 10-Q for the quarter ended June 30, 2004). |
| [removed: 10.10] [added: 10.9] | | First Amendment to Amended and Restated Revolving and Term Loan Agreement dated and effective July 15, 2004, by and between the Registrant and SunTrust Bank (incorporated by reference to Exhibit 4.2 to Form 10-Q for the quarter ended June 30, 2004). |
| [removed: 10.11] [added: 10.14] | | Amended and Restated Revolving [removed: and Term] Loan Agreement [removed: Dated] [added: dated] as of [removed: January] [added: June] 3, [removed: 2001 By] [added: 2008 by] and [removed: Among] [added: between] the Registrant and SunTrust Bank (incorporated by reference to Exhibit [removed: 4a] [added: 10.19] to Form [removed: 10-K for the year ended December 31, 2000).] [added: 8-K filed June 18, 2008).] |
| [removed: 10.12] [added: 10.11] | | Master Shelf and Note Purchase Agreement Dated as of December 22, 2006, by and among the Registrant and Prudential Investment Management, Inc. and certain Prudential affiliates as purchasers of the 5.66% Series C Senior Notes due December 22, 2016 (incorporated by reference to Exhibit 10.14 to Form 10-K for the year ended December 31, 2006). |
| [removed: 10.12(a)] [added: 10.11(a)] | | Letter Amendment dated September 30, 2009, to the Master Shelf and Note Purchase Agreement (incorporated by reference to Exhibit 10.1 to Form 8-K filed October 5, 2009). |
| [removed: 10.12(b)] [added: 10.11(b)] | | Confirmation of Acceptance dated January 21, 2011 (incorporated by reference to Exhibit 10.1 to Form 8-K filed January 27, 2011). |
| [removed: 10.14] [added: 10.17] | | [removed: Third Amendment to] Amended and Restated Revolving and Term Loan [added: Credit] Agreement dated as of January [removed: 30, 2007] [added: 9, 2012] by and between the Registrant and SunTrust [removed: Bank (incorporated by reference to Exhibit 10.17 to Form 10-K for the year ended December 31, 2006).] [added: Bank.] |
| 31.1 | | Rule 13a-14(a)/15d-14(a) Certification by the [added: Acting] Chief Executive Officer of the Registrant. |
| 32.1 | | Section 1350 Certification by the [added: Acting] Chief Executive Officer of the Registrant. |
| | | [added: | |] BROWN & BROWN, INC. Registrant | | |
| | | | | [removed: _Chief] [added: | | _Acting Chief] Executive Officer_ |
| /s/ Cory T. Walker | | Sr. Vice President, Treasurer and Chief Financial Officer (Principal Financial and Accounting Officer) | | [removed: March 1, 2011] [added: February 29, 2012] |
| 10.4(e) | | Employment Agreement, dated as of November 7, 1997, between the Registrant and J. Scott Penny. |
| 10.16 | | Merger Agreement, dated December 15, 2011, among the Registrant, Pacific Merger Corp., a wholly owned subsidiary of the Registrant, Arrowhead General Insurance Agency Superholding Corporation, and Spectrum Equity Investors V, L.P. |
| 10.18 | | Promissory Note dated January 9, 2012, by and between Registrant and JPMorgan Chase Bank, N.A. |
| 10.19 | | Letter Agreement dated January 9, 2012 by and between Registrant and JPMorgan Chase Bank, N.A. |
| 10.20 | | Term Loan Agreement dated as of January 26, 2012 by and between the Registrant and JPMorgan Chase Bank, N.A. |
| 101.INS* | | XBRL Instance Document. |
| 101.SCH* | | XBRL Taxonomy Extension Schema Document. |
| 101.CAL* | | XBRL Taxonomy Extension Calculation Linkbase Document. |
| 101.DEF* | | XBRL Taxonomy Extension Definition Linkbase Document. |
| 101.LAB* | | XBRL Taxonomy Extension Label Linkbase Document. |
| 101.PRE* | | XBRL Taxonomy Extension Presentation Linkbase Document. |
| * | These interactive data files shall not be deemed filed for purposes of Section 11 or 12 of the Securities Act of 1933, as amended, or Section 18 of the Securities Exchange Act of 1934, as amended, or otherwise subject to liability under those sections. |
| --- | --- |
| | | | | | | |
| --- | --- | --- | --- | --- | --- | --- |
| | | | | | | |
| Date: February 29, 2012 | | | | By: | | /s/ J. Hyatt Brown |
| | | | | | | J. Hyatt Brown |
| /s/ J. Hyatt Brown | | Chairman of the Board and Acting President and Chief Executive Officer (Principal Executive Officer) | | February 29, 2012 |
| | | President and Chief Executive Officer; Director (currently on temporary leave of absence) | | February 29, 2012 |
| * | | Director | | February 29, 2012 |
| * | | Director | | February 29, 2012 |
| * | | Director | | February 29, 2012 |
| * | | Director | | February 29, 2012 |
| * | | Director | | February 29, 2012 |
| * | | Director | | February 29, 2012 |
| * | | Director | | February 29, 2012 |
| * | | Director | | February 29, 2012 |
| * | | Director | | February 29, 2012 |
| | | |
| --- | --- | --- |
| 3.1 | | Articles of Amendment to Articles of Incorporation (adopted April 24, 2003) (incorporated by reference to Exhibit 3a to Form 10-Q for the quarter ended March 31, 2003), and Amended and Restated Articles of Incorporation (incorporated by reference to Exhibit 3a to Form 10-Q for the quarter ended March 31, 1999). |
| 3.2 | | Bylaws (incorporated by reference to Exhibit 3b to Form 10-K for the year ended December 31, 2002). |
| 10.1(c) | | Lease Agreement for office space at Riedman Tower, Rochester, New York, dated December 31, 2005, between Riedman Corporation, as landlord, and a subsidiary of the Registrant, as tenant (incorporated by reference to Exhibit 10.2(c) to Form 10-K for the year ended December 31, 2005), as amended by Amendment to Lease Agreement dated December 31, 2010. |
| 10.2 | | Indemnity Agreement dated January 1, 1979, among the Registrant, Whiting National Management, Inc., and Pennsylvania Manufacturers’ Association Insurance Company (incorporated by reference to Exhibit 10g to Registration Statement No. 33-58090 on Form S-4). |
| 10.3 | | Agency Agreement dated January 1, 1979 among the Registrant, Whiting National Management, Inc., and Pennsylvania Manufacturers’ Association Insurance Company (incorporated by reference to Exhibit 10h to Registration Statement No. 33-58090 on Form S-4). |
##### [Table of Contents](#toc)
| 10.5 | | Registrant’s 2000 Incentive Stock Option Plan for Employees (incorporated by reference to Exhibit 4 to Registration Statement No. 333-43018 on Form S-8 filed on August 3, 2000). |
| 10.6(a) | | Registrant’s Stock Performance Plan (incorporated by reference to Exhibit 4 to Registration Statement No. 333-14925 on Form S-8 filed on October 28, 1996). |
| 10.6(c) | | Registrant’s Stock Performance Plan as amended, effective July 21, 2009 (incorporated by reference to Exhibit 10.1 to Form 10-Q for the quarter ended September 30, 2009). |
| 10.7 | | Registrant’s 2010 Stock Incentive Plan (incorporated by reference to Exhibit 10.1 to Form 10-Q for the quarter ended March 31, 2010). |
| 10.13 | | Second Amendment to Amended and Restated Revolving and Term Loan Agreement dated as of December 22, 2006 by and between the Registrant and SunTrust Bank (incorporated by reference to Exhibit 10.15 to Form 10-K for the year ended December 31, 2006). |
| 10.15 | | Amended and Restated Revolving Loan Agreement dated as of June 3, 2008 by and between the Registrant and SunTrust Bank (incorporated by reference to Exhibit 10.19 to Form 8-K filed June 18, 2008). |
| 10.16 | | Form of Performance-Based Stock Grant Agreement under 2010 Stock Incentive Plan. |
| 21 | | Subsidiaries of the Registrant. |
| 23 | | Consent of Deloitte & Touche LLP. |
| 24 | | Powers of Attorney. |
| 31.2 | | Rule 13a-14(a)/15d-14(a) Certification by the Chief Financial Officer of the Registrant. |
| 32.2 | | Section 1350 Certification by the Chief Financial Officer of the Registrant. |
| | | | | |
| --- | --- | --- | --- | --- |
| Date: March 1, 2011 | | By: | | /s/ J. Powell Brown |
| | | | | J. Powell Brown |
| /s/ J. Powell Brown | | President and Chief Executive Officer (Principal Executive Officer), Director | | March 1, 2011 |
| * | | Chairman of the Board | | March 1, 2011 |
| * | | Director | | March 1, 2011 |
EXHIBIT INDEX
| 10.1(a) | | Lease of the Registrant for office space at 220 South Ridgewood Avenue, Daytona Beach, Florida dated August 15, 1987 (incorporated by reference to Exhibit 10a(3) to Form 10-K for the year ended December 31, 1993), as amended by Letter Agreement dated June 26, 1995; First Amendment to Lease dated August 2, 1999; Second Amendment to Lease dated December 11, 2001; Third Amendment to Lease dated August 8, 2002; and Fourth Amendment to Lease dated October 26, 2004 (incorporated by reference to Exhibit 10.2(a) to Form 10-K for the year ended December 31, 2005); Fifth Amendment to Lease dated 2006; and Sixth Amendment to Lease dated August 17, 2009. |
| 10.4(a) | | Employment Agreement dated and effective as of July 1, 2009 between the Registrant and J. Hyatt Brown (incorporated by reference to Exhibit 10.1 to Form 10-Q for the quarter ended June 30, 2009). |
Item 1B. Unresolved Staff Comments.
0 rewritten, 0 added, 2 removed, 0 unchanged
Dropped this year
| --- | --- |
None.
Item 2. Properties.
0 rewritten, 0 added, 11 removed, 0 unchanged
Dropped this year
| --- | --- |
We lease our executive offices, which are located at 220 South Ridgewood Avenue, Daytona Beach, Florida 32114, and 3101 West Martin Luther King Jr. Boulevard, Suite 400, Tampa, Florida 33607.
We lease offices at each of our 205 locations, with the exception of Dansville and Jamestown, New York, where we own the buildings in which our offices are located.
There are no outstanding mortgages on our owned properties.
Our operating leases expire on various dates.
These leases generally contain renewal options and rent escalation clauses based on increases in the lessors’ operating expenses and other charges.
We expect that most leases will be renewed or replaced upon expiration.
We believe that our facilities are suitable and adequate for present purposes, and that the productive capacity in such facilities is substantially being utilized.
From time to time, we may have unused space and seek to sublet such space to third parties, depending on the demand for office space in the locations involved.
In the future, we may need to purchase, build or lease additional facilities to meet the requirements projected in our long-term business plan.
See Note 13 to the Consolidated Financial Statements for additional information on our lease commitments.
Item 8. Financial Statements and Supplementary Data.
0 rewritten, 0 added, 1,059 removed, 0 unchanged
Dropped this year
| --- | --- |
Index to Consolidated Financial Statements
| | | | | |
| --- | --- | --- | --- | --- |
| | | Page No. | | |
| [Consolidated Statements of Income for the years ended December 31, 2010, 2009 and 2008](#tx134158_27) | | | 41 | |
| [Consolidated Balance Sheets as of December 31, 2010 and 2009](#tx134158_28) | | | 42 | |
| [Consolidated Statements of Shareholders’ Equity for the years ended December 31, 2010, 2009 and 2008](#tx134158_29) | | | 43 | |
| [Consolidated Statements of Cash Flows for the years ended December 31, 2010, 2009 and 2008](#tx134158_30) | | | 44 | |
| [Notes to Consolidated Financial Statements for the years ended December 31, 2010, 2009 and 2008](#tx134158_31) | | | 45 | |
| [Note 1: Summary of Significant Accounting Policies](#tx134158_32) | | | 45 | |
| [Note 2: Business Combinations](#tx134158_33) | | | 48 | |
| [Note 3: Goodwill](#tx134158_34) | | | 53 | |
| [Note 4: Amortizable Intangible Assets](#tx134158_35) | | | 53 | |
| [Note 5: Investments](#tx134158_36) | | | 53 | |
| [Note 6: Fixed Assets](#tx134158_37) | | | 54 | |
| [Note 7: Accrued Expenses and Other Liabilities](#tx134158_38) | | | 54 | |
| [Note 8: Long-Term Debt](#tx134158_39) | | | 54 | |
| [Note 9: Income Taxes](#tx134158_40) | | | 56 | |
| [Note 10: Employee Savings Plan](#tx134158_41) | | | 57 | |
| [Note 11: Stock-Based Compensation](#tx134158_42) | | | 57 | |
| [Note 12: Supplemental Disclosures of Cash Flow Information](#tx134158_43) | | | 60 | |
| [Note 13: Commitments and Contingencies](#tx134158_44) | | | 61 | |
| [Note 14: Quarterly Operating Results (Unaudited)](#tx134158_45) | | | 61 | |
| [Note 15: Segment Information](#tx134158_46) | | | 62 | |
| | | | | |
| [Reports of Independent Registered Public Accounting Firm](#tx134158_47) | | | 63 | |
| [Management’s Report on Internal Control Over Financial Reporting](#tx134158_48) | | | 65 | |
##### [Table of Contents](#toc)
BROWN & BROWN, INC.
CONSOLIDATED STATEMENTS OF
INCOME
| | | | | | | | | | | | | |
| --- | --- | --- | --- | --- | --- | --- | --- | --- | --- | --- | --- | --- |
| | | Year Ended December 31, | | | | | | | | | | |
| _(in thousands, except per share data)_ | | 2010 | | | | 2009 | | | | 2008 | | |
| REVENUES | | | | | | | | | | | | |
| Commissions and fees | | $ | 966,917 | | | $ | 964,863 | | | $ | 965,983 | |
| Investment income | | | 1,326 | | | | 1,161 | | | | 6,079 | |
| Other income, net | | | 5,249 | | | | 1,853 | | | | 5,492 | |
An excerpt. Shown here: all 0 rewritten, all 0 added and 40 of 1,059 removed. The counts are complete. For every sentence, read Item 8. Financial Statements and Supplementary Data. in the FY2010 filing.