 filings.tools
Brown & Brown (BRO) 10-K risk factor changes: FY2013 vs FY2012
The 2013-12-31 10-K against the 2012-12-31 one, compared heading by heading and sentence by sentence. One of these filings carries no fiscal year tag, so its year is the calendar year of the period end.
Item 1A30 rewritten18 added5 removed222 unchanged
All filing items780 rewritten320 added277 removed1,812 unchanged
Summary
counted, not written
- Item 1A lists 32 risk factor headings: 0 new, 3 reworded and 29 unchanged since FY2012. 0 headings from FY2012 no longer appear.
- Sentence by sentence, 320 added, 277 removed, 780 rewritten and 1,812 unchanged across 17 items that differ.
New Item 1A headings (0)
No risk factor heading in this filing is absent from FY2012.
Removed Item 1A headings (0)
Every FY2012 risk factor heading is still here, word for word or reworded.
Reworded Item 1A headings (3)
- BECAUSE OUR BUSINESS IS HIGHLY CONCENTRATED IN CALIFORNIA, FLORIDA, GEORGIA, INDIANA, [added: KANSAS,] MASSACHUSETTS, MICHIGAN, NEW JERSEY, NEW YORK, [added: OREGON,] PENNSYLVANIA,
[removed: TEXAS][added: TEXAS, VIRGINIA] AND WASHINGTON, ADVERSE ECONOMIC CONDITIONS OR REGULATORY CHANGES IN THESE STATES COULD ADVERSELY AFFECT OUR FINANCIAL CONDITION. - HEALTHCARE REFORM AND INCREASED COSTS OF CURRENT EMPLOYEES’ MEDICAL AND OTHER BENEFITS COULD HAVE A MATERIALLY ADVERSE
[removed: AFFECT][added: EFFECT] ON OUR BUSINESS. - IF WE RECEIVE OTHER THAN AN UNQUALIFIED OPINION ON THE ADEQUACY OF OUR INTERNAL CONTROL OVER FINANCIAL REPORTING AS OF DECEMBER 31,
[removed: 2013][added: 2014] AND FUTURE YEAR-ENDS AS REQUIRED BY SECTION 404 OF SARBANES-OXLEY, INVESTORS COULD LOSE CONFIDENCE IN THE RELIABILITY OF OUR FINANCIAL STATEMENTS, WHICH COULD RESULT IN A DECREASE IN THE VALUE OF[removed: YOUR][added: OUR] SHARES.
A heading is new when no FY2012 heading matches it after ignoring case and punctuation, and reworded when it shares at least 60 percent of its words with one that went away. All current risk factor headings.
Sentences by item
21 items, with every count and a link to each item that changed
Underlined words on a shaded ground are new in FY2013; struck-through words were in FY2012. Sentences that are wholly new or wholly gone are labelled rather than marked.
Item 1A. Risk Factors
30 rewritten, 18 added, 5 removed, 222 unchanged
Read the full itemFY2013 item · filed February 28, 2014FY2012 item · filed March 1, 2013
[removed: Since] [added: From] late [removed: 2007,] [added: 2007 through 2011,] global consumer confidence [removed: has] [added: had] eroded amidst concerns over declining asset values, volatility in energy costs, geopolitical issues, the availability and cost of credit, high unemployment, and the stability and solvency of financial institutions, financial markets, businesses, and sovereign nations.
[removed: These] [added: Those] concerns [removed: have] slowed economic growth and resulted in a recession in the United States.
Economic conditions [removed: have] had a negative impact on our results of operations during the years [removed: since] 2008 [added: through 2011] due to reduced customer demand.
[removed: If] [added: However, if] these economic conditions worsen, a number of negative effects on our business could result, including declines in values of insurable exposure units, declines in insurance premium rates, and the financial insolvency, or reduced ability to pay, of certain of our customers.
Acquisitions also involve a number of special risks, such as: diversion of management’s attention; difficulties in the integration of acquired operations and retention of personnel; [added: increase in expenses and working capital requirements, which could reduce our return on invested capital;] entry into unfamiliar markets; unanticipated problems or legal liabilities; estimation of the acquisition earn-out [removed: payable;] [added: payables;] and tax and accounting issues, some or [removed: all of which could have a material adverse effect on the results of our operations, financial condition and cash flows.]
As of the date of the filing of our Annual Report on Form 10-K for the [removed: 2012] [added: 2013] fiscal year, we have [removed: $1,711,514,000] [added: $2,006,173,000] of goodwill recorded on our Consolidated Balance Sheet.
We completed our most recent evaluation of impairment for goodwill as of November 30, [removed: 2012] [added: 2013] and determined that the fair value of goodwill exceeded the carrying value of such assets.
See Notes [removed: 1 – “Summary] [added: 1—“Summary] of Significant Accounting Policies” and Note [removed: 3 – “Goodwill”] [added: 3—“Goodwill”] to the Consolidated Financial Statements and “Management’s Report on Internal Control Over Financial Reporting.”
Any impairment identified through this assessment may require that the carrying value of related amortizable intangible assets be adjusted; however, no impairments have been recorded for the years ended December 31, [removed: 2012, 2011] [added: 2013, 2012] and [removed: 2010.][added: 2011.]
Claimants may seek large damage awards, and these claims may involve potentially significant legal [removed: costs.][added: costs, including punitive damages.]
For the year ended December 31, [removed: 2012,] [added: 2013,] no insurance company accounted for more than [removed: 5.0%] [added: 8.0%] of our total core commissions.
For the year ended December 31, [removed: 2011] [added: 2012] and [removed: 2010,] [added: 2011,] approximately [removed: 5.2% and] 5.0% [added: and 5.2%] of our total core commissions was derived from insurance policies underwritten by one insurance company, respectively.
Should this insurance company seek to terminate their arrangements with us, we believe that other insurance companies are available to underwrite the business, [added: and we could likely move our business to one of these other insurance companies,] although some additional expense and loss of market share could possibly result.
BECAUSE OUR BUSINESS IS HIGHLY CONCENTRATED IN CALIFORNIA, FLORIDA, GEORGIA, INDIANA, [added: KANSAS,] MASSACHUSETTS, MICHIGAN, NEW JERSEY, NEW YORK, [added: OREGON,] PENNSYLVANIA, [removed: TEXAS] [added: TEXAS, VIRGINIA] AND WASHINGTON, ADVERSE ECONOMIC CONDITIONS OR REGULATORY CHANGES IN THESE STATES COULD ADVERSELY AFFECT OUR FINANCIAL CONDITION.
A significant portion of our business is concentrated in California, Florida, Georgia, Indiana, [added: Kansas,] Massachusetts, Michigan, New Jersey, New York, [added: Oregon,] Pennsylvania, [removed: Texas] [added: Texas, Virginia] and Washington.
For the years ended December 31, [removed: 2012, 2011] [added: 2013, 2012] and [removed: 2010,] [added: 2011,] we derived [removed: $933.2] [added: $1,123.7] million or [removed: 78.5%, $765.7] [added: 82.9%, $976.7] million or [removed: 76.1%] [added: 82.1%] and [removed: $739.0] [added: $803.5] million, or [removed: 76.4%,] [added: 79.9%,] of our commissions and fees, respectively, from our operations located in these states.
In addition, as and to the extent that banks, securities firms and insurance companies affiliate, the financial services industry may experience further consolidation, and we therefore may experience increased competition from insurance companies and the financial services industry, as a growing number of larger financial institutions increasingly, and aggressively, offer a wider variety of financial services, including [removed: insurance,] [added: insurance intermediaries,] than we currently offer.
These commissions generally have accounted for 4.3% to [removed: 5.7%] [added: 4.4%] of our previous year’s total annual revenues over the last three years.
Due [removed: to] [added: to, among other things, potentially poor macroeconomic conditions,] the inherent uncertainty of loss in our industry and changes in underwriting criteria due in part to the high loss ratios experienced by insurance companies, we cannot predict the payment of these profit-sharing contingent commissions.
Further, we have no control over the ability of insurance companies to estimate loss reserves, which affects our ability to make profit-sharing [removed: calculations.]
While [removed: they] [added: our key personnel] are prohibited [added: by contract] from soliciting our employees and [removed: customers,] [added: customers for a period of years following separation from employment with us,] they are not prohibited from competing with us.
Although we operate with a decentralized management system, the loss of our senior managers or other key personnel, or our inability to [added: continue to] identify, recruit and retain such personnel, could materially and adversely affect our business, operating results and financial condition.
HEALTHCARE REFORM AND INCREASED COSTS OF CURRENT EMPLOYEES’ MEDICAL AND OTHER BENEFITS COULD HAVE A MATERIALLY ADVERSE [removed: AFFECT] [added: EFFECT] ON OUR BUSINESS.
We are susceptible to losses and interruptions caused by hurricanes (including in Florida, where our headquarters are located), earthquakes (including California, where we maintain a relatively large number of [removed: offices, including those acquired in the Arrowhead transaction),] [added: offices),] power shortages, telecommunications failures, water shortages, floods, fire, extreme weather conditions, geopolitical events such as terrorist acts and other natural or manmade disasters.
At December 31, [removed: 2012,] [added: 2013,] our executive officers, directors and certain of their family members collectively beneficially owned approximately [removed: 18.4%] [added: 18.3%] of our outstanding common stock, of which J.
Hyatt Brown, our Chairman, and his family members, which include his [removed: son Powell Brown, our President and Chief Executive Officer, beneficially owned approximately 16.6%.][added: sons, J.]
In response to the requirements of these Acts, the SEC and the New York Stock Exchange have promulgated and will [added: likely] continue to promulgate new rules on a variety of subjects.
[removed: Likewise, these] [added: These] developments [added: have increased (and] may [added: increase in the future) our compliance costs, may] make it more difficult [added: and more expensive] for us to [added: obtain director and officer liability insurance, and may make it more difficult for us to] attract and retain qualified members of our Board of Directors or qualified executive officers.
[removed: For example,] [added: Also,] as global warming issues become more prevalent, the U.S. and foreign governments are beginning to respond to these issues.
IF WE RECEIVE OTHER THAN AN UNQUALIFIED OPINION ON THE ADEQUACY OF OUR INTERNAL CONTROL OVER FINANCIAL REPORTING AS OF DECEMBER 31, [removed: 2013] [added: 2014] AND FUTURE YEAR-ENDS AS REQUIRED BY SECTION 404 OF SARBANES-OXLEY, INVESTORS COULD LOSE CONFIDENCE IN THE RELIABILITY OF OUR FINANCIAL STATEMENTS, WHICH COULD RESULT IN A DECREASE IN THE VALUE OF [removed: YOUR] [added: OUR] SHARES.
In 2012, the economic conditions in the middle-market economy appeared to stabilize, and a gradual improvement continued through 2013.
Also, if general economic conditions are poor, some of our clients may cease operations completely or be acquired by other companies, which could have an adverse effect on our results of operations and financial condition.
If these clients are affected by poor economic conditions but yet remain in existence, they may face liquidity problems or other financial difficulties which could result in delays or defaults in payments owed to us, which could have a significant adverse impact on our consolidated financial condition and results of operations.
all of which could have a material adverse effect on the results of our operations, financial condition and cash flows.
Post-acquisition deterioration of targets could also result in lower or negative earnings contribution and/or goodwill impairment charges.
Capacity could also be reduced by insurance companies failing or withdrawing from writing certain coverages that we offer our clients.
Also, the failure of an insurer with whom we place business could result in errors and omissions claims against us by our clients, which could adversely affect our results of operations and financial condition.
In addition, given the long-tail nature of professional liability claims, errors and omissions matters can relate to matters dating back many years.
In addition, we acquired retail operations based in Hamilton, Bermuda and George Town, Cayman Islands in July 2013 as part of the Beecher Carlson transaction.
Other competitive concerns may include the quality of our products and services, our pricing and the ability of some of our customers to self-insure.
As a result, such regulation and supervision could reduce our profitability or growth by increasing compliance costs, restricting the products or services we may sell, the markets we may enter, the methods by which we may sell our products and services, or the prices we may charge for our services and the form of compensation we may accept from our clients, carriers and third parties.
calculations.
In addition, we may not be able to develop and implement new technologies as quickly as our competitors.
While we have taken, and continue to take, actions to protect the security and privacy of our information, entirely eliminating all risk of improper access to private information is not possible.
Powell Brown, our President and Chief Executive Officer and P.
Barrett Brown, one of our Regional Vice Presidents, beneficially owned approximately 16.4%.
Legislative developments that could adversely affect us include: changes in our business compensation model as a result of regulatory developments (for example, the 2010 Health Care Reform Legislation); and federal and state governments establishing programs to provide health insurance or, in certain cases, property insurance in catastrophe-prone areas or other alternative market types of coverage, that compete with, or completely replace, insurance products offered by insurance carriers.
##### [Table of Contents](#toc)
This was the first time we have opened an office outside the United States.
As previously disclosed, certain of our former executive officers ceased employment with us during the past three years.
Compliance with these new rules has increased our legal and financial and accounting costs.
While these costs are no longer increasing, they may in fact increase in the future.
These developments may make it more difficult and more expensive for us to obtain director and officer liability insurance, and we may be forced to accept reduced coverage or incur substantially higher costs to obtain coverage.
Item 7. Management’s Discussion and Analysis of Financial Condition and Results of Operations.
226 rewritten, 101 added, 80 removed, 354 unchanged
Read the full itemFY2013 item · filed February 28, 2014FY2012 item · filed March 1, 2013
Historically, our revenues have typically grown as a result of [removed: an intense] [added: our] focus on net new business growth and acquisitions.
We [added: attempt to] foster a strong, decentralized sales culture with a goal of consistent, sustained growth over the long term.
We increased revenues every year from 1993 to [removed: 2012,] [added: 2013,] with the exception of 2009, when our revenues dropped 1.0%.
Our revenues grew from $95.6 million in 1993 to [removed: $1.2] [added: $1.4] billion in [removed: 2012,] [added: 2013,] reflecting a compound annual growth rate of 14.2%.
In the same [removed: 19] [added: 20] year period, we increased net income from $8.0 million to [removed: $184.0] [added: $217.1] million in [removed: 2012,] [added: 2013,] a compound annual growth rate of 17.9%.
[removed: Part of the decline in 2007 was the result of the increased governmental involvement in the Florida insurance marketplace, as described below in “The Florida Insurance Overview.” In 2010 and 2011,] [added: The] continued declining exposure units [added: during 2011 and 2010] had a greater negative impact on our commissions and fees revenues than declining insurance premium rates.
In the event that the gradual increases in insurance premium rates and insurable exposure units that occurred in [removed: 2012] [added: 2013] continue [removed: in 2013,] [added: into 2014,] we [removed: should continue] [added: expect] to see [added: continued] positive quarterly internal [added: revenue] growth rates [removed: in 2013.][added: on a year-over-year basis for 2014, excluding the impact relating to our Colonial Claims operation.]
Over the last three years, profit-sharing contingent commissions have averaged approximately [removed: 4.8%] [added: 4.4%] of the previous year’s total commissions and fees revenue.
[removed: In contrast, the term “core organic commissions and fees” is our] core commissions and fees [removed: less (i) the core commissions and fees] earned for the first twelve months by newly-acquired operations and (ii) divested business (core commissions and fees generated from offices, books of business or niches sold or terminated during the comparable period).
[removed: Core] [added: “Core] organic commissions and [removed: fees attempts] [added: fees” are reported in this manner in order] to express the current year’s core commissions and fees on a comparable basis with the prior year’s core commissions and fees.
The resulting net change reflects the aggregate changes [removed: from] [added: attributable to] (i) net new and lost accounts, (ii) net changes in our clients’ exposure units, and (iii) net changes in insurance premium rates.
[removed: In recent years,] [added: Beginning a few years ago,] five [added: to six] national insurance companies [removed: have] replaced [removed: the] [added: their] loss-ratio based profit-sharing contingent commission [removed: calculation] [added: agreements] with a [added: new] guaranteed fixed-base [removed: methodology,] [added: agreements,] referred to as “Guaranteed Supplemental Commissions” (“GSCs”).
As of December 31, [removed: 2012,] [added: 2013,] we accrued and earned [removed: $9.1] [added: $8.3] million [removed: from] [added: of] GSCs during [removed: 2012,] [added: 2013,] most of which will be collected in the first quarter of [removed: 2013.][added: 2014.]
For the twelve-month periods ended December 31, [removed: 2011] [added: 2013, 2012] and [removed: 2010,] [added: 2011,] we earned [removed: $12.1] [added: $8.3 million, $9.1] million and [removed: $13.4] [added: $12.1] million, respectively, [removed: from] [added: of] GSCs.
Fee revenues [removed: are] [added: have historically been] generated primarily by: (1) our Services Division, which provides insurance-related services, including third-party claims administration and comprehensive medical utilization management services in both the workers’ compensation and all-lines liability arenas, as well as Medicare set-aside services, Social Security disability and Medicare benefits advocacy services, and catastrophe claims adjusting services, and (2) our National Programs and Wholesale Brokerage Divisions, which earn fees primarily for the issuance of insurance policies on behalf of insurance companies.
Fee revenues, [added: on a consolidated basis,] as a percentage of our total commissions and fees, represented [removed: 21.7%] [added: 26.6%] in [removed: 2012, 16.4%] [added: 2013, 21.7%] in [removed: 2011] [added: 2012] and [removed: 14.6%] [added: 16.4%] in [removed: 2010.][added: 2011.]
Effective January 1, 2013, the FDIC ceased providing insurance guarantees on non-interest bearing checking [added: accounts and since that time we have invested in both interest bearing and non-interest bearing checking] accounts.
After [removed: five years of experiencing] [added: the five-year period extending from 2007 to 2011, in which we experienced] negative internal growth in our core organic commissions and fees revenue [removed: as] [added: which we believe was] a direct result of the general weakness of the economy, we achieved a [removed: 2.6%] positive internal revenue growth [removed: in 2012, which reflects a net growth] of [removed: $24.9 million] [added: 2.6%] in [removed: core organic commissions] [added: 2012,] and [removed: fees.][added: 6.7% in 2013.]
The net growth in core organic commissions and fees [added: in 2013] of [removed: $24.9] [added: $75.6] million is a significant improvement [removed: from] [added: over] the comparable [added: growth in 2012 of $24.9 million and the] net lost revenues of $21.5 million [removed: and $40.1 million] in [removed: 2011 and 2010, respectively.][added: 2011.]
[removed: This improvement] [added: The remaining growth in the core organic commissions and fees revenue] is principally attributable to rising insurance premium rates, and increasing insurance exposure units as a result of a gradually improving U. S. economy.
Income before income taxes in [removed: 2012] [added: 2013] increased over [removed: 2011] [added: 2012] by [removed: 12.7%,] [added: 17.3%,] or [removed: $34.3] [added: $52.8] million, to [removed: $304.8] [added: $357.6] million.
However, that net increase of [removed: $34.3] [added: $52.8] million includes [removed: $44.2] [added: $14.3] million of income before income taxes related to new acquisitions that were stand-alone offices, and therefore, income before income taxes from [removed: those] offices that existed in the same time periods of [removed: 2012] [added: 2013] and [removed: 2011] [added: 2012] (including the [removed: new acquisitions that “folded in” to those offices) decreased by $10.0 million.]
The net [removed: decrease] [added: increase] of [removed: $10.0] [added: $38.5] million related primarily to: (1) [removed: $5.4] [added: net new business, (2) a $2.6] million [added: benefit] from a change in estimated acquisition earn-out payables, [removed: (2) $1.9 million of increased interest expense related to the Arrowhead acquisition, (3) $1.7 million in increased non-cash stock-based compensation primarily due to new grants issued,] and [removed: (4)] [added: (3) a one-time] $6.8 million [added: bonus] earned [added: in 2012] by our Retail Division commissioned producers as a result of a special [removed: one-time bonus] program for those whose 2012 production exceeded their 2011 production by at least [removed: 5%.][added: five percent.]
Therefore, excluding these items, income before income taxes from those offices that existed in the same time periods of [removed: 2012] [added: 2013] and [removed: 2011] [added: 2012] (including the new acquisitions that “folded in” to those offices) increased by [removed: only $5.8] [added: $37.7] million.
Approximately [removed: 37,500] [added: 38,500] independent insurance agencies are estimated to be operating currently in the United States.
From 1993 through [removed: 2012,] [added: 2013,] we acquired [removed: 440] [added: 449] insurance intermediary operations, excluding acquired books of business (customer accounts).
| | | Number of Acquisitions | | | | | | | | Estimated Annual | | | | Net Cash | | | | Notes | | | | Other | | | | Liabilities | | | | [removed: Recorded Earn-out] [added: Recorded Earn-out] | | | | Aggregate Purchase | | |
On January 9, 2012, we completed the acquisition of Arrowhead [added: General Insurance Agency Superholding Corporation (“Arrowhead”)] pursuant to a merger agreement dated December 15, 2011 (the “Merger Agreement”).
Under the Merger Agreement, the total cash purchase price of $395.0 million [removed: is] [added: was] subject to adjustments for options to purchase shares of Arrowhead’s common stock, working capital, sharing of net operating tax losses, Arrowhead’s preferred stock units, transaction expenses, and closing debt.
Subsequent commission adjustments are recognized upon our receipt of notification from insurance companies concerning matters necessitating such [removed: adjustments from insurance companies.][added: adjustments.]
Fair value is estimated based on multiples of earnings before interest, income taxes, depreciation, amortization and change in estimated acquisition earn-out payables [removed: (“EBITDAC”).][added: (“EBITDAC”), or on a discounted cash flow basis.]
[removed: If these estimates or related] assumptions change in the future, we may be required to revise the assessment and, if appropriate, record an impairment charge.
We completed our most recent evaluation of impairment for goodwill as of November 30, [removed: 2012] [added: 2013] and determined that the fair value of goodwill exceeded the carrying value of such assets.
Additionally, there have been no impairments recorded for amortizable intangible assets for the years ended December 31, [removed: 2012, 2011] [added: 2013, 2012] and [removed: 2010.][added: 2011.]
RESULTS OF OPERATIONS FOR THE YEARS ENDED DECEMBER 31, [removed: 2012, 2011] [added: 2013, 2012] AND [removed: 2010][added: 2011]
| | | [removed: 2012] [added: 2013] | | | | [removed: Percent Change] [added: Percent Change] | | | | [removed: 2011] [added: 2012] | | | | [removed: Percent Change] [added: Percent Change] | | | | [removed: 2010] [added: 2011] | | |
| Core commissions and fees | | $ | [removed: 1,136,252] [added: 1,295,977] | | | | [removed: 19.5] [added: 14.1] | % | | $ | [removed: 950,685] [added: 1,136,252] | | | | [removed: 5.8] [added: 19.5] | % | | $ | [removed: 898,833] [added: 950,685] | |
| Profit-sharing contingent commissions | | | [removed: 43,683] [added: 51,251] | | | | [removed: 1.1] [added: 17.3] | % | | | [removed: 43,198] [added: 43,683] | | | | [removed: (21.1] [added: 1.1] | [removed: )%] [added: %] | | | [removed: 54,732] [added: 43,198] | |
| Guaranteed supplemental commissions | | | [removed: 9,146] [added: 8,275] | | | | [removed: (24.3] [added: (9.5] | )% | | | [removed: 12,079] [added: 9,146] | | | | [removed: (9.5] [added: (24.3] | )% | | | [removed: 13,352] [added: 12,079] | |
| Investment income | | | [removed: 797] [added: 638] | | | | [removed: (37.1] [added: (19.9] | )% | | | [removed: 1,267] [added: 797] | | | | [removed: (4.4] [added: (37.1] | )% | | | [removed: 1,326] [added: 1,267] | |
This growth trend has continued into 2013 with our consolidated internal revenue growth rate of 6.7%.
Additionally, each of our four divisions recorded positive internal revenue growth for each quarter in 2013 except for the Services Division in the fourth quarter.
The decline in the core organic commissions and fees revenues in the fourth quarter of 2013 for the Services Division was the result of the significant revenue recorded at our Colonial Claims operation in the fourth quarter of 2012 attributable to Superstorm Sandy for which no comparable revenues occurred in the fourth quarter of 2013.
In the first quarter of 2013, Colonial Claims earned claims fees of $17.2 million as a direct result of the continued significant claims activity from Superstorm Sandy.
Absent another major flooding event, we estimate Colonial Claims revenues for the first quarter of 2014 to be less than $1.0 million.
In contrast, the term “core organic commissions and fees” is our core commissions and fees less (i) the
For 2013, only four national insurance companies still used GSCs in lieu of loss-ratio based profit-sharing contingent commissions.
However, in conjunction with our July 1, 2013 acquisition of Beecher Carlson, which has a primary focus on large retail customers that generally pay us fees directly, the fee revenues in our Retail Division for 2013 have increased by nearly $40.0 million to $73.0 million.
For 2014, we expect the total fees in our Retail Division to be approximately $110.0 million.
Other income primarily reflects net gains on sales of customer accounts and fixed assets, but will also include sub-rental income, legal settlements and other miscellaneous income.
2013 was a strong year for revenue growth and continued the positive trends that began in 2012.
Of the $75.6 million growth in the 2013 core organic commissions and fees, $38.1 million was generated by two new programs at our Arrowhead operation, the automobile aftermarket program and the non-standard auto program, and from our Colonial Claims operation as a result of the significant claims activity attributable to Superstorm Sandy.
We continue to be successful in acquiring insurance operations that we believe are strategic in growing our business Divisions.
In each of the last two years, we completed acquisitions with aggregate revenues in excess of $142.8 million: nine acquisitions in 2013 with estimated revenues of $142.8 million, and 20 acquisitions in 2012 with estimated revenues of $149.6 million.
For 2014, we are continuing this trend with the announced acquisition of Wright Insurance Group, with estimated annualized revenues of $120.0 million, which is expected to close on or around April 1, 2014.
new acquisitions that “folded in” to those offices) increased by $38.5 million.
These net increases were partially off-set by a $6.6 million increase in non-cash stock-based compensation primarily due to new grants issued in July 2013.
| 2013 | | | 8 | | | | 1 | | | $ | 142.8 | | | $ | 408.1 | | | $ | — | | | $ | 0.5 | | | $ | 106.1 | | | $ | 5.1 | | | $ | 519.8 | |
On July 1, 2013, we completed the acquisition of Beecher Carlson Holdings, Inc. (“Beecher Carlson”), an insurance and risk management broker with operations that include retail brokerage, program management and captive management.
The aggregate purchase price for Beecher Carlson was $469.3 million, including $364.3 million of cash payments and the assumption of $105.0 million of liabilities.
Beecher Carlson was acquired primarily to expand Brown & Brown’s Retail and National Programs businesses, and to attract and hire high-quality individuals.
On January 15, 2014 ,as previously announced, we entered into an agreement to acquire The Wright Insurance Group, LLC (“Wright”), with estimated annualized revenues of $120.0 million.
This transaction is expected to close on or around April 1, 2014.
Wright’s operations include a national flood insurance program, government-sponsored insurance programs and proprietary national and regional programs.
The total net consideration to be paid for the ownership interests of Wright is $602.5 million in addition to contingent consideration of up to $37.5 million if Wright completes certain agreed-upon acquisitions prior to closing.
The transaction is subject to customary closing conditions, including Hart-Scott-Rodino approval and other related regulatory approvals.
If these estimates or related
Profit-sharing contingent commissions and GSCs increased $6.7 million or 12.7% in 2013 to $59.5 million, due primarily to $4.7 million, $0.6 million, and $1.3 million increases in profit-sharing contingent commissions and GSCs in our Retail, National Programs and Wholesale Brokerage Divisions, respectively.
Core commissions and fees revenue in 2013 increased $159.7 million, of which approximately $91.5 million represented core commissions and fees from acquisitions that had no comparable revenues in 2012.
After taking into account divested business of $7.4 million, the remaining net increase of $75.6 million, representing net new business, reflects a 6.7% internal growth rate for core organic commissions and fees.
Investment income decreased to $0.6 million in 2013, compared with $0.8 million in 2012, mainly due to lower average daily invested balances in 2013 than in 2012.
However, that net increase included $37.6 million of new compensation costs related to new acquisitions that were stand-alone offices.
The employee compensation and benefit increases from these offices were primarily related to increases in staff and management salaries of $16.6 million, new salaried producers of $4.7 million, profit center and other related bonuses of $3.4 million, compensation to our commissioned producers of $5.7 million, health insurance costs of $1.8 million, payroll-related taxes of $3.7 million, and other net expenses of $1.0 million.
Non-cash stock-based compensation increased 42.5%, or $6.7 million in 2013 over 2012, primarily as a result of new non-vested stock awards granted on July 1, 2013 under our Stock Incentive Plan (“SIP”).
Most of these SIP grants will typically vest in four to seven years, subject to the achievement of certain performance criteria by grantees, and the achievement of consolidated earnings per share growth at certain levels by us, over three-to five-year measurement periods.
Some SIP grants will vest after five years of service.
Non-cash stock-based compensation increased 41.7%, or $4.7 million in 2012 over 2011, as a result of new grants under our Stock Incentive Plan (“SIP”).
Of the $8.8 million increase, $2.0 million related to increased data processing and software licensing expense, $2.0 million related to increased inspection and consulting fees, $1.6 million related to increased accounting and advisory fees, $0.9 million related to increased employee sales meeting costs, and $2.9 million related to other various, net cost increases.
These increased costs were partially offset by a decrease of $0.6 million for legal, claims and litigation expenses.
Depreciation increased 13.7% in 2013, and 24.1% in 2012.
As of January 2013, our senior leadership group included eight executive officers with regional responsibility for oversight of designated operations within the Company, and four regional vice presidents in our Retail Division and one regional vice president in our Wholesale Brokerage Division who report directly to one of our executive officers.
In October 2012, Kathy Colangelo was promoted to be Regional Vice President of our Wholesale Brokerage Division.
For 2012, our consolidated internal revenue growth rate was 2.6%.
Florida Insurance Overview
Many states have established “Residual Markets,” which are governmental or quasi-governmental insurance facilities that are intended to provide coverage to individuals and/or businesses that cannot buy insurance in the private marketplace, i.e., “insurers of last resort.” These facilities can be designed to cover any type of risk or exposure; however, the exposures most commonly subject to such facilities are automobile or high-risk property exposures.
Residual Markets can also be referred to as FAIR Plans, Windstorm Pools, Joint Underwriting Associations, or may even be given names styled after the private sector like “Citizens Property Insurance Corporation” in Florida.
In August 2002, the Florida Legislature created “Citizens Property Insurance Corporation” (“Citizens”), to be the “insurer of last resort” in Florida.
Initially, Citizens charged insurance rates that were higher than those generally prevailing in the private insurance marketplace.
In each of 2004 and 2005, four major hurricanes made landfall in Florida.
As a result of the ensuing significant insurance property losses, Florida property insurance rates increased in 2006.
To counter the higher property insurance rates, the State of Florida instructed Citizens to significantly reduce its property insurance rates beginning in January 2007.
By state law, Citizens guaranteed these rates through January 1, 2010.
As a result, Citizens became one of the most, if not the most, competitive risk-bearers for a large percentage of Florida’s commercial habitational coastal property exposures, such as condominiums, apartments, and certain assisted living facilities.
Additionally, Citizens became the only insurance market for certain homeowner policies throughout Florida.
Today, Citizens is one of the largest underwriters of coastal property exposures in Florida.
In 2007, Citizens became the principal direct competitor of the insurance companies that underwrite the condominium program administered by one of our indirect subsidiaries, Florida Intracoastal Underwriters, Limited Company (“FIU”), and the excess and surplus lines insurers represented by wholesale brokers such as Hull & Company, Inc., another of our subsidiaries.
Consequently, these operations lost significant amounts of revenue to Citizens.
From 2008 through 2012, Citizens’ impact was not as dramatic as it had been in 2007; FIU’s core commissions and fees decreased 19.7% during this four-year period.
Citizens continued to be competitive against the excess and surplus lines insurers, and therefore Citizens negatively affected the revenues of our Florida-based wholesale brokerage operations, such as Hull & Company, Inc., from 2007 through 2012, although the impact has been decreasing each year.
Citizens’ impact on our Florida retail offices was less severe than on our National Programs and Wholesale Brokerage Division operations because our retail offices have the ability to place business with Citizens, although at slightly lower commission rates and with greater difficulty than with other insurance companies.
Effective January 1, 2010, Citizens raised its insurance rates, on average, 10% for properties with values of less than $10 million, and more than 10% for properties with values in excess of $10 million.
Citizens raised its insurance rates again in 2011 and 2012, and is expected to continue to increase its insurance rates in 2013.
Our commission revenues from Citizens for 2012, 2011 and 2010 were approximately $6.4 million, $7.8 million, and $8.3 million, respectively.
If, as expected, Citizens continues to attempt to reduce its insured exposures, the financial impact of Citizens on our business should continue to be reduced in 2013.
2012 was an important transition year.
We have also succeeded in acquiring insurance operations that we believe may be of incrementally higher quality in each of the last three years.
We completed 20 acquisitions in 2012, compared with the 38 and 33 acquisitions made in 2011 and 2010, respectively.
However, the estimated annualized revenues from the 2012 acquisitions (excluding acquired books of business (customer accounts)) were $149.6 million, an increase over the $88.7 million and $70.6 million that we acquired in 2011 and 2010, respectively.
| 2010 | | | 33 | | | | — | | | $ | 70.6 | | | $ | 158.6 | | | $ | 0.8 | | | $ | — | | | $ | 2.3 | | | $ | 25.1 | | | $ | 186.8 | |
Profit-sharing contingent commissions decreased $11.5 million to $43.2 million in 2011, with the decrease primarily due to reductions in amounts paid to offices in our National Programs and Wholesale Brokerage Divisions.
Core organic commissions and fees revenue decreased 2.4% in 2011.
The 2011 decrease of 2.4% represents $21.5 million of net lost core commissions and fees revenue, of which $21.2 million was attributable to our Retail Division.
The declines in profit-sharing contingent commissions and core organic commissions and fees during 2011 were more than offset by the addition of $77.6 million of core commissions and fees revenue from acquired operations.
Investment income of $1.3 million in 2011 was effectively flat as compared with 2010.
Even though the average daily invested balance in 2011 was higher in 2010, the lower income yields negated any income growth.
The employee compensation and benefit reductions from these offices were primarily related to reductions in staff and management salaries of $6.8 million and reductions in commissions paid to producers of $2.8 million; the aggregate of which was partially off-set by an increase in bonuses of $2.7 million.
Non-cash stock-based compensation increased 63.5%, or $4.3 million, in 2011 as a result of new grants under our SIP that will vest in six to ten years, subject to the achievement of certain performance criteria by grantees, and the achievement of consolidated EPS growth at certain levels by us, over a five-year measurement period ending December 31, 2015.
Of the $3.0 million decrease, $2.7 million
Of the $1.8 million decrease, $2.4 million related to reductions in office rents and related expenses, and $1.9 million related to lower insurance costs.
These cost savings were partially offset by a $2.6 million increase in legal costs which was primarily related to the enforcement of restrictive covenants contained in our employment agreements with former employees.
An excerpt. Shown here: 40 of 226 rewritten, 40 of 101 added and 40 of 80 removed. The counts are complete. For every sentence, read Item 7. Management’s Discussion and Analysis of Financial Condition and Results of Operations. in the FY2013 filing and the FY2012 filing.
Item 7A. Quantitative and Qualitative Disclosures About Market Risk.
1 rewritten, 0 added, 1 removed, 7 unchanged
Read the full itemFY2013 item · filed February 28, 2014FY2012 item · filed March 1, 2013
The fair values of our cash and cash equivalents, restricted cash and investments, and certificates of deposit at December 31, [removed: 2012] [added: 2013] and [removed: 2011] [added: 2012] approximated their respective carrying values due to their short-term duration and, therefore, such market risk is not considered to be material.
##### [Table of Contents](#toc)
Item 1. Business.
64 rewritten, 28 added, 28 removed, 150 unchanged
Read the full itemFY2013 item · filed February 28, 2014FY2012 item · filed March 1, 2013
Fee revenues are generated primarily by: (1) our Services Division, which provides insurance-related services, including third-party claims administration and comprehensive medical utilization management services in both the workers’ compensation and all-lines liability arenas, as well as Medicare set-aside services, Social Security disability and Medicare benefits advocacy services, and catastrophe claims adjusting services, [removed: and] (2) our National Programs and Wholesale Brokerage Divisions, which earn fees primarily for the issuing of insurance policies on behalf of insurance [removed: carriers.][added: carriers, and (3) our Retail Division for fees received in lieu of commissions, primarily since our July 1, 2013 acquisition of Beecher Carlson which services many larger fee-based accounts.]
As of December 31, [removed: 2012,] [added: 2013,] our activities were conducted in [removed: 218] [added: 245] locations in [removed: 37] [added: 41] states as [removed: follows and one] [added: follows, an] office in London, [removed: England:][added: England, Hamilton, Bermuda, and George Town, Cayman Islands:]
| New Jersey | | [removed: | 11 |] [added: 10] | | [removed: Arkansas] [added: Virginia] | | | [removed: 3] [added: 4] | | | Montana | | | 1 | |
| Louisiana | | [removed: |] 7 | | [removed: | Oregon] [added: New Mexico] | | | 3 | | | Utah | | | 1 | |
| Illinois | | [removed: |] 6 | | [removed: |] South Carolina | | | 3 | | | [removed: Wisconsin] [added: West Virginia] | | | 1 | |
| [removed: Oklahoma | |] [added: Florida] | [removed: 5] | [added: 40] | | [removed: Kansas] [added: Oklahoma] | | | [removed: 2] [added: 5] | | | [added: Kansas] | | | [added: 2] | |
Premium pricing within the property and casualty insurance underwriting (risk-bearing) industry has historically been [removed: cyclical, displaying a high degree of volatility] [added: cyclical in nature, and has varied widely] based on [removed: prevailing economic and competitive] [added: market] conditions.
In 2004, as general premium rates continued to moderate, the [removed: insurance industry] [added: southeastern United States] experienced the worst hurricane season since 1992 (when Hurricane Andrew hit south [removed: Florida).][added: Florida), and the following year brought this region the worst hurricane season ever recorded.]
As a result of the significant losses incurred by insurance companies [removed: from] [added: due to] these hurricanes, [added: property and casualty] insurance premium rates [removed: in 2006] increased on coastal property, primarily in the southeastern [removed: region of the] United [removed: States.][added: States, in 2006, while otherwise generally declining during 2006 and 2007.]
Although [added: property and casualty] insurance premium rates [removed: declined] [added: generally continued to decline] from 2008 through 2011 in most lines of coverage, the rates of decline [removed: appeared to be] [added: were] slowing.
However, [removed: during] [added: from] the second half of 2008 through 2011, insurable exposure units, such as sales and payroll expenditures, [removed: declined significantly due to the weakening economy,] [added: decreased significantly,] primarily in the southeastern and western [removed: parts] [added: regions] of the United [removed: States.][added: States, due to the economic recession, and this decrease had a greater adverse impact on our commissions and fees revenue than did declining insurance premium rates in this period.]
[removed: In] [added: From] the first quarter of [removed: 2012,] [added: 2012 through 2013,] insurance premium rates [removed: began to] gradually [removed: increase] [added: increased] for most lines of [removed: coverage.][added: coverage, and insurable exposure units began to flatten and in many cases, increase.]
As a [removed: result of increases] [added: result,] in [removed: both insurance premium rates and insurable exposure units,] [added: 2012,] we achieved positive internal organic [removed: revenue growth of our 2012] core commissions and fees [added: revenue growth] for the first time since 2006.
[removed: General] [added: We currently expect that property and casualty] insurance premium rates and insurable exposure units [removed: are expected to] [added: will generally] continue to [added: increase] modestly and gradually [removed: increase] during [removed: 2013.][added: 2014, subject to continued improvement in the economic environment.]
The following table summarizes (1) the commissions and fees revenue generated by each of our reportable operating segments for [removed: 2012, 2011] [added: 2013, 2012] and, [removed: 2010,] [added: 2011,] and (2) the percentage of our total commissions and fees revenue represented by each segment for each such period:
| _(in thousands, except percentages)_ | | [removed: 2012] [added: 2013] | | | | % | | | | [removed: 2011] [added: 2012] | | | | % | | | | [removed: 2010] [added: 2011] | | | | % | | |
| Retail Division | | $ | [removed: 639,708] [added: 725,159] | | | | [removed: 53.7] [added: 53.5] | % | | $ | [removed: 604,966] [added: 639,708] | | | | [removed: 60.2] [added: 53.7] | % | | $ | [removed: 573,809] [added: 604,966] | | | | [removed: 59.3] [added: 60.2] | % |
| National Programs Division | | | [removed: 251,929] [added: 291,014] | | | | [removed: 21.2] [added: 21.5] | % | | | [removed: 164,352] [added: 251,929] | | | | [removed: 16.3] [added: 21.2] | % | | | [removed: 175,838] [added: 164,352] | | | | [removed: 18.2] [added: 16.3] | % |
| Wholesale Brokerage Division | | | [removed: 182,822] [added: 209,493] | | | | 15.4 | % | | | [removed: 172,547] [added: 182,822] | | | | [removed: 17.2] [added: 15.4] | % | | | [removed: 170,150] [added: 172,547] | | | | [removed: 17.6] [added: 17.2] | % |
| Services Division | | | [removed: 116,247] [added: 131,033] | | | | [removed: 9.8] [added: 9.7] | % | | | [removed: 64,875] [added: 116,247] | | | | [removed: 6.4] [added: 9.8] | % | | | [removed: 46,336] [added: 64,875] | | | | [removed: 4.8] [added: 6.4] | % |
| Other | | | [removed: (1,625] [added: (1,196] | ) | | | (0.1 | )% | | | [removed: (778] [added: (1,625] | ) | | | (0.1 | )% | | | [removed: 784] [added: (778] | [added: )] | | | [removed: 0.1] [added: (0.1] | [removed: %] [added: )%] |
| Total | | $ | [removed: 1,189,081] [added: 1,355,503] | | | | 100.0 | % | | $ | [removed: 1,005,962] [added: 1,189,081] | | | | 100.0 | % | | $ | [removed: 966,917] [added: 1,005,962] | | | | 100.0 | % |
We conduct all of our operations within the United States of America, except for one wholesale brokerage operation based in London, [removed: England] [added: England, and retail operations based in Hamilton, Bermuda and George Town, Cayman Islands] that [removed: commenced business] [added: were acquired] in [removed: March 2008.][added: July 2013 as part of the Beecher Carlson transaction.]
[removed: This operation] [added: These operations] earned [removed: $9.7] [added: $12.2] million, [removed: $9.1] [added: $9.7] million and [removed: $9.9] [added: $9.1] million of revenues for the years ended December 31, [removed: 2012, 2011] [added: 2013, 2012] and [removed: 2010,] [added: 2011,] respectively.
As of December 31, [removed: 2012,] [added: 2013,] our Retail Division employed [removed: 3,240] [added: 3,566] persons.
During [removed: 2012,] [added: 2013,] commissions and fees from our largest single Retail Division customer represented less than one [removed: quarter] [added: third] of one percent [removed: (0.25%)] [added: (0.33%)] of the Retail Division’s total commissions and fees revenue.
As of December 31, [removed: 2012,] [added: 2013,] our National Programs Division employed [removed: 1,373] [added: 1,432] persons.
| | • | | _Allied Protector [removed: Plan:_ The] [added: Plan®:_] Allied Protector [removed: PlanSM (“APP”)SM] [added: Plan® (“APP®”)] specializes in customized professional liability and business insurance programs for individual practitioners and businesses in the healthcare industry. The [removed: AAP] [added: APP] program offers [removed: coverage to include, but not limited to,] liability insurance [removed: for] [added: coverage for, among others,] dental hygienists and dental assistants, home health agencies, physical therapy clinics, and medical directors. Also available through the [removed: AAP] [added: APP] program is cyber/data breach insurance offering a solution to privacy breaches and information security exposures tailored to the needs of healthcare organizations. |
| | • | | _Dentists_: [removed: Presented] [added: First initiated] in 1969, the Professional Protector [removed: Plan] [added: Plan®] (“PPP®”) [added: for Dentists] provides dental professionals insurance products including professional and general liability, property, employment practices liability, workers compensation, claims and risk management. The [removed: PPP®] [added: PPP] recognized the importance of policyholder and customer service and developed a customized, proprietary, web-based rating and policy issuance system which in turn provides a seamless policy delivery resource and access to policy information on a real time basis. Obtaining endorsements from state and local dental societies and associations plays an integral role in the [removed: PPP®] [added: PPP] partnership. The PPP is offered in all 50 states, District of Columbia, Puerto Rico and the Virgin Islands. |
| | • | | _Financial Professionals_: CalSurance® and CITA Insurance [added: Services®] have specialized in this niche since 1980 and offer professional liability programs designed for insurance agents, financial advisors, registered representatives, securities broker-dealers, benefit administrators, real estate brokers and real estate title agents. An important aspect of [removed: CalSurance®] [added: CalSurance] is Lancer Claims Services, which provides specialty claims administration for insurance companies underwriting [removed: CalSurance®] [added: CalSurance] product lines. |
| | • | | _Lawyers_: The Lawyer’s Protector Plan® (“LPP®”), for [removed: 25] [added: 30] years, has been providing professional liability insurance with a niche focus on law firms with [removed: 1-50] [added: 1-20] attorneys. The [removed: LPP®] [added: LPP] program handles all aspects of insurance operations including underwriting, distribution management, policy issuance and claims. The [removed: LPP®] [added: LPP] is offered in [removed: 45] [added: 44] states. |
| | • | | _Real Estate [added: Title] Professionals:_ TitlePac® provides professional liability products and services designed for real estate title agents and escrow agents in 47 states and the District of Columbia. |
| | • | | _Wedding [removed: Protector_ _Plan® and Event] Protector [removed: Plan®:_ Wedding Protector] Plan® and [removed: Event] Protector [removed: Plan®] [added: Plan®_ _for Events_] provide an online wedding/private event cancellation and postponement insurance policy that offers financial protection if certain unfortunate, unforeseen events should occur during the period leading up to and including the [removed: wedding day. General liability] [added: wedding/event date. Liability] and liquor liability [removed: insurance products are also offered.] [added: is available as an option.] Both the Wedding [added: Protector Plan] and [removed: Event] Protector [removed: Plans] [added: Plan for Events] are offered in 47 states. |
| | • | | _Architects and Engineering_, operating as Arrowhead Design Insurance [removed: (“ADI”)] [added: (“ADI”),] is a leading writer of professional liability insurance for architects, engineers and environmental consultants. ADI is a national program writing in 49 states. |
| | • | | _Automotive Aftermarket_ [removed: \- The Automotive Aftermarket Program] is a new program launched in 2012 in conjunction with Zurich American Insurance Company’s transfer of selected assets and employees to Arrowhead. The Automotive Aftermarket program writes commercial package insurance for non-dealership automotive services professionals such as auto recyclers, brake shops, equipment dealers, mechanical repairs, oil and lube shops, parts retailers and wholesalers, tire retailers and wholesalers and transmission mechanics. |
| | • | | _Earthquake and DIC_ is a Differences-in-Conditions (“DIC”) Program writing, notably earthquake, flood, and the [removed: All Risk] [added: “All Risk”] insurance coverages to commercial property owners. The Earthquake and DIC program writes insurance on both a primary and excess layer basis. |
| | • | | _Personal Property_ provides a series of coverages for homeowners and renters in [removed: 17] [added: numerous] states. |
| | • | | _Wheels_ provides private passenger automobile and motorcycle coverage for a range of drivers. Arrowhead’s auto program offers two personal auto coverage types: one traditional non-standard auto product offering minimum state required liability limits and another targeting full coverage, multi-vehicle risks. The auto product is written in [removed: four states:] [added: several states including] California, [removed: Arizona, Michigan] [added: Georgia, Michigan, South Carolina] and Washington. |
| | • | | _Workers’ Compensation_ provides workers’ compensation insurance coverage [removed: in 43 states] [added: primarily] for California-based insureds. Arrowhead’s workers’ compensation program targets industry segments such as agriculture, contractors, food services, horticulture and manufacturing. |
| | • | | _Fabricare_: Irving Weber Associates, Inc. (“IWA”) has specialized in this niche since 1946, providing package insurance including workers’ compensation to dry cleaners, linen supply and uniform rental operations. [removed: They] [added: IWA] also [removed: offer] [added: offers] insurance programs for independent grocery stores and restaurants. |
| | | | | | | | | | | | | | | |
| --- | --- | --- | --- | --- | --- | --- | --- | --- | --- | --- | --- | --- | --- | --- |
| California | | 25 | | Arizona | | | 4 | | | Missouri | | | 2 | |
| New York | | 17 | | Kentucky | | | 4 | | | New Hampshire | | | 2 | |
| Washington | | 16 | | Michigan | | | 4 | | | Delaware | | | 1 | |
| Texas | | 15 | | Minnesota | | | 4 | | | Maryland | | | 1 | |
| Georgia | | 11 | | Tennessee | | | 4 | | | Mississippi | | | 1 | |
| Oregon | | 8 | | Arkansas | | | 3 | | | Nevada | | | 1 | |
| Colorado | | 7 | | Indiana | | | 3 | | | Rhode Island | | | 1 | |
| Pennsylvania | | 7 | | North Carolina | | | 3 | | | Vermont | | | 1 | |
| Massachusetts | | 6 | | Ohio | | | 3 | | | Wisconsin | | | 1 | |
| Connecticut | | 5 | | Hawaii | | | 2 | | | | | | | |
For example, in late 2003, after three years of a “hard” market in which premium rates were stable or increasing, the insurance industry experienced the return of a “soft” market, characterized by flat or reduced premium rates in many lines and geographic areas.
To counter the higher property insurance rates in Florida, The State of Florida directed its property “insurer of last resort,” “Citizens Property Insurance Corporation” (“Citizens”), to significantly reduce its rates beginning in January 2007 and extending through January 1, 2010.
As a result, several of our Florida-based operations lost significant amounts of revenue to Citizens in this period.
Since that time, Citizens’ impact on our operations has declined each year as Citizens has slowly increased its rates in an effort to reduce its insured exposures.
Our commission revenues from Citizens for 2013, 2012 and 2011 were approximately $5.7 million, $6.4 million, and $7.8 million, respectively.
If, as expected, this trend continues, the financial impact of Citizens on our business should continue to decrease in 2014.
In 2013, these rate and exposure unit increases, along with strong new business growth, generated positive internal organic revenue growth for each of our four reportable business divisions in each quarter, with the single exception of the fourth quarter for our Services Division, which experienced a record fourth quarter in 2012 as a result of the significant flood claims activity from Superstorm Sandy that was not replicated in 2013.
| | • | | _Certified Public Accountants:_ The CPA Protector Plan® is a specialty insurance program offering comprehensive professional liability insurance solutions and risk management services to CPA practitioners and their firms nationwide. Optional coverage enhancements allow insureds to round out their policy and coverage needs, including: Employment Practices Liability, Employee Dishonesty, Non-Profit Directors and Officers, as well as Network Security and Privacy Protection Coverage. |
| | • | | _Optometrists, Opticians, and Ophthalmologists_: Since 1973 the Optometric Protector Plan® (“OPP®”), has continually provided professional liability, general liability, property, workers’ compensation insurance and risk management programs for eye care professionals nationwide. Our carrier partners offer specialty insurance products tailored to the eye care profession, and our agents and brokers are chosen for their expertise. The OPP is offered in all 50 states. Through our strategic carrier partnerships, we have diversified our demographic and also offer professional liability coverage to Chiropractors, Podiatrists and Physicians nationwide. |
| | • | | _Professional Risk Specialty Group_: Professional Risk Specialty Group (“PRSG”) has been providing Errors & Omissions/Professional Liability/Malpractice Insurance for over 22 years both in a direct retail sales and brokering capacity. PRSG has been an exclusive State Administrator for a Lawyers Professional Liability Program since 1994 in Florida and Louisiana, as well as state appointments in 23 other states. The admitted Lawyers Program focuses on 1-19 attorney firms and the non-admitted program is for firms with 20+ attorneys and is available for primary or excess coverage. PRSG is also involved in direct sales and brokering for other professional lines, such as Accountants, Architects & Engineers, Medical Malpractice, Directors & Officers, Employment Practices Liability, Title Agency E&O and Miscellaneous E&O. |
| | • | | _OnPoint_ is an MGA with underwriting programs for tribal nations, manufactured housing, contractors’ equipment and various affinity programs. The largest program is the Tribal business which provides tailored risk management and insurance solutions for U.S. tribal nations. |
| | • | | _Acumen RE Management Corporation_ (“Acumen Re”) has been active in the facultative reinsurance casualty market since 1993, providing outsourced technical expertise in workers’ compensation, general liability and professional liability (directors and officers along with errors and omissions) reinsurance accounts. Acumen Re’s territory encompasses the entire United States, and this entity accesses insureds via approved reinsurance intermediaries strategically located throughout the country. |
| | • | | _AFC Insurance, Inc._ (“AFC”)(“Humanity Plus Program”) is a Program Administrator specializing in niche Property & Casualty products for a wide range of For-Profit and Nonprofit Human & Social Service organizations. Eligible risks include Addiction Treatment Centers, Adult Day Care Centers, Group Homes, Services for the Developmentally Disabled and more. AFC’s nationwide comprehensive program offers all lines of coverage. AFC also has a separate program for independent pizza/deli restaurants. |
| | • | | _ICA_ provides comprehensive claims management solutions for both personal and commercial lines of insurance. ICA is a national service provider for daily and catastrophe claims, vendor management, TPA operations and staff augmentation. ICA offers training and educational opportunities to independent adjusters nationwide in our regional training facilities. Other claims services we offer: first notice of loss, fast track, field appraisals, quality control and consulting. |
| --- | --- | --- | --- |
| --- | --- | --- | --- |
| | | | | | | | | | | | | | | | | |
| --- | --- | --- | --- | --- | --- | --- | --- | --- | --- | --- | --- | --- | --- | --- | --- | --- |
| Florida | | | 41 | | | Virginia | | | 5 | | | Missouri | | | 2 | |
| California | | | 20 | | | Connecticut | | | 4 | | | New Hampshire | | | 2 | |
| Washington | | | 16 | | | Kentucky | | | 4 | | | North Carolina | | | 2 | |
| New York | | | 15 | | | Massachusetts | | | 4 | | | Delaware | | | 1 | |
| Texas | | | 13 | | | Michigan | | | 4 | | | Hawaii | | | 1 | |
| Georgia | | | 9 | | | Minnesota | | | 3 | | | Nevada | | | 1 | |
| Pennsylvania | | | 7 | | | New Mexico | | | 3 | | | Ohio | | | 1 | |
| Colorado | | | 6 | | | Tennessee | | | 3 | | | West Virginia | | | 1 | |
| Indiana | | | 5 | | | Arizona | | | 2 | | | | | | | |
##### [Table of Contents](#toc)
From the mid-1980s through 1999, the property and casualty insurance industry experienced a “soft market” during which the underwriting capacity of insurance companies expanded, stimulating an increase in competition and a decrease in premium rates and related commissions.
The dampening effect of this softness in rates on our revenues was somewhat offset by our acquisitions and new business production.
As a result of increasing “loss ratios” (the comparison of incurred losses plus adjustment expenses against earned premiums) of insurance companies through 1999, premium rates generally increased beginning in the first quarter of 2000 and continuing into 2003.
During 2003, increases in premium rates began to moderate and, in certain lines of insurance, premium rates decreased.
The insured losses from the 2004 hurricane season were absorbed relatively easily by the insurance industry and the general insurance premium rates continued to soften during 2005.
During the third quarter of 2005, the insurance industry experienced the worst hurricane season ever recorded.
In the other regions of the United States, insurance premium rates generally declined during 2006.
In addition to significant insurance pricing declines in Florida (as discussed below) insurance premium rates continued to decline from 2007 through 2011 in most of the other U.S. regions.
From 2008 through 2011, declining exposure units had a greater adverse impact on our commissions and fees revenue than did declining insurance premium rates.
Correspondingly, insurable exposure units began to flatten, and in many cases, began to increase.
Effective January 1, 2012, certain profit center offices, with aggregate total revenues of $16.9 million and $13.1 million for 2011 and 2010, respectively, were reclassified from the National Programs Division to the Wholesale Brokerage Division, and as such, certain prior year amounts have been reclassified to conform to the current year presentation.
| | • | | _Certified Public Accountants:_ The CPA Protector Plan® offers professional liability insurance for certified public accountant practitioners and firms throughout the United States. |
| | • | | _Optometrists and Opticians_: Since 1973, The Optometric Protector Plan® (OPP®) provides professional liability program for Eye Care Professionals, nationwide. The OPP® program offers professional insurance products for Optometrists, Ophthalmologists, Opticians and Ophthalmic Technicians. The OPP® is offered in all 50 states. |
| | • | | _Acumen Re Management Corporation_ is a reinsurance underwriting management organization, primarily acting as an outsourced specific excess workers’ compensation, directors and officers’ liability, and errors and omissions liability facultative reinsurance underwriting facility. |
| | • | | _AFC Insurance, Inc._ (“AFC”) is a managing general underwriter, specializing in insurance products tailored to the health and human services industry. AFC works with retail agents in all states and targets home healthcare, group homes for the mentally and physically challenged, drug and alcohol facilities and programs for the developmentally disabled. AFC also has a separate program for independent pizza restaurants. |
| | • | | Southwest Assurance Corporation (“SAC”) is a program that insures governmental entities’ mosquito control operations. The SAC/mosquito program provides insurance coverage including general liability, pesticide applicators liability, commercial auto, property, D & O, crime, pollution, aviation, airport premises liability, underground storage tank, workers comp and chemical liability. The SAC/mosquito program is offered in 48 states. |
An excerpt. Shown here: 40 of 64 rewritten, all 28 added and all 28 removed. The counts are complete. For every sentence, read Item 1. Business. in the FY2013 filing and the FY2012 filing.
Cover and table of contents
38 rewritten, 2 added, 3 removed, 108 unchanged
Read the full itemFY2013 item · filed February 28, 2014FY2012 item · filed March 1, 2013
For the fiscal year ended December 31, [removed: 2012][added: 2013]
| Florida | | [removed: ] [added: ] | | 59-0864469 |
| [removed: COMMON] [added: COMMON] STOCK, $0.10 PAR [removed: VALUE] [added: VALUE] | | [removed: NEW] [added: NEW] YORK STOCK [removed: EXCHANGE] [added: EXCHANGE] |
The aggregate market value of the voting common stock held by non-affiliates of the registrant, computed by reference to the price at which the stock was last sold on June 30, [removed: 2012] [added: 2013] (the last business day of the registrant’s most recently completed second fiscal quarter) was [removed: $3,200,673,955.][added: $3,830,091,657.]
The number of outstanding shares of the registrant’s Common Stock, $0.10 par value, as of February [removed: 20, 2013] [added: 19, 2014] was [removed: 143,943,521.][added: 145,433,663.]
Portions of Brown & Brown, Inc.’s Proxy Statement for the [removed: 2013] [added: 2014] Annual Meeting of Shareholders are incorporated by reference into Part III of this Report.
FOR THE FISCAL YEAR ENDED DECEMBER 31, [removed: 2012][added: 2013]
| [removed: Part I] [added: [Part I](#tx633916_1)] | | | | | | |
| Item 1. | | [removed: [Business](#tx441942_1)] [added: [Business](#tx633916_2)] | | | 2 | |
| Item 1A. | | [Risk [removed: Factors](#tx441942_2)] [added: Factors](#tx633916_3)] | | | [removed: 10] [added: 9] | |
| Item 1B. | | [Unresolved Staff [removed: Comments](#tx441942_3)] [added: Comments](#tx633916_4)] | | | 18 | |
| Item 2. | | [removed: [Properties](#tx441942_4)] [added: [Properties](#tx633916_5)] | | | 18 | |
| Item 3. | | [Legal [removed: Proceedings](#tx441942_5)] [added: Proceedings](#tx633916_6)] | | | [removed: 19] [added: 18] | |
| Item 4. | | [Mine Safety [removed: Disclosures](#tx441942_6)] [added: Disclosures](#tx633916_7)] | | | [removed: 19] [added: 18] | |
| [removed: Part II] [added: [Part II](#tx633916_8)] | | | | | | |
| Item 5. | | [Market for Registrant’s Common Equity, Related Stockholder Matters and Issuer Purchases of Equity [removed: Securities](#tx441942_7)] [added: Securities](#tx633916_9)] | | | [removed: 19] [added: 18] | |
| Item 6. | | [Selected Financial [removed: Data](#tx441942_8)] [added: Data](#tx633916_10)] | | | [removed: 22] [added: 21] | |
| Item 7. | | [Management’s Discussion and Analysis of Financial Condition and Results of [removed: Operations](#tx441942_9)] [added: Operations](#tx633916_11)] | | | [removed: 23] [added: 22] | |
| Item 7A. | | [Quantitative and Qualitative Disclosures about Market [removed: Risk](#tx441942_10)] [added: Risk](#tx633916_12)] | | | [removed: 40] [added: 41] | |
| Item 8. | | [Financial Statements and Supplementary [removed: Data](#tx441942_11)] [added: Data](#tx633916_13)] | | | 41 | |
| Item 9. | | [Changes in and Disagreements With Accountants on Accounting and Financial [removed: Disclosure](#tx441942_12)] [added: Disclosure](#tx633916_14)] | | | [removed: 72] [added: 73] | |
| Item 9A. | | [Controls and [removed: Procedures](#tx441942_13)] [added: Procedures](#tx633916_15)] | | | [removed: 72] [added: 73] | |
| Item 9B. | | [Other [removed: Information](#tx441942_14)] [added: Information](#tx633916_16)] | | | [removed: 72] [added: 73] | |
| [removed: Part III] [added: [Part III](#tx633916_17)] | | | | | | |
| Item 10. | | [Directors, Executive Officers and Corporate [removed: Governance](#tx441942_15)] [added: Governance](#tx633916_18)] | | | [removed: 73] [added: 74] | |
| Item 11. | | [Executive [removed: Compensation](#tx441942_16)] [added: Compensation](#tx633916_19)] | | | [removed: 73] [added: 74] | |
| Item 12. | | [Security Ownership of Certain Beneficial Owners and Management and Related Stockholder [removed: Matters](#tx441942_17)] [added: Matters](#tx633916_20)] | | | [removed: 73] [added: 74] | |
| Item 13. | | [Certain Relationships and Related Transactions, and Director [removed: Independence](#tx441942_18)] [added: Independence](#tx633916_21)] | | | [removed: 73] [added: 74] | |
| Item 14. | | [Principal Accounting Fees and [removed: Services](#tx441942_19)] [added: Services](#tx633916_22)] | | | [removed: 73] [added: 74] | |
| [removed: Part IV] [added: [Part IV](#tx633916_23)] | | | | | | |
| Item 15. | | [Exhibits, Financial Statement [removed: Schedules](#tx441942_20)] [added: Schedules](#tx633916_24)] | | | [removed: 74] [added: 75] | |
| [removed: [Exhibit Index](#tx441942_22)] [added: Exhibit Index] | | | | | | |
| | • | | The occurrence of adverse economic conditions, an adverse regulatory climate, or a disaster in California, Florida, Georgia, Indiana, [added: Kansas,] Massachusetts, Michigan, New Jersey, New York, [added: Oregon,] Pennsylvania, [removed: Texas] [added: Texas, Virginia] and Washington, because a significant portion of business written by Brown & Brown is for customers located in these states; |
| | • | | The integration of our operations with those of businesses or assets we have acquired, including our [removed: January 2012] [added: July 2013] acquisition of [removed: Arrowhead General Insurance Agency Superholding Corporation (“Arrowhead”),] [added: Beecher Carlson Holdings, Inc. (“Beecher Carlson”),] or may acquire in the [removed: future] [added: future, including the announced acquisition of The Wright Insurance Group, LLC (which is expected to close on April 1, 2014),] and the failure to realize the expected benefits of such acquisition and integration; |
| | • | | Our ability to forecast liquidity needs through at least the end of [removed: 2013;] [added: 2014;] |
| | • | | The performance of acquired businesses and its effect on estimated acquisition earn-out payable; [added: and] |
| | • | | Other risks and uncertainties as may be detailed from time to time in our public announcements and Securities and Exchange Commission (“SEC”) [removed: filings; and] [added: filings.] |
[removed: | | • | |] Assumptions as to any of the foregoing and all statements that are not based on historical fact but rather reflect our current expectations concerning future results and events. [removed: |]
10-K 1 d633916d10k.htm FORM 10K
| [Signatures](#tx633916_25) | | | | | 78 | |
10-K 1 d441942d10k.htm FORM 10-K
| [Signatures](#tx441942_21) | | | | | 77 | |
| --- | --- | --- | --- |
Item 2. Properties.
2 rewritten, 0 added, 1 removed, 11 unchanged
Read the full itemFY2013 item · filed February 28, 2014FY2012 item · filed March 1, 2013
We lease offices at each of our [removed: 219] [added: 248] locations, with the exception of Dansville and Jamestown, New York, where we own the [removed: buildings] [added: building] in which our offices are located.
We also own an airplane [removed: hanger] [added: hangar] in Daytona Beach, Florida.
##### [Table of Contents](#toc)
Item 5. Market for Registrant’s Common Equity, Related Stockholder Matters and Issuer Purchases of Equity Securities.
17 rewritten, 13 added, 15 removed, 43 unchanged
Read the full itemFY2013 item · filed February 28, 2014FY2012 item · filed March 1, 2013
On February [removed: 20, 2013,] [added: 19, 2014,] there were [removed: 143,943,521] [added: 145,433,663] shares of our common stock outstanding, held by approximately [removed: 1,200] [added: 1,204] shareholders of record.
On [removed: October 19, 2011,] [added: February 6, 2014,] our Board of Directors approved a common stock repurchase plan to authorize the repurchase of up to [removed: $100.0] [added: $25.0] million worth of shares of the Company’s common stock during the subsequent [removed: twelve] [added: twenty-four] months.
[removed: We did] [added: As of February 28, 2014, we have] not [removed: repurchase] [added: repurchased] any shares of our common stock under the repurchase plan.
The following table sets forth information as of December 31, [removed: 2012,] [added: 2013,] with respect to compensation plans under which the Company’s equity securities are authorized for issuance:
| Plan Category | | Number of securities to be issued upon exercise of outstanding options, warrants and [removed: rights (a)(1)] [added: rights(a)(1)] | | | | Weighted-average exercise price of outstanding options, warrants and [removed: rights (b)(2)] [added: rights(b)(2)] | | | | Number of securities remaining available for future issuance under equity compensation plans (excluding securities reflected in column [removed: (a)) (c)(3)] [added: (a))(c)(3)] | | |
| Brown & Brown, Inc. 2000 Incentive Stock Option Plan | | | [removed: 738,792] [added: 622,945] | | | $ | [removed: 18.39] [added: 18.55] | | | | — | |
| Brown & Brown, Inc. 2010 Stock Incentive Plan | | | N/A | | | | N/A | | | | [removed: 4,455,517] [added: 2,207,098] | |
| Brown & Brown, Inc. 1990 Employee Stock Purchase Plan | | | N/A | | | | N/A | | | | [removed: 1,734,510] [added: 1,246,838] | |
| (1) | In addition to the number of securities listed in this column, [removed: 2,431,913] [added: 3,291,569] shares are issuable upon the vesting of restricted stock granted under the Brown & Brown, Inc. Performance Stock Plan and the Brown & Brown, Inc. 2010 Stock Incentive Plan, which represents the maximum number of shares that can vest based on the achievement of certain performance criteria. |
We did not sell any unregistered securities during [removed: 2012.][added: 2013.]
The following table presents information with respect to our purchases of our common stock during the three months ended December 31, [removed: 2012.][added: 2013.]
The following graph is a comparison of five-year cumulative total stockholder returns for our common stock as compared with the cumulative total stockholder return for the NYSE Composite Index, and a group of peer insurance broker and agency companies (Aon [removed: Corporation,] [added: plc,] Arthur J.
Gallagher & Co, Marsh & McLennan Companies, [removed: Inc.,] and Willis Group [removed: Holdings, Ltd.).][added: Holdings plc).]
The returns of each company have been weighted according to such companies’ respective stock market capitalizations as of December 31, [removed: 2007] [added: 2008] for the purposes of arriving at a peer group average.
The total return calculations are based upon an assumed $100 investment on December 31, [removed: 2007,] [added: 2008,] with all dividends reinvested.
[removed: 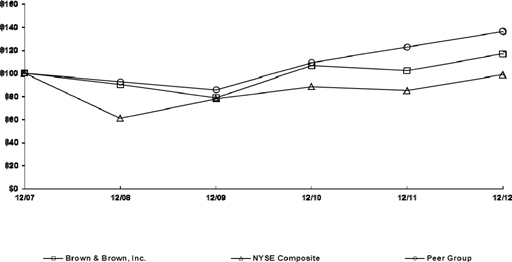][added: 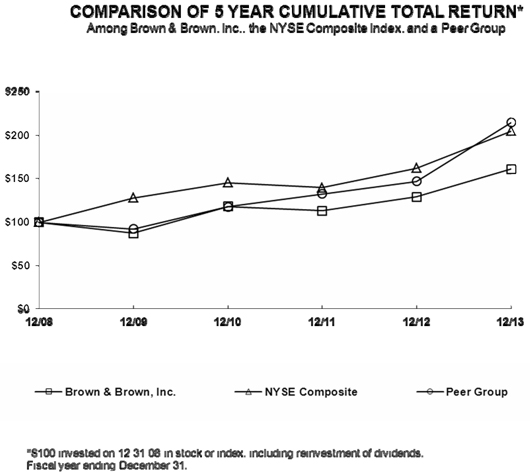]
| COMPANY/INDEX/MARKET | | [removed: 12/31/2007 | | | |] 12/31/2008 | | | | 12/31/2009 | | | | 12/31/2010 | | | | 12/31/2011 | | | | 12/31/2012 | | | [added: | 12/31/2013 | | |]
| 2013 | | | | | | | | | | | | |
| First Quarter | | $ | 32.08 | | | $ | 25.31 | | | $ | 0.09 | |
| Second Quarter | | $ | 33.24 | | | $ | 30.00 | | | $ | 0.09 | |
| Third Quarter | | $ | 35.13 | | | $ | 30.55 | | | $ | 0.09 | |
| Fourth Quarter | | $ | 33.69 | | | $ | 27.76 | | | $ | 0.10 | |
| Total | | | 622,945 | | | $ | 18.55 | | | | 3,453,936 | |
| October 1, 2013 to October 31, 2013 | | | — | | | $ | — | | | | — | | | $ | — | |
| November 1, 2013 to November 30, 2013 | | | 95 | | | $ | 31.61 | | | | — | | | $ | — | |
| December 1, 2013 to December 31, 2013 | | | 36,707 | | | $ | 31.05 | | | | — | | | $ | — | |
| Total | | | 36,802 | | | $ | 31.05 | | | | — | | | $ | — | |
| Brown & Brown, Inc. | | $ | 100.00 | | | $ | 87.36 | | | $ | 118.22 | | | $ | 113.39 | | | $ | 129.32 | | | $ | 161.37 | |
| NYSE Composite Index | | $ | 100.00 | | | $ | 128.28 | | | $ | 145.46 | | | $ | 139.87 | | | $ | 162.23 | | | $ | 204.87 | |
| Peer Group | | $ | 100.00 | | | $ | 92.45 | | | $ | 117.98 | | | $ | 132.65 | | | $ | 147.18 | | | $ | 214.75 | |
| 2011 | | | | | | | | | | | | |
| First Quarter | | $ | 26.60 | | | $ | 23.56 | | | $ | 0.08 | |
| Second Quarter | | $ | 27.07 | | | $ | 24.84 | | | $ | 0.08 | |
| Third Quarter | | $ | 26.10 | | | $ | 17.19 | | | $ | 0.08 | |
| Fourth Quarter | | $ | 23.31 | | | $ | 16.77 | | | $ | 0.085 | |
| Total | | | 738,792 | | | $ | 18.39 | | | | 6,190,027 | |
| October 1, 2012 to October 31, 2012 | | | — | | | $ | — | | | | — | | | $ | — | |
| November 1, 2012 to November 30, 2012 | | | 323 | | | $ | 26.08 | | | | — | | | $ | — | |
| December 1, 2012 to December 31, 2012 | | | 585,815 | | | $ | 25.86 | | | | — | | | $ | — | |
| Total | | | 586,138 | | | $ | 25.86 | | | | — | | | $ | — | |
COMPARISON OF 5 YEAR CUMULATIVE TOTAL RETURN
Among Brown & Brown, Inc., the NYSE Composite Index, and a Peer Group
| Brown & Brown, Inc. | | $ | 100.00 | | | $ | 90.20 | | | $ | 78.80 | | | $ | 106.63 | | | $ | 102.28 | | | $ | 116.65 | |
| NYSE Composite Index | | $ | 100.00 | | | $ | 60.74 | | | $ | 77.92 | | | $ | 88.36 | | | $ | 84.96 | | | $ | 98.55 | |
| Peer Group | | $ | 100.00 | | | $ | 92.58 | | | $ | 85.59 | | | $ | 109.22 | | | $ | 122.80 | | | $ | 136.25 | |
Item 6. Selected Financial Data.
29 rewritten, 2 added, 1 removed, 23 unchanged
Read the full itemFY2013 item · filed February 28, 2014FY2012 item · filed March 1, 2013
The following selected Consolidated Financial Data for each of the five fiscal years in the period ended December 31, [removed: 2012] [added: 2013] have been derived from our Consolidated Financial Statements.
| _(in thousands, except per share data, number [removed: of_ _employees] [added: of employees] and percentages_ | | Year Ended December 31 | | | | | | | | | | | | | | | | | | |
| | [removed: 2012] [added: 2013] | | | | [removed: 2011] [added: 2012] | | | | [removed: 2010] [added: 2011] | | | | [removed: 2009] [added: 2010] | | | | [removed: 2008] [added: 2009] | | | |
| Commissions and fees | | $ | [removed: 1,189,081] [added: 1,355,503] | | | $ | [removed: 1,005,962] [added: 1,189,081] | | | $ | [removed: 966,917] [added: 1,005,962] | | | $ | [removed: 964,863] [added: 966,917] | | | $ | [removed: 965,983] [added: 964,863] | |
| Investment income | | | [removed: 797] [added: 638] | | | | [removed: 1,267] [added: 797] | | | | [removed: 1,326] [added: 1,267] | | | | [removed: 1,161] [added: 1,326] | | | | [removed: 6,079] [added: 1,161] | |
| Other income, net | | | [removed: 10,154] [added: 7,138] | | | | [removed: 6,313] [added: 10,154] | | | | [removed: 5,249] [added: 6,313] | | | | [removed: 1,853] [added: 5,249] | | | | [removed: 5,492] [added: 1,853] | |
| Total revenues | | | [removed: 1,200,032] [added: 1,363,279] | | | | [removed: 1,013,542] [added: 1,200,032] | | | | [removed: 973,492] [added: 1,013,542] | | | | [removed: 967,877] [added: 973,492] | | | | [removed: 977,554] [added: 967,877] | |
| Employee compensation and benefits | | | [removed: 608,506] [added: 683,000] | | | | [removed: 508,675] [added: 608,506] | | | | [removed: 487,820] [added: 508,675] | | | | [removed: 484,680] [added: 487,820] | | | | [removed: 485,783] [added: 484,680] | |
| Non-cash stock-based compensation | | | [removed: 15,865] [added: 22,603] | | | | [removed: 11,194] [added: 15,865] | | | | [removed: 6,845] [added: 11,194] | | | | [removed: 7,358] [added: 6,845] | | | | [removed: 7,314] [added: 7,358] | |
| Other operating expenses | | | [removed: 174,389] [added: 195,677] | | | | [removed: 144,079] [added: 174,389] | | | | [removed: 135,851] [added: 144,079] | | | | [removed: 143,389] [added: 135,851] | | | | [removed: 137,352] [added: 143,389] | |
| Amortization | | | [removed: 63,573] [added: 67,932] | | | | [removed: 54,755] [added: 63,573] | | | | [removed: 51,442] [added: 54,755] | | | | [removed: 49,857] [added: 51,442] | | | | [removed: 46,631] [added: 49,857] | |
| Depreciation | | | [removed: 15,373] [added: 17,485] | | | | [removed: 12,392] [added: 15,373] | | | | [removed: 12,639] [added: 12,392] | | | | [removed: 13,240] [added: 12,639] | | | | [removed: 13,286] [added: 13,240] | |
| Interest | | | [removed: 16,097] [added: 16,440] | | | | [removed: 14,132] [added: 16,097] | | | | [removed: 14,471] [added: 14,132] | | | | [removed: 14,599] [added: 14,471] | | | | [removed: 14,690] [added: 14,599] | |
| Change in estimated acquisition earn-out payables | | | [removed: 1,418] [added: 2,533] | | | | [removed: (2,206] [added: 1,418] | [removed: )] | | | [removed: (1,674] [added: (2,206] | ) | | | [removed: —] [added: (1,674] | [added: )] | | | — | |
| Total expenses | | | [removed: 895,221] [added: 1,005,670] | | | | [removed: 743,021] [added: 895,221] | | | | [removed: 707,394] [added: 743,021] | | | | [removed: 713,123] [added: 707,394] | | | | [removed: 705,056] [added: 713,123] | |
| Income before income taxes | | | [removed: 304,811] [added: 357,609] | | | | [removed: 270,521] [added: 304,811] | | | | [removed: 266,098] [added: 270,521] | | | | [removed: 254,754] [added: 266,098] | | | | [removed: 272,498] [added: 254,754] | |
| Income taxes | | | [removed: 120,766] [added: 140,497] | | | | [removed: 106,526] [added: 120,766] | | | | [removed: 104,346] [added: 106,526] | | | | [removed: 101,460] [added: 104,346] | | | | [removed: 106,374] [added: 101,460] | |
| Net income | | $ | [removed: 184,045] [added: 217,112] | | | $ | [removed: 163,995] [added: 184,045] | | | $ | [removed: 161,752] [added: 163,995] | | | $ | [removed: 153,294] [added: 161,752] | | | $ | [removed: 166,124] [added: 153,294] | |
| Net income per share — diluted | | $ | [removed: 1.26] [added: 1.48] | | | $ | [removed: 1.13] [added: 1.26] | | | $ | [removed: 1.12] [added: 1.13] | | | $ | [removed: 1.08] [added: 1.12] | | | $ | [removed: 1.17] [added: 1.08] | |
| Weighted average number of shares outstanding — diluted | | | [removed: 142,010] [added: 142,624] | | | | [removed: 140,264] [added: 142,010] | | | | [removed: 139,318] [added: 140,264] | | | | [removed: 137,507] [added: 139,318] | | | | [removed: 136,884] [added: 137,507] | |
| Dividends declared per share | | $ | [removed: 0.3450] [added: 0.3700] | | | $ | [removed: 0.3250] [added: 0.3450] | | | $ | [removed: 0.3125] [added: 0.3250] | | | $ | [removed: 0.3025] [added: 0.3125] | | | $ | [removed: 0.2850] [added: 0.3025] | |
| Total assets | | $ | [removed: 3,128,058] [added: 3,649,508] | | | $ | [removed: 2,607,011] [added: 3,128,058] | | | $ | [removed: 2,400,814] [added: 2,607,011] | | | $ | [removed: 2,224,226] [added: 2,400,814] | | | $ | [removed: 2,119,580] [added: 2,224,226] | |
| Long-term debt | | $ | [removed: 450,000] [added: 380,000] | | | $ | [removed: 250,033] [added: 450,000] | | | $ | [removed: 250,067] [added: 250,033] | | | $ | [removed: 250,209] [added: 250,067] | | | $ | [removed: 253,616] [added: 250,209] | |
| Total shareholders’ equity | | $ | [removed: 1,807,333] [added: 2,007,141] | | | $ | [removed: 1,643,963] [added: 1,807,333] | | | $ | [removed: 1,506,344] [added: 1,643,963] | | | $ | [removed: 1,369,874] [added: 1,506,344] | | | $ | [removed: 1,241,741] [added: 1,369,874] | |
| Total shares outstanding at year-end | | | [removed: 143,878] [added: 145,419] | | | | [removed: 143,352] [added: 143,878] | | | | [removed: 142,795] [added: 143,352] | | | | [removed: 142,076] [added: 142,795] | | | | [removed: 141,544] [added: 142,076] | |
| Number of full-time equivalent employees at year-end | | | [removed: 6,438] [added: 6,992] | | | | [removed: 5,557] [added: 6,438] | | | | [removed: 5,286] [added: 5,557] | | | | [removed: 5,206] [added: 5,286] | | | | [removed: 5,398] [added: 5,206] | |
| Total revenues per average number of [removed: employees (1)] [added: employees(1)] | | $ | [removed: 191,729] [added: 203,020] | [removed: (2)] | | $ | [removed: 186,949] [added: 191,729] | [added: (2)] | | $ | [removed: 185,568] [added: 186,949] | | | $ | [removed: 182,549] [added: 185,568] | | | $ | [removed: 187,181] [added: 182,549] | |
| Stock price at year-end | | $ | [removed: 25.46] [added: 31.39] | | | $ | [removed: 22.63] [added: 25.46] | | | $ | [removed: 23.94] [added: 22.63] | | | $ | [removed: 17.97] [added: 23.94] | | | $ | [removed: 20.90] [added: 17.97] | |
| Return on beginning shareholders’ [removed: equity (4)] [added: equity(4)] | | | [removed: 11] [added: 12] | % | | | 11 | % | | | [removed: 12] [added: 11] | % | | | 12 | % | | | [removed: 15] [added: 12] | % |
| | | | | | | | | | | | | | | | | | | | | |
| Stock price earnings multiple at year-end(3) | | | 21.2 | | | | 20.2 | | | | 20.0 | | | | 21.4 | | | | 16.6 | |
| Stock price earnings multiple at year-end (3) | | | 20.21 | | | | 20.03 | | | | 21.38 | | | | 16.64 | | | | 17.86 | |
Item 8. Financial Statements and Supplementary Data.
350 rewritten, 135 added, 127 removed, 724 unchanged
Read the full itemFY2013 item · filed February 28, 2014FY2012 item · filed March 1, 2013
| [Consolidated Statements of Income for the years ended December 31, [removed: 2012, 2011] [added: 2013, 2012] and [removed: 2010](#tx441942_23)] [added: 2011](#tx633916_27)] | | | 42 | |
| [Consolidated Balance Sheets as of December 31, [removed: 2012] [added: 2013] and [removed: 2011](#tx441942_24)] [added: 2012](#tx633916_28)] | | | 43 | |
| [Consolidated Statements of Shareholders’ Equity for the years ended December 31, [removed: 2012, 2011] [added: 2013, 2012] and [removed: 2010](#tx441942_25)] [added: 2011](#tx633916_29)] | | | 44 | |
| [Consolidated Statements of Cash Flows for the years ended December 31, [removed: 2012, 2011] [added: 2013, 2012] and [removed: 2010](#tx441942_26)] [added: 2011](#tx633916_30)] | | | 45 | |
| [Notes to Consolidated Financial Statements for the years ended December 31, [removed: 2012, 2011] [added: 2013, 2012] and [removed: 2010](#tx441942_27)] [added: 2011](#tx633916_31)] | | | 46 | |
| [Note 1: Summary of Significant Accounting [removed: Policies](#tx441942_28)] [added: Policies](#tx633916_32)] | | | 46 | |
| [Note 2: Business [removed: Combinations](#tx441942_29)] [added: Combinations](#tx633916_33)] | | | 49 | |
| [Note 3: [removed: Goodwill](#tx441942_30)] [added: Goodwill](#tx633916_34)] | | | 56 | |
| [Note 4: Amortizable Intangible [removed: Assets](#tx441942_31)] [added: Assets](#tx633916_35)] | | | 57 | |
| [Note 5: [removed: Investments](#tx441942_32)] [added: Investments](#tx633916_36)] | | | 57 | |
| [Note 6: Fixed [removed: Assets](#tx441942_33)] [added: Assets](#tx633916_37)] | | | 58 | |
| [Note 7: Accrued Expenses and Other [removed: Liabilities](#tx441942_34)] [added: Liabilities](#tx633916_38)] | | | 58 | |
| [Note 8: Long-Term [removed: Debt](#tx441942_35)] [added: Debt](#tx633916_39)] | | | 58 | |
| [Note 9: Income [removed: Taxes](#tx441942_36)] [added: Taxes](#tx633916_40)] | | | 60 | |
| [Note 10: Employee Savings [removed: Plan](#tx441942_37)] [added: Plan](#tx633916_41)] | | | 62 | |
| [Note 11: Stock-Based [removed: Compensation](#tx441942_38)] [added: Compensation](#tx633916_42)] | | | 62 | |
| [Note 12: Supplemental Disclosures of Cash Flow [removed: Information](#tx441942_39)] [added: Information](#tx633916_43)] | | | 66 | |
| [Note 13: Commitments and [removed: Contingencies](#tx441942_40)] [added: Contingencies](#tx633916_44)] | | | [removed: 66] [added: 67] | |
| [Note 14: Quarterly Operating Results [removed: (Unaudited)](#tx441942_41)] [added: (Unaudited)](#tx633916_45)] | | | [removed: 67] [added: 68] | |
| [Note 15: Segment [removed: Information](#tx441942_42)] [added: Information](#tx633916_46)] | | | 68 | |
| [Reports of Independent Registered Public Accounting [removed: Firm](#tx441942_43)] [added: Firm](#tx633916_48)] | | | [removed: 69] [added: 70] | |
| [Management’s Report on Internal Control Over Financial [removed: Reporting](#tx441942_44)] [added: Reporting](#tx633916_49)] | | | [removed: 71] [added: 72] | |
| _(in thousands, except per share data)_ | | [removed: 2012] [added: 2013] | | | | [removed: 2011] [added: 2012] | | | | [removed: 2010] [added: 2011] | | |
| Commissions and fees | | $ | [removed: 1,189,081] [added: 1,355,503] | | | $ | [removed: 1,005,962] [added: 1,189,081] | | | $ | [removed: 966,917] [added: 1,005,962] | |
| Investment income | | | [removed: 797] [added: 638] | | | | [removed: 1,267] [added: 797] | | | | [removed: 1,326] [added: 1,267] | |
| Other income, net | | | [removed: 10,154] [added: 7,138] | | | | [removed: 6,313] [added: 10,154] | | | | [removed: 5,249] [added: 6,313] | |
| Total revenues | | | [removed: 1,200,032] [added: 1,363,279] | | | | [removed: 1,013,542] [added: 1,200,032] | | | | [removed: 973,492] [added: 1,013,542] | |
| Employee compensation and benefits | | | [removed: 608,506] [added: 683,000] | | | | [removed: 508,675] [added: 608,506] | | | | [removed: 487,820] [added: 508,675] | |
| Non-cash stock-based compensation | | | [removed: 15,865] [added: 22,603] | | | | [removed: 11,194] [added: 15,865] | | | | [removed: 6,845] [added: 11,194] | |
| Other operating expenses | | | [removed: 174,389] [added: 195,677] | | | | [removed: 144,079] [added: 174,389] | | | | [removed: 135,851] [added: 144,079] | |
| Amortization | | | [removed: 63,573] [added: 67,932] | | | | [removed: 54,755] [added: 63,573] | | | | [removed: 51,442] [added: 54,755] | |
| Depreciation | | | [removed: 15,373] [added: 17,485] | | | | [removed: 12,392] [added: 15,373] | | | | [removed: 12,639] [added: 12,392] | |
| Interest | | | [removed: 16,097] [added: 16,440] | | | | [removed: 14,132] [added: 16,097] | | | | [removed: 14,471] [added: 14,132] | |
| Change in estimated acquisition earn-out payables | | | [removed: 1,418] [added: 2,533] | | | | [removed: (2,206] [added: 1,418] | [removed: )] | | | [removed: (1,674] [added: (2,206] | ) |
| Total expenses | | | [removed: 895,221] [added: 1,005,670] | | | | [removed: 743,021] [added: 895,221] | | | | [removed: 707,394] [added: 743,021] | |
| Income before income taxes | | | [removed: 304,811] [added: 357,609] | | | | [removed: 270,521] [added: 304,811] | | | | [removed: 266,098] [added: 270,521] | |
| Income taxes | | | [removed: 120,766] [added: 140,497] | | | | [removed: 106,526] [added: 120,766] | | | | [removed: 104,346] [added: 106,526] | |
| Net income | | $ | [removed: 184,045] [added: 217,112] | | | $ | [removed: 163,995] [added: 184,045] | | | $ | [removed: 161,752] [added: 163,995] | |
| Basic | | $ | [removed: 1.28] [added: 1.50] | | | $ | [removed: 1.15] [added: 1.28] | | | $ | [removed: 1.14] [added: 1.15] | |
| Diluted | | $ | [removed: 1.26] [added: 1.48] | | | $ | [removed: 1.13] [added: 1.26] | | | $ | [removed: 1.12] [added: 1.13] | |
| [Note 16: Subsequent Event](#tx633916_47) | | | 69 | |
| Cash and cash equivalents | | $ | 202,952 | | | $ | 219,821 | |
| Net income | | | | | | | | | | | | | | | 217,112 | | | | | | | | 217,112 | |
| Balance at December 31, 2013 | | | 145,419 | | | $ | 14,542 | | | $ | 371,960 | | | $ | 1,620,639 | | | $ | — | | | $ | 2,007,141 | |
Acquisitions in 2013
For 2013, several adjustments were made within the permitted measurement period that resulted in a reduction to the aggregate purchase price of the applicable acquisition of $504,000, including $18,000 of cash payments, an increase of $117,000 in other payables, the assumption of $82,000 of liabilities and the reduction of $721,000 in recorded earn-out payables.
The following table summarizes the aggregate purchase price allocation made as of the date of each acquisition for current year acquisitions and adjustment made during the measurement period for prior year acquisitions:
| The Rollins Agency, Inc. | | Retail | | June 1 | | $ | 13,792 | | | $ | 50 | | | $ | 2,321 | | | $ | 16,163 | | | _$_ | _4,300_ | |
| Beecher Carlson Holdings, Inc. | | Retail; National Programs | | July 1 | | | 364,256 | | | | — | | | | — | | | | 364,256 | | | | _—_ | |
| ICA, Inc. | | Services | | December 31 | | | 19,770 | | | | — | | | | 727 | | | | 20,497 | | | | _5,000_ | |
| Other | | Various | | Various | | | 10,254 | | | | 502 | | | | 2,043 | | | | 12,799 | | | | _7,468_ | |
| Total | | | | | | $ | 408,072 | | | $ | 552 | | | $ | 5,091 | | | $ | 413,715 | | | _$_ | _16,768_ | |
| _(in thousands)_ | | Rollins | | | | Beecher | | | | ICA | | | | Other | | | | Total | | |
| Cash | | $ | — | | | $ | 40,360 | | | $ | — | | | $ | — | | | $ | 40,360 | |
| Other current assets | | | 393 | | | | 57,632 | | | | — | | | | 1,573 | | | | 59,598 | |
| Fixed assets | | | 30 | | | | 1,786 | | | | 75 | | | | 24 | | | | 1,915 | |
| Goodwill | | | 12,697 | | | | 265,174 | | | | 12,377 | | | | 5,696 | | | | 295,944 | |
| Purchased customer accounts | | | 3,878 | | | | 101,565 | | | | 7,917 | | | | 5,623 | | | | 118,983 | |
| Total assets acquired | | | 17,029 | | | | 469,275 | | | | 20,497 | | | | 12,993 | | | | 519,794 | |
| Other current liabilities | | | (866 | ) | | | (80,090 | ) | | | — | | | | (194 | ) | | | (81,150 | ) |
| Deferred income taxes, net | | | — | | | | (22,764 | ) | | | — | | | | — | | | | (22,764 | ) |
| Other liabilities | | | — | | | | (2,165 | ) | | | — | | | | — | | | | (2,165 | ) |
| Total liabilities assumed | | | (866 | ) | | | (105,019 | ) | | | — | | | | (194 | ) | | | (106,079 | ) |
| Net assets acquired | | $ | 16,163 | | | $ | 364,256 | | | $ | 20,497 | | | $ | 12,799 | | | $ | 413,715 | |
Goodwill of $295,944,000 was allocated to the Retail, National Programs, Wholesale Brokerage and Services Divisions in the amounts of $257,196,000, $27,091,000, ($812,000) and $12,469,000, respectively.
Of the total goodwill of $295,944,000, $41,663,000 is currently deductible for income tax purposes and $249,190,000 is non-deductible.
| Total revenues | | $ | 1,439,918 | | | $ | 1,329,262 | |
| Income before income taxes | | $ | 373,175 | | | $ | 329,291 | |
| Net income | | $ | 226,562 | | | $ | 198,826 | |
| Basic | | $ | 1.57 | | | $ | 1.39 | |
| Diluted | | $ | 1.55 | | | $ | 1.36 | |
| Basic | | | 141,033 | | | | 139,634 | |
| Diluted | | | 142,624 | | | | 142,010 | |
| Goodwill of acquired businesses | | | 257,196 | | | | 27,964 | | | | (812 | ) | | | 12,469 | | | | 296,817 | |
| | | | | | | | | | | | | | | | | | | | | |
| Balance as of December 31, 2013 | | $ | 1,131,257 | | | $ | 467,144 | | | $ | 287,242 | | | $ | 120,530 | | | $ | 2,006,173 | |
| | | | | | | | | | | | | | | | | | | | | |
| Total | | $ | 1,148,834 | | | $ | (529,946 | ) | | $ | 618,888 | | | | | | | $ | 1,030,351 | | | $ | (463,813 | ) | | $ | 566,538 | | | | | |
Investments at December 31 consisted of the following:
| 2013 | | $ | 15,662 | | | $ | — | | | $ | — | |
| | | | | |
| Accumulated other comprehensive income, net of related income tax effect of $0 at 2012 and $4 at 2011 | | | — | | | | 7 | |
| | | | | | | | | | | | | | | | | | | | | | | | | |
| Balance at January 1, 2010 | | | 142,076 | | | $ | 14,208 | | | $ | 267,856 | | | $ | 1,087,805 | | | $ | 5 | | | $ | 1,369,874 | |
| | | | | | | | | | | | | | | | | | | | | | | | | |
| Net income | | | | | | | | | | | | | | | 161,752 | | | | | | | | 161,752 | |
| Net unrealized holding loss on available-for-sale securities | | | | | | | | | | | | | | | | | | | 2 | | | | 2 | |
| Comprehensive income | | | | | | | | | | | | | | | | | | | | | | | 161,754 | |
| Common stock issued to directors | | | 14 | | | | 1 | | | | 255 | | | | | | | | | | | | 256 | |
| Comprehensive income | | | | | | | | | | | | | | | | | | | | | | | 184,038 | |
| Cash and cash equivalents at beginning of year | | | 286,305 | | | | 272,984 | | | | 197,113 | |
Reclassification
Effective January 1, 2012, certain offices were reclassified from the National Programs Division to the Wholesale Brokerage Division, and as such, certain prior-year amounts have been reclassified to conform to the current year presentation.
Equity securities held by Brown & Brown have been classified as “available-for-sale” and are reported at estimated fair value, with the accumulated other comprehensive income (unrealized gains and losses), net of related income tax effect, reported as a separate component of shareholders’ equity.
Realized gains and losses and declines in value below cost that are judged to be other-than-temporary on available-for-sale securities are reflected in investment income.
The cost of securities sold is based on the specific identification method.
Interest and dividends on securities classified as available-for-sale are included in investment income in the Consolidated Statements of Income.
For the year ended December 31, 2010, the impact of outstanding options to purchase 12,000 shares of common stock was anti-dilutive; these shares were excluded from the calculation of diluted net income per share.
Recent Accounting Pronouncements
_Goodwill Impairment_ — In September 2011, the FASB issued authoritative guidance which simplifies goodwill impairment testing by allowing an entity to first assess qualitative factors to determine whether it is more likely than not that the fair value of a reporting unit is less than its carrying value.
An entity is no longer required to determine the fair value of a reporting unit unless it is more likely than not that the fair value is less than carrying value.
The guidance is effective for interim and annual periods beginning after December 15, 2011.
The adoption of this guidance did not have any material impact on the Company’s Consolidated Financial Statements.
However, the Company does not expect any adjustments to such allocations to be material to the Company’s Condensed Consolidated Financial Statements.
| | | | | | | | | | | | | | | | | | | | | | | | | | | | | | | | | |
| --- | --- | --- | --- | --- | --- | --- | --- | --- | --- | --- | --- | --- | --- | --- | --- | --- | --- | --- | --- | --- | --- | --- | --- | --- | --- | --- | --- | --- | --- | --- | --- | --- |
| | | | | | | | | | | | | | | | | | | | | | | | | | | | | | | | | |
| | | | | | | | | | | | | | | | | | | | | | | | | | | | | | | | | |
| | | | | | | | | | | | | | | | | | | | | | | | | | | | | |
| --- | --- | --- | --- | --- | --- | --- | --- | --- | --- | --- | --- | --- | --- | --- | --- | --- | --- | --- | --- | --- | --- | --- | --- | --- | --- | --- | --- | --- |
| | | | | | | | | | | | | | | | | | | | | | | | | | | | | |
| | | | | | | | | | | | | | | | | | | | | | | | | | | | | |
Acquisitions in 2010
These acquisitions have been accounted for as business combinations and are as follows:
| DiMartino Associates, Inc. | | | Retail | | | | March 1 | | | $ | 7,047 | | | $ | — | | | $ | 3,402 | | | $ | 10,449 | | | _$_ | _5,637_ | |
| Stone Insurance Agencies, et al. | | | Retail | | | | May 1 | | | | 15,825 | | | | — | | | | 124 | | | | 15,949 | | | | _3,000_ | |
| Crowe Paradis Holding Company, et al. | | | Services | | | | September 1 | | | | 75,000 | | | | — | | | | 8,665 | | | | 83,665 | | | | _15,000_ | |
| Thomas R Jones, Inc. | | | Retail | | | | October 1 | | | | 14,634 | | | | — | | | | — | | | | 14,634 | | | | _—_ | |
| Other | | | Various | | | | Various | | | | 46,130 | | | | 759 | | | | 12,899 | | | | 59,788 | | | | _30,668_ | |
| Total | | | | | | | | | | $ | 158,636 | | | $ | 759 | | | $ | 25,090 | | | $ | 184,485 | | | _$_ | _54,305_ | |
An excerpt. Shown here: 40 of 350 rewritten, 40 of 135 added and 40 of 127 removed. The counts are complete. For every sentence, read Item 8. Financial Statements and Supplementary Data. in the FY2013 filing and the FY2012 filing.
Item 9. Changes in and Disagreements With Accountants on Accounting and Financial Disclosure.
1 rewritten, 0 added, 0 removed, 1 unchanged
Read the full itemFY2013 item · filed February 28, 2014FY2012 item · filed March 1, 2013
There were no changes in or disagreements with accountants on accounting and financial disclosure in [removed: 2012.][added: 2013.]
Item 9A. Controls and Procedures.
6 rewritten, 0 added, 1 removed, 19 unchanged
Read the full itemFY2013 item · filed February 28, 2014FY2012 item · filed March 1, 2013
We carried out an evaluation required by Rules 13a-15 and 15d-15 under the Exchange Act (the “Evaluation”), under the supervision and with the participation of our Chief Executive Officer (“CEO”) and Chief Financial Officer (“CFO”), of the effectiveness of our disclosure controls and procedures as defined in Rule 13a-15 and 15d-15 under the Exchange Act (“Disclosure Controls”) as of December 31, [removed: 2012.][added: 2013.]
[removed: Endlar Insurance Agency, Inc., Texas Security General Insurance Agency, Inc., Edgren Hecker] [added: In conducting Brown] & [removed: Lemmon Insurance,] [added: Brown’s evaluation of the effectiveness of its internal controls over financial reporting, Brown & Brown has excluded the following acquisitions completed by Brown & Brown during 2013: Beecher Carlson Holdings,] Inc. and [removed: Rowlands & Barranca Agency,] [added: ICA,] Inc. (collectively the [removed: “2012] [added: “2013] Excluded Acquisitions”), which were acquired during [removed: 2012] [added: 2013] and whose financial statements constitute [removed: 0.2%] [added: 2.6%] and [removed: 19.0%] [added: 10.8%] of net and total assets, respectively, [removed: 10.1%] [added: 3.4%] of revenues, and [removed: 10.4%] [added: 2.2%] of net income of the consolidated financial statement amounts as of and for the year ended December 31, [removed: 2012.][added: 2013.]
There has not been any change in our internal control over financial reporting identified in connection with the Evaluation that occurred during the quarter ended December 31, [removed: 2012] [added: 2013] that has materially affected, or is reasonably likely to materially affect, those controls.
We assessed the effectiveness of our internal control over financial reporting as of December 31, [removed: 2012.][added: 2013.]
Management’s report on internal control over financial reporting as of December 31, [removed: 2012] [added: 2013] is incorporated herein at Item 8.
Deloitte & Touche LLP, an independent registered public accounting firm, issued an audit report on the effectiveness of our internal control over financial reporting as of December 31, [removed: 2012,] [added: 2013,] which is incorporated herein at Item 8.
In conducting Brown & Brown’s evaluation of the effectiveness of its internal controls over financial reporting, Brown & Brown has excluded the following acquisitions completed by Brown & Brown during 2012: Arrowhead General Insurance Agency Superholding Corporation, Richard W.
Item 10. Directors, Executive Officers and Corporate Governance.
1 rewritten, 0 added, 0 removed, 3 unchanged
Read the full itemFY2013 item · filed February 28, 2014FY2012 item · filed March 1, 2013
The information required by this item regarding directors and executive officers is incorporated herein by reference to our definitive Proxy Statement to be filed with the SEC in connection with the Annual Meeting of Shareholders to be held in [removed: 2013] [added: 2014] (the [removed: “2013] [added: “2014] Proxy Statement”) under the headings “Management” and “Section 16(a) Beneficial Ownership Reporting.” We have adopted a code of ethics that applies to our principal executive officer, principal financial officer, and controller.
Item 11. Executive Compensation.
1 rewritten, 0 added, 0 removed, 1 unchanged
Read the full itemFY2013 item · filed February 28, 2014FY2012 item · filed March 1, 2013
The information required by this item is incorporated herein by reference to the [removed: 2013] [added: 2014] Proxy Statement under the heading “Executive Compensation.”
Item 12. Security Ownership of Certain Beneficial Owners and Management and Related Stockholder Matters.
1 rewritten, 0 added, 0 removed, 2 unchanged
Read the full itemFY2013 item · filed February 28, 2014FY2012 item · filed March 1, 2013
The information required by this item is incorporated herein by reference to the [removed: 2013] [added: 2014] Proxy Statement under the heading “Security Ownership of Management and Certain Beneficial Owners.”
Item 13. Certain Relationships and Related Transactions, and Director Independence.
1 rewritten, 0 added, 0 removed, 1 unchanged
Read the full itemFY2013 item · filed February 28, 2014FY2012 item · filed March 1, 2013
The information required by this item is incorporated herein by reference to the [removed: 2013] [added: 2014] Proxy Statement under the heading [removed: “Management — Certain] [added: “Management—Certain] Relationships and Related Transactions.”
Item 14. Principal Accounting Fees and Services.
1 rewritten, 0 added, 0 removed, 3 unchanged
Read the full itemFY2013 item · filed February 28, 2014FY2012 item · filed March 1, 2013
The information required by this item is incorporated herein by reference to the [removed: 2013] [added: 2014] Proxy Statement under the heading “Fees Paid to Deloitte & Touche LLP.”
Item 15. Exhibits and Financial Statement Schedules.
11 rewritten, 21 added, 15 removed, 129 unchanged
Read the full itemFY2013 item · filed February 28, 2014FY2012 item · filed March 1, 2013
| 3.2 | | Bylaws (incorporated by reference to Exhibit [removed: 3b] [added: 3.2] to Form [removed: 10-K for the year ended December 31, 2002).] [added: 8-K filed on March 2, 2012).] |
| 10.1(a) | | Lease of the Registrant for office space at 220 South Ridgewood Avenue, Daytona Beach, Florida dated August 15, 1987 (incorporated by reference to Exhibit 10a(3) to Form 10-K for the year ended December [removed: 31, 1993),] [added: 31,1993),] as amended by Letter Agreement dated June 26, 1995; First Amendment to Lease dated August 2, 1999; Second Amendment to Lease dated December 11, 2001; Third Amendment to Lease dated August 8, 2002; Fourth Amendment to Lease dated October 26, 2004 (incorporated by reference to Exhibit 10.2(a) to Form 10-K for the year ended December 31, 2005); Fifth Amendment to Lease dated 2006 (incorporated by reference to Exhibit 10.1(a) to Form 10-K for the year ended December 31, 2010); Sixth Amendment to Lease dated August 17, 2009 (incorporated by reference to Exhibit 10.1(a) to Form 10-K for the year ended December 31, 2010); Seventh Amendment to Lease dated March 25, [removed: 2011;] [added: 2011 (incorporated by reference to Exhibit 10.1(a) to Form 10-K for the year ended December 31, 2012);] Eighth Amendment to Lease dated April 16, [removed: 2012;] [added: 2012 (incorporated by reference to Exhibit 10.1(a) to Form 10-K for the year ended December 31, 2012);] and Ninth Amendment to Lease dated December 5, [removed: 2012.] [added: 2012 (incorporated by reference to Exhibit 10.1(a) to Form 10-K for the year ended December 31, 2012).] |
| 10.1(b) | | Lease Agreement for office space at 655 N. Franklin St., Suite 1900, Tampa, Florida, dated March 27, 2012 and effective August 17, 2012, between TWC Fifty-Eight, Ltd., as landlord and the Registrant, as [removed: tenant.] [added: tenant (incorporated by reference to Exhibit 10.1(b) to Form 10-K for the year ended December 31, 2012).] |
| 10.3 | | Agency Agreement dated January 1, 1979 among the Registrant, Whiting National Management, Inc., and Pennsylvania Manufacturers’ Association Insurance Company (incorporated by reference to Exhibit 10h to Registration Statement [removed: No. 33-58090] [added: No.33-58090] on Form S-4). |
| 10.4(g) | | Employment Agreement, dated as of October 27, 1997, between the Registrant and Charles H. [removed: Lydecker.] [added: Lydecker (incorporated by reference to Exhibit 10.4(g) to Form 10-K for the year ended December 31, 2012).] |
| 10.4(h) | | Employment Agreement, dated as of June 1, 2009, between the Registrant and Anthony [removed: Strianese.] [added: Strianese (incorporated by reference to Exhibit 10.4(h) to Form 10-K for the year ended December 31, 2012).] |
| [removed: 10.8] [added: 10.8(a)] | | Form of Performance-Based Stock Grant Agreement under 2010 Stock Incentive Plan (incorporated by reference to Exhibit 10.16 to Form 10-K for the year ended December 31, 2010). |
| Date: [removed: March 1, 2013] [added: February 28, 2014] | | | | By: | | /s/ J. Powell Brown |
| /s/ J. Powell Brown | | [added: Director;] President and Chief Executive Officer (Principal Executive Officer) | | [removed: March 1, 2013] [added: February 28, 2014] |
| /s/ Cory T. Walker | | Sr. Vice President, Treasurer and Chief Financial Officer (Principal Financial and Accounting Officer) | | [removed: March 1, 2013] [added: February 28, 2014] |
| * | | Chairman of the Board | | [removed: March 1, 2013] [added: February 28, 2014] |
| 10.4(i) | | Employment Agreement, dated as of January 9, 2012, between the Registrant and Chris L. Walker (incorporated by reference to Exhibit 10.1 to Form 10-Q for the quarter ended March 31, 2013). |
| 10.4(j) | | Transition Agreement, dated as of November 7, 2013, between the Registrant and Cory T. Walker. |
| 10.8(b) | | Form of Performance-Triggered Stock Grant Agreement under 2010 Stock Incentive Plan (incorporated by reference to Exhibit 10.1 to Form 8-K filed on July 8, 2013). |
| 10.14 | | Merger Agreement, dated May 21, 2013, among Brown & Brown, Inc., Brown & Brown Merger Co., Beecher Carlson Holdings, Inc., and BC Sellers’ Representative LLC, solely in its capacity as the representative of Beecher’s shareholders (incorporated by reference to Exhibit 10.1 to Form 10-Q for the quarter ended June 30, 2013). |
| | | |
| | | |
| | | |
| * | | Director | | February 28, 2014 |
| * | | Director | | February 28, 2014 |
| * | | Director | | February 28, 2014 |
| * | | Director | | February 28, 2014 |
| * | | Director | | February 28, 2014 |
| James S. Hunt | | | | |
| * | | Director | | February 28, 2014 |
| * | | Director | | |
| Timothy R.M. Main | | | February 28, 2014 | |
| * | | Director | | February 28, 2014 |
| * | | Director | | February 28, 2014 |
| * | | Director | | February 28, 2014 |
| | | |
| | | |
| --- | --- |
| * | These interactive data files shall not be deemed filed for purposes of Section 11 or 12 of the Securities Act of 1933, as amended, or Section 18 of the Securities Exchange Act of 1934, as amended, or otherwise subject to liability under those sections. |
| | | | | |
| * | | Director | | March 1, 2013 |
| * | | Director | | March 1, 2013 |
| * | | Director | | March 1, 2013 |
| * | | Director | | March 1, 2013 |
| * | | Director | | March 1, 2013 |
| * | | | | |
| Timothy R.M. Main | | Director | | March 1, 2013 |
| * | | Director | | March 1, 2013 |
| * | | Director | | March 1, 2013 |
| * | | Director | | March 1, 2013 |
| John R. Riedman | | | | |
| * | | Director | | March 1, 2013 |