 filings.tools
Brown & Brown (BRO) 10-K risk factor changes: FY2019 vs FY2018
The 2019-12-31 10-K against the 2018-12-31 one, compared heading by heading and sentence by sentence.
Item 1A60 rewritten42 added4 removed164 unchanged
All filing items1,317 rewritten793 added548 removed964 unchanged
Summary
counted, not written
- Item 1A headings could not be compared: only 5 carried over between the two years, which usually means one filing was read wrongly, so none is reported as new or removed.
- Sentence by sentence, 793 added, 548 removed, 1,317 rewritten and 964 unchanged across 20 items that differ.
Sentences by item
22 items, with every count and a link to each item that changed
Underlined words on a shaded ground are new in FY2019; struck-through words were in FY2018. Sentences that are wholly new or wholly gone are labelled rather than marked.
Item 1A. Risk Factors.
60 rewritten, 42 added, 4 removed, 164 unchanged
[removed: Risks] [added: Risks] Related to Our [removed: Business][added: Business]
[removed: OUR] [added: OUR] INABILITY TO RETAIN OR HIRE QUALIFIED EMPLOYEES, AS WELL AS THE LOSS OF ANY OF OUR EXECUTIVE [removed: OFFICERS,] [added: OFFICERS OR OTHER KEY EMPLOYEES,] COULD NEGATIVELY IMPACT OUR ABILITY TO RETAIN EXISTING BUSINESS AND GENERATE NEW [removed: BUSINESS.][added: BUSINESS.]
[removed: OUR] [added: OUR] GROWTH STRATEGY DEPENDS, IN PART, ON THE ACQUISITION OF OTHER INSURANCE INTERMEDIARIES, WHICH MAY NOT BE AVAILABLE ON ACCEPTABLE TERMS IN THE FUTURE OR WHICH, IF CONSUMMATED, MAY NOT BE ADVANTAGEOUS TO [removed: US.][added: US.]
[removed: A] [added: A] CYBERSECURITY ATTACK, OR ANY OTHER INTERRUPTION IN INFORMATION TECHNOLOGY AND/OR DATA SECURITY AND/OR OUTSOURCING RELATIONSHIPS, COULD ADVERSELY AFFECT OUR BUSINESS, FINANCIAL CONDITION AND [removed: REPUTATION.][added: REPUTATION.]
We rely on information technology and [removed: third party] [added: third-party] vendors to provide effective and efficient service to our customers, process claims, and timely and accurately report information to carriers and which often involves secure processing of confidential sensitive, proprietary and other types of information.
In the future, any material breaches of cybersecurity, or media reports of the same, even if untrue, could cause us to experience reputational harm, loss of [removed: clients] [added: customers] and revenue, loss of proprietary data, regulatory actions and scrutiny, sanctions or other statutory penalties, litigation, liability for failure to safeguard [removed: clients’] [added: customers’] information or financial losses.
[removed: CHANGES] [added: CHANGES] IN DATA PRIVACY AND PROTECTION LAWS AND REGULATIONS, OR ANY FAILURE TO COMPLY WITH SUCH LAWS AND REGULATIONS, COULD ADVERSELY AFFECT OUR BUSINESS AND FINANCIAL [removed: RESULTS.][added: RESULTS.]
These laws apply to transfers of information among our affiliates, as well as to transactions we enter into with [removed: third party] [added: third-party] vendors.
In addition, legislators and regulators in the U.S. have enacted and are proposing new and more robust privacy and cybersecurity laws and regulations in light of the recent broad-based [removed: cyber attacks] [added: cyber-attacks] at a number of companies, including but not limited to the New York State Department of Financial Services Cybersecurity Requirements for Financial Services Companies and the California Consumer Privacy Act of 2018.
[removed: WE] [added: WE] DERIVE A SIGNIFICANT PORTION OF OUR COMMISSION REVENUES FROM A LIMITED NUMBER OF INSURANCE COMPANIES, THE LOSS OF WHICH COULD RESULT IN ADDITIONAL EXPENSE AND LOSS OF MARKET [removed: SHARE.][added: SHARE.]
For the year ended December 31, [removed: 2018,] [added: 2019,] no insurance company accounted for more than [removed: 5.0%] [added: 4.0%] of our total core commissions.
For [added: each of] the years ended December 31, [removed: 2017] [added: 2018] and [removed: 2016,] [added: 2017,] approximately 5.0% [removed: and 6.0%, respectively,] of our total core commissions was derived from insurance policies underwritten by one insurance company.
A significant portion of our business is concentrated in Arizona, California, Florida, Georgia, Illinois, Indiana, [removed: Kentucky] [added: Kentucky,] Massachusetts, Michigan, Minnesota, New Jersey, New York, North Carolina, Oregon, Pennsylvania, Texas, Virginia, Washington and Wisconsin.
For the years ended December 31, [removed: 2018, 2017] [added: 2019, 2018] and [removed: 2016,] [added: 2017,] we derived [added: $2,106.3 million or 88.1%,] $1,976.5 million or 88.6%, [added: and] $1,692.6 million or 90.0%, [removed: and $1,574.0 million or 89.1%,] of our annualized revenue, respectively, from our operations located in these states.
We are susceptible to losses and interruptions caused by hurricanes (particularly in Florida, where we have [removed: 46] [added: 52] offices and our headquarters, as well as in Texas, where we have [removed: 14 offices.),] [added: 20 offices),] earthquakes (including in California, where we have [removed: 24] [added: 29] offices), power shortages, telecommunications failures, water shortages, floods, fire, extreme weather conditions, geopolitical events such as terrorist acts and other natural or man-made disasters.
[removed: OUR] [added: OUR] CORPORATE CULTURE HAS CONTRIBUTED TO OUR SUCCESS, AND IF WE CANNOT MAINTAIN THIS CULTURE, OR IF WE EXPERIENCE A CHANGE IN MANAGEMENT, MANAGEMENT PHILOSOPHY, OR BUSINESS STRATEGY, OUR BUSINESS MAY BE [removed: HARMED.][added: HARMED.]
At December 31, [removed: 2018,] [added: 2019,] we believe we were in compliance with the financial covenants and other limitations contained in each of these agreements.
[removed: CERTAIN] [added: CERTAIN] OF OUR AGREEMENTS CONTAIN VARIOUS COVENANTS THAT LIMIT THE DISCRETION OF OUR MANAGEMENT IN OPERATING OUR BUSINESS AND COULD PREVENT US FROM ENGAGING IN CERTAIN POTENTIALLY BENEFICIAL [removed: ACTIVITIES.][added: ACTIVITIES.]
[removed: THERE] [added: THERE] ARE INHERENT UNCERTAINTIES INVOLVED IN ESTIMATES, JUDGMENTS AND ASSUMPTIONS USED IN THE PREPARATION OF FINANCIAL STATEMENTS IN ACCORDANCE WITH U.S. GAAP.
ANY CHANGES IN ESTIMATES, JUDGMENTS AND ASSUMPTIONS COULD HAVE A MATERIAL ADVERSE EFFECT ON OUR FINANCIAL POSITION AND RESULTS OF OPERATIONS AND THEREFORE OUR [removed: BUSINESS.][added: BUSINESS.]
[removed: IMPROPER] [added: IMPROPER] DISCLOSURE OF CONFIDENTIAL INFORMATION COULD NEGATIVELY IMPACT OUR [removed: BUSINESS.][added: BUSINESS.]
We have put in place policies, procedures and technological safeguards designed to protect the security and privacy of this [removed: information,] [added: information;] however, we cannot guarantee that this information will not be improperly disclosed or accessed.
[removed: DUE] [added: DUE] TO INHERENT LIMITATIONS, THERE CAN BE NO ASSURANCE THAT OUR SYSTEM OF DISCLOSURE AND INTERNAL CONTROLS AND PROCEDURES WILL BE SUCCESSFUL IN PREVENTING ALL ERRORS OR FRAUD, OR IN INFORMING MANAGEMENT OF ALL MATERIAL INFORMATION IN A TIMELY [removed: MANNER.][added: MANNER.]
Such claims, lawsuits and other proceedings could, for example, include claims for damages based upon allegations that our employees or sub-agents failed to procure coverage, report claims on behalf of customers, provide insurance companies [added: with complete and accurate information relating to the risks being insured or appropriately apply funds that we hold for our customers on a fiduciary basis.]
[removed: OUR] [added: OUR] BUSINESS, AND THEREFORE OUR RESULTS OF OPERATIONS AND FINANCIAL CONDITION, MAY BE ADVERSELY AFFECTED BY FURTHER CHANGES IN THE U.S.-BASED CREDIT [removed: MARKETS.][added: MARKETS.]
[removed: CERTAIN] [added: CERTAIN] OF OUR EXISTING SHAREHOLDERS HAVE SIGNIFICANT CONTROL OF THE [removed: COMPANY.][added: COMPANY.]
At December 31, [removed: 2018,] [added: 2019,] our executive officers, directors and certain of their family members collectively beneficially owned approximately 16.7% of our outstanding common stock, of which J.
Powell Brown, our President and Chief Executive Officer, beneficially owned approximately [removed: 15.8%.][added: 15.7%.]
[removed: WE] [added: WE] HAVE OPERATIONS INTERNATIONALLY, WHICH MAY RESULT IN A NUMBER OF ADDITIONAL RISKS AND REQUIRE MORE MANAGEMENT TIME AND EXPENSE THAN OUR DOMESTIC OPERATIONS TO ACHIEVE OR MAINTAIN [removed: PROFITABILITY.][added: PROFITABILITY.]
[removed: -] [added: | | • |] Difficulties in staffing and managing foreign operations; [added: |]
| [added: |] • | Less flexible employee relationships, which may make it difficult and expensive to terminate employees and which limits our ability to prohibit employees from competing with us after their employment ceases; |
[removed: -] [added: | | • |] Political and economic instability (including acts of terrorism and outbreaks of war); [added: |]
[removed: -] [added: | | • |] Coordinating our communications and logistics across geographic distances and multiple time zones; [added: |]
[removed: -] [added: | | • |] Unexpected changes in regulatory requirements and laws; [added: |]
| [added: |] • | Adverse trade policies, and adverse changes to any of the policies of either the U.S. or any of the foreign jurisdictions in which we operate; |
[removed: -] [added: | | • |] Adverse changes in tax rates; [added: |]
[removed: -] [added: | | • |] Variations in foreign currency exchange rates; [added: |]
[removed: -] [added: | | • |] Legal or political constraints on our ability to maintain or increase prices; [added: |]
[removed: -] [added: | | • |] Governmental restrictions on the transfer of funds to or from us, including to or from our operations outside the United States; [removed: and][added: |]
| [added: |] • | Burdens of complying with a wide variety of labor practices and foreign laws, including those relating to export and import duties, environmental policies and privacy issues. |
We face a variety of risks in our services segement, including our third-party claims administration operations, that are distinct from those we face in our insurance intermediary operations.
Our Services Segment, including our third-party claims administration operations, face a variety of risks distinct from those faced by our insurance intermediary operations, including the risks that:
| | • | The favorable trend among both insurance companies and self-insured entities toward outsourcing various types of claims administration and risk management services may reverse or slow, causing our revenues or revenue growth to decline; |
| --- | --- | --- |
| | • | Concentration of large amounts of revenue with certain customers may result in greater exposure to the potential negative effects of lost business due to changes in management at such customers or for other reasons; |
| --- | --- | --- |
| | • | Contracting terms will become less favorable or the margins on our services may decrease due to increased competition, regulatory constraints, or other developments; |
| --- | --- | --- |
| | • | Our revenue is impacted by claims volumes, which are dependent upon a number of factors and difficult to forecast accurately; |
| --- | --- | --- |
| | • | Economic weakness or a slow-down in economic activity could lead to a reduction in the number of claims we process; |
| --- | --- | --- |
| | • | We may be unable to develop further efficiencies in our claims-handling business and may be unable to obtain or retain certain customers if we fail to make adequate improvements in technology or operations; and |
| --- | --- | --- |
| | • | Insurance companies or certain large self-insured entities may create in-house servicing capabilities that compete with our services. |
| --- | --- | --- |
If any of these risks materialize, our results of operations and financial condition could be adversely affected.
| --- | --- | --- |
| --- | --- | --- |
| --- | --- | --- |
| --- | --- | --- |
| --- | --- | --- |
| --- | --- | --- |
| --- | --- | --- |
| --- | --- | --- |
| --- | --- | --- |
| --- | --- | --- |
| | • | Any adverse developments arising out of the exit of the United Kingdom from the European Union, including any related economic downturn in the United Kingdom and any sustained weakness in the British pound’s exchange rate against the U.S. dollar resulting from such exit; |
| --- | --- | --- |
| | • | Burdens of complying with, and the risk of employees or third parties acting on our behalf violating, anti-corruption laws in foreign countries; and |
| --- | --- | --- |
| --- | --- | --- |
WE ARE SUBJECT TO RISKS ASSOCIATED WITH THE CURRENT INTEREST RATE ENVIRONMENT AND TO THE EXTENT WE USE DEBT TO FINANCE OUR INVESTMENTS, CHANGES IN INTEREST RATES WILL AFFECT OUR COST OF CAPITAL AND NET INVESTMENT INCOME.
As of July 2017, the UK Financial Conduct Authority (“FCA”) has urged banks and institutions to discontinue their use of the London Interbank Overnight Rate (“LIBOR”) benchmark rate for floating rate debt, and other financial instruments tied to the rate after 2021.
To help with the transition, the Federal Reserve Board and New York Fed have commissioned the Alternative Reference Rates Committee (“ARRC”), comprised of a diverse set of private-sector entities that have an important presence in markets affected by USD LIBOR and a wide array of official-sector entities, including banking and financial sector regulators, as ex-officio members.
The ARRC have recommended the Secured Overnight Financing Rate (“SOFR”) as the best alternative rate to LIBOR post discontinuance and has proposed a transition plan and timeline designed to encourage the adoption of SOFR from LIBOR.
As of December 31, 2019, the Company’s primary exposure are debt instruments referencing LIBOR-based rates which includes the Amended and Restated Credit Agreement (the “Amended and Restated Credit Agreement”) term loan balance of $330.0 million and $100.0 million on the revolving credit facility outstanding and matures in June 2022, as well as the term loan credit agreement (the “Term Loan Credit Agreement”) which had an outstanding balance of $285.0 million and matures in December 2023.
As such, any potential effect of any such event on our cost of capital, interest rate exposure and net investment income cannot yet be determined.
In addition, any further changes or reforms to the determination or supervision of LIBOR may result in a sudden or prolonged increase or decrease in reported LIBOR, which could have an adverse impact on the market value for or value of any LIBOR-linked securities, loans, and other financial obligations or extensions of credit held by or due to us and could have a material adverse effect on our business, financial condition and results of operations.
The Company is currently evaluating the transition from LIBOR as an interest rate benchmark to other potential alternative reference rates, including but not limited to the SOFR interest rate.
with complete and accurate information relating to the risks being insured or appropriately apply funds that we hold for our customers on a fiduciary basis.
| | |
| --- | --- |
generally paid over the course of the year.
An excerpt. Shown here: 40 of 60 rewritten, 40 of 42 added and all 4 removed. The counts are complete. For every sentence, read Item 1A. Risk Factors. in the FY2019 filing and the FY2018 filing.
Item 7. Management’s Discussion and Analysis of Financial Condition and Results of Operations.
247 rewritten, 157 added, 234 removed, 154 unchanged
[removed: General][added: General]
We have increased revenues every year from 1993 to [removed: 2018,] [added: 2019,] with the exception of 2009, when our revenues [removed: dropped] [added: declined] 1.0%.
Our revenues grew from $95.6 million in 1993 to [removed: $2.0] [added: $2.4] billion in [removed: 2018,] [added: 2019,] reflecting a compound annual growth rate of [removed: 13.0%.][added: 13.2%.]
In the same [removed: 25-year] [added: 26-year] period, we increased net income from $8.1 million to [removed: $344.3] [added: $398.5] million in [removed: 2018,] [added: 2019,] a compound annual growth rate of 16.2%.
We foster a strong, decentralized sales and service culture [added: that leverages the broad capabilities and scale of our organization,] with the goal of consistent, sustained growth over the long-term.
The term “Organic Revenue,” a non-GAAP measure, is our core commissions and fees [removed: less] [added: less:] (i) the core commissions and fees earned for the first [removed: twelve] [added: 12] months by newly-acquired [removed: operations,] [added: operations and] (ii) divested business (core commissions and fees generated from offices, books of business or niches sold or terminated during the comparable period), and [added: for the calculation of Organic Revenue growth in 2018 only] (iii) the impact of the adoption of Accounting Standards Update [removed: No. 2014-09,] [added: No.2014-09,] “Revenue from Contracts with Customers (Topic 606)” and Accounting Standards Codification Topic 340 – Other Assets and Deferred Cost (the “New Revenue Standard”) [removed: effective January 1, 2018.][added: in order to be on a comparable basis with 2017.]
The resulting net change reflects the aggregate changes attributable [removed: to] [added: to:] (i) net new and lost accounts, (ii) net changes in our customers’ exposure units, (iii) net changes in insurance premium rates or the commission rate paid to us by our carrier partners, [added: and] (iv) the net change in fees paid to us by our [removed: customers and (v) fees earned based upon claim processing volumes within our Services Segment.][added: customers.]
Organic Revenue is reported in “Results of Operations” and in “Results of Operations - Segment Information” of this [added: Annual Report on] Form 10-K.
These [removed: commissions] [added: commissions,] which are included in our commissions and fees in the Consolidated Statement of Income, are accrued throughout the year based on actual premiums written and are primarily received in the first and second quarters of each year, based upon the aforementioned considerations for the prior year(s).
Over the last three years, profit-sharing contingent commissions have averaged approximately [removed: 3.1%] [added: 3.0%] of [removed: the previous year’s] commissions and fees revenue.
For the year ended December 31, [removed: 2018,] [added: 2019,] we had earned [removed: $10.0] [added: $23.1] million of GSCs, of which [removed: $8.9] [added: $12.7] million remained accrued at December 31, [removed: 2018 as] [added: 2019 and] most of this will be collected over the first and second quarters of [removed: 2019.][added: 2020.]
For the years ended December 31, [removed: 2018, 2017,] [added: 2019] and [removed: 2016,] [added: 2018,] we earned [removed: $10.0 million, $10.4] [added: $23.1] million and [removed: $11.5] [added: $10.0] million, respectively, from GSCs.
Combined, our profit-sharing contingent commissions and GSCs for the year ended December 31, [removed: 2018] [added: 2019] increased by [removed: $3.3] [added: $16.4] million over [removed: 2017 primarily as a result of an increase in profit-sharing contingent commissions and GSCs in the National Programs Segments.][added: 2018.]
Fee revenues have historically been generated primarily by: (1) our Services Segment, which provides insurance-related services, including third-party claims administration and comprehensive medical utilization management services in both the workers’ compensation and all-lines liability arenas, as well as Medicare Set-aside services, Social Security disability and Medicare benefits advocacy services, and claims adjusting services; (2) our National Programs and Wholesale Brokerage Segments, which earn fees primarily for the issuance of insurance policies on behalf of insurance companies; and [removed: to a lesser extent][added: (3) our Retail Segment in our]
Fee revenues as a percentage of our total commissions and fees, represented [removed: 19.8% in 2018, 31.5%] [added: 27.1%] in [removed: 2017] [added: 2019] and [removed: 31.3%] [added: 26.3%] in [removed: 2016.][added: 2018.]
For the years ended December 31, [removed: 2018] [added: 2019] and [removed: 2017,] [added: 2018,] our commissions and fees growth rate was [removed: 8.2%] [added: 18.7%] and [removed: 5.4%,] [added: 8.2%,] respectively, and our consolidated Organic Revenue growth rate was [removed: 2.4%] [added: 3.6%] and [removed: 4.4%,] [added: 2.4%,] respectively.
In the event that the gradual increases in insurable exposure units that occurred in the past few years continues through [removed: 2019] [added: 2020] and premium rate changes are similar with [removed: 2018,] [added: 2019,] we believe we will continue to see positive quarterly Organic Revenue growth rates in [removed: 2019.][added: 2020.]
Historically, investment income has consisted primarily of interest earnings on operating [removed: cash] [added: cash,] and where permitted, on premiums and advance premiums collected and held in a fiduciary capacity before being remitted to insurance companies.
[removed: Information] [added: Information] Regarding Non-GAAP [removed: Measures][added: Measures]
[removed: Acquisitions][added: Acquisitions]
Part of our business strategy is to attract high-quality insurance intermediaries [added: and service organizations] to join our operations.
From 1993 through the fourth quarter of [removed: 2018,] [added: 2019,] we acquired [removed: 513] [added: 536] insurance intermediary operations, excluding acquired books of business (customer accounts).
On November 15, 2018, we completed the acquisition of certain assets and assumption of certain liabilities of [removed: The Hays Group, Inc. and certain of its affiliates (collectively, “Hays”).][added: Hays.]
In addition, the Company may pay additional consideration to Hays in the form of earn-out payments in the aggregate amount of up to $25.0 million in cash over three years, which is subject to certain conditions and the successful achievement of average annual EBITDA [removed: compound annual growth rate] targets for the acquired business during 2019, 2020 and 2021.
This transaction was initially funded through utilization of the Company’s revolving line of credit within our credit facility, details of which can be found in “Management’s Discussion and Analysis of Financial [removed: Condition”,“Results] [added: Condition”, “Results] of Operations” and Note 9 “Long-Term Debt” in the “Notes to Consolidated Financial Statements”.
These estimates form the basis for our judgments about the [added: recognition of revenues, expenses,] carrying values of our assets and liabilities, of which values are not readily apparent from other sources.
Refer to Note 1 “Summary of Significant Accounting Policies” in the “Notes to Consolidated Financial Statements” for a discussion of the impacts for adopting Accounting Standards Update No. 2014-09, “Revenue from Contracts with Customers (Topic [removed: 606).][added: 606)” and No. 2016-02, “Leases (Topic 842)”.]
[removed: Revenue Recognition][added: Revenue Recognition]
In these arrangements our performance obligation is complete upon the effective date of the bound policy, as [removed: such] [added: such,] that is when the associated revenue is recognized.
When we are paid a fee for service, however, the associated revenue is recognized over a period of time that coincides with when the customer simultaneously receives and consumes the benefit of our work, which characterizes most of our claims processing arrangements and various services performed in our [added: property and casualty, and] employee benefits practices.
[removed: Business] [added: Business] Combinations and Purchase Price [removed: Allocations][added: Allocations]
Purchased customer accounts include the physical records and files obtained from acquired businesses that contain information about insurance policies, customers and other matters essential to policy [removed: renewals.][added: renewals of delivery of services.]
Acquisition purchase prices are typically based upon a multiple of average [added: EBITDA,] annual operating profit and/or core revenue earned over a one to three-year period within a minimum and maximum price range.
In determining fair value, the acquired business’s future performance is estimated using financial projections developed by management for the acquired business, and this estimate [added: reflects market participant assumptions regarding revenue growth and/or profitability.]
[removed: Intangible] [added: Intangible] Assets [removed: Impairment][added: Impairment]
We completed our most recent evaluation of impairment for goodwill as of November 30, [removed: 2018] [added: 2019] and determined that the fair value of goodwill exceeded the carrying value of such assets.
Additionally, there have been no impairments recorded for amortizable intangible assets for the years ended December 31, [removed: 2018, 2017] [added: 2019] and [removed: 2016.][added: 2018.]
[removed: Non-Cash] [added: Non-Cash] Stock-Based [removed: Compensation][added: Compensation]
During the first quarter of [removed: 2017,] [added: 2018,] the performance conditions for [removed: 326,808] [added: 260,344] shares of the Company’s common stock granted under the Company’s [added: 2010] Stock Incentive Plan [added: (the “2010 SIP”)] were determined by the Compensation Committee to have been satisfied relative to performance-based grants issued in [removed: 2012.][added: 2013.]
These grants had a performance measurement period that concluded on December 31, [removed: 2016.][added: 2019.]
As a result of our adoption of the New Revenue Standard these commissions are now accrued based upon the placement of policies during the year and the expected payments to be received.
The net increase of $16.4 million was mainly driven by: (i) a GSC of approximately $9 million recorded in the second quarter of 2019 for the National Programs Segment that will not recur in the future as the associated multi-year contract has ended and (ii) to a lesser extent growth associated with acquisitions completed over the last 12 months.
large-account customer base, where we primarily earn fees for securing insurance for our customers, and in our automobile dealer services (“F&I”) businesses where we primarily earn fees for assisting our customers with selling warranty and service programs.
Income before income taxes for the year ended December 31, 2019 increased over 2018 by $63.5 million, primarily as a result of net new business and acquisitions completed since 2018 in addition to leveraging expenses, partially offset by additional interest expense and amortization associated with the acquisitions over the past two years, with the largest being our acquisition of The Hays Group, Inc. and certain of its affiliates (“Hays”).
During the performance measurement period, we review the probable outcome of the performance conditions associated with our performance awards and align the expense accruals with the expected performance outcome.
For a comparison of our results of operations and liquidity and capital resources for the years ended December 31, 2018 and 2017, please see Part II, Item 7 of our Annual Report on Form 10-K filed with the SEC on February 26, 2019.
| --- | --- | --- | --- | --- | --- | --- | --- | --- | --- | --- | --- | --- |
| Investment income | | | 5,780 | | | | 110.5 | % | | | 2,746 | |
| Total revenues | | | 2,392,171 | | | | 18.8 | % | | | 2,014,246 | |
| Other operating expenses | | | 377,089 | | | | 13.5 | % | | | 332,118 | |
| Amortization | | | 105,298 | | | | 21.7 | % | | | 86,544 | |
| Depreciation | | | 23,417 | | | | 2.6 | % | | | 22,834 | |
| Interest | | | 63,660 | | | | 56.9 | % | | | 40,580 | |
| Total expenses | | | 1,866,242 | | | | 20.3 | % | | | 1,551,784 | |
| Income before income taxes | | | 525,929 | | | | 13.7 | % | | | 462,462 | |
| Income taxes | | | 127,415 | | | | 7.8 | % | | | 118,207 | |
| NET INCOME | | $ | 398,514 | | | | 15.8 | % | | $ | 344,255 | |
| EBITDAC (2) | | $ | 716,938 | | | | 16.5 | % | | $ | 615,389 | |
| Capital expenditures | | $ | 73,108 | | | | 76.1 | % | | $ | 41,520 | |
| Total assets at December 31 | | $ | 7,622,821 | | | | 14.0 | % | | $ | 6,688,668 | |
| (1) | “Income Before Income Taxes Margin” is defined as income before income taxes divided by total revenues |
The net increase of $16.4 million was mainly driven by: (i) a GSC of approximately $9 million recorded in the second quarter of 2019 for the National Programs Segment that will not recur in the future as the associated multi-year contract has ended and (ii) the remainder primarily from growth associated with acquisitions completed over the last 12 months.
This underlying employee compensation and benefits expense increase was primarily related to (i) an increase in teammates for certain of our higher growth businesses; (ii) an increase in bonus expense driven by the attainment of various revenue and profit targets within our businesses; (ii) increased producer commissions due to higher revenue; (iii) an increase in staff salaries attributable to salary inflation; (iv) the increase in the value of deferred compensation liabilities driven by changes in the market prices of our employees' investment elections, which was substantially offset by other operating expenses; and (v) an increase in non-cash stock-based compensation expense due to the better-than-expected Company performance related to our equity compensation plan and teammate retention.
Other operating expenses for 2019 increased $45.0 million, or 13.5%, over the same period of 2018.
Amortization expense for 2019 increased $18.8 million to $105.3 million, or 21.7% over 2018.
The increase reflects the amortization of new intangible assets from recently acquired businesses, partially offset by certain intangible assets becoming fully amortized.
Depreciation expense for 2019 increased $0.6 million to $23.4 million, or 2.6% over 2018.
Interest expense for 2019 increased $23.1 million to $63.7 million, or 56.9%, over 2018.
The increase was due to the debt issued as a result of acquisitions over the past two years, with the largest being our acquisition of Hays, and to a lesser extent a rise in interest rates associated with our outstanding floating rate debt balances.
| --- | --- | --- | --- | --- | --- | --- | --- | --- |
The reduction in the effective tax rate in 2019 as compared to 2018 was driven by changes in our state tax footprint and corresponding apportionment as well as changes to tax rates in certain states.
| --- | --- | --- | --- | --- | --- | --- | --- | --- | --- | --- | --- | --- | --- | --- | --- | --- | --- | --- | --- | --- | --- | --- | --- | --- | --- | --- | --- | --- | --- | --- | --- | --- | --- | --- | --- | --- | --- | --- | --- | --- |
| Commissions and fees | | $ | 1,364,755 | | | $ | 1,040,574 | | | $ | 516,915 | | | $ | 493,878 | | | $ | 309,426 | | | $ | 286,364 | | | $ | 193,641 | | | $ | 189,041 | | | $ | 2,384,737 | | | $ | 2,009,857 | |
| Total change | | $ | 324,181 | | | | | | | $ | 23,037 | | | | | | | $ | 23,062 | | | | | | | $ | 4,600 | | | | | | | $ | 374,880 | | | | | |
| Total growth % | | | 31.2 | % | | | | | | | 4.7 | % | | | | | | | 8.1 | % | | | | | | | 2.4 | % | | | | | | | 18.7 | % | | | | |
| Profit-sharing contingent commissions | | | (34,150 | ) | | | (24,517 | ) | | | (17,517 | ) | | | (23,896 | ) | | | (7,499 | ) | | | (7,462 | ) | | | — | | | | — | | | | (59,166 | ) | | | (55,875 | ) |
| GSCs | | | (11,056 | ) | | | (8,535 | ) | | | (10,566 | ) | | | (76 | ) | | | (1,443 | ) | | | (1,350 | ) | | | — | | | | — | | | | (23,065 | ) | | | (9,961 | ) |
| Core commissions and fees | | $ | 1,319,549 | | | $ | 1,007,522 | | | $ | 488,832 | | | $ | 469,906 | | | $ | 300,484 | | | $ | 277,552 | | | $ | 193,641 | | | $ | 189,041 | | | $ | 2,302,506 | | | $ | 1,944,021 | |
| Acquisition revenues | | | (272,383 | ) | | | — | | | | (5,721 | ) | | | — | | | | (3,628 | ) | | | — | | | | (16,541 | ) | | | — | | | | (298,273 | ) | | | — | |
| Divested business | | | — | | | | (7,743 | ) | | | — | | | | (790 | ) | | | — | | | | (1,268 | ) | | | — | | | | — | | | | — | | | | (9,801 | ) |
Other income decreased by $20.8 million primarily as a result of a legal settlement recognized in the first quarter of 2017.
(3) our Retail Segment in our large-account customer base.
Income before income taxes for the year ended December 31, 2018 increased over 2017 by $12.7 million, primarily as a result of net new business and acquisitions completed in the past twelve months offset by lower weather related claims processing revenues in 2018 and a legal settlement recorded in the first quarter of 2017.
During the year ended December 31, 2018, the Company acquired the assets and assumed certain liabilities of twenty insurance intermediaries, all of the stock of three insurance intermediaries and one book of business (customer accounts).
Collectively, these acquired businesses had annualized revenues of approximately $323.2 million.
Hays was founded in 1994 providing employee benefits, property & casualty, and personal lines insurance and has grown to be the 22nd largest U.S. broker as measured by Business Insurance magazine.
With headquarters in Minneapolis, Hays operates across twenty-one states, increasing our presence in the mid-west.
reflects market participant assumptions regarding revenue growth and/or profitability.
| | | | | | | | | | | | | | | | | | |
| --- | --- | --- | --- | --- | --- | --- | --- | --- | --- | --- | --- | --- | --- | --- | --- | --- | --- |
| Commissions and fees | 2,009,857 | | | | 8.2 | % | | 1,857,270 | | | | 5.4 | % | | 1,762,787 | | |
| Investment income | 2,746 | | | | 68.9 | % | | 1,626 | | | | 11.7 | % | | 1,456 | | |
| Total revenues | 2,014,246 | | | | 7.1 | % | | 1,881,347 | | | | 6.5 | % | | 1,766,629 | | |
| Other operating expenses | 332,118 | | | | 17.2 | % | | 283,470 | | | | 7.8 | % | | 262,872 | | |
| Amortization | 86,544 | | | | 1.3 | % | | 85,446 | | | | (1.4 | )% | | 86,663 | | |
| Depreciation | 22,834 | | | | 0.6 | % | | 22,698 | | | | 8.1 | % | | 21,003 | | |
| Interest | 40,580 | | | | 5.9 | % | | 38,316 | | | | (3.0 | )% | | 39,481 | | |
| Total expenses | 1,551,784 | | | | 8.4 | % | | 1,431,625 | | | | 6.6 | % | | 1,343,130 | | |
| Income before income taxes | 462,462 | | | | 2.8 | % | | 449,722 | | | | 6.2 | % | | 423,499 | | |
| Income taxes | 118,207 | | | | 136.0 | % | | 50,092 | | | | (69.8 | )% | | 166,008 | | |
| NET INCOME | $ | 344,255 | | | (13.8 | )% | | $ | 399,630 | | | 55.2 | % | | $ | 257,491 | |
| EBITDAC (1) | 615,389 | | | | 1.7 | % | | 605,382 | | | | 4.4 | % | | 579,831 | | |
| Capital expenditures | $ | 41,520 | | | 71.6 | % | | $ | 24,192 | | | 36.2 | % | | $ | 17,765 | |
| Total assets at December 31 | $ | 6,688,668 | | | 16.4 | % | | $ | 5,747,550 | | | 9.2 | % | | $ | 5,262,734 | |
NMF = Not a meaningful figure
The net increase of $3.3 million was mainly driven by an increase in profit-sharing contingent commissions and GSCs in the National Programs Segment.
Core commissions and fees in 2017 increased $97.4 million, of which approximately $27.7 million represented core commissions and fees from agencies acquired since 2016 that had no comparable revenues.
After accounting for divested business of $4.9 million, the remaining net increase of $74.6 million represented net new business, which reflected an Organic Revenue growth rate of 4.4% for core commissions and fees.
Profit-sharing contingent commissions and GSCs for 2017 decreased by $2.9 million, or 4.5%, compared to the same period in 2016.
The net decrease of $2.9 million was mainly driven by a decrease in profit-sharing contingent commissions and GSCs in the Retail and Wholesale Brokerage Segments, as a result of increased loss ratios and lower premium rates, which was partially offset by an increase in profit-sharing contingent commissions and GSCs in the National Programs Segment.
In 2017, $20.0 million of other income was recognized as a result of a legal settlement with AssuredPartners.
This underlying employee compensation and benefits expense increase was primarily related to (i) an increase in staff salaries attributable to salary inflation, higher volumes in portions of our business and the mix of business across the company; (ii) increased producer commissions due to higher revenue; partially offset by (iii) a decrease of approximately $8.8 million in commission expense as a result of the adoption of the New Revenue Standard which requires the deferral of incremental costs to obtain a customer contract, and (iv) the increase in the value of corporate-owned life insurance policies associated with our deferred compensation plan which is substantially offset in other operating expenses.
Employee compensation and benefits expense increased 7.5%, or $69.4 million, in 2017 over 2016.
This increase included $11.1 million of compensation costs related to stand-alone acquisitions that had no comparable costs in the same period of 2016.
Therefore, employee compensation and benefits expense attributable to those offices that existed in the same time periods of 2017 and 2016 increased by $58.3 million or 6.4%.
This underlying employee compensation and benefits expense increase was primarily related to (i) higher bonuses due to increased revenue and operating profit as well as the additional cost associated with the Retail Segment’s performance incentive plan introduced in 2017, (ii) an increase in producer commissions driven by new and renewed business, (iii) an increase in non-cash stock-based compensation expense due to forfeiture credits recognized in 2016, and (iv) increased staff salaries attributable to salary inflation and higher volumes in portions of our business.
Employee compensation and benefits expense as a percentage of total revenues was 52.9% for 2017 as compared to 52.4% for the year ended December 31, 2016.
Other operating expenses in 2018 increased 17.2%, or $48.6 million, over 2017, of which $14.0 million was related to acquisitions that had no comparable costs in the same period of 2017.
Other operating expenses in 2017 increased 7.8%, or $20.6 million, over 2016, of which $3.3 million was related to acquisitions that had no comparable costs in the same period of 2016.
The other operating expenses for those offices that existed in the same periods in both 2017 and 2016, increased by $17.3 million or 6.6%, which was primarily attributable to (i) higher data processing costs related to our multi-year technology investment program, (ii) the receipt of certain premium tax refunds by our National Flood Program business in 2016, and (iii) professional fees at our National Programs Division.
An excerpt. Shown here: 40 of 247 rewritten, 40 of 157 added and 40 of 234 removed. The counts are complete. For every sentence, read Item 7. Management’s Discussion and Analysis of Financial Condition and Results of Operations. in the FY2019 filing and the FY2018 filing.
Item 7A. Quantitative and Qualitative Disclosures About Market Risk.
3 rewritten, 4 added, 0 removed, 8 unchanged
The fair values of our invested assets at December 31, [removed: 2018] [added: 2019] and December 31, [removed: 2017,] [added: 2018,] approximated their respective carrying values due to their short-term duration and therefore, such market risk is not considered to be material.
As of December 31, [removed: 2018,] [added: 2019,] we had [removed: $1,015.0] [added: $715.0] million of borrowings outstanding under our various credit agreements, all of which bear interest on a floating basis tied to [removed: LIBOR] [added: London Interbank Overnight Rate (“LIBOR”)] and is therefore subject to changes in the associated interest expense.
Based upon our foreign currency rate exposure as of December 31, [removed: 2018,] [added: 2019,] an immediate 10% hypothetical changes of foreign currency exchange rates would not have a material effect on our Consolidated Financial Statements.
As of July 2017, the UK Financial Conduct Authority has urged banks and institutions to discontinue their use of the LIBOR benchmark rate for floating rate debt, and other financial instruments tied to the rate after 2021.
The Alternative Reference Rates Committee (“ARRC”) have recommended the Secured Overnight Financing Rate (“SOFR”) as the best alternative rate to LIBOR post discontinuance and has proposed a transition plan and timeline designed to encourage the adoption of SOFR from LIBOR.
The Company is currently evaluating the transition from LIBOR as an interest rate benchmark to other potential alternative reference rates, including but not limited to the SOFR interest rate.
Management will continue to actively asses the related opportunities and risks associated with the transition and monitor related proposals and guidance published by ARRC and other alternative-rate initiatives, with an expectation the we will be prepared to for a termination of LIBOR benchmarks after 2021.
Item 1. Business.
94 rewritten, 22 added, 22 removed, 110 unchanged
[removed: General][added: General]
WNFIC’s [removed: entire] [added: underwriting] business consists [added: entirely] of policies written pursuant to the National Flood Insurance Program (“NFIP”), the program administered by the Federal Emergency Management Agency [removed: (“FEMA”)] [added: (“FEMA”),] and excess flood policies which are fully reinsured, thereby substantially eliminating WNFIC’s exposure to underwriting risk, as these policies are backed by either FEMA or a reinsurance carrier with an AM Best Company rating of “A” or better.
As of December 31, [removed: 2018,] [added: 2019,] our activities were conducted in [removed: 286] [added: 311] locations in [removed: 42] [added: 44] states as follows, as well as in England, [removed: Canada,] Bermuda, and the Cayman Islands:
| Washington | [removed: 14] [added: 15] | | | Indiana | 4 | | [removed: North Carolina] [added: Maine] | 1 |
| New Jersey | [removed: 13] [added: 14] | | | [removed: Oklahoma] [added: Michigan] | 4 | | Mississippi | 1 |
| Pennsylvania | [removed: 11] [added: 12] | | | [removed: Montana] [added: Wisconsin] | 4 | | [removed: Delaware] [added: Montana] | 1 |
| [removed: Illinois] [added: Minnesota] | [removed: 7] [added: 9] | | | New Mexico | 3 | | [added: Nevada] | [added: 1] |
[removed: Industry Overview][added: Industry Overview]
Premium pricing within the property and casualty insurance underwriting (risk-bearing) industry has historically been cyclical in [removed: nature,] [added: nature] and has varied widely based upon market conditions with a “hard” market in which premium rates are increasing or a “soft” market, characterized by stable or declining premium rates in many lines and geographic areas.
The Retail Segment provides a broad range of insurance products and services to commercial, public and quasi-public entities, and to professional and individual [removed: customers.][added: customers, and non-insurance risk-mitigating products through our automobile dealer services (“F&I”) businesses.]
The following table summarizes (1) the commissions and fees generated by each of our reportable operating segments for [removed: 2018, 2017] [added: 2019, 2018] and [removed: 2016,] [added: 2017,] and (2) the percentage of our total commissions and fees represented by each segment for each such period:
| [removed: (in] [added: (in] thousands, except [removed: percentages)] [added: percentages)] | [removed: 2018] | [added: 2019] | | | [removed: %] | [added: %] | | [removed: 2017] | | [added: 2018] | | [removed: %] | | [added: %] | [removed: 2016] | | | [added: 2017] | [removed: %] | | [added: | % | | |]
| Retail Segment | [added: |] $ | [removed: 1,041,691] [added: 1,366,016] | | | [removed: 51.8] | [added: 57.3 |] % | | $ | [removed: 942,247] [added: 1,041,691] | | | [removed: 50.7] | [added: 51.8 |] % | | $ | [removed: 916,723] [added: 942,247] | | | [removed: 52.0] | [added: 50.7 |] % |
| National Programs Segment | [removed: 493,878] | | [added: 516,915] | | [removed: 24.6] | [added: | 21.7 |] % | | [removed: 479,017] | [added: 493,878] | | | [removed: 25.8] | [added: 24.6 |] % | | [removed: 447,808] | [added: 479,017] | | | [removed: 25.4] | [added: 25.8 |] % |
| Wholesale Brokerage Segment | [removed: 286,364] | | [added: 309,426] | | [removed: 14.2] | [added: | 13.0 |] % | | [removed: 271,141] | [added: 286,364] | | | [removed: 14.6] | [added: 14.2 |] % | | [removed: 242,813] | [added: 271,141] | | | [removed: 13.8] | [added: 14.6 |] % |
| Services Segment | [removed: 189,041] | | [added: 193,641] | | [removed: 9.4] | [added: | 8.1 |] % | | [removed: 165,073] | [added: 189,041] | | | [removed: 8.9] | [added: 9.4 |] % | | [removed: 156,082] | [added: 165,073] | | | [removed: 8.8] | [added: 8.9 |] % |
| Other | [removed: (1,117] | | [added: (1,261 |] ) | | [removed: —] | [removed: %] [added: (0.1] | [added: )%] | [removed: (208] | | [added: (1,117 |] ) | | [removed: —] | [removed: %] [added: (0.0] | [added: )%] | [removed: (639] | | [added: (208 |] ) | | [removed: —] | [removed: %] [added: (0.0] | [added: )% |]
| Total | [added: |] $ | [removed: 2,009,857] [added: 2,384,737] | | | [added: |] 100.0 | % | | $ | [removed: 1,857,270] [added: 2,009,857] | | | [added: |] 100.0 | % | | $ | [removed: 1,762,787] [added: 1,857,270] | | | [added: |] 100.0 | % |
These operations generated [removed: $15.2] [added: $17.7] million, [removed: $15.9] [added: $15.2] million and [removed: $14.5] [added: $15.9] million of revenues for the years ended December 31, [removed: 2018, 2017] [added: 2019, 2018] and [removed: 2016,] [added: 2017,] respectively.
See Note [removed: 16] [added: 17] to the Consolidated Financial Statements and “Management’s Discussion and Analysis of Financial Condition and Results of Operations” for additional segment financial data relating to our business.
[removed: Retail Segment][added: Retail Segment]
As of December 31, [removed: 2018,] [added: 2019,] our Retail Segment employed [removed: 5,028 full-time equivalent] [added: 5,406] employees.
Our retail insurance agency business provides a broad range of insurance products and services to commercial, public and quasi-public entities, professional and individual [removed: customers.][added: customers, and non-insurance risk-mitigating products through our automobile dealer services (“F&I”) businesses.]
During [removed: 2018,] [added: 2019,] commissions and fees from our largest single Retail Segment customer represented three tenths of one percent [removed: (0.3%)] [added: (0.3)%] of the Retail Segment’s total commissions and fees.
[removed: National] [added: National] Programs [removed: Segment][added: Segment]
As of December 31, [removed: 2018,] [added: 2019,] our National Programs Segment employed [removed: 1,962 full-time equivalent] [added: 2,004] employees.
Our National Programs Segment works with over [removed: 40] [added: 100] well-capitalized carrier partners, offering [removed: more than 51] [added: over 40] programs, which can be grouped into five broad categories: (1) Professional Programs, (2) Personal Lines Programs, (3) Commercial Programs, (4) Public Entity-Related Programs, and (5) the National Flood Program:
[removed: Professional Programs.] Professional Programs provide professional liability and related package insurance products tailored to the needs of specific professional groups.
In addition, Professional Programs encompasses supplementary insurance-related products to include weddings, events, medical facilities and [removed: cyber liability.][added: cyber-liability.]
[removed: *Dentists:*] [added: Dentists:] First initiated in 1969, the Professional Protector Plan® (“PPP®”) for Dentists provides dental professionals insurance products including professional and general liability, property, employment practices liability, workers’ compensation, claims and risk management.
[removed: *Financial Professionals:*] [added: Financial Professionals:] CalSurance® and CITA Insurance Services® have specialized since 1980 to offer professional liability programs designed for insurance agents, financial advisors, registered representatives, securities broker-dealers, benefit administrators, real estate brokers and real estate title agents.
[removed: *Lawyers*:] [added: Lawyers:] The Lawyer’s Protector Plan® (“LPP®”) has been providing professional liability insurance for over 30 years with a niche focus on law firms with fewer than 20 attorneys.
[removed: *Optometrists,] [added: Optometrists,] Opticians, and [removed: Ophthalmologists*:] [added: Ophthalmologists:] Since 1973 the Optometric Protector Plan® (“OPP®”), provides professional liability, general liability, property, workers’ compensation insurance and risk management programs for eye care professionals nationwide.
[removed: *Physicians:*] [added: Physicians:] The Physicians Protector Plan program provides professional liability insurance solutions for physicians on an admitted basis in several key states.
[removed: *Professional] [added: Professional] Risk Specialty [removed: Group:*] [added: Group:] Professional Risk Specialty Group (“PRSG”) has been providing errors & omissions (“E&O”), professional liability and malpractice insurance for over 22 years both in a direct retail sales and brokering capacity.
[removed: *Real] [added: Real] Estate Title [removed: Professionals:*] [added: Professionals:] TitlePac® provides professional liability products and services designed for real estate title agents and escrow agents.
[removed: *Wedding] [added: Wedding] Protector [removed: Plan®* *and] [added: Plan® and] Protector [removed: Plan®* *for Events:*] [added: Plan® for Events:] These programs provide an online wedding and private event cancellation and postponement insurance policy that offers financial protection if certain unfortunate or unforeseen events should occur during the period leading up to and including the wedding or event date.
Liability and liquor liability [removed: is] [added: are] available as [removed: an option.][added: options.]
[removed: Personal] [added: Personal] Lines [removed: Programs.][added: Programs.]
Arrowhead acts as a virtual insurer [removed: providing] [added: and can provide] outsourced product development, marketing, underwriting, actuarial, compliance and claims and other administrative services to insurance carrier partners.
| Florida | 52 | | | Virginia | 6 | | Rhode Island | 2 |
| California | 29 | | | Arkansas | 5 | | Tennessee | 2 |
| Texas | 20 | | | Colorado | 5 | | Alabama | 1 |
| New York | 19 | | | Connecticut | 4 | | Delaware | 1 |
| Massachusetts | 16 | | | Hawaii | 4 | | Iowa | 1 |
| Georgia | 10 | | | Kentucky | 3 | | North Carolina | 1 |
| Louisiana | 10 | | | Maryland | 3 | | New Hampshire | 1 |
| Oregon | 9 | | | Ohio | 3 | | South Dakota | 1 |
| Illinois | 8 | | | Oklahoma | 3 | | Utah | 1 |
| Arizona | 7 | | | South Carolina | 3 | | Vermont | 1 |
| Missouri | 6 | | | Kansas | 2 | | | |
| --- | --- | --- | --- | --- | --- | --- | --- | --- | --- | --- | --- | --- | --- | --- | --- | --- | --- | --- | --- | --- | --- | --- | --- | --- |
Professional Programs.
Also available through the Dentists program is cyber/data breach insurance offering a solution to privacy breaches and information security exposures tailored to the needs of healthcare organizations.
Commercial Programs.
FIU has developed a specialty insurance facility to support the underwriting activities associated with these risks.
Sigma Underwriting Managers is a nationwide wind catastrophic property insurance specialist for commercial and habitational properties and has over 100 years of underwriting experience.
The Florida habitational property program is a high-valued property program for commercial residential accounts.
Public Risk Underwriters of New Jersey, Inc.: provides administrative services and insurance procurement for the Statewide Insurance Fund (“Statewide”).
National Flood Program.
MEDVAL, LLC, provides an end to end solution for Medicare Secondary Payer compliance, including Medicare Set-Aside allocations, conditional payment negotiation and resolution, structured settlements/annuity funding, professional administration, and a post-settlement durable medical equipment and pharmacy program.
MEDVAL’s offerings are all done in-house, and under one umbrella to provide the most consistent and reliable results.
| | | | | | | | | |
| Florida | 46 | | | Michigan | 5 | | Kentucky | 2 |
| California | 24 | | | Connecticut | 5 | | New Hampshire | 2 |
| New York | 19 | | | Colorado | 5 | | Rhode Island | 2 |
| Texas | 14 | | | Wisconsin | 4 | | Utah | 2 |
| Georgia | 14 | | | Virginia | 4 | | Kansas | 2 |
| Minnesota | 11 | | | Arkansas | 4 | | Vermont | 1 |
| Massachusetts | 10 | | | Ohio | 4 | | Nevada | 1 |
| Louisiana | 9 | | | South Carolina | 3 | | Maine | 1 |
| Oregon | 9 | | | Maryland | 3 | | Iowa | 1 |
| Arizona | 6 | | | Tennessee | 3 | | | |
| Hawaii | 5 | | | Missouri | 2 | | | |
| | | | | | | | | | | | | | | | | | | | | |
| --- | --- | --- | --- | --- | --- | --- | --- | --- | --- | --- | --- | --- | --- | --- | --- | --- | --- | --- | --- | --- |
| | |
| --- | --- |
| | *Healthcare Professionals:* Allied Protector Plan® (“APP®”) specializes in customized professional liability and business insurance programs for individual practitioners and businesses in the healthcare industry. The APP program offers liability insurance coverage for, among others, dental hygienists and dental assistants, home health agencies, physical therapy clinics, and medical directors. Also available through the APP program is cyber/data breach insurance offering a solution to privacy breaches and information security exposures tailored to the needs of healthcare organizations. |
*Marine:* is a national program manager and wholesale producer of marine insurance products including yachts and high-performance boats, small boats, commercial marine and marine artisan contractors.
Commercial Programs.
*American Specialty Insurance & Risk Services, Inc*.
*Proctor Financial, Inc*.
For the purposes of measuring full-time equivalent employees, those working more than 30 hours per week are counted as a full-time equivalent employee and those working less than 30 hours per week are counted as half of a full-time equivalent employee.
An excerpt. Shown here: 40 of 94 rewritten, all 22 added and all 22 removed. The counts are complete. For every sentence, read Item 1. Business. in the FY2019 filing and the FY2018 filing.
Cover and table of contents
65 rewritten, 66 added, 20 removed, 42 unchanged
[removed: UNITED STATES][added: UNITED STATES]
[removed: SECURITIES] [added: SECURITIES] AND EXCHANGE [removed: COMMISSION][added: COMMISSION]
[removed: Washington,] [added: Washington,] D.C. [removed: 20549][added: 20549]
[removed: FORM 10-K][added: FORM 10-K]
[removed: | ý | ANNUAL] [added: ☒ANNUAL] REPORT PURSUANT TO SECTION 13 OR 15(d) OF THE SECURITIES EXCHANGE ACT OF 1934 [removed: |]
[removed: For] [added: For] the fiscal year [removed: ended December] [added: ended December] 31, [removed: 2018][added: 2019]
[removed: | ¨ | TRANSITION] [added: ☐TRANSITION] REPORT PURSUANT TO SECTION 13 OR 15(d) OF THE SECURITIES EXCHANGE ACT OF 1934 [removed: |]
[removed: For] [added: For] the transition period [removed: from to][added: from to]
[removed: Commission] [added: Commission] file number [removed: 001-13619][added: 001-13619]
[removed: BROWN] [added: BROWN] & BROWN, [removed: INC.][added: INC.]
[removed: (Exact] [added: (Exact] name of registrant as specified in its [removed: charter)][added: charter)]
| [removed: Florida] [added: Florida] | | [removed: ] [added: ] | | [removed: 59-0864469] [added: 59-0864469] |
| [removed: (State] [added: (State] or other jurisdiction [removed: of incorporation] [added: of incorporation] or [removed: organization)] [added: organization)] | | | [removed: (I.R.S. Employer Identification Number)] | [added: (I.R.S. Employer Identification Number)] |
| [removed: 220] [added: 220] South Ridgewood [removed: Avenue, Daytona] [added: Avenue, Daytona] Beach, [removed: FL] [added: FL] | | | [removed: 32114] | [added: 32114] |
| [removed: (Address] [added: (Address] of principal executive [removed: offices)] [added: offices)] | | | [removed: (Zip Code)] | [added: (Zip Code)] |
[removed: Registrant’s] [added: Registrant’s] telephone number, including area code: (386) [removed: 252-9601][added: 252-9601]
[removed: Registrant’s] [added: Registrant’s] Website: [removed: www.bbinsurance.com][added: www.bbinsurance.com]
[removed: Securities] [added: Securities] registered pursuant to Section 12(b) of the [removed: Act:][added: Act:]
| [removed: Title] [added: Title] of each [removed: class] [added: class] | [removed: Name] [added: Trading Symbol(s) | Name] of each exchange on which [removed: registered] [added: registered] |
| [removed: COMMON] [added: COMMON] STOCK, $0.10 PAR [removed: VALUE] [added: VALUE] | [removed: NEW YORK STOCK EXCHANGE] [added: BRO] | [added: New york stock exchange |]
[removed: Securities] [added: Securities] registered pursuant to Section 12(g) of the [removed: Act:][added: Act:]
[removed: None][added: None]
Yes [removed: ý] [added: ☒] No [removed: ¨][added: ☐]
Yes [removed: ¨] [added: ☐] No [removed: ý][added: ☒]
| Large accelerated filer | | [removed: ý] [added: ☒] | | Accelerated filer | | [removed: ¨] [added: ☐] |
| Non-accelerated filer | | [removed: ¨] [added: ☐] | | Smaller reporting company | | [removed: ¨] [added: ☐] |
| | | | | Emerging growth company | | [removed: ¨] [added: ☐] |
The aggregate market value of the voting common stock held by non-affiliates of the registrant, computed by reference to the price at which the stock was last sold on June 30, [removed: 2018] [added: 2019] (the last business day of the registrant’s most recently completed second fiscal quarter) was [removed: $6,377,992,646.][added: $7,853,765,460.]
The number of shares of the Registrant’s common stock, $0.10 par value, outstanding as of February [removed: 21, 2019] [added: 20, 2020] was [removed: 279,701,832.][added: 281,552,678.]
[removed: DOCUMENTS] [added: DOCUMENTS] INCORPORATED BY [removed: REFERENCE][added: REFERENCE]
Portions of Brown & Brown, Inc.’s Proxy Statement for the [removed: 2019] [added: 2020] Annual Meeting of Shareholders are incorporated by reference into Part III of this Report.
[removed: ANNUAL] [added: ANNUAL] REPORT ON FORM [removed: 10-K][added: 10-K]
[removed: FOR] [added: FOR] THE FISCAL YEAR [removed: ENDED DECEMBER 31, 2018][added: ENDED DECEMBER 31, 2019]
[removed: INDEX][added: INDEX]
| | | [removed: PAGE NO.] [added: PAGE NO.] |
| [removed: [Part I](#sB240D7F5F6BD59DDAF52EF37C6C3BFD8)] [added: [Part I](#PART_I)] | | [added: 5] |
| Item 1. | [removed: [Business](#sE02DB6019F835E18A34BA963B9F2FAFF)] [added: [Business](#ITEM_1_BUSINESS)] | [removed: [5](#sE02DB6019F835E18A34BA963B9F2FAFF)] [added: 5] |
| Item 1A. | [Risk [removed: Factors](#sC2AEA6BF2EDE5D91B0664092F9E9324D)] [added: Factors](#ITEM_1A_RISK_FACTORS)] | [removed: [12](#sC2AEA6BF2EDE5D91B0664092F9E9324D)] [added: 11] |
| Item 1B. | [Unresolved Staff [removed: Comments](#s6FC1828C50BB5B59931F30D59EBD92CA)] [added: Comments](#ITEM_2_PROPERTIES)] | [removed: [19](#s6FC1828C50BB5B59931F30D59EBD92CA)] [added: 20] |
| Item 2. | [removed: [Properties](#s92D5F8F9160650278FD95BD25EE0BD30)] [added: [Properties](#ITEM_2_PROPERTIES)] | [removed: [20](#s92D5F8F9160650278FD95BD25EE0BD30)] [added: 20] |
or
Yes ☒ No ☐
Yes ☒ No ☐
Yes ☐ No ☒
| --- | --- | --- |
| | | |
| | • | The inability to retain or hire qualified employees, as well as the loss of any of our executive officers or other key employees; |
| --- | --- | --- |
| | • | Acquisition-related risks that could negatively affect the success of our growth strategy, including the possibility that we may not be able successfully identify suitable acquisition candidates, complete acquisitions, integrate acquired businesses into our operations, and expand into new markets continuing; |
| --- | --- | --- |
| | • | A cybersecurity attack or any other interruption in information technology and/or data security and/or outsourcing relationships; |
| --- | --- | --- |
| | • | The requirement for additional resources and time to adequately respond to dynamics resulting from rapid technological change; |
| --- | --- | --- |
| | • | Changes in data privacy and protection laws and regulations or any failure to comply with such laws and regulations; |
| --- | --- | --- |
| | • | The loss of any of our insurance company relationships, which could result in additional expense and loss of market share; |
| --- | --- | --- |
| | • | Adverse economic conditions, natural disasters, or regulatory changes in states where we have a high concentration of our business; |
| --- | --- | --- |
| | • | The inability to maintain our culture or a change in management, management philosophy or our business strategy; |
| --- | --- | --- |
| | • | Risks facing us in our Services Segment, including our third-party claims administration operations, that are distinct from those we face in our insurance intermediary operations; |
| --- | --- | --- |
| | • | Our failure to comply with any covenants contained in our debt agreements; |
| --- | --- | --- |
| | • | The possibility that covenants in our debt agreements could prevent use from engaging in certain potentially beneficial activities; |
| --- | --- | --- |
| | • | Changes in estimates, judgments or assumptions used in the preparation of our financial statements; |
| --- | --- | --- |
| | • | Improper disclosure of confidential information; |
| --- | --- | --- |
| | • | The limitations of our system of disclosure and internal controls and procedures in preventing errors or fraud, or in informing management of all material information in a timely manner; |
| --- | --- | --- |
| | • | The potential adverse effect of certain actual or potential claims, regulatory actions or proceedings on our businesses, results of operations, financial condition or liquidity; |
| --- | --- | --- |
| | • | Changes in the U.S.-based credit markets that might adversely affect our results of operation and financial condition; |
| --- | --- | --- |
| | • | The significant control certain existing shareholders have over the Company; |
| --- | --- | --- |
| | |
| --- | --- |
or
Indicate by check mark if disclosure of delinquent filers pursuant to Item 405 of Regulation S-K (§ 229.405 of this chapter) is not contained herein, and will not be contained, to the best of the registrant’s knowledge, in definitive proxy or information statements incorporated by reference in Part III of this Form 10-K or any amendment to this Form 10-K.
| • | Future prospects; |
| • | Premium rates set by insurance companies and insurable exposure units, which have traditionally varied and are difficult to predict; |
| • | Material adverse changes in economic conditions in the markets we serve and in the general economy; |
| • | Future regulatory actions and conditions in the states in which we conduct our business; |
| • | The occurrence of adverse economic conditions, an adverse regulatory climate, or a disaster in Arizona, California, Florida, Georgia, Illinois, Indiana, Kentucky, Massachusetts, Michigan, Minnesota, New Jersey, New York, North Carolina, Oregon, Pennsylvania, Texas, Virginia, Washington and Wisconsin, because a significant portion of business written by us is for customers located in these states; |
| • | Our ability to attract, retain and enhance qualified personnel and to maintain our corporate culture; |
| • | Competition from others in or entering into the insurance agency, wholesale brokerage, insurance programs and related service business; |
| • | The integration of our operations with those of businesses or assets we have acquired, including our November 2018 acquisition of The Hays Group, Inc. and certain of its affiliates, or may acquire in the future and the failure to realize the expected benefits of such integration; |
| • | Risks that could negatively affect our acquisition strategy, including continuing consolidation among insurance intermediaries and the increasing presence of private equity investors driving up valuations; |
| • | Our ability to forecast liquidity needs through at least the end of 2019; |
| • | Our ability to renew or replace expiring leases; |
| • | Outcomes of existing or future legal proceedings and governmental investigations; |
| • | Policy cancellations and renewal terms, which can be unpredictable; |
| • | Potential changes to the tax rate that would affect the value of deferred tax assets and liabilities and the impact on income available for investment or distribution to shareholders; |
| • | The inherent uncertainty in making estimates, judgments, and assumptions in the preparation of financial statements in accordance with generally accepted accounting principles in the United States of America (“U.S. GAAP”); |
| • | Our ability to effectively utilize technology to provide improved value for our customers or carrier partners as well as applying effective internal controls and efficiencies in operations; and |
An excerpt. Shown here: 40 of 65 rewritten, 40 of 66 added and all 20 removed. The counts are complete. For every sentence, read Cover and table of contents in the FY2019 filing and the FY2018 filing.
Item 2. Properties.
4 rewritten, 0 added, 6 removed, 5 unchanged
We lease offices at each of our [removed: 291] [added: 311] locations.
[removed: These] [added: Our operating] leases [added: expire on various dates and] generally contain renewal options and rent escalation clauses based upon increases in the lessors’ operating expenses and other charges.
See Note [removed: 14] [added: 15] to the Consolidated Financial Statements for additional information on our lease commitments.
We [added: own several contiguous parcels of land totaling over thirteen acres in Daytona Beach, Florida, located approximately a mile from our current executive offices, on which we] have initiated a project to build a new office tower to hold our executive offices and certain other business operations with capacity for up to [removed: 1000] [added: 1,000] employees and room for additional expansion through construction of additional office space at this location.
We own an airplane hangar in Daytona Beach, Florida, which sits upon land leased from Volusia County, Florida.
There are no outstanding mortgages on this owned property.
Our operating leases expire on various dates.
We have acquired several contiguous parcels of land totaling over thirteen acres in Daytona Beach, Florida, located approximately a mile from our current executive offices.
Site preparation work began in 2018 and construction will commence in the first quarter of 2019, with completion anticipated in the fourth quarter of 2020.
Annual expenditures of approximately $30.0 million to $40.0 million in 2019 and 2020, respectively, are anticipated to complete this project.
Item 4. Mine Safety Disclosures.
1 rewritten, 0 added, 0 removed, 1 unchanged
[removed: PART II][added: PART II]
Item 5. Market for Registrant’s Common Equity, Related Stockholder Matters and Issuer Purchases of Equity Securities.
14 rewritten, 10 added, 18 removed, 6 unchanged
On February [removed: 21, 2019,] [added: 20, 2020,] there were [removed: 279,701,832] [added: 281,552,678] shares of our common stock outstanding, held by approximately [removed: 1,311] [added: 1,390] shareholders of record.
[removed: Sales] [added: Sales] of Unregistered [removed: Securities][added: Securities]
We did not sell any unregistered securities during [removed: 2018.][added: 2019.]
[removed: Issuer] [added: Issuer] Purchases of Equity [removed: Securities][added: Securities]
During [removed: 2016,] [added: 2019,] the Company repurchased [removed: 209,618] [added: 1,654,513] shares at an average price per share of [removed: $36.53] [added: $35.46] for a total cost of [removed: $7.7 million under the current share repurchase authorization.][added: $58.7 million.]
At December 31, [removed: 2018,] [added: 2019,] the remaining amount authorized by our Board of Directors for share repurchases was [removed: $147.5] [added: $461.3] million.
Under the authorized repurchase programs, the Company has repurchased a total of approximately [removed: 13.8] [added: 15.5] million shares for an aggregate cost of approximately [removed: $477.5] [added: $536.2] million between 2014 and [removed: 2018.][added: 2019.]
The following table presents information with respect to our purchases of our common stock during the three months ended December 31, [removed: 2018.][added: 2019.]
| [removed: Period] [added: Period] | | [removed: Total] [added: Total] number [removed: of shares purchased(1)] [added: of shares purchased(1)] | | | [removed: Average price paid per share] | [added: Average price paid per share] | | | [removed: Total number of shares purchased as] [added: | Total number of shares purchased as] part [removed: of publicly announced plans or programs] [added: of publicly announced plans or programs] | | | [removed: Approximate dollar] [added: | Approximate dollar] value [removed: of shares] [added: of shares] that [removed: may yet be purchased under the] [added: may yet be purchased under the] plans [removed: or programs] [added: or programs] | | |
| (1) | [removed: With] [added: Of] the [removed: exception of 2,910,150] shares [added: reported in this column, 812,933 shares were] purchased in [removed: an ASR transaction, all] [added: open market transactions. All] other shares reported [removed: above] [added: in this column] are attributable to shares withheld for [removed: employees’ payroll withholding] taxes [removed: pertaining to] [added: in connection with] the vesting of restricted shares awarded under our Performance Stock Plan and 2010 Stock Incentive Plan. |
[removed: Performance Graph][added: Performance Graph]
The returns of each company have been weighted according to such companies’ respective stock market capitalizations as of December 31, [removed: 2013] [added: 2014] for the purposes of arriving at a peer group average.
The total return calculations are based upon an assumed $100 investment on December 31, [removed: 2013,] [added: 2014,] with all dividends reinvested.
[removed: 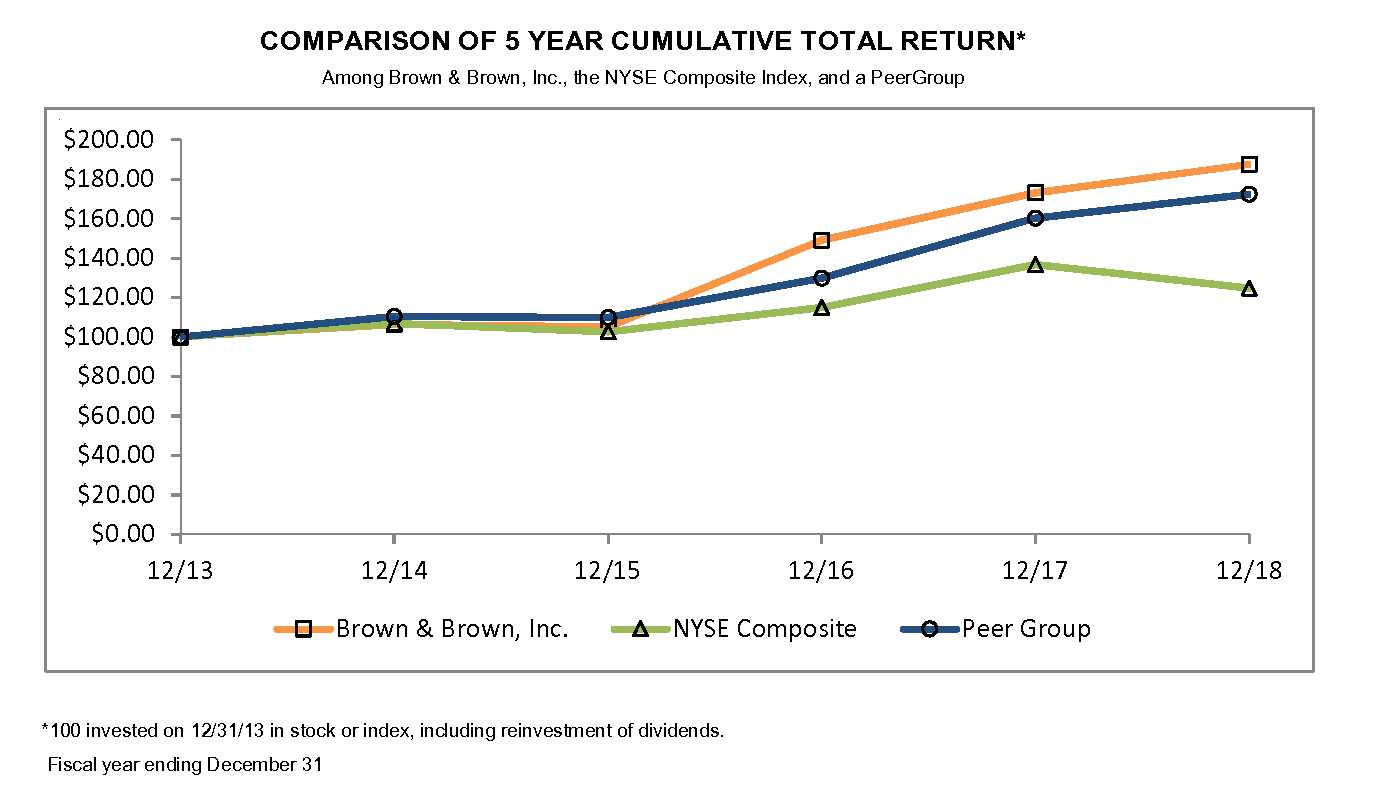][added: ]
| --- | --- | --- | --- | --- | --- | --- | --- | --- | --- | --- | --- | --- | --- | --- | --- | --- |
| October 1, 2019 to October 31, 2019 | | | 814,173 | | | $ | 35.59 | | | | 812,933 | | | $ | 461,282,789 | |
| November 1, 2019 to November 30, 2019 | | | 1,160 | | | | 37.88 | | | | — | | | | 461,282,789 | |
| December 1, 2019 to December 31, 2019 | | | 1,113 | | | | 38.62 | | | | — | | | | 461,282,789 | |
| Total | | | 816,446 | | | $ | 35.59 | | | | 812,933 | | | $ | 461,282,789 | |
| | | 12/14 | | | | 12/15 | | | | 12/16 | | | | 12/17 | | | | 12/18 | | | | 12/19 | | |
| --- | --- | --- | --- | --- | --- | --- | --- | --- | --- | --- | --- | --- | --- | --- | --- | --- | --- | --- | --- | --- | --- | --- | --- | --- |
| Brown & Brown, Inc. | | | 100.00 | | | | 117.76 | | | | 162.40 | | | | 175.68 | | | | 206.91 | | | | 285.13 | |
| NYSE Composite | | | 100.00 | | | | 96.03 | | | | 107.62 | | | | 127.96 | | | | 116.72 | | | | 146.76 | |
| Peer Group | | | 100.00 | | | | 104.96 | | | | 121.53 | | | | 147.49 | | | | 162.17 | | | | 221.50 | |
On July 18, 2014, the Company’s Board of Directors authorized the repurchase of up to $200.0 million of its shares of common stock, and on July 20, 2015, the Company’s Board of Directors authorized the repurchase of up to an additional $400.0 million of the Company’s outstanding common stock.
On December 12, 2018, the Company entered into an accelerated share repurchase agreement (“ASR”) with an investment bank to purchase an aggregate $100.0 million of the Company's common stock.
As part of the ASR, the Company received an initial delivery of 2,910,150 shares of the Company's common stock with a fair market value of approximately $80.0 million.
The $20.0 million hold back will be settled within the five-month maturity as agreed to in the program with a clause for early settlement any time after two months of the effective date.
During 2017, the Company repurchased 2,883,349 shares at an average price per share of $48.52 for a total cost of $140.0 million under the current share repurchase authorization.
| | | | | | | | | | | | | | | |
| --- | --- | --- | --- | --- | --- | --- | --- | --- | --- | --- | --- | --- | --- | --- |
| October 1, 2018 to October 31, 2018 | | — | | | $ | — | | | — | | | $ | 227,453,029 | |
| November 1, 2018 to November 30, 2018 | | 3,332 | | | 28.82 | | | | | | | 227,453,029 | | |
| December 1, 2018 to December 31, 2018 | | 2,914,066 | | | 27.49 | | | | 2,910,150 | | | 147,453,029 | | |
| Total | | 2,917,398 | | | $ | 27.49 | | | 2,910,150 | | | $ | 147,453,029 | |
| | |
| | | | | | | | | | | | | | | | | | |
| --- | --- | --- | --- | --- | --- | --- | --- | --- | --- | --- | --- | --- | --- | --- | --- | --- | --- |
| | 12/13 | | | 12/14 | | | 12/15 | | | 12/16 | | | 12/17 | | | 12/18 | |
| Brown & Brown, Inc. | 100.00 | | | 106.25 | | | 105.10 | | | 149.02 | | | 173.08 | | | 187.43 | |
| NYSE Composite | 100.00 | | | 106.87 | | | 102.62 | | | 115.02 | | | 136.76 | | | 124.72 | |
| Peer Group | 100.00 | | | 110.37 | | | 109.91 | | | 129.81 | | | 160.21 | | | 172.33 | |
Item 6. Selected Financial Data.
37 rewritten, 1 added, 3 removed, 15 unchanged
| [removed: (in] [added: (in] thousands, except per share data, number of employees and [removed: percentages] [added: percentages] | | [removed: Year Ended December 31,] [added: 2019] | | | | [added: 2018] | | | | [added: 2017] | | | | [added: 2016] | | | | [added: 2015] | | |
| [removed: REVENUES] [added: REVENUES] | | | | | | | | | | | | | | | | | | | | |
| Commissions and fees | | $ | [removed: 2,009,857] [added: 2,384,737] | | | $ | [removed: 1,857,270] [added: 2,009,857] | | | $ | [removed: 1,762,787] [added: 1,857,270] | | | $ | [removed: 1,656,951] [added: 1,762,787] | | | $ | [removed: 1,567,460] [added: 1,656,951] | |
| Investment income | | [removed: 2,746] | [added: 5,780] | | | [removed: 1,626] | [added: 2,746] | | | [removed: 1,456] | [added: 1,626] | | | [removed: 1,004] | [added: 1,456] | | | [removed: 747] | [added: 1,004] | |
| Other income, net | | [removed: 1,643] | [added: 1,654] | | | [removed: 22,451] | [added: 1,643] | | | [removed: 2,386] | [added: 22,451] | | | [removed: 2,554] | [added: 2,386] | | | [removed: 7,589] | [added: 2,554] | |
| Total revenues(1) | | [removed: 2,014,246] | [added: 2,392,171] | | | [removed: 1,881,347] | [added: 2,014,246] | | | [removed: 1,766,629] | [added: 1,881,347] | | | [removed: 1,660,509] | [added: 1,766,629] | | | [removed: 1,575,796] | [added: 1,660,509] | |
| [removed: EXPENSES] [added: EXPENSES] | | | | | | | | | | | | | | | | | | | | |
| Employee compensation and benefits | | [removed: 1,068,914] | [added: 1,308,165] | | | [removed: 994,652] | [added: 1,068,914] | | | [removed: 925,217] | [added: 994,652] | | | [removed: 856,952] | [added: 925,217] | | | [removed: 811,112] | [added: 856,952] | |
| Other operating expenses | | [removed: 332,118] | [added: 377,089] | | | [removed: 283,470] | [added: 332,118] | | | [removed: 262,872] | [added: 283,470] | | | [removed: 251,055] | [added: 262,872] | | | [removed: 235,328] | [added: 251,055] | |
| (Gain)/loss on disposal | | [removed: (2,175] | [added: (10,021] | ) | | [removed: (2,157] | [added: (2,175] | ) | | [removed: (1,291] | [added: (2,157] | ) | | [removed: (619] | [added: (1,291] | ) | | [removed: 47,425] | [added: (619] | [added: )] |
| Amortization | | [removed: 86,544] | [added: 105,298] | | | [removed: 85,446] | [added: 86,544] | | | [removed: 86,663] | [added: 85,446] | | | [removed: 87,421] | [added: 86,663] | | | [removed: 82,941] | [added: 87,421] | |
| Depreciation | | [removed: 22,834] | [added: 23,417] | | | [removed: 22,698] | [added: 22,834] | | | [removed: 21,003] | [added: 22,698] | | | [removed: 20,890] | [added: 21,003] | | | [removed: 20,895] | [added: 20,890] | |
| Interest | | [removed: 40,580] | [added: 63,660] | | | [removed: 38,316] | [added: 40,580] | | | [removed: 39,481] | [added: 38,316] | | | [removed: 39,248] | [added: 39,481] | | | [removed: 28,408] | [added: 39,248] | |
| Change in estimated acquisition earn-out payables | | [removed: 2,969] | [added: (1,366] | [added: )] | | [removed: 9,200] | [added: 2,969] | | | [removed: 9,185] | [added: 9,200] | | | [removed: 3,003] | [added: 9,185] | | | [removed: 9,938] | [added: 3,003] | |
| Total expenses | | [removed: 1,551,784] | [added: 1,866,242] | | | [removed: 1,431,625] | [added: 1,551,784] | | | [removed: 1,343,130] | [added: 1,431,625] | | | [removed: 1,257,950] | [added: 1,343,130] | | | [removed: 1,236,047] | [added: 1,257,950] | |
| Income before income taxes | | [removed: 462,462] | [added: 525,929] | | | [removed: 449,722] | [added: 462,462] | | | [removed: 423,499] | [added: 449,722] | | | [removed: 402,559] | [added: 423,499] | | | [removed: 339,749] | [added: 402,559] | |
| Income taxes(2) | | [removed: 118,207] | [added: 127,415] | | | [removed: 50,092] | [added: 118,207] | | | [removed: 166,008] | [added: 50,092] | | | [removed: 159,241] | [added: 166,008] | | | [removed: 132,853] | [added: 159,241] | |
| Net income | | $ | [removed: 344,255] [added: 398,514] | | | $ | [removed: 399,630] [added: 344,255] | | | $ | [removed: 257,491] [added: 399,630] | | | $ | [removed: 243,318] [added: 257,491] | | | $ | [removed: 206,896] [added: 243,318] | |
| [removed: EARNINGS] [added: EARNINGS] PER SHARE [removed: INFORMATION] [added: INFORMATION] | | | | | | | | | | | | | | | | | | | | |
| Net income per share - diluted(3) | | $ | [removed: 1.22] [added: 1.40] | | | $ | [removed: 1.40] [added: 1.22] | | | $ | [removed: 0.91] [added: 1.40] | | | $ | [removed: 0.85] [added: 0.91] | | | $ | [removed: 0.71] [added: 0.85] | |
| Weighted average number of shares outstanding - diluted(3) | | [removed: 275,521] | [added: 274,616] | | | [removed: 277,586] | [added: 275,521] | | | [removed: 275,608] | [added: 277,586] | | | [removed: 280,224] | [added: 275,608] | | | [removed: 285,782] | [added: 280,224] | |
| Dividends declared per share(3) | | $ | [removed: 0.31] [added: 0.33] | | | $ | [removed: 0.28] [added: 0.31] | | | $ | [removed: 0.25] [added: 0.28] | | | $ | [removed: 0.23] [added: 0.25] | | | $ | [removed: 0.21] [added: 0.23] | |
| [removed: YEAR-END] [added: YEAR-END] FINANCIAL [removed: POSITION] [added: POSITION] | | | | | | | | | | | | | | | | | | | | |
| Total assets(4) | | $ | [removed: 6,688,668] [added: 7,622,821] | | | $ | [removed: 5,747,550] [added: 6,688,668] | | | $ | [removed: 5,262,734] [added: 5,747,550] | | | $ | [removed: 4,979,844] [added: 5,262,734] | | | $ | [removed: 4,931,027] [added: 4,979,844] | |
| Long-term debt(5) | | $ | [removed: 1,456,990] [added: 1,500,343] | | | $ | [removed: 856,141] [added: 1,456,990] | | | $ | [removed: 1,018,372] [added: 856,141] | | | $ | [removed: 1,071,618] [added: 1,018,372] | | | $ | [removed: 1,142,948] [added: 1,071,618] | |
| Total shareholders’ equity | | $ | [removed: 3,000,568] [added: 3,350,279] | | | $ | [removed: 2,582,699] [added: 3,000,568] | | | $ | [removed: 2,360,211] [added: 2,582,699] | | | $ | [removed: 2,149,776] [added: 2,360,211] | | | $ | [removed: 2,113,745] [added: 2,149,776] | |
| Total shares outstanding at year end(3) | | [removed: 279,583] | [added: 281,655] | | | [removed: 276,210] | [added: 279,583] | | | [removed: 280,208] | [added: 276,210] | | | [removed: 277,970] | [added: 280,208] | | | [removed: 286,972] | [added: 277,970] | |
| [removed: OTHER INFORMATION] [added: OTHER INFORMATION] | | | | | | | | | | | | | | | | | | | | |
| Number of full-time equivalent employees at [removed: year end] [added: year-end] | | [removed: 9,590] | [added: 10,083] | | | [removed: 8,491] | [added: 9,590] | | | [removed: 8,297] | [added: 8,491] | | | [removed: 7,807] | [added: 8,297] | | | [removed: 7,591] | [added: 7,807] | |
| Total revenues per average number of employees(6) | | $ | [removed: 222,809] [added: 243,193] | | | $ | [removed: 224,130] [added: 222,809] | | | $ | [removed: 219,403] [added: 224,130] | | | $ | [removed: 215,679] [added: 219,403] | | | $ | [removed: 216,114] [added: 215,679] | |
| Stock price at [removed: year end(3)] [added: year-end(3)] | | $ | [removed: 27.56] [added: 39.48] | | | $ | [removed: 25.73] [added: 27.56] | | | $ | [removed: 22.43] [added: 25.73] | | | $ | [removed: 16.05] [added: 22.43] | | | $ | [removed: 16.45] [added: 16.05] | |
| Stock price earnings multiple at year-end(7) | | [removed: 22.6] | [added: 28.2] | | | [removed: 18.3] | [added: 22.6] | | | [removed: 24.6] | [added: 18.3] | | | [removed: 18.9] | [added: 24.6] | | | [removed: 23.3] | [added: 18.9] | |
| Return on beginning shareholders’ equity(8) | | [removed: 13] | [added: 13] | % | | [removed: 17] | [added: 13] | % | | [removed: 12] | [added: 17] | % | | [removed: 12] | [added: 12] | % | | [removed: 10] | [added: 12] | % |
| (1) | Years 2017 to [removed: 2014] [added: 2015] do not reflect the adoption of “Revenue from Contracts with Customers (Topic 606)” (“Topic 606”), ASC Topic 340 - Other Assets and Deferred Cost (“ASC 340”) and ASU 2016-08, “Principal Versus Agent Considerations (Reporting Revenue Gross Versus [removed: Net)”.] [added: Net)”, which was adopted under the modified retrospective method.] |
| (2) | Years 2017 to [removed: 2014] [added: 2015] do not reflect the adoption of ASU 2016-09, “Improvements to Employee Share Based Payment Accounting” (“ASU [removed: 2016-09”).] [added: 2016-09”), which was adopted using the prospective method.] |
| (3) | Years 2017 to [removed: 2014] [added: 2015] reflect the 2-for-1 stock split that occurred on March 28, 2018. |
| (4) | [removed: Years 2016 to 2014] [added: All years presented] reflect the adoption of ASU No. 2015-17, “Income Taxes (Topic 740) - Balance Sheet Classification of Deferred Taxes” (“ASU 2015-17”). |
| | | Year Ended December 31, | | | | | | | | | | | | | | | | | | |
| | | | | | | | | | | | | | | | | | | | | |
| | 2018 | | | | 2017 | | | | 2016 | | | | 2015 | | | | 2014 | | | |
| | |
Item 8. Financial Statements and Supplementary Data.
697 rewritten, 404 added, 179 removed, 350 unchanged
[removed: Index] [added: Index] to Consolidated Financial [removed: Statements][added: Statements]
| | [removed: Page No.] [added: Page No.] |
| [removed: Consolidated] [added: [Consolidated] Statements of Income for the years ended December 31, [removed: 2018, 2017] [added: 2019, 2018] and [removed: 2016] [added: 2017](#CONSOLIDATED_STATEMENTS_INCOME)] | [removed: [48](#sA6C95CDE0BEF5D57A0CD3400F626B1DA)] [added: 45] |
| [removed: Consolidated] [added: [Consolidated] Balance Sheets as of December 31, [removed: 2018] [added: 2019] and [removed: 2017] [added: 2018](#CONSOLIDATED_BALANCE_SHEETS)] | [removed: [49](#s76691CC2949F54BA82CFF87EDB00CC9D)] [added: 46] |
| [removed: Consolidated] [added: [Consolidated] Statements of Shareholders’ Equity for the years ended December 31, [removed: 2018, 2017] [added: 2019, 2018] and [removed: 2016] [added: 2017](#CONSOLIDATED_STATEMENTS_SHAREHOLDERS_EQU)] | [removed: [50](#sF5CB1A7BDC8553078BFE877314E08ABD)] [added: 47] |
| [removed: Consolidated] [added: [Consolidated] Statements of Cash Flows for the years ended December 31, [removed: 2018, 2017] [added: 2019, 2018] and [removed: 2016] [added: 2017](#CONSOLIDATED_STATEMENTS_CASH_FLOWS)] | [removed: [51](#sD269D98AC6465CA2BC24C3EB6CE9B31C)] [added: 48] |
| [removed: Notes] [added: [Notes] to Consolidated Financial Statements for the years ended December 31, [removed: 2018, 2017] [added: 2019, 2018] and [removed: 2016] [added: 2017](#NOTES_TO_CONSOLIDATED_FINANCIAL_STATEMEN)] | [removed: [52](#s5CE5ECC7ED40577881780D1C57C1F278)] [added: 49] |
| [removed: Note] [added: [Note] 1: Summary of Significant Accounting [removed: Policies] [added: Policies](#NOTE_1_SUMMARY_SIGNIFICANT_ACCOUNTING_PO)] | [removed: [52](#s53C21CD5CD0555E4B4B1A96585193A22)] [added: 49] |
| [removed: Note] [added: [Note] 2: [removed: Revenues] [added: Revenues](#NOTE_2_REVENUES)] | [removed: [59](#se543d732d5854900bd977a8c1e699550)] [added: 57] |
| [removed: Note] [added: [Note] 3: Business [removed: Combinations] [added: Combinations](#NOTE_3_BUSINESS_COMBINATIONS)] | [removed: [60](#sEB08F91D57BB5481B67EC001EF61EA1C)] [added: 58] |
| [removed: Note] [added: [Note] 4: [removed: Goodwill] [added: Goodwill](#NOTE_4_GOODWILL)] | [removed: [67](#sF21ECFB2787553ADABC700D42231B331)] [added: 65] |
| [removed: Note] [added: [Note] 5: Amortizable Intangible [removed: Assets] [added: Assets](#NOTE_5_AMORTIZABLE_INTANGIBLE_ASSETS)] | [removed: [67](#sA6E5FEEDD5E35B42965D403099FFF1CC)] [added: 65] |
| [removed: Note] [added: [Note] 6: [removed: Investments] [added: Investments](#NOTE_6_INVESTMENTS)] | [removed: [67](#s88CF9284A07059F2923F48E4093A096A)] [added: 65] |
| [removed: Note] [added: [Note] 7: Fixed [removed: Assets] [added: Assets](#NOTE_7_FIXED_ASSETS)] | [removed: [69](#sD30C2D6097C258E782F7340743334A7F)] [added: 67] |
[removed: | Note 8:] [added: NOTE 8] Accrued Expenses and Other [added: Current] Liabilities [removed: | [70](#sA8744271EC0D58F9A490E9C6728F6A9C) |]
[removed: | Note 9:] [added: NOTE 9] Long-Term Debt [removed: | [70](#sB670012339F35D3EAAD76C7D8A1AF551) |]
| [removed: Note] [added: [Note] 10: Income [removed: Taxes] [added: Taxes](#NOTE_10_INCOME_TAXES)] | [removed: [72](#s044224F24DEB5AF8B8775A51553C908F)] [added: 69] |
| [removed: Note] [added: [Note] 11: Employee Savings [removed: Plan] [added: Plan](#NOTE_11_EMPLOYEE_SAVINGS_PLAN)] | [removed: [74](#s4E56FF33CFF85A16B666445DD8E2C4BE)] [added: 71] |
[removed: | Note 12:] [added: NOTE 12] Stock-Based Compensation [removed: | [74](#s762E3729B22D5CA7BBE4C30E47181873) |]
| [removed: Note] [added: [Note] 13: Supplemental Disclosures of Cash Flow [removed: Information] [added: Information](#NOTE_13_SUPPLEMENTAL_DISCLOSURES_CASH_F)] | [removed: [77](#sFC8AF1306D745D6AAB126776E2F20068)] [added: 74] |
| [removed: Note] [added: [Note] 14: Commitments and [removed: Contingencies] [added: Contingencies](#NOTE_14_COMMITMENTS_CONTINGENCIES)] | [removed: [78](#s156B335720805E0C97AA9BE56C4C23F2)] [added: 75] |
| [removed: Note 15:] [added: [Note 16:] Quarterly Operating Results [removed: (Unaudited)] [added: (Unaudited)](#NOTE_16_QUARTERLY_OPERATING_RESULTS)] | [removed: [79](#s729C1D550A4153D3AE9A1E85F4B84133)] [added: 77] |
| [removed: Note 16:] [added: [Note 17:] Segment [removed: Information] [added: Information](#NOTE_16_SEGMENT_INFORMATION)] | [removed: [79](#s63E2226363DF5A129587AE7F3BCF6B0E)] [added: 77] |
| [removed: Note 20:] [added: [Note 19:] Shareholders’ [removed: Equity] [added: Equity](#NOTE_20_SHAREHOLDERS_EQUITY)] | [removed: [81](#sE708D6C9BF865E04913EDAB02BFC142B)] [added: 79] |
| [removed: Report] [added: [Report] of Independent Registered Public Accounting [removed: Firm] [added: Firm](#REPORT_OF_INDEPENDENT_REGISTERED)] | [removed: [83](#s56AE0A608FFC5356BFE6E40B504E19DE)] [added: 80] |
[removed: BROWN] [added: BROWN] & BROWN, [removed: INC.][added: INC.]
[removed: CONSOLIDATED] [added: CONSOLIDATED] STATEMENTS OF [removed: INCOME][added: INCOME]
| [removed: (in] [added: (in] thousands, except per share [removed: data) | For the year ended December 31, | |] [added: data)] | | [added: December 31, 2019] | | | | [added: December 31, 2018] | | |
| | [removed: 2018] | [added: 2019] | | | [removed: 2017] | [added: 2018] | | | [removed: 2016] | [added: 2016] | | [added: |]
| [removed: REVENUES] [added: REVENUES] | | | | | | | | | | | | [added: |]
| Commissions and fees | [added: |] $ | [removed: 2,009,857] [added: 2,384,737] | | | $ | [removed: 1,857,270] [added: 2,009,857] | | | $ | [removed: 1,762,787] [added: 1,857,270] | |
| Investment income | [removed: 2,746] | | [added: 5,780] | | [removed: 1,626] | | [added: 2,746] | | [removed: 1,456] | | [added: 1,626] | [added: |]
| Other income, net | [removed: 1,643] | | [added: 1,654] | | [removed: 22,451] | | [added: 1,643] | | [removed: 2,386] | | [added: 22,451] | [added: |]
| Total revenues | [removed: 2,014,246] | | [added: 2,392,171] | | [removed: 1,881,347] | | [added: 2,014,246] | | [removed: 1,766,629] | | [added: 1,881,347] | [added: |]
| [removed: EXPENSES] [added: EXPENSES] | | | | | | | | | | | | [added: |]
| Employee compensation and benefits | [removed: 1,068,914] | | [added: 1,308,165] | | [removed: 994,652] | | [added: 1,068,914] | | [removed: 925,217] | | [added: 994,652] | [added: |]
| Other operating expenses | [removed: 332,118] | | [added: 377,089] | | [removed: 283,470] | | [added: 332,118] | | [removed: 262,872] | | [added: 283,470] | [added: |]
| (Gain)/loss on disposal | [removed: (2,175] | | [added: (10,021 |] ) | | [removed: (2,157] | [added: (2,175] | ) | | [removed: (1,291] | [added: (2,157] | ) |
| Amortization | [removed: 86,544] | | [added: 105,298] | | [removed: 85,446] | | [added: 86,544] | | [removed: 86,663] | | [added: 85,446] | [added: |]
| Depreciation | [removed: 22,834] | | [added: 23,417] | | [removed: 22,698] | | [added: 22,834] | | [removed: 21,003] | | [added: 22,698] | [added: |]
| [Note 15: Leases](#NOTE_15_LEASES) | 75 |
| | | For the Year Ended December 31, | | | | | | | | | | |
BROWN & BROWN, INC.
| --- | --- | --- | --- | --- | --- | --- | --- | --- |
| Operating lease assets | | | 184,288 | | | | — | |
| Operating lease liabilities | | | 167,855 | | | | — | |
BROWN & BROWN, INC.
| --- | --- | --- | --- | --- | --- | --- | --- | --- | --- | --- | --- | --- | --- | --- | --- | --- | --- | --- | --- | --- | --- | --- | --- | --- |
| Net Income | | | | | | | | | | | | | | | | | | | 398,514 | | | | 398,514 | |
| Net unrealized holding (loss) gain on available-for-sale securities | | | | | | | | | | | 182 | | | | | | | | (30 | ) | | | 152 | |
| Common stock issued for agency acquisitions | | | 569 | | | | 57 | | | | 19,943 | | | | | | | | | | | | 20,000 | |
| Balance at December 31, 2019 | | | 297,106 | | | $ | 29,711 | | | $ | 716,049 | | | $ | (536,243 | ) | | $ | 3,140,762 | | | $ | 3,350,279 | |
BROWN & BROWN, INC.
| Net income | | $ | 398,514 | | | $ | 344,255 | | | $ | 399,630 | |
| Amortization | | | 105,298 | | | | 86,544 | | | | 85,446 | |
| Depreciation | | | 23,417 | | | | 22,834 | | | | 22,698 | |
| Change in estimated acquisition earn-out payables | | | (1,366 | ) | | | 2,969 | | | | 9,200 | |
Brown & Brown’s business is divided into four reportable segments.
The Retail Segment provides a broad range of insurance products and services to commercial, public and quasi-public, professional and individual insured customers, and non-insurance risk-mitigating products through our automobile dealer services (“F&I”) businesses.
The Wholesale Brokerage Segment markets and sells excess and surplus commercial and personal lines insurance, primarily through independent agents and brokers, as well as Brown & Brown retail agents.
The Services Segment provides insurance-related services, including third-party claims administration and comprehensive medical utilization management services in both the workers’ compensation and all-lines liability arenas, as well as Medicare Set-aside services, Social Security disability and Medicare benefits advocacy services and claims adjusting services.
The impact of ASU 2018-15 is not expected to be material to the Company.
In January 2017, the FASB issued ASU No. 2017-04, “Intangibles-Goodwill and Other (Topic 350): Simplifying the Test for Goodwill Impairment.” The new guidance eliminates Step 2 of the goodwill impairment test.
The updated guidance requires an entity to perform its annual or interim goodwill impairment test by comparing the fair value of the reporting unit to its carrying value, and recognizing a non-cash impairment charge for the amount by which the carrying value exceeds the reporting unit’s fair value with the loss not exceeding the total amount of goodwill allocated to that reporting unit.
Under Topic 842, all leases are required to be recorded on the balance sheet and are classified as either operating leases or finance leases.
Effective as of January 1, 2019, the Company adopted Topic 842, and all related amendments, which established Accounting Standards Codification (“ASC”) Topic 842.
The Company adopted these standards by the recognition of right-of-use assets and related lease liabilities on the balance sheet.
As permitted by Topic 842, the Company elected the transition practical expedient to adopt as of January 1, 2019, the date of initial application under the modified retrospective approach for leases existing at that date, with an adjustment to retained earnings.
As a result, the Consolidated Balance Sheets at December 31, 2018 was not restated and continues to be reported under ASC Topic 840 (“Topic 840”) which did not require the recognition of operating lease liabilities on the balance sheet, and thus is not comparative.
For the year ended December 31, 2019, all of the Company’s leases are classified as operating leases, which are primarily real estate leases for office space.
The expense recognition for operating leases under Topic 842 is substantially consistent with Topic 840, where operating lease charges are recorded entirely in operating expenses.
As a result, there is no significant difference in the Company’s results of operations presented in the Company’s Condensed Consolidated Statements of Income for each period presented.
The adoption of Topic 842 had a significant impact on the Company’s balance sheet with the recognition of the operating lease right-of-use asset and the liability for operating leases.
Upon adoption, leases that were classified as operating leases under Topic 840 were classified as operating leases under Topic 842.
For the adoption of Topic 842, the Company recorded an adjustment of $202.9 million to operating lease right-of-use asset and the related lease liability, with no impact to retained earnings.
The deferred rent previously accrued under Topic 840 was reclassified to the right-of-use asset upon the adoption of Topic 842.
The lease liability is the present value of the remaining minimum lease payments, determined under Topic 840, discounted using the Company’s incremental borrowing rate at the effective date of January 1, 2019.
As permitted under Topic 842, the Company elected to use the practical expedient that permits the Company to not reassess whether a contract is or contains a lease, the classification of the Company’s existing operating leases, and initial direct costs for any existing leases.
The Company did not elect the practical expedient to use hindsight in determining the lease term (when considering lessee options to extend or terminate the lease and to purchase the underlying asset) and in assessing impairment of the Company’s right-of-use assets.
The application of the practical expedient did not have a significant impact on the measurement of the operating lease liability.
| | |
| --- | --- |
| Note 17: Reinsurance | [81](#sC29FCB532E3F55A6AEB4312C8942D37B) |
| Note 18: Statutory Financial Information | [81](#s49E3C999C3D85BABA9B7BB7937699DF6) |
| Note 19: Subsidiary Dividend Restrictions | [81](#sDF0A7B8A90895E8CB4D12995CE2F53A9) |
| | | | | | | | | | | | |
| --- | --- | --- | --- | --- | --- | --- | --- | --- | --- | --- | --- |
| | | | | | | | |
| --- | --- | --- | --- | --- | --- | --- | --- |
| | | | | | | | | | | | | | | | | | | | | | |
| --- | --- | --- | --- | --- | --- | --- | --- | --- | --- | --- | --- | --- | --- | --- | --- | --- | --- | --- | --- | --- | --- |
| Balance at January 1, 2016 | 282,077 | | $ | 28,209 | | | $ | 412,931 | | | $ | (238,775 | ) | | $ | 1,947,411 | | | $ | 2,149,776 | |
| Net income | | | | | | | | | | | | | | | 257,491 | | | | 257,491 | | |
| Income tax benefit from exercise of stock benefit plans | | | | | | | 7,346 | | | | | | | | | | | | 7,346 | | |
| Income tax benefit from exercise of shares from the stock benefit plans | — | | | | — | | | | (7,346 | | ) |
| Income tax benefit from exercise of shares from the stock benefit plans | — | | | | — | | | | 7,346 | | |
Under ASU 2016-02, the Company will be required to recognize the assets and liabilities for the rights and obligations created by leased assets with initial maturities greater than one year.
In July 2018, the FASB also issued ASU 2018-10 and ASU 2018-11 related to Topic 842.
ASU 2018-10 narrows certain aspects of the guidance issued in the amendments within ASU 2016-02.
ASU 2018-11 provides entities with an additional transition method to adopt ASU 2016-02.
Under this new transition method, at the adoption date, a company shall recognize a cumulative-effect adjustment to the opening balance of retained earnings.
The Company continues to evaluate the impact of this pronouncement with the principal impact expected to be the present value of the remaining lease payments and will be presented as a liability on the balance sheet as well as an asset of similar value representing the “Right of Use” for those leased properties.
The Company plans to adopt Topic 842 under the transition method provided by ASU 2018-11.
The undiscounted contractual cash payments remaining on leased properties were $213.2 million as of December 31, 2016, $210.4 million as of December 31, 2017 and $210.0 million as of December 31, 2018 as detailed in Note 14 “Commitments and Contingencies.”
In November 2016, the Financial Accountings Standards Board (“FASB”) issued Accounting Standards Update (“ASU”) 2016-18, “Statement of Cash Flows (Topic 230)”: Restricted Cash (“ASU 2016-18”), which requires that the Statement of Cash Flows explain the changes during the period of cash and cash equivalents inclusive of amounts categorized as restricted cash.
ASU 2016-18 is effective for periods beginning after December 15, 2017.
However, the Company elected to early adopt for the reporting period beginning January 1, 2017 under the full retrospective approach for all periods presented.
With the adoption of ASU 2016-18, the change in restricted cash is no longer reflected as a change in operating assets and liabilities, and the Statement of Cash Flows details the changes in the balance of cash and cash equivalents inclusive of restricted cash.
Net cash provided by operating activities for the year ended December 31, 2016 were previously reported as $375.2 million.
With the retrospective adoption, the net cash provided by operating activities for the year ended December 31, 2016 is now reported as $411.0 million.
The Company reflects cash collected from customers that is payable to insurance companies as restricted cash if segregation of this cash is required by the state of domicile for the office conducting this transaction or if required by contract with the relevant insurance company providing coverage.
Cash collected from customers that is payable to insurance companies is reported in cash and cash equivalents if no such restriction is required.
on the Company’s Statement of Cash Flows.
In March 2016, the FASB issued ASU 2016-09, “Improvements to Employee Share Based Payment Accounting” (“ASU 2016-09”), which amends guidance issued in Accounting Standards Codification (“ASC”) Topic 718, Compensation - Stock Compensation.
ASU 2016-09 simplifies several aspects of the accounting for share-based payment transactions, including the income tax consequences, classification of awards as either equity or liabilities, and classification on the statement of cash flows.
ASU 2016-09 is effective for fiscal years beginning after December 15, 2016, and interim periods within those fiscal years and early adoption is permitted.
The Company adopted the guidance on January 1, 2017, as required.
Prior periods have not been adjusted, as the guidance was adopted prospectively.
The principal impact is that the tax benefit or expense from stock compensation is now presented in the income tax line of the Statement of Income, whereas the prior treatment was to present this amount as a component of equity on the Balance Sheet.
In addition, the tax benefit or expense is now presented as activity in Cash Flow from Operating Activity, rather than the prior presentation as Cash Flow from Financing Activity in the Statement of Cash Flows.
An excerpt. Shown here: 40 of 697 rewritten, 40 of 404 added and 40 of 179 removed. The counts are complete. For every sentence, read Item 8. Financial Statements and Supplementary Data. in the FY2019 filing and the FY2018 filing.
Item 9. Changes in and Disagreements with Accountants and Financial Disclosure.
1 rewritten, 0 added, 0 removed, 0 unchanged
There were no changes in or disagreements with accountants on accounting and financial disclosure in [removed: 2018.][added: 2019.]
Item 9A. Controls and Procedures.
6 rewritten, 0 added, 41 removed, 12 unchanged
[removed: Evaluation] [added: Evaluation] of Disclosure Controls and [removed: Procedures][added: Procedures]
We carried out an evaluation (the “Evaluation”) required by Rules 13a-15 and 15d-15 under the Securities Exchange Act of 1934, as amended (the “Exchange Act”), under the supervision and with the participation of our Chief Executive Officer (“CEO”) and Chief Financial Officer (“CFO”), of the effectiveness of our disclosure controls and procedures as defined in Rule 13a-15 and 15d-15 under the Exchange Act (“Disclosure Controls”) as of December 31, [removed: 2018.][added: 2019.]
[removed: Changes] [added: Changes] in Internal [removed: Controls][added: Controls]
There has not been any change in our internal control over financial reporting identified in connection with the Evaluation that occurred during the quarter ended December 31, [removed: 2018,] [added: 2019,] that has materially affected, or is reasonably likely to materially affect, our internal control over financial reporting.
[removed: Inherent] [added: Inherent] Limitations of Internal Control Over Financial [removed: Reporting][added: Reporting]
[removed: CEO] [added: CEO] and CFO [removed: Certifications][added: Certifications]
REPORT OF INDEPENDENT REGISTERED PUBLIC ACCOUNTING FIRM
To the Shareholders and the Board of Directors of Brown & Brown, Inc.
Opinion on Internal Control over Financial Reporting
We have audited the internal control over financial reporting of Brown & Brown, Inc. and subsidiaries (the “Company”) as of December 31, 2018, based on criteria established in *Internal Control - Integrated Framework (2013)* issued by the Committee of Sponsoring Organizations of the Treadway Commission (COSO).
In our opinion, the Company maintained, in all material respects, effective internal control over financial reporting as of December 31, 2018, based on criteria established in *Internal Control - Integrated Framework (2013)* issued by COSO.
We have also audited, in accordance with the standards of the Public Company Accounting Oversight Board (United States) (PCAOB), the consolidated financial statements as of and for the year ended December 31, 2018, of the Company and our report dated February 25, 2019, expressed an unqualified opinion on those financial statements and included an explanatory paragraph regarding the Company’s adoption of Financial Accounting Standards Board Accounting Standards Codification 606, *Revenue from Contracts with Customers,* and related amendments.
As described in *Management’s Annual Report on Internal Control Over Financial Reporting*, management excluded from its assessment the internal control over financial reporting at the Automotive Development Group, LLC, Servco Pacific Inc., Health Special Risk, Inc., Professional Disability Associates, LLC, Finance & Insurance Resources Inc., Rodman Insurance Agency, Inc., The Hays Group, Inc. et al, and Dealer Associates, Inc. which were acquired in 2018 and whose financial statements constitute approximately 0.01 percent and 17.55 percent of net and total assets, respectively, 3.18 percent of revenues, and 0.36 percent of net income of the consolidated financial statement amounts as of and for the year ended December 31, 2018.
Accordingly, our audit did not include the internal control over financial reporting of these acquired entities.
Basis for Opinion
The Company’s management is responsible for maintaining effective internal control over financial reporting and for its assessment of the effectiveness of internal control over financial reporting, included in the accompanying Management’s Report on Internal Control Over Financial Reporting.
Our responsibility is to express an opinion on the Company’s internal control over financial reporting based on our audit.
We are a public accounting firm registered with the PCAOB and are required to be independent with respect to the Company in accordance with the U.S. federal securities laws and the applicable rules and regulations of the Securities and Exchange Commission and the PCAOB.
We conducted our audit in accordance with the standards of the PCAOB.
Those standards require that we plan and perform the audit to obtain reasonable assurance about whether effective internal control over financial reporting was maintained in all material respects.
Our audit included obtaining an understanding of internal control over financial reporting, assessing the risk that a material weakness exists, testing and evaluating the design and operating effectiveness of internal control based on the assessed risk, and performing such other procedures as we considered necessary in the circumstances.
We believe that our audit provides a reasonable basis for our opinion.
Definition and Limitations of Internal Control over Financial Reporting
A company’s internal control over financial reporting is a process designed to provide reasonable assurance regarding the reliability of financial reporting and the preparation of financial statements for external purposes in accordance with generally accepted accounting principles.
A company’s internal control over financial reporting includes those policies and procedures that (1) pertain to the maintenance of records that, in reasonable detail, accurately and fairly reflect the transactions and dispositions of the assets of the company; (2) provide reasonable assurance that transactions are recorded as necessary to permit preparation of financial statements in accordance with generally accepted accounting principles, and that receipts and expenditures of the company are being made only in accordance with authorizations of management and directors of the company; and (3) provide reasonable assurance regarding prevention or timely detection of unauthorized acquisition, use, or disposition of the company’s assets that could have a material effect on the financial statements.
Because of its inherent limitations, internal control over financial reporting may not prevent or detect misstatements.
Also, projections of any evaluation of effectiveness to future periods are subject to the risk that controls may become inadequate because of changes in conditions, or that the degree of compliance with the policies or procedures may deteriorate.
| |
| --- |
| /s/ DELOITTE & TOUCHE LLP |
| Certified Public Accountants |
| Tampa, Florida |
| February 25, 2019 |
Management’s Report on Internal Control Over Financial Reporting
The management of Brown & Brown, Inc. and its subsidiaries (“Brown & Brown”) is responsible for establishing and maintaining adequate internal control over financial reporting, as such term is defined in Securities Exchange Act Rule 13a-15(f).
Under the supervision and with the participation of management, including Brown & Brown’s principal executive officer and principal financial officer, Brown & Brown conducted an evaluation of the effectiveness of internal control over financial reporting based upon the framework in *Internal Control-Integrated Framework (2013)* issued by the Committee of Sponsoring Organizations of the Treadway Commission (“COSO”).
In conducting Brown & Brown’s evaluation of the effectiveness of its internal control over financial reporting, Brown & Brown has excluded the following acquisitions completed by Brown & Brown during 2018: the Automotive Development Group, LLC, Servco Pacific Inc., Health Special Risk, Inc., Professional Disability Associates, LLC, Finance & Insurance Resources Inc., Rodman Insurance Agency, Inc., The Hays Group, Inc. et al, and Dealer Associates, Inc. (collectively the “2018 Excluded Acquisitions”), which were acquired during 2018 and whose financial statements constitute approximately 0.01% and 17.55% of net and total assets, respectively, 3.18% of revenues, and 0.36% of net income of the consolidated financial statement amounts as of and for the year ended December 31, 2018.
Refer to Note 3 to the Consolidated Financial Statements for further discussion of these acquisitions and their impact on Brown & Brown’s Consolidated Financial Statements.
Based upon Brown & Brown’s evaluation under the framework in *Internal Control-Integrated Framework (2013)* issued by the Committee of Sponsoring Organizations of the Treadway Commission*,* management concluded that internal control over financial reporting was effective as of December 31, 2018.
Management’s internal control over financial reporting as of December 31, 2018 has been audited by Deloitte & Touche LLP, an independent registered public accounting firm, as stated in their report which is included herein.
Brown & Brown, Inc.
Daytona Beach, Florida
February 25, 2019
| | | |
| --- | --- | --- |
| /s/ J. Powell Brown | | /s/ R. Andrew Watts |
An excerpt. Shown here: all 6 rewritten, all 0 added and 40 of 41 removed. The counts are complete. For every sentence, read Item 9A. Controls and Procedures. in the FY2019 filing and the FY2018 filing.
Item 9B. Other Information.
1 rewritten, 0 added, 0 removed, 1 unchanged
[removed: PART III][added: PART III]
Item 10. Directors, Executive Officers and Corporate Governance.
28 rewritten, 27 added, 11 removed, 34 unchanged
Set forth below is certain information concerning our executive officers as of February [removed: 25, 2019.][added: 24, 2020.]
| J. Hyatt Brown | Chairman | [removed: 81] [added: 82] |
| J. Powell Brown | President and Chief Executive Officer | [removed: 51] [added: 52] |
| Robert W. Lloyd | Executive Vice President; Secretary and General Counsel | [removed: 54] [added: 55] |
| J. Scott Penny | Executive Vice President; Chief Acquisitions Officer | [removed: 52] [added: 53] |
| Julie K. Ryan | Executive Vice President; Chief People Officer | [removed: 47] [added: 48] |
| Anthony T. Strianese | Executive Vice President; President - Wholesale Brokerage [removed: Division] [added: Segment] | [removed: 57] [added: 58] |
| Chris L. Walker | Executive Vice President; President - National Programs [removed: Division] [added: Segment] | [removed: 61] [added: 62] |
| R. Andrew Watts | Executive Vice President; Chief Financial Officer and Treasurer | [removed: 50] [added: 51] |
[removed: Hyatt Brown.] Mr. Brown was our Chief Executive Officer from 1993 to 2009 and our President from 1993 to December 2002, and served as President and Chief Executive Officer of our predecessor corporation from 1961 to 1993.
Mr. Brown [removed: serves] [added: served] on the Board of Directors of International Speedway Corporation, a publicly held [removed: company.][added: company, until 2019.]
Mr. Hyatt Brown’s [removed: son,] [added: sons,] J.
Powell Brown, [removed: is employed by us as President and Chief Executive Officer, and] has served as a director since October 2007.
[removed: Powell Brown.] Mr. Brown was named Chief Executive Officer in July 2009.
Mr. Brown was previously responsible for overseeing certain or all parts of all of our [removed: divisions] [added: segments] over the years, and worked in various capacities throughout the Company since joining us in 1995.
[removed: Robert] [added: Robert] W.
[removed: Lloyd.] Mr. Lloyd has served as our General Counsel since 2009 and as Executive Vice President and Corporate Secretary since 2014.
Mr. Lloyd is a Rotarian; [removed: a director, legal counsel, and chairman-elect] [added: Chairman] of the [removed: Greater] Daytona Beach [removed: Area] [added: Regional] Chamber of Commerce; a director of the Council on Aging of Volusia County; [removed: a member of the executive committee of the Halifax Area Civic League;] and a member of the Advisory Board of the Central Florida Council - Boy Scouts of America.
[removed: Scott Penny.] Mr. Penny has been our Chief Acquisitions Officer since 2011, and he serves as director and as an executive officer for several of our subsidiaries.
[removed: Anthony] [added: Anthony] T.
[removed: Strianese.] Mr. Strianese has served as President of our Wholesale Brokerage [removed: Division] [added: Segment] since 2014.
Mr. Strianese’s responsibilities for our Wholesale Brokerage [removed: Division] [added: Segment] include oversight of the operations of Peachtree Special Risk Brokers, LLC, Hull & Company, Inc., ECC Insurance Brokers, Inc., MacDuff Underwriters, Inc. and Decus Insurance Brokers Limited, which commenced operations in 2008 in London, England.
Additionally, Mr. Strianese is responsible for certain of our public [removed: entity operations located in Georgia, Texas and Virginia.]
[removed: Chris] [added: Chris] L.
[removed: Walker.] Mr. Walker was appointed President of our National Programs [removed: Division] [added: Segment] in 2014.
Mr. Walker is responsible for our National Programs [removed: Division.][added: Segment.]
[removed: Andrew Watts.] Mr. Watts joined the Company as Executive Vice President and Treasurer in February 2014, and was appointed Chief Financial Officer effective March 4, 2014.
The additional information required by this item regarding directors and executive officers is incorporated herein by reference to our definitive Proxy Statement to be filed with the SEC in connection with the Annual Meeting of Shareholders to be held in [removed: 2019] [added: 2020] (the [removed: “2019] [added: “2020] Proxy Statement”) under the headings “Board and Corporate Governance Matters” and “Other Important Information.” We have adopted a code of ethics that applies to our principal executive officer, principal financial officer, and controller.
| P. Barrett Brown | Executive Vice President; President – Retail Segment | 47 |
J.
Powell Brown and P.
Barrett Brown, are employed by us as President and Chief Executive Officer, and as Executive Vice President and President – Retail Segment, respectively.
His son, J.
J.
Powell Brown.
Hyatt Brown, and brother of our Executive Vice President and President – Retail Segment, P.
Barrett Brown.
P.
Barrett Brown.
Mr. Brown was appointed as the President of our Retail Segment in January 2020.
He previously served as a Senior Vice President from 2014 until January 2020 and as a Regional President in the Retail Segment from September 2015 until January 2020.
Mr. Brown joined the Company in 2000 and has served in various roles, including as the profit center leader and an account executive in our Tampa, Florida retail office, as the profit center leader and an account executive in our Orange, California retail office, and as an account executive in our Phoenix, Arizona retail office.
He has also overseen certain aspects of “Brown & Brown University,” a training program offering technical and sales courses for new producers, office leaders, and other groups within the organization.
He is the son of our Chairman, J.
Hyatt Brown, and brother of our President and Chief Executive Officer, J.
Powell Brown.
Lloyd.
In 2019, Mr. Lloyd was appointed by Florida Governor Ron Desantis to the Board of Trustees of Daytona State College.
J.
Scott Penny.
Strianese.
entity operations located in Georgia, Texas and Virginia.
Walker.
R.
Andrew Watts.
| | | |
J.
He also served on the economic advisory committee to the transition team for Florida Governor-Elect Ron Desantis.
Since 2017, Mr. Lloyd has served as an independent director of Raydon Corporation, a private company based in Port Orange, Florida.
Julie K.
Ryan. Ms. Ryan was appointed Chief People Officer and Executive Vice President in January 2017 and May 2017, respectively.
From September 2015 until January 2017, she served as Director, Human Resources and Learning & Development of Pacific Resources Benefits Advisors, LLC, a subsidiary of the Company.
From 2012 until 2015, Ms. Ryan was employed by BorgWarner Inc., where she held the positions of Manager, Learning & Development from 2014 until 2015, and Manager, Benefits & Organizational Development from 2012 until 2014.
Ms. Ryan was previously employed by BorgWarner Inc. from 2001 until 2007 and prior to that, held a variety of human resources positions with Kimberly-Clark Corporation and Gulfstream Aerospace Corporation, a wholly owned subsidiary of General Dynamics Corporation.
In her role as Chief People Officer, Ms. Ryan is responsible for the oversight of all traditional human resources functions.
R.
Item 11. Executive Compensation.
1 rewritten, 0 added, 0 removed, 0 unchanged
The information required by this item is incorporated herein by reference to the [removed: 2019] [added: 2020] Proxy Statement under the heading “Compensation Matters.”
Item 12. Security Ownership of Certain Beneficial Owners and Management and Related Stockholders Matters.
11 rewritten, 4 added, 5 removed, 2 unchanged
[removed: Equity] [added: Equity] Compensation Plan [removed: Information][added: Information]
The following table sets forth information as of December 31, [removed: 2018,] [added: 2019,] with respect to compensation plans under which the Company’s equity securities are authorized for issuance:
| [removed: Plan Category] [added: Plan Category] | [removed: Number] [added: | Number] of [removed: securities remaining available for] [added: securities remaining available for] future [removed: issuance under equity compensation plans(1)] [added: issuance under equity compensation plans(1)] | | | [added: |]
| Equity compensation plans approved by shareholders: | | | | [added: | |]
| Brown & Brown, Inc. 2010 Stock Incentive Plan | [removed: 8,697,491] | | [removed: (2)] [added: —] | [added: | |]
| Brown & Brown, Inc. 1990 Employee Stock Purchase Plan | [removed: 7,316,901] | | [added: 6,340,598] | [added: | |]
| Brown & Brown, Inc. Performance Stock Plan | [added: | |] — | | |
| Equity compensation plans not approved by shareholders | [added: | |] — | | |
| (1) | All of the shares available for future issuance under the Brown & Brown, Inc. Performance Stock Plan, and the Brown & Brown, Inc. [removed: 2010] [added: 2019] Stock Incentive Plan may be issued in connection with options, warrants, rights, restricted stock, or other stock-based awards. |
| (2) | The payout for [removed: 1,770,134] [added: 1,629,618] shares of our outstanding performance-based restricted stock grants may be increased up to 200% of the target or decreased to zero, subject to the level of performance attained. The amount reflected in the table is calculated assuming the maximum payout for all restricted stock grants. |
The information required by this item is incorporated herein by reference to the [removed: 2019] [added: 2020] Proxy Statement under the heading “Security Ownership of Management and Certain Beneficial Owners.”
| | | A | | | |
| --- | --- | --- | --- | --- | --- |
| Brown & Brown, Inc. 2019 Stock Incentive Plan | | | 9,515,603 | | (2) |
| Total | | | 15,856,201 | | |
| | | | |
| --- | --- | --- | --- |
| | A | | |
| Total | 16,014,392 | | |
| | |
Item 13. Certain Relationships and Related Transactions, and Director Independence.
1 rewritten, 0 added, 0 removed, 0 unchanged
The information required by this item is incorporated herein by reference to the [removed: 2019] [added: 2020] Proxy Statement under the headings “Director Independence,” “Related Party Transactions Policy” and “Relationships and Transactions with Affiliated Parties.”
Item 14. Principal Accounting Fees and Services.
2 rewritten, 0 added, 0 removed, 0 unchanged
The information required by this item is incorporated herein by reference to the [removed: 2019] [added: 2020] Proxy Statement under the heading “Fees Paid to Deloitte & Touche LLP.”
[removed: PART IV][added: PART IV]
Item 15. Exhibits and Financial Statements Schedules.
36 rewritten, 45 added, 4 removed, 12 unchanged
| 3.1 | [added: |] [Articles of Amendment to the Articles of Incorporation (adopted February 26, 2018) (incorporated by reference to Exhibit 3.1 to Form 8-K filed March 29, 2018](http://www.sec.gov/Archives/edgar/data/79282/000007928218000011/exhibit31032817.htm) and [Articles of Amendment to Articles of Incorporation (adopted April 24, 2003) (incorporated by reference to Exhibit 3a to Form 10-Q for the quarter ended March 31, [removed: 2003)](http://www.sec.gov/Archives/edgar/data/79282/000007928203000031/exhibit3.htm),] [added: 2003](http://www.sec.gov/Archives/edgar/data/79282/000007928203000031/exhibit3.htm)),] and [Amended and Restated Articles of Incorporation (incorporated by reference to Exhibit 3a to Form 10-Q for the quarter ended March 31, 1999).](http://www.sec.gov/Archives/edgar/data/79282/0000079282-99-000010.txt) |
| 3.2 | [added: |] [Bylaws (incorporated by reference to Exhibit 3.2 to Form 8-K filed on October 12, 2016).](http://www.sec.gov/Archives/edgar/data/79282/000007928216000059/exhibit32-amendedandrestat.htm) |
| [removed: 4.1] [added: 4.2] | [removed: [Indenture,] [added: | [First Supplemental Indenture,] dated as of September 18, 2014, between the Registrant and U.S. Bank National Association (incorporated by reference to Exhibit [removed: 4.1] [added: 4.2] to Form 8-K filed on September 18, [removed: 2014).](http://www.sec.gov/Archives/edgar/data/79282/000119312514345625/d791510dex41.htm)] [added: 2014).](http://www.sec.gov/Archives/edgar/data/79282/000119312514345625/d791510dex42.htm)] |
| [removed: 4.2] [added: 4.4] | [removed: [First] [added: | [Second] Supplemental Indenture, dated as of [removed: September 18, 2014,] [added: March 11, 2019,] between the Registrant and U.S. Bank National Association (incorporated by reference to Exhibit 4.2 to Form 8-K filed on [removed: September 18, 2014).](http://www.sec.gov/Archives/edgar/data/79282/000119312514345625/d791510dex42.htm)] [added: March 12, 2019).](http://www.sec.gov/Archives/edgar/data/79282/000120677419000775/brown3559321-ex42.htm)] |
| 4.3 | [added: |] [Form of the Registrant’s 4.200% Notes due 2024 (incorporated by reference to Exhibit 4.3 to Form 8-K filed on September 18, 2014).](http://www.sec.gov/Archives/edgar/data/79282/000119312514345625/d791510dex43.htm) |
| [removed: 10.1(a)] [added: 10.1(a)*] | [added: |] [Employment Agreement, dated and effective as of July 1, 2009 between the Registrant and J. Hyatt Brown (incorporated by reference to Exhibit 10.1 to Form 10-Q for the quarter ended June 30, [removed: 2009).*](http://www.sec.gov/Archives/edgar/data/79282/000118811209001779/ex10-1.htm)] [added: 2009).](http://www.sec.gov/Archives/edgar/data/79282/000118811209001779/ex10-1.htm)] |
| [removed: 10.1(b)] [added: 10.1(b)*] | [added: |] [Executive Employment Agreement, effective as of February 17, 2014, between the Registrant and R. Andrew Watts (incorporated by reference to Exhibit 10.2 to Form 10-Q for the quarter ended March 31, [removed: 2014).*](http://www.sec.gov/Archives/edgar/data/79282/000119312514195014/d700826dex102.htm)] [added: 2014).](http://www.sec.gov/Archives/edgar/data/79282/000119312514195014/d700826dex102.htm)] |
| [removed: 10.1(c)] [added: 10.1(c)*] | [added: |] [Form of Employment Agreement (incorporated by reference to Exhibit 10.2 to Form 10-Q for the quarter ended September 30, [removed: 2014).*](http://www.sec.gov/Archives/edgar/data/79282/000119312514401278/d772435dex102.htm)] [added: 2014).](http://www.sec.gov/Archives/edgar/data/79282/000119312514401278/d772435dex102.htm)] |
| [removed: 10.1(d)] [added: 10.1(d)*] | [added: |] [Employment Agreement, dated as of January 9, 2012, between the Registrant and Chris L. Walker (incorporated by reference to Exhibit 10.1 to Form 10-Q for the quarter ended March 31, [removed: 2013).*](http://www.sec.gov/Archives/edgar/data/79282/000119312513210708/d511426dex101.htm)] [added: 2013).](http://www.sec.gov/Archives/edgar/data/79282/000119312513210708/d511426dex101.htm)] |
| [removed: 10.1(e)] [added: 10.1(e)*] | [added: |] [Employment Agreement, dated as of November 16, 2018, between the Registrant and James C. [removed: Hays.*](https://www.sec.gov/Archives/edgar/data/79282/000007928219000006/exhibit101eq42018.htm)] [added: Hays (incorporated by reference to Exhibit 10.1(e) to Form 10-K for the year ended December 31, 2019).](http://www.sec.gov/Archives/edgar/data/79282/000007928219000006/exhibit101eq42018.htm)] |
| [removed: 10.2(a)] [added: 10.2(a)*] | [added: |] [Registrant’s Stock Performance Plan (incorporated by reference to Exhibit 4 to Registration Statement No. 333-14925 on Form S-8 filed on October 28, [removed: 1996).*](http://www.sec.gov/Archives/edgar/data/79282/0000079282-96-000015.txt)] [added: 1996).](http://www.sec.gov/Archives/edgar/data/79282/0000079282-96-000015.txt)] |
| [removed: 10.2(b)] [added: 10.2(b)*] | [added: |] [Registrant’s Stock Performance Plan as amended, effective January 23, 2008 (incorporated by reference to Exhibit 10.6(b) to Form 10-K for the year ended December 31, [removed: 2007).*](http://www.sec.gov/Archives/edgar/data/79282/000118811208000632/d22761_ex10-6b.htm)] [added: 2007).](http://www.sec.gov/Archives/edgar/data/79282/000118811208000632/d22761_ex10-6b.htm)] |
| [removed: 10.2(c)] [added: 10.2(c)*] | [added: |] [Registrant’s [removed: Stock] Performance [added: Stock] Plan as amended, effective July 21, 2009 (incorporated by reference to Exhibit 10.2 to Form 10-Q for the quarter ended September 30, [removed: 2009).*](http://www.sec.gov/Archives/edgar/data/79282/000118811209002316/ex10-2.htm)] [added: 2009).](http://www.sec.gov/Archives/edgar/data/79282/000118811209002316/ex10-2.htm)] |
| [removed: 10.3] [added: 10.3(a)*] | [added: |] [Registrant’s 2010 Stock Incentive Plan, as amended (incorporated by reference to Exhibit 10.1 to Form 8-K filed on May 5, [removed: 2017).*](http://www.sec.gov/Archives/edgar/data/79282/000007928217000018/exhibit101050517.htm)] [added: 2017).](http://www.sec.gov/Archives/edgar/data/79282/000007928217000018/exhibit101050517.htm)] |
| [removed: 10.4(a)] [added: 10.4(a)*] | [added: |] [Form of Performance-Based Stock Grant Agreement under 2010 Stock Incentive Plan (incorporated by reference to Exhibit 10.16 to Form 10-K for the year ended December 31, [removed: 2010).*](http://www.sec.gov/Archives/edgar/data/79282/000119312511051929/dex1016.htm)] [added: 2010).](http://www.sec.gov/Archives/edgar/data/79282/000119312511051929/dex1016.htm)] |
| [removed: 10.4(b)] [added: 10.4(b)*] | [added: |] [Form of Performance-Triggered Stock Grant Agreement under 2010 Stock Incentive Plan (incorporated by reference to Exhibit 10.1 to Form 8-K filed on July 8, [removed: 2013).*](http://www.sec.gov/Archives/edgar/data/79282/000007928213000015/exh101.htm)] [added: 2013).](http://www.sec.gov/Archives/edgar/data/79282/000007928213000015/exh101.htm)] |
| [removed: 10.4(c)] [added: 10.4(c)*] | [added: |] [Form of Performance Stock Award Agreement under the 2010 Stock Incentive Plan (incorporated by reference to Exhibit 10.5(c) to Form 10-K filed on February 28, [removed: 2018).*](http://www.sec.gov/Archives/edgar/data/79282/000007928218000006/exhibit105cq42017.htm)] [added: 2018).](http://www.sec.gov/Archives/edgar/data/79282/000007928218000006/exhibit105cq42017.htm)] |
| [removed: 10.4(d)] [added: 10.4(d)*] | [added: |] [Form of Restricted Stock Award Agreement under the 2010 Stock Incentive Plan (incorporated by reference to Exhibit 10.2 to Form 8-K filed on March 23, [removed: 2016).*](http://www.sec.gov/Archives/edgar/data/79282/000162828016012925/exhibit102-formofrsaagreem.htm)] [added: 2016).](http://www.sec.gov/Archives/edgar/data/79282/000162828016012925/exhibit102-formofrsaagreem.htm)] |
| 10.4(e) | [added: |] [Form of Director Stock Grant Agreement (incorporated by reference to Exhibit 10.8(e) to Form 10-K filed for the year ended December 31, 2016).](http://www.sec.gov/Archives/edgar/data/79282/000007928217000006/exhibit108e.htm) |
| 10.5 | [removed: [Promissory Note dated January 9, 2012, by and between Registrant] [added: | [Amended] and [added: Restated Credit Agreement dated as of June 28, 2017, among the Registrant,] JPMorgan Chase Bank, [removed: N.A.] [added: N.A., Bank of America, N.A., Royal Bank of Canada and SunTrust Bank] (incorporated by reference to Exhibit [removed: 10.18] [added: 10.1] to Form [removed: 10-K] [added: 10-Q] for the [removed: year] [added: quarter] ended [removed: December 31, 2011).](http://www.sec.gov/Archives/edgar/data/79282/000119312512089393/d233092dex1018.htm)] [added: June 30, 2017).](http://www.sec.gov/Archives/edgar/data/79282/000007928217000032/exhibit101q22017.htm)] |
| [removed: 10.7] [added: 10.6] | [removed: [Amended and Restated Credit Agreement] [added: | [Settlement Agreement,] dated [removed: as of June 28,] [added: March 1,] 2017, [added: by and] among the Registrant, [removed: JPMorgan Chase Bank, N.A., Bank of America, N.A., Royal Bank] [added: AssuredPartners, Inc. and certain] of [removed: Canada] [added: its employees] and [removed: SunTrust Bank] [added: former employees] (incorporated by reference to Exhibit 10.1 to [removed: Form] [added: the form] 10-Q for the quarter ended [removed: June 30, 2017).](http://www.sec.gov/Archives/edgar/data/79282/000007928217000032/exhibit101q22017.htm)] [added: March 31, 2017).](http://www.sec.gov/Archives/edgar/data/79282/000007928217000019/exhibit101q12017.htm)] |
| [removed: 10.9] [added: 10.7*] | [added: |] [Asset Purchase Agreement, dated as of October 22, 2018, by and among Brown & Brown, Inc., BBHG, Inc., The Hays Group, Inc., The Hays Group Of Wisconsin LLC, The Hays Benefits Group, LLC, PlanIT, LLC, The Hays Benefits Group of Wisconsin, LLC, and The Hays Group of Illinois, LLC, and Claims Management of Missouri, [removed: LLC.](https://www.sec.gov/Archives/edgar/data/79282/000007928219000006/exhibit109q42018.htm)] [added: LLC (incorporated by reference to Exhibit 10.9 to Form 10-K for the year ended December 31, 2019).](http://www.sec.gov/Archives/edgar/data/79282/000007928219000006/exhibit109q42018.htm)] |
| [removed: 10.10] [added: 10.8*] | [added: |] [Term Loan Credit Agreement, dated December 21, 2018, by and among the Company, Wells Fargo Bank, National Association, as administrative agent, Bank of America, N.A., BMO Harris Bank N.A. and SunTrust Bank as co-syndication agents, and Wells Fargo Securities, LLC, Merrill Lynch, Pierce, Fenner & Smith Incorporated, BMO Capital Markets Corp. and SunTrust Robinson Humphrey, Inc. as joint lead arrangers and joint [removed: bookrunners.](https://www.sec.gov/Archives/edgar/data/79282/000007928219000006/exhibit1010q42018.htm)] [added: bookrunners (incorporated by reference to Exhibit 10.10 to Form 10-K for the year ended December 31, 2019).](http://www.sec.gov/Archives/edgar/data/79282/000007928219000006/exhibit1010q42018.htm)] |
| [removed: 21] [added: 21] | [added: |] [Subsidiaries of the [removed: Registrant.](https://www.sec.gov/Archives/edgar/data/79282/000007928219000006/exhibit21q42018.htm)] [added: Registrant.](https://www.sec.gov/Archives/edgar/data/79282/000156459020006075/bro-ex21_11.htm)] |
| [removed: 23] [added: 23] | [added: |] [Consent of Deloitte & Touche [removed: LLP.](https://www.sec.gov/Archives/edgar/data/79282/000007928219000006/exhibit23q42018.htm)] [added: LLP.](https://www.sec.gov/Archives/edgar/data/79282/000156459020006075/bro-ex23_178.htm)] |
| [removed: 24] [added: 24] | [added: |] [Powers of [removed: Attorney.](https://www.sec.gov/Archives/edgar/data/79282/000007928219000006/exhibit24q42018.htm)] [added: Attorney.](https://www.sec.gov/Archives/edgar/data/79282/000156459020006075/bro-ex24_10.htm)] |
| [removed: 31.1] [added: 31.1] | [added: |] [Rule 13a-14(a)/15d-14(a) Certification by the Chief Executive Officer of the [removed: Registrant.](https://www.sec.gov/Archives/edgar/data/79282/000007928219000006/exhibit311q42018.htm)] [added: Registrant.](https://www.sec.gov/Archives/edgar/data/79282/000156459020006075/bro-ex311_9.htm)] |
| [removed: 31.2] [added: 31.2] | [added: |] [Rule 13a-14(a)/15d-14(a) Certification by the Chief Financial Officer of the [removed: Registrant.](https://www.sec.gov/Archives/edgar/data/79282/000007928219000006/exhibit312q42018.htm)] [added: Registrant.](https://www.sec.gov/Archives/edgar/data/79282/000156459020006075/bro-ex312_8.htm)] |
| [removed: 32.1] [added: 32.1] | [added: |] [Section 1350 Certification by the Chief Executive Officer of the [removed: Registrant.](https://www.sec.gov/Archives/edgar/data/79282/000007928219000006/exhibit321q42018.htm)] [added: Registrant.](https://www.sec.gov/Archives/edgar/data/79282/000156459020006075/bro-ex321_7.htm)] |
| [removed: 32.2] [added: 32.2] | [added: |] [Section 1350 Certification by the Chief Financial Officer of the [removed: Registrant.](https://www.sec.gov/Archives/edgar/data/79282/000007928219000006/exhibit322q42018.htm)] [added: Registrant.](https://www.sec.gov/Archives/edgar/data/79282/000156459020006075/bro-ex322_6.htm)] |
| 101.INS | [added: | Inline] XBRL Instance Document - the instance document does not appear in the Interactive Data File because its XBRL tags are embedded within the Inline XBRL document. |
| 101.SCH | [added: | Inline] XBRL Taxonomy Extension Schema Document. |
| 101.CAL | [added: | Inline] XBRL Taxonomy Extension Calculation Linkbase Document. |
| 101.DEF | [added: | Inline] XBRL Taxonomy Extension Definition Linkbase Document. |
| 101.LAB | [added: | Inline] XBRL Taxonomy Extension Label Linkbase Document. |
| 101.PRE | [added: | Inline] XBRL Taxonomy Extension Presentation Linkbase Document. |
| --- | --- | --- |
| | | |
| | | |
| 4.1 | | [Description of the Registrant’s capital stock.](https://www.sec.gov/Archives/edgar/data/79282/000156459020006075/bro-ex41_204.htm) |
| | | |
| | | |
| | | |
| | | |
| 4.6 | | [Form of Registrant’s 4.500% Notes due 2029 (incorporated by reference to Exhibit 4.3 to Form 8-K filed on March 12, 2019).](http://www.sec.gov/Archives/edgar/data/79282/000120677419000775/brown3559321-ex43.htm) |
| | | |
| | | |
| | | |
| | | |
| | | |
| | | |
| | | |
| | | |
| | | |
| | | |
| 10.3(b)* | | [Registrant’s 2019 Stock Incentive Plan (incorporated by reference to Exhibit 10.1 to Form 8-K filed on May 3, 2019).](http://www.sec.gov/Archives/edgar/data/79282/000007928219000013/exhibit101-sip.htm) |
| | | |
| | | |
| --- | --- | --- |
| | | |
| | | |
| | | |
| | | |
| | | |
| | | |
| | | |
| | | |
| | | |
| | | |
| | | |
| | | |
| | | |
| | | |
| | | |
| | | |
| | | |
| | |
| --- | --- |
| 10.6 | [Letter Agreement dated January 9, 2012 by and between Registrant and JPMorgan Chase Bank, N.A. (incorporated by reference to Exhibit 10.19 to Form 10-K for the year ended December 31, 2011).](http://www.sec.gov/Archives/edgar/data/79282/000119312512089393/d233092dex1019.htm) |
| 10.8 | [Settlement Agreement, dated March 1, 2017, by and among the Company, AssuredPartners, Inc. and certain of its employees and former employees (incorporated by reference to Exhibit 10.1 to the form 10-Q for the quarter ended March 31, 2017).](http://www.sec.gov/Archives/edgar/data/79282/000007928217000019/exhibit101q12017.htm) |
An excerpt. Shown here: all 36 rewritten, 40 of 45 added and all 4 removed. The counts are complete. For every sentence, read Item 15. Exhibits and Financial Statements Schedules. in the FY2019 filing and the FY2018 filing.
Item 16. Form 10-K Summary.
8 rewritten, 11 added, 1 removed, 45 unchanged
[removed: SIGNATURE][added: SIGNATURE]
| Date: February [removed: 25, 2019] [added: 24, 2020] | | By: | /s/ J. Powell Brown | |
| | | | [removed: *President] [added: President] and Chief Executive [removed: Officer*] [added: Officer] | |
| [removed: Signature] [added: Signature] | | [removed: Title] [added: Title] | | [removed: Date] [added: Date] |
| /s/ J. Powell Brown | | Director; President and Chief Executive Officer (Principal Executive Officer) | | February [removed: 25, 2019] [added: 24, 2020] |
| /s/ R. Andrew Watts | | Executive Vice President, Chief Financial Officer and Treasurer (Principal Financial and Accounting Officer) | | February [removed: 25, 2019] [added: 24, 2020] |
| * | | Chairman of the Board | | February [removed: 25, 2019] [added: 24, 2020] |
| * | | Director | | February [removed: 25, 2019] [added: 24, 2020] |
| * | | Director | | February 24, 2020 |
| * | | Director | | February 24, 2020 |
| * | | Director | | February 24, 2020 |
| * | | Director | | February 24, 2020 |
| * | | Director | | February 24, 2020 |
| * | | Director | | February 24, 2020 |
| * | | Director | | February 24, 2020 |
| * | | Director | | February 24, 2020 |
| * | | Director | | February 24, 2020 |
| * | | Director | | February 24, 2020 |
| * | | Director | | February 24, 2020 |
| | |