 filings.tools
Item 2. Management’s Discussion and Analysis of Financial Condition and Results of Operations
170K characters. Original on sec.gov · Markdown
Item 2. Management’s Discussion and Analysis of Financial Condition and Results of Operations
The following Management’s Discussion and Analysis of Financial Condition and Results of Operations (MD&A) is intended to provide information that will assist the reader in understanding the company’s Consolidated Financial Statements, the changes in certain key items in those financial statements between select periods and the primary factors that accounted for those changes. In addition, we discuss how certain accounting principles, policies and critical estimates affect our Consolidated Financial Statements. Our discussion also contains certain forward-looking statements related to future events and expectations as well as a discussion of the many factors that we believe may have an impact on our business on an ongoing basis. This MD&A should be read in conjunction with our discussion of cautionary statements and significant risks to the company’s business under Part I, Item 1A. Risk Factors of the 2021 Form 10-K.
Highlights for the third quarter of 2022 include:
-
Total sales and revenues for the third quarter of 2022 were $14.994 billion, an increase of $2.597 billion, or 21 percent, compared with $12.397 billion in the third quarter of 2021. Sales were higher across the three primary segments.
-
Operating profit margin was 16.2 percent for the third quarter of 2022, compared with 13.4 percent for the third quarter of 2021. Adjusted operating profit margin was 16.5 percent for the third quarter of 2022, compared with 13.7 percent for the third quarter of 2021.
-
Third-quarter 2022 profit per share was $3.87, and excluding the items in the table below, adjusted profit per share was $3.95. Third-quarter 2021 profit per share was $2.60 and, excluding the items in the table below, adjusted profit per share was $2.66.
-
Caterpillar ended the third quarter of 2022 with $6.3 billion of enterprise cash.
Highlights for the nine months ended September 30, 2022 include:
-
Total sales and revenues were $42.830 billion for the nine months ended September 30, 2022, an increase of $5.657 billion, or 15 percent, compared with $37.173 billion for the nine months ended September 30, 2021.
-
Operating profit margin was 14.5 percent for the nine months ended September 30, 2022, compared with 14.2 percent for the nine months ended September 30, 2021. Adjusted operating profit margin was 14.7 percent for the nine months ended September 30, 2022, compared with 14.5 percent for the nine months ended September 30, 2021.
-
Profit per share for the nine months ended September 30, 2022, was $9.85 and, excluding the items in the table below, adjusted profit per share was $9.99. Profit per share for the nine months ended September 30, 2021, was $7.94, and excluding the items in the table below, adjusted profit per share was $8.13.
-
Enterprise operating cash flow was $5.0 billion for the nine months ended September 30, 2022.
-
In order for our results to be more meaningful to our readers, we have separately quantified the impact of several significant items. A detailed reconciliation of GAAP to non-GAAP financial measures is included on page 65.
| Three Months Ended September 30, 2022 | Three Months Ended September 30, 2021 | Nine Months Ended September 30, 2022 | Nine Months Ended September 30, 2021 | ||||||||||||||||||||||||||||||||
| (Dollars in millions except per share data) | Profit Before Taxes | Profit Per Share | Profit Before Taxes | Profit Per Share | Profit Before Taxes | Profit Per Share | Profit Before Taxes | Profit Per Share | |||||||||||||||||||||||||||
| Profit | $ | 2,558 | $ | 3.87 | $ | 1,775 | $ | 2.60 | $ | 6,653 | $ | 9.85 | $ | 5,642 | $ | 7.94 | |||||||||||||||||||
| Restructuring costs | 49 | 0.08 | 35 | 0.06 | 90 | 0.14 | 124 | 0.19 | |||||||||||||||||||||||||||
| Adjusted profit | $ | 2,607 | $ | 3.95 | $ | 1,810 | $ | 2.66 | $ | 6,743 | $ | 9.99 | $ | 5,766 | $ | 8.13 | |||||||||||||||||||
Overview
Total sales and revenues for the third quarter of 2022 were $14.994 billion, an increase of $2.597 billion, or 21 percent, compared with $12.397 billion in the third quarter of 2021. The increase was due to favorable price realization and higher sales volume, partially offset by unfavorable currency impacts primarily related to the euro, Japanese yen and Australian dollar. The increase in sales volume was driven by the impact from changes in dealer inventories, higher sales of equipment to end users and higher services. Dealers increased inventories by $700 million during the third quarter of 2022, compared with a decrease of $300 million during the third quarter of 2021. Sales were higher across the three primary segments.
Third-quarter 2022 profit per share was $3.87, compared with $2.60 profit per share in the third quarter of 2021. Profit per share for both quarters included restructuring costs. Profit for the third quarter of 2022 was $2.041 billion, an increase of $615 million, or 43%, compared with $1.426 billion for the third quarter of 2021. The increase was primarily due to favorable price realization and higher sales volume, partially offset by unfavorable manufacturing costs and higher selling, general and administrative (SG&A) and research and development (R&D) expenses. Unfavorable manufacturing costs largely reflected higher material costs, freight and the impact of manufacturing inefficiencies. SG&A/R&D expenses increased primarily due to investments aligned with the company's strategy for profitable growth and higher short-term incentive compensation expense.
Global Business Conditions**:**
We continue to monitor a variety of external factors around the world, such as supply chain disruptions, inflationary cost and labor pressures. Areas of particular focus include certain components, transportation and raw materials. Transportation shortages have resulted in delays and increased costs. In addition, our suppliers are dealing with availability issues and freight delays, which leads to pressure on production in our facilities. Contingency plans have been developed and continue to be modified to minimize supply chain challenges that may impact our ability to meet increasing customer demand. We continue to assess the environment and are taking appropriate price actions in response to rising costs. We will continue to monitor the situation as conditions remain fluid and evolve throughout the year. We address these external factors throughout the discussion in the Consolidated Results of Operations section below.
Notes:
-
Glossary of terms is included on pages 58 - 60; first occurrence of terms shown in bold italics.
-
Information on non-GAAP financial measures is included on page 65.
-
Certain amounts may not add due to rounding.
Consolidated Results of Operations
THREE MONTHS ENDED SEPTEMBER 30, 2022 COMPARED WITH THREE MONTHS ENDED SEPTEMBER 30, 2021
CONSOLIDATED SALES AND REVENUES
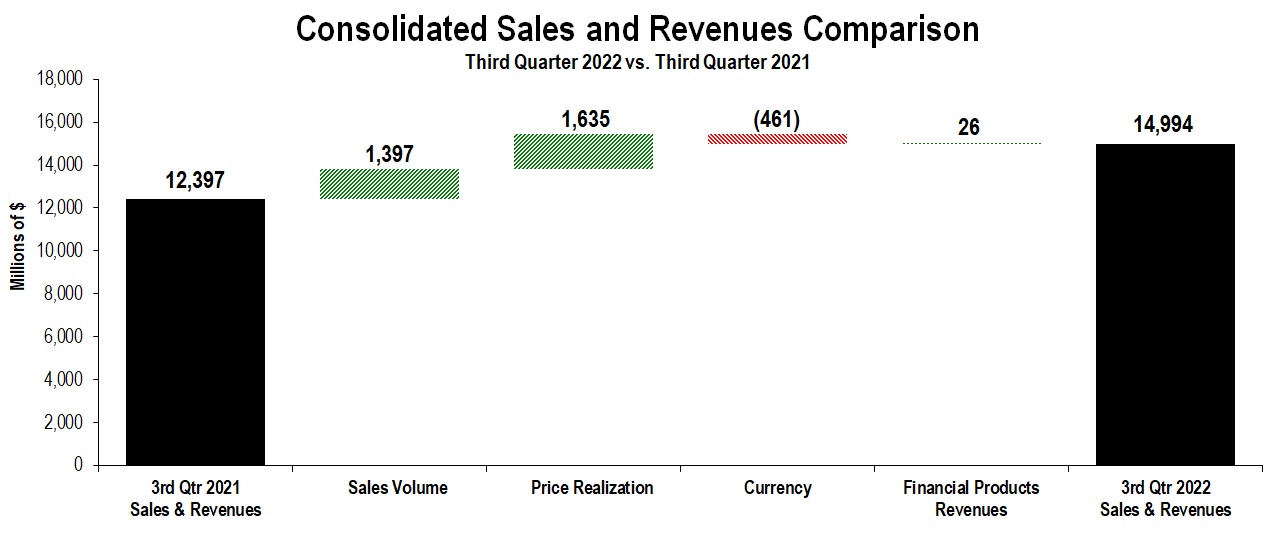
The chart above graphically illustrates reasons for the change in consolidated sales and revenues between the third quarter of 2021 (at left) and the third quarter of 2022 (at right). Caterpillar management utilizes these charts internally to visually communicate with the company’s Board of Directors and employees.
Total sales and revenues for the third quarter of 2022 were $14.994 billion, an increase of $2.597 billion, or 21 percent, compared with $12.397 billion in the third quarter of 2021. The increase was due to favorable price realization and higher sales volume, partially offset by unfavorable currency impacts primarily related to the euro, Japanese yen and Australian dollar. The increase in sales volume was driven by the impact from changes in dealer inventories, higher sales of equipment to end users and higher services. Dealers increased inventories by $700 million during the third quarter of 2022, compared with a decrease of $300 million during the third quarter of 2021.
Sales were higher across the three primary segments.
North America sales increased 33 percent due to favorable price realization, the impact from changes in dealer inventories, services and higher sales of equipment to end users. Dealers increased inventories during the third quarter of 2022, compared with a decrease during the third quarter of 2021.
Sales increased 36 percent in Latin America due to favorable price realization, higher sales of equipment to end users and the impact from changes in dealer inventories. Dealers increased inventories during the third quarter of 2022, compared with remaining about flat during the third quarter of 2021.
EAME sales increased 8 percent as unfavorable currency impacts, primarily related to the euro and British pound, were more than offset by favorable price realization, the impact from changes in dealer inventories and higher sales of equipment to end users. Dealers increased inventories during the third quarter of 2022, compared with remaining about flat during the third quarter of 2021.
Asia/Pacific sales increased 9 percent driven by favorable price realization and the impact from changes in dealer inventories, partially offset by unfavorable currency impacts, related to the Japanese yen and Australian dollar. Dealers increased inventories during the third quarter of 2022, compared with a decrease during the third quarter of 2021.
Dealers increased inventories by $700 million during the third quarter of 2022, compared with a decrease of $300 million during the third quarter of 2021. Most of the increase related to timing differences between when we ship product to dealers and when the dealers, in turn, are able to deliver completed orders to customers. Dealers are independent, and the reasons for changes in their inventory levels vary, including their expectations of future demand and product delivery times. Dealers’ demand expectations take into account seasonal changes, macroeconomic conditions, machine rentals and other factors. Delivery times can vary based on availability of product from Caterpillar factories and product distribution centers. At year end, we expect dealer inventory levels to be similar to the third quarter of 2022.
Compared to the fourth quarter of 2021, we expect higher sales to users and price realization to support the sales growth in the fourth quarter of 2022. We anticipate the fourth quarter will reflect our highest quarterly sales for the year, which is in line with typical seasonality.
| Sales and Revenues by Segment | |||||||||||||||||||||||||||||||||||||||||||||||
| (Millions of dollars) | Third Quarter 2021 | Sales Volume | Price Realization | Currency | Inter-Segment / Other | Third Quarter 2022 | $ Change | % Change | |||||||||||||||||||||||||||||||||||||||
| Construction Industries | $ | 5,255 | $ | 423 | $ | 781 | $ | (229) | $ | 46 | $ | 6,276 | $ | 1,021 | 19 | % | |||||||||||||||||||||||||||||||
| Resource Industries | 2,366 | 338 | 443 | (59) | (1) | 3,087 | 721 | 30 | % | ||||||||||||||||||||||||||||||||||||||
| Energy & Transportation | 5,077 | 618 | 409 | (171) | 253 | 6,186 | 1,109 | 22 | % | ||||||||||||||||||||||||||||||||||||||
| All Other Segment | 119 | 2 | — | (2) | (16) | 103 | (16) | (13 | %) | ||||||||||||||||||||||||||||||||||||||
| Corporate Items and Eliminations | (1,110) | 16 | 2 | — | (282) | (1,374) | (264) | ||||||||||||||||||||||||||||||||||||||||
| Machinery, Energy & Transportation Sales | 11,707 | 1,397 | 1,635 | (461) | — | 14,278 | 2,571 | 22 | % | ||||||||||||||||||||||||||||||||||||||
| Financial Products Segment | 762 | — | — | — | 57 | 819 | 57 | 7 | % | ||||||||||||||||||||||||||||||||||||||
| Corporate Items and Eliminations | (72) | — | — | — | (31) | (103) | (31) | ||||||||||||||||||||||||||||||||||||||||
| Financial Products Revenues | 690 | — | — | — | 26 | 716 | 26 | 4 | % | ||||||||||||||||||||||||||||||||||||||
| Consolidated Sales and Revenues | $ | 12,397 | $ | 1,397 | $ | 1,635 | $ | (461) | $ | 26 | $ | 14,994 | $ | 2,597 | 21 | % | |||||||||||||||||||||||||||||||
| Sales and Revenues by Geographic Region |
| North America | Latin America | EAME | Asia/Pacific | External Sales and Revenues | Inter-Segment | Total Sales and Revenues | |||||||||||||||||||||||||||||||||||||||||||||||||||||||||||||||||||||||||||||
| (Millions of dollars) | $ | % Chg | $ | % Chg | $ | % Chg | $ | % Chg | $ | % Chg | $ | % Chg | $ | % Chg | |||||||||||||||||||||||||||||||||||||||||||||||||||||||||||||||||||||
| Third Quarter 2022 | |||||||||||||||||||||||||||||||||||||||||||||||||||||||||||||||||||||||||||||||||||
| Construction Industries | $ | 3,106 | 29 | % | $ | 799 | 51 | % | $ | 1,247 | 1 | % | $ | 1,084 | 1 | % | $ | 6,236 | 19 | % | $ | 40 | (767 | %) | $ | 6,276 | 19 | % | |||||||||||||||||||||||||||||||||||||||||||||||||||||||
| Resource Industries | 1,122 | 66 | % | 472 | 13 | % | 526 | 15 | % | 893 | 20 | % | 3,013 | 32 | % | 74 | (1 | %) | 3,087 | 30 | % | ||||||||||||||||||||||||||||||||||||||||||||||||||||||||||||||
| Energy & Transportation | 2,422 | 26 | % | 468 | 42 | % | 1,280 | 12 | % | 827 | 11 | % | 4,997 | 21 | % | 1,189 | 27 | % | 6,186 | 22 | % | ||||||||||||||||||||||||||||||||||||||||||||||||||||||||||||||
| All Other Segment | 16 | (11 | %) | — | — | % | 4 | 33 | % | 15 | 7 | % | 35 | — | % | 68 | (19 | %) | 103 | (13 | %) | ||||||||||||||||||||||||||||||||||||||||||||||||||||||||||||||
| Corporate Items and Eliminations | 1 | — | — | (4) | (3) | (1,371) | (1,374) | ||||||||||||||||||||||||||||||||||||||||||||||||||||||||||||||||||||||||||||
| Machinery, Energy & Transportation Sales | 6,667 | 33 | % | 1,739 | 36 | % | 3,057 | 8 | % | 2,815 | 9 | % | 14,278 | 22 | % | — | — | 14,278 | 22 | % | |||||||||||||||||||||||||||||||||||||||||||||||||||||||||||||||
| Financial Products Segment | 522 | 9 | % | 90 | 32 | % | 100 | (5 | %) | 107 | (4 | %) | 819 | 1 | 7 | % | — | — | 819 | 7 | % | ||||||||||||||||||||||||||||||||||||||||||||||||||||||||||||||
| Corporate Items and Eliminations | (54) | (20) | (12) | (17) | (103) | — | (103) | ||||||||||||||||||||||||||||||||||||||||||||||||||||||||||||||||||||||||||||
| Financial Products Revenues | 468 | 6 | % | 70 | 27 | % | 88 | (8 | %) | 90 | (8 | %) | 716 | 4 | % | — | — | 716 | 4 | % | |||||||||||||||||||||||||||||||||||||||||||||||||||||||||||||||
| Consolidated Sales and Revenues | $ | 7,135 | 31 | % | $ | 1,809 | 36 | % | $ | 3,145 | 7 | % | $ | 2,905 | 9 | % | $ | 14,994 | 21 | % | $ | — | — | $ | 14,994 | 21 | % | ||||||||||||||||||||||||||||||||||||||||||||||||||||||||
| Third Quarter 2021 | |||||||||||||||||||||||||||||||||||||||||||||||||||||||||||||||||||||||||||||||||||
| Construction Industries | $ | 2,417 | $ | 528 | $ | 1,240 | $ | 1,076 | $ | 5,261 | $ | (6) | $ | 5,255 | |||||||||||||||||||||||||||||||||||||||||||||||||||||||||||||||||||||
| Resource Industries | 674 | 417 | 456 | 744 | 2,291 | 75 | 2,366 | ||||||||||||||||||||||||||||||||||||||||||||||||||||||||||||||||||||||||||||
| Energy & Transportation | 1,924 | 329 | 1,144 | 744 | 4,141 | 936 | 5,077 | ||||||||||||||||||||||||||||||||||||||||||||||||||||||||||||||||||||||||||||
| All Other Segment | 18 | — | 3 | 14 | 35 | 84 | 119 | ||||||||||||||||||||||||||||||||||||||||||||||||||||||||||||||||||||||||||||
| Corporate Items and Eliminations | (19) | — | — | (2) | (21) | (1,089) | (1,110) | ||||||||||||||||||||||||||||||||||||||||||||||||||||||||||||||||||||||||||||
| Machinery, Energy & Transportation Sales | 5,014 | 1,274 | 2,843 | 2,576 | 11,707 | — | 11,707 | ||||||||||||||||||||||||||||||||||||||||||||||||||||||||||||||||||||||||||||
| Financial Products Segment | 478 | 68 | 105 | 111 | 762 | 1 | — | 762 | |||||||||||||||||||||||||||||||||||||||||||||||||||||||||||||||||||||||||||
| Corporate Items and Eliminations | (37) | (13) | (9) | (13) | (72) | — | (72) | ||||||||||||||||||||||||||||||||||||||||||||||||||||||||||||||||||||||||||||
| Financial Products Revenues | 441 | 55 | 96 | 98 | 690 | — | 690 | ||||||||||||||||||||||||||||||||||||||||||||||||||||||||||||||||||||||||||||
| Consolidated Sales and Revenues | $ | 5,455 | $ | 1,329 | $ | 2,939 | $ | 2,674 | $ | 12,397 | $ | — | $ | 12,397 |
1 Includes revenues from Machinery, Energy & Transportation of $124 million and $87 million in the third quarter of 2022 and 2021, respectively.
CONSOLIDATED OPERATING PROFIT
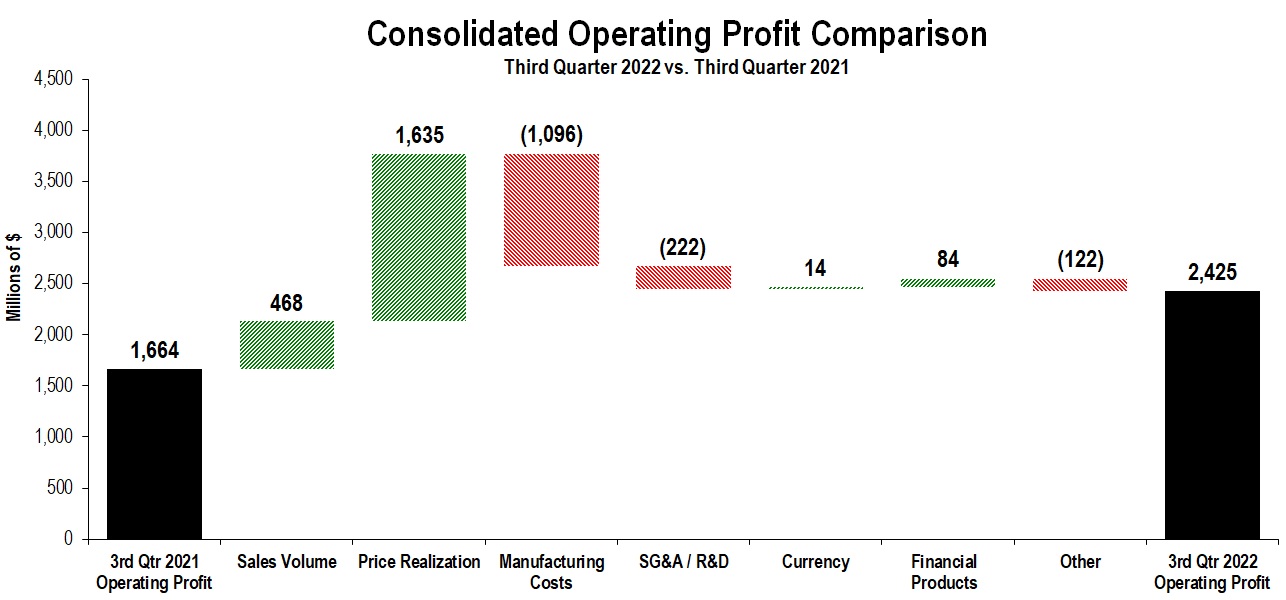
The chart above graphically illustrates reasons for the change in consolidated operating profit between the third quarter of 2021 (at left) and the third quarter of 2022 (at right). Caterpillar management utilizes these charts internally to visually communicate with the company’s Board of Directors and employees. The bar titled Other includes consolidating adjustments and Machinery, Energy & Transportation's other operating (income) expenses.
Operating profit for the third quarter of 2022 was $2.425 billion, an increase of $761 million, or 46 percent, compared with $1.664 billion in the third quarter of 2021. The increase was primarily due to favorable price realization and higher sales volume, partially offset by higher manufacturing costs and higher SG&A/R&D expenses. Unfavorable manufacturing costs largely reflected higher material costs, freight and the impact of manufacturing inefficiencies, due to ongoing disruptions to the supply chain. SG&A/R&D expenses increased primarily due to investments aligned with the company's strategy for profitable growth, which included services growth and technology, such as digital, electrification and autonomy, as well as higher short-term incentive compensation expense.
Short-term incentive compensation expense was about $400 million in the third quarter of 2022, compared to about $350 million in the third quarter of 2021.
Operating profit margin was 16.2 percent for the third quarter of 2022, compared with 13.4 percent for the third quarter of 2021.
We expect higher sales volume and continued favorable price realization in the fourth quarter of 2022, compared with the fourth quarter of 2021. We anticipate the impact of favorable price realization to more than offset manufacturing cost increases, including manufacturing inefficiencies.
| Profit by Segment | |||||||||||||||||||||||
| (Millions of dollars) | Third Quarter 2022 | Third Quarter 2021 | $ Change | % Change | |||||||||||||||||||
| Construction Industries | $ | 1,209 | $ | 866 | $ | 343 | 40 | % | |||||||||||||||
| Resource Industries | 506 | 280 | 226 | 81 | % | ||||||||||||||||||
| Energy & Transportation | 935 | 706 | 229 | 32 | % | ||||||||||||||||||
| All Other Segment | 8 | 5 | 3 | 60 | % | ||||||||||||||||||
| Corporate Items and Eliminations | (373) | (286) | (87) | ||||||||||||||||||||
| Machinery, Energy & Transportation | 2,285 | 1,571 | 714 | 45 | % | ||||||||||||||||||
| Financial Products Segment | 220 | 173 | 47 | 27 | % | ||||||||||||||||||
| Corporate Items and Eliminations | 30 | (7) | 37 | ||||||||||||||||||||
| Financial Products | 250 | 166 | 84 | 51 | % | ||||||||||||||||||
| Consolidating Adjustments | (110) | (73) | (37) | ||||||||||||||||||||
| Consolidated Operating Profit | $ | 2,425 | $ | 1,664 | $ | 761 | 46 | % | |||||||||||||||
| Corporate Items and Eliminations included corporate-level expenses, timing differences (as some expenses are reported in segment profit on a cash basis), methodology differences between segment and consolidated external reporting (the company values segment inventories and cost of sales using a current cost methodology), certain restructuring costs and inter-segment eliminations. | |||||||||||||||||||||||
Other Profit/Loss and Tax Items
▪Interest expense excluding Financial Products in the third quarter of 2022 was $109 million, compared with $114 million in the third quarter of 2021. The decrease was due to lower average debt outstanding during the third quarter of 2022, compared with the third quarter of 2021.
▪Other income (expense) in the third quarter of 2022 was income of $242 million, compared with income of $225 million in the third quarter of 2021. The change was primarily driven by favorable impacts from foreign currency exchange and higher investment and interest income, partially offset by lower gains on marketable securities and lower pension and other postemployment benefit (OPEB) plan income.
▪The provision for income taxes for the third quarter of 2022 reflected an estimated annual tax rate of 23 percent, compared with 25 percent for the third quarter of 2021, excluding the discrete items discussed below. The comparative tax rate for full-year 2021 was approximately 23 percent.
In the third quarter of 2022, the company reached a settlement with the U.S. Internal Revenue Service (IRS) that resolves all issues for tax years 2007 through 2016, without any penalties. The company’s settlement includes, among other issues, the resolution of disputed tax treatment of profits earned by Caterpillar SARL (CSARL) from certain parts transactions. We vigorously contested the IRS’s application of the “substance-over-form” or “assignment-of-income” judicial doctrines and its proposed increases to tax and imposition of accuracy related penalties. The settlement does not include any increases to tax in the United States based on those judicial doctrines and does not include any penalties. The final tax assessed by the IRS for all issues under the settlement was $490 million for the ten-year period. This amount was primarily paid in the third quarter of 2022, and the associated estimated interest of $250 million is expected to be paid by the end of 2022. The settlement was within the total amount of gross unrecognized tax benefits for uncertain tax positions and enables us to avoid the costs and burdens of further disputes with the IRS. As a result of the settlement, we recorded a discrete tax benefit of $41 million to reflect changes in estimates of prior years’ taxes and related interest, net of tax. We are subject to the continuous examination of our income tax returns by the IRS, and tax years subsequent to 2016 are not yet under examination.
The provision for income taxes in third quarter of 2022 also included a $20 million benefit due to a decrease in the estimated annual tax rate, compared to $39 million in the third quarter of 2021. The company also recorded a discrete tax benefit of $36 million to reflect changes in estimates related to the prior year’s U.S. taxes in the third quarter of 2021.
Construction Industries
Construction Industries’ total sales were $6.276 billion in the third quarter of 2022, an increase of $1.021 billion, or 19 percent, compared with $5.255 billion in the third quarter of 2021. The increase was due to favorable price realization and higher sales volume, partially offset by unfavorable currency impacts primarily related to the euro, Japanese yen and Australian dollar. The increase in sales volume was driven by the impact from changes in dealer inventories. Dealer inventory increased during the third quarter of 2022, compared with a decrease during the third quarter of 2021.
▪In North America, sales increased due to favorable price realization and higher sales volume. Higher sales volume was driven by the impact from changes in dealer inventories. Dealer inventory decreased during the third quarter of 2021, compared with an increase during the third quarter of 2022. Dealer inventories in North America remained at relatively low levels.
▪Sales increased in Latin America primarily due to higher sales volume and favorable price realization. Higher sales volume was driven by higher sales of equipment to end users and the impact from changes in dealer inventories. Dealer inventory increased more during the third quarter of 2022 than during the third quarter of 2021.
▪In EAME, sales were about flat. Unfavorable currency impacts, primarily related to the euro, were offset by favorable price realization.
▪Sales were about flat in Asia/Pacific. Favorable price realization was offset by unfavorable currency impacts, primarily related to the Japanese yen and Australian dollar.
Construction Industries’ profit was $1.209 billion in the third quarter of 2022, an increase of $343 million, or 40 percent, compared with $866 million in the third quarter of 2021. The increase was mainly due to favorable price realization and higher sales volume, partially offset by unfavorable manufacturing costs and higher SG&A/R&D expenses. Unfavorable manufacturing costs largely reflected higher material costs, freight and the impact of manufacturing inefficiencies. The increase in SG&A/R&D expenses was primarily driven by investments aligned with strategic initiatives and higher short-term incentive compensation expense.
Construction Industries’ profit as a percent of total sales was 19.3 percent in the third quarter of 2022, compared with 16.5 percent in the third quarter of 2021.
Construction Industries’ segment profit as a percent of total sales is expected to improve in the fourth quarter of 2022, compared to the fourth quarter of 2021. We expect North America residential construction to moderate due to tightening financial conditions but remain at relatively high levels. We expect non-residential construction to strengthen due to investments related to government infrastructure initiatives. In Asia Pacific, excluding China, we expect moderate growth due to higher infrastructure spending and commodity prices. We expect continued weakness in China in the above 10-ton excavator industry. In EAME, business activity is expected to be flat to slightly down versus last year based on uncertain economic conditions in Europe. Construction activity in Latin America is expected to grow due to supportive commodity prices. We also expect favorable price realization in the fourth quarter of 2022, compared to the fourth quarter of 2021. The favorable impact of price realization is expected to more than offset manufacturing cost increases in the fourth quarter of 2022.
Resource Industries
Resource Industries’ total sales were $3.087 billion in the third quarter of 2022, an increase of $721 million, or 30 percent, compared with $2.366 billion in the third quarter of 2021. The increase was primarily due to favorable price realization and higher sales volume. The increase in sales volume was due to the impact of changes in dealer inventories, higher sales of aftermarket parts and higher sales of equipment to end users. Dealer inventory decreased during the third quarter of 2021, compared with an increase during the third quarter of 2022.
Resource Industries’ profit was $506 million in the third quarter of 2022, an increase of $226 million, or 81 percent, compared with $280 million in the third quarter of 2021. The increase was mainly due to favorable price realization and higher sales volume, partially offset by unfavorable manufacturing costs and higher SG&A/R&D expenses. Unfavorable manufacturing costs largely reflected higher material costs, freight and the impact of manufacturing inefficiencies. The increase in SG&A/R&D expenses was primarily driven by investments aligned with strategic initiatives.
Resource Industries’ profit as a percent of total sales was 16.4 percent in the third quarter of 2022, compared with 11.8 percent in the third quarter of 2021.
Resource Industries’ segment profit as a percent of total sales is expected to improve in the fourth quarter of 2022, compared to the fourth quarter of 2021. Commodity prices remain supportive of continued investment. We expect production and utilization levels will remain elevated, and our autonomous solutions continue to gain momentum. We expect the continuation of high equipment utilization and a low level of parked trucks, which both support future demand for our equipment and services. In Heavy Construction and Quarry and Aggregates, we anticipate continued growth in the fourth quarter. We also expect price realization to be favorable in the fourth quarter of 2022, compared to the fourth quarter of 2021. The favorable impact from price realization is expected to more than offset manufacturing cost increases in the fourth quarter of 2022.
Energy & Transportation
| Sales by Application | ||||||||||||||||||||||||||
| (Millions of dollars) | Third Quarter 2022 | Third Quarter 2021 | $ Change | % Change | ||||||||||||||||||||||
| Oil and Gas | $ | 1,323 | $ | 1,088 | $ | 235 | 22 | % | ||||||||||||||||||
| Power Generation | 1,320 | 1,010 | 310 | 31 | % | |||||||||||||||||||||
| Industrial | 1,158 | 948 | 210 | 22 | % | |||||||||||||||||||||
| Transportation | 1,196 | 1,095 | 101 | 9 | % | |||||||||||||||||||||
| External Sales | 4,997 | 4,141 | 856 | 21 | % | |||||||||||||||||||||
| Inter-segment | 1,189 | 936 | 253 | 27 | % | |||||||||||||||||||||
| Total Sales | $ | 6,186 | $ | 5,077 | $ | 1,109 | 22 | % | ||||||||||||||||||
Energy & Transportation’s total sales were $6.186 billion in the third quarter of 2022, an increase of $1.109 billion, or 22 percent, compared with $5.077 billion in the third quarter of 2021. Sales increased across all applications and inter-segment sales. The increase in sales was primarily due to higher sales volume and favorable price realization, partially offset by unfavorable currency impacts.
-
Oil and Gas – Sales increased due to higher sales of reciprocating engine aftermarket parts and engines used in gas compression and well servicing applications. Turbines and turbine-related services were about flat.
-
Power Generation – Sales increased in large reciprocating engines, primarily data center applications, and small reciprocating engines. Turbines and turbine-related services increased as well.
-
Industrial – Sales were up across all regions.
-
Transportation – Sales increased in reciprocating engine aftermarket parts and marine applications. International locomotive deliveries were also higher.
Energy & Transportation’s profit was $935 million in the third quarter of 2022, an increase of $229 million, or 32 percent, compared with $706 million in the third quarter of 2021. The increase was driven by favorable price realization and higher sales volume, partially offset by unfavorable manufacturing costs and higher SG&A/R&D expenses. Unfavorable manufacturing costs largely reflected higher material costs, freight and the impact of manufacturing inefficiencies. The increase in SG&A/R&D expenses was primarily driven by investments aligned with strategic initiatives, including electrification and services growth, higher labor-related costs and higher short-term incentive compensation expense.
Energy & Transportation’s profit as a percent of total sales was 15.1 percent in the third quarter of 2022, compared with 13.9 percent in the third quarter of 2021.
Energy & Transportation's segment profit as a percent of total sales is expected to improve in the fourth quarter of 2022, compared to the fourth quarter of 2021. In Oil & Gas, we are encouraged by continued strength in reciprocating engine orders, especially for large engine repowers as asset utilization increases. New equipment orders for turbine and turbine–related services strengthened significantly, particularly in Oil & Gas. Power Generation orders remain healthy due to positive industry dynamics and continued data center strength. Industrial remains healthy with continued momentum in construction, agriculture and electric power. We also anticipate growth in high-speed marine as customers continue to upgrade aging fleets. We also expect favorable price realization in the fourth quarter of 2022, compared to the fourth quarter of 2021. The favorable impact from price realization is expected to more than offset manufacturing cost increases in the fourth quarter of 2022.
Financial Products Segment
Financial Products’ segment revenues were $819 million in the third quarter of 2022, an increase of $57 million, or 7 percent, compared with $762 million in the third quarter of 2021. The increase was primarily due to higher average financing rates in North America and Latin America.
Financial Products’ segment profit was $220 million in the third quarter of 2022, an increase of $47 million, or 27 percent, compared with $173 million in the third quarter of 2021. The increase was mainly due to a favorable impact from a lower provision for credit losses at Cat Financial, partially offset by mark-to-market adjustments on derivative contracts.
At the end of the third quarter of 2022, past dues at Cat Financial were 2.00 percent, compared with 2.41 percent at the end of the third quarter of 2021. Past dues decreased across all our portfolio segments, with the exception of an increase in Latin America. Write-offs, net of recoveries, were $13 million for the third quarter of 2022, compared with $76 million for the third quarter of 2021. As of September 30, 2022, Cat Financial's allowance for credit losses totaled $339 million, or 1.30 percent of finance receivables, compared with $376 million, or 1.41 percent of finance receivables, at June 30, 2022. The allowance for credit losses at year-end 2021 was $337 million, or 1.22 percent of finance receivables.
Corporate Items and Eliminations
Expense for corporate items and eliminations was $343 million in the third quarter of 2022, an increase of $50 million from the third quarter of 2021, primarily driven by increased expenses due to timing differences, partially offset by favorable impacts of segment reporting methodology differences and lower corporate costs.
NINE MONTHS ENDED SEPTEMBER 30, 2022 COMPARED WITH NINE MONTHS ENDED SEPTEMBER 30, 2021
CONSOLIDATED SALES AND REVENUES
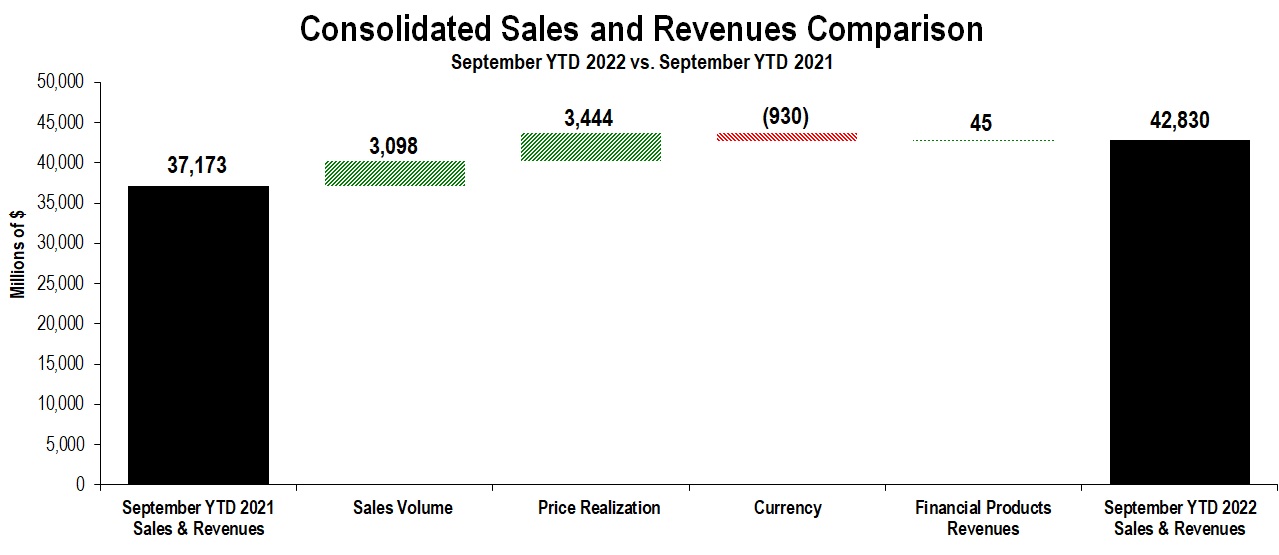
The chart above graphically illustrates reasons for the change in consolidated sales and revenues between the nine months ended September 30, 2021 (at left) and the nine months ended September 30, 2022 (at right). Caterpillar management utilizes these charts internally to visually communicate with the company’s Board of Directors and employees.
Total sales and revenues were $42.830 billion for the nine months ended September 30, 2022, an increase of $5.657 billion, or 15 percent, compared with $37.173 billion for the nine months ended September 30, 2021. The increase was primarily due to favorable price realization and higher sales volume, partially offset by unfavorable currency impacts related to the euro, Australian dollar and Japanese yen. The increase in sales volume was driven by the impact from changes in dealer inventories, services and higher sales of equipment to end users. Dealers increased inventories about $1.6 billion during the nine months ended September 30, 2022, compared with remaining about flat during the nine months ended September 30, 2021.
Sales were higher in the three primary segments.
North America sales increased 26 percent driven by favorable price realization, the impact from changes in dealer inventories, services and higher sales of equipment to end users. Dealers decreased inventories during the nine months ended September 30, 2021, compared with an increase during the nine months ended September 30, 2022.
Sales increased 30 percent in Latin America due to favorable price realization, higher sales of equipment to end users and the impact from changes in dealer inventories. Dealers increased inventories more during the nine months ended September 30, 2022, than during the nine months ended September 30, 2021.
EAME sales increased 6 percent due to favorable price realization, higher sales of equipment to end users and the impact from changes in dealer inventories, partially offset by unfavorable currency impacts related to the euro and British pound. Dealers increased inventories more during the nine months ended September 30, 2022, than during the nine months ended September 30, 2021.
Asia/Pacific sales increased 3 percent driven by favorable price realization, services and the impact from changes in dealer inventories, partially offset by lower sales of equipment to end users and unfavorable currency impacts related to the Australian dollar and Japanese yen. Dealers increased inventories during the nine months ended September 30, 2022, compared with a decrease during the nine months ended September 30, 2021.
Dealers increased inventories about $1.6 billion during the nine months ended September 30, 2022, compared with remaining about flat during the nine months ended September 30, 2021. Dealers are independent, and the reasons for changes in their inventory levels vary, including their expectations of future demand and product delivery times. Dealers’ demand expectations take into account seasonal changes, macroeconomic conditions, machine rentals and other factors. Delivery times can vary based on availability of product from Caterpillar factories and product distribution centers.
| Sales and Revenues by Segment | |||||||||||||||||||||||||||||||||||||||||||||||
| (Millions of dollars) | Nine Months Ended September 30, 2021 | Sales Volume | Price Realization | Currency | Inter-Segment / Other | Nine Months Ended September 30, 2022 | $ Change | % Change | |||||||||||||||||||||||||||||||||||||||
| Construction Industries | $ | 16,370 | $ | 723 | $ | 1,737 | $ | (452) | $ | 46 | $ | 18,424 | $ | 2,054 | 13 | % | |||||||||||||||||||||||||||||||
| Resource Industries | 7,091 | 1,005 | 929 | (126) | (21) | 8,878 | 1,787 | 25 | % | ||||||||||||||||||||||||||||||||||||||
| Energy & Transportation | 14,559 | 1,314 | 784 | (348) | 620 | 16,929 | 2,370 | 16 | % | ||||||||||||||||||||||||||||||||||||||
| All Other Segment | 377 | 8 | 1 | (4) | (43) | 339 | (38) | (10 | %) | ||||||||||||||||||||||||||||||||||||||
| Corporate Items and Eliminations | (3,306) | 48 | (7) | — | (602) | (3,867) | (561) | ||||||||||||||||||||||||||||||||||||||||
| Machinery, Energy & Transportation Sales | 35,091 | 3,098 | 3,444 | (930) | — | 40,703 | 5,612 | 16 | % | ||||||||||||||||||||||||||||||||||||||
| Financial Products Segment | 2,297 | — | — | — | 103 | 2,400 | 103 | 4 | % | ||||||||||||||||||||||||||||||||||||||
| Corporate Items and Eliminations | (215) | — | — | — | (58) | (273) | (58) | ||||||||||||||||||||||||||||||||||||||||
| Financial Products Revenues | 2,082 | — | — | — | 45 | 2,127 | 45 | 2 | % | ||||||||||||||||||||||||||||||||||||||
| Consolidated Sales and Revenues | $ | 37,173 | $ | 3,098 | $ | 3,444 | $ | (930) | $ | 45 | $ | 42,830 | $ | 5,657 | 15 | % | |||||||||||||||||||||||||||||||
| Sales and Revenues by Geographic Region |
| North America | Latin America | EAME | Asia/Pacific | External Sales and Revenues | Inter-Segment | Total Sales and Revenues | |||||||||||||||||||||||||||||||||||||||||||||||||||||||||||||||||||||||||||||
| (Millions of dollars) | $ | % Chg | $ | % Chg | $ | % Chg | $ | % Chg | $ | % Chg | $ | % Chg | $ | % Chg | |||||||||||||||||||||||||||||||||||||||||||||||||||||||||||||||||||||
| Nine Months Ended September 30, 2022 | |||||||||||||||||||||||||||||||||||||||||||||||||||||||||||||||||||||||||||||||||||
| Construction Industries | $ | 8,832 | 25 | % | $ | 2,061 | 53 | % | $ | 3,726 | 3 | % | $ | 3,694 | (14 | %) | $ | 18,313 | 12 | % | $ | 111 | 71 | % | $ | 18,424 | 13 | % | |||||||||||||||||||||||||||||||||||||||||||||||||||||||
| Resource Industries | 3,167 | 49 | % | 1,337 | 2 | % | 1,609 | 11 | % | 2,554 | 30 | % | 8,667 | 26 | % | 211 | (9 | %) | 8,878 | 25 | % | ||||||||||||||||||||||||||||||||||||||||||||||||||||||||||||||
| Energy & Transportation | 6,637 | 16 | % | 1,160 | 39 | % | 3,679 | 7 | % | 2,193 | 12 | % | 13,669 | 15 | % | 3,260 | 23 | % | 16,929 | 16 | % | ||||||||||||||||||||||||||||||||||||||||||||||||||||||||||||||
| All Other Segment | 52 | 24 | % | — | (100 | %) | 14 | 40 | % | 46 | (15 | %) | 112 | 5 | % | 227 | (16 | %) | 339 | (10 | %) | ||||||||||||||||||||||||||||||||||||||||||||||||||||||||||||||
| Corporate Items and Eliminations | (43) | (1) | (2) | (12) | (58) | (3,809) | (3,867) | ||||||||||||||||||||||||||||||||||||||||||||||||||||||||||||||||||||||||||||
| Machinery, Energy & Transportation Sales | 18,645 | 26 | % | 4,557 | 30 | % | 9,026 | 6 | % | 8,475 | 3 | % | 40,703 | 16 | % | — | — | % | 40,703 | 16 | % | ||||||||||||||||||||||||||||||||||||||||||||||||||||||||||||||
| Financial Products Segment | 1,530 | 6 | % | 250 | 28 | % | 293 | (3 | %) | 327 | (9 | %) | 2,400 | 1 | 4 | % | — | — | % | 2,400 | 4 | % | |||||||||||||||||||||||||||||||||||||||||||||||||||||||||||||
| Corporate Items and Eliminations | (132) | (58) | (31) | (52) | (273) | — | (273) | ||||||||||||||||||||||||||||||||||||||||||||||||||||||||||||||||||||||||||||
| Financial Products Revenues | 1,398 | 4 | % | 192 | 20 | % | 262 | (5 | %) | 275 | (10 | %) | 2,127 | 2 | % | — | — | % | 2,127 | 2 | % | ||||||||||||||||||||||||||||||||||||||||||||||||||||||||||||||
| Consolidated Sales and Revenues | $ | 20,043 | 24 | % | $ | 4,749 | 30 | % | $ | 9,288 | 6 | % | $ | 8,750 | 2 | % | $ | 42,830 | 15 | % | $ | — | — | % | $ | 42,830 | 15 | % | |||||||||||||||||||||||||||||||||||||||||||||||||||||||
| Nine Months Ended September 30, 2021 | |||||||||||||||||||||||||||||||||||||||||||||||||||||||||||||||||||||||||||||||||||
| Construction Industries | $ | 7,041 | $ | 1,350 | $ | 3,612 | $ | 4,302 | $ | 16,305 | $ | 65 | $ | 16,370 | |||||||||||||||||||||||||||||||||||||||||||||||||||||||||||||||||||||
| Resource Industries | 2,130 | 1,309 | 1,455 | 1,965 | 6,859 | 232 | 7,091 | ||||||||||||||||||||||||||||||||||||||||||||||||||||||||||||||||||||||||||||
| Energy & Transportation | 5,698 | 835 | 3,433 | 1,953 | 11,919 | 2,640 | 14,559 | ||||||||||||||||||||||||||||||||||||||||||||||||||||||||||||||||||||||||||||
| All Other Segment | 42 | 1 | 10 | 54 | 107 | 270 | 377 | ||||||||||||||||||||||||||||||||||||||||||||||||||||||||||||||||||||||||||||
| Corporate Items and Eliminations | (89) | (1) | (1) | (8) | (99) | (3,207) | (3,306) | ||||||||||||||||||||||||||||||||||||||||||||||||||||||||||||||||||||||||||||
| Machinery, Energy & Transportation Sales | 14,822 | 3,494 | 8,509 | 8,266 | 35,091 | — | 35,091 | ||||||||||||||||||||||||||||||||||||||||||||||||||||||||||||||||||||||||||||
| Financial Products Segment | 1,442 | 195 | 301 | 359 | 2,297 | 1 | — | 2,297 | |||||||||||||||||||||||||||||||||||||||||||||||||||||||||||||||||||||||||||
| Corporate Items and Eliminations | (99) | (35) | (26) | (55) | (215) | — | (215) | ||||||||||||||||||||||||||||||||||||||||||||||||||||||||||||||||||||||||||||
| Financial Products Revenues | 1,343 | 160 | 275 | 304 | 2,082 | — | 2,082 | ||||||||||||||||||||||||||||||||||||||||||||||||||||||||||||||||||||||||||||
| Consolidated Sales and Revenues | $ | 16,165 | $ | 3,654 | $ | 8,784 | $ | 8,570 | $ | 37,173 | $ | — | $ | 37,173 |
1 Includes revenues from Machinery, Energy & Transportation of $332 million and $263 million in the nine months ended September 30, 2022 and 2021, respectively.
CONSOLIDATED OPERATING PROFIT
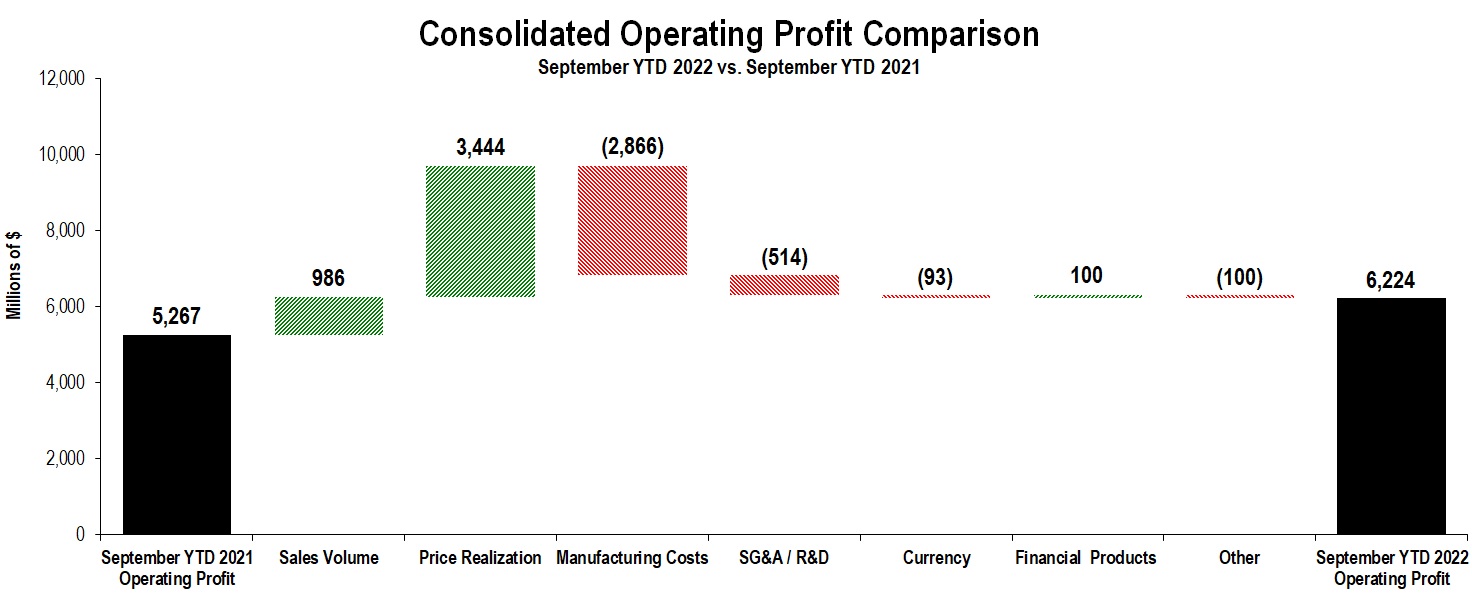
The chart above graphically illustrates reasons for the change in consolidated operating profit between the nine months ended September 30, 2021 (at left) and the nine months ended September 30, 2022 (at right). Caterpillar management utilizes these charts internally to visually communicate with the company’s Board of Directors and employees. The bar titled Other includes consolidating adjustments and Machinery, Energy & Transportation’s other operating (income) expenses.
Operating profit for the nine months ended September 30, 2022, was $6.224 billion, an increase of $957 million, or 18 percent, compared with $5.267 billion for the nine months ended September 30, 2021. The increase was due to favorable price realization and higher sales volume, partially offset by unfavorable manufacturing costs and higher SG&A/R&D expenses.
Unfavorable manufacturing costs largely reflected higher material costs, freight and the impact of manufacturing inefficiencies. For 2022, price realization is expected to more than offset manufacturing cost increases. The increase in SG&A/R&D expenses was driven by investments aligned with the company's strategy for profitable growth, which included services growth and technology, such as digital, electrification and autonomy, as well as higher short-term incentive compensation expense.
Short-term incentive compensation expense is directly related to financial and operational performance, measured against targets set annually. Expense for the nine months ended September 30, 2022, was about $1.2 billion, compared with about $1.1 billion for the nine months ended September 30, 2021. For 2022, short-term incentive compensation expense is expected to be about $1.6 billion, compared with $1.3 billion in 2021.
Operating profit margin was 14.5 percent for the nine months ended September 30, 2022, compared with 14.2 percent for the nine months ended September 30, 2021.
| Profit (Loss) by Segment | |||||||||||||||||||||||
| (Millions of dollars) | Nine Months Ended September 30, 2022 | Nine Months Ended September 30, 2021 | $ Change | % Change | |||||||||||||||||||
| Construction Industries | $ | 3,255 | $ | 2,937 | $ | 318 | 11 | % | |||||||||||||||
| Resource Industries | 1,222 | 941 | 281 | 30 | % | ||||||||||||||||||
| Energy & Transportation | 2,132 | 2,119 | 13 | 1 | % | ||||||||||||||||||
| All Other Segment | 42 | (2) | 44 | n/a | |||||||||||||||||||
| Corporate Items and Eliminations | (847) | (1,107) | 260 | ||||||||||||||||||||
| Machinery, Energy & Transportation | 5,804 | 4,888 | 916 | 19 | % | ||||||||||||||||||
| Financial Products Segment | 675 | 660 | 15 | 2 | % | ||||||||||||||||||
| Corporate Items and Eliminations | 30 | (55) | 85 | ||||||||||||||||||||
| Financial Products | 705 | 605 | 100 | 17 | % | ||||||||||||||||||
| Consolidating Adjustments | (285) | (226) | (59) | ||||||||||||||||||||
| Consolidated Operating Profit | $ | 6,224 | $ | 5,267 | $ | 957 | 18 | % | |||||||||||||||
| Corporate Items and Eliminations included corporate-level expenses, timing differences (as some expenses are reported in segment profit on a cash basis), methodology differences between segment and consolidated external reporting (the company values segment inventories and cost of sales using a current cost methodology), certain restructuring costs and inter-segment eliminations. | |||||||||||||||||||||||
Other Profit/Loss and Tax Items
▪Interest expense excluding Financial Products for the nine months ended September 30, 2022, was $326 million, compared with $376 million for the nine months ended September 30, 2021. The decrease was due to lower average debt outstanding during the nine months ended September 30, 2022, compared with the nine months ended September 30, 2021.
▪Other income (expense) for the nine months ended September 30, 2022, was income of $755 million, about flat compared with income of $751 million for the nine months September 30, 2021. Favorable impacts from foreign currency exchange were offset by unrealized losses on marketable securities and lower pension and OPEB income.
▪The provision for income taxes for the nine months ended September 30, 2022, reflected an estimated annual tax rate of 23 percent, compared with 25 percent for the nine months ended September 30, 2021, excluding the discrete items discussed below. The comparative tax rate for full-year 2021 was approximately 23 percent.
On September 8, 2022, the company reached a settlement with the U.S. Internal Revenue Service (IRS) that resolves all issues for tax years 2007 through 2016, without any penalties. The company’s settlement includes, among other issues, the resolution of disputed tax treatment of profits earned by Caterpillar SARL (CSARL) from certain parts transactions. We vigorously contested the IRS’s application of the “substance-over-form” or “assignment-of-income” judicial doctrines and its proposed increases to tax and imposition of accuracy related penalties. The settlement does not include any increases to tax in the United States based on those judicial doctrines and does not include any penalties. The final tax assessed by the IRS for all issues under the settlement was $490 million for the ten-year period. This amount was primarily paid in the nine months ending September 30, 2022, and the associated estimated interest of $250 million is expected to be paid by the end of 2022. The settlement was within the total amount of gross unrecognized tax benefits for uncertain tax positions and enables us to avoid the costs and burdens of further disputes with the IRS. As a result of the settlement, we recorded a discrete tax benefit of $41 million to reflect changes in estimates of prior years’ taxes and related interest, net of tax. We are subject to the continuous examination of our income tax returns by the IRS, and tax years subsequent to 2016 are not yet under examination.
In the nine months ended September 30, 2022, the company also recorded discrete tax benefits of $49 million to reflect other changes in estimates related to prior years’ U.S. taxes, compared to $36 million in the nine months ended September 30, 2021. In addition, the company recorded a discrete tax benefit of $18 million for the settlement of stock-based compensation awards with associated tax deductions in excess of cumulative U.S. GAAP compensation expense, compared with a $61 million benefit for the nine months ended September 30, 2021.
Construction Industries
Construction Industries’ total sales were $18.424 billion for the nine months ended September 30, 2022, an increase of $2.054 billion, or 13 percent, compared with $16.370 billion for the nine months ended September 30, 2021. The increase was due to favorable price realization and higher sales volume, partially offset by unfavorable currency impacts related to the euro, Japanese yen and Australian dollar. The increase in sales volume was driven by the impact from changes in dealer inventories and higher sales of aftermarket parts, partially offset by lower sales of equipment to end users. Dealers increased inventories more during the nine months ended September 30, 2022, than during the nine months ended September 30, 2021.
-
In North America, sales increased due to favorable price realization, the impact from changes in dealer inventories, higher sales of aftermarket parts and higher sales of equipment to end users. Dealers decreased inventories during the nine months ended September 30, 2021, compared with an increase during the nine months ended September 30, 2022.
-
Sales increased in Latin America primarily due to higher sales of equipment to end users and favorable price realization.
-
In EAME, sales increased as unfavorable currency impacts related to the euro were more than offset by favorable price realization and the impact from changes in dealer inventories. Dealers increased inventories more during the nine months ended September 30, 2022, than during the nine months ended September 30, 2021.
-
Sales decreased in Asia/Pacific due to lower sales of equipment to end users and unfavorable currency impacts related to the Japanese yen and Australian dollar, partially offset by favorable price realization and the impact from changes in dealer inventories. Dealers increased inventories during the nine months ended September 30, 2022, compared with a decrease during the nine months ended September 30, 2021.
Construction Industries’ profit was $3.255 billion for the nine months ended September 30, 2022, an increase of $318 million, or 11 percent, compared with $2.937 billion for the nine months ended September 30, 2021. The increase was mainly due to favorable price realization and higher sales volume, partially offset by unfavorable manufacturing costs and higher SG&A/R&D expenses. Unfavorable manufacturing costs largely reflected higher material costs, freight and the impact of manufacturing inefficiencies. The increase in SG&A/R&D expenses was primarily driven by investments aligned with strategic initiatives and higher short-term incentive compensation expense.
Construction Industries’ profit as a percent of total sales was 17.7 percent for the nine months ended September 30, 2022, compared with 17.9 percent for the nine months ended September 30, 2021.
Resource Industries
Resource Industries’ total sales were $8.878 billion for the nine months ended September 30, 2022, an increase of $1.787 billion, or 25 percent, compared with $7.091 billion for the nine months ended September 30, 2021. The increase was due to higher sales volume and favorable price realization. The increase in sales volume was driven by higher sales of aftermarket parts, the impact from changes in dealer inventories and higher sales of equipment to end users. Dealer inventory increased during the nine months ended September 30, 2022, compared with a decrease during the nine months ended September 30, 2021.
Resource Industries’ profit was $1.222 billion for the nine months ended September 30, 2022, an increase of $281 million, or 30 percent, compared with $941 million for the nine months ended September 30, 2021. Unfavorable manufacturing costs and higher SG&A/R&D expenses were more than offset by favorable price realization and higher sales volume. Unfavorable manufacturing costs largely reflected higher material costs, freight and the impact of manufacturing inefficiencies. The increase in SG&A/R&D expenses was primarily driven by investments aligned with strategic initiatives.
Resource Industries’ profit as a percent of total sales was 13.8 percent for the nine months ended September 30, 2022, compared with 13.3 percent for the nine months ended September 30, 2021.
Energy & Transportation
| Sales by Application | ||||||||||||||||||||||||||
| (Millions of dollars) | Nine Months Ended September 30, 2022 | Nine Months Ended September 30, 2021 | $ Change | % Change | ||||||||||||||||||||||
| Oil and Gas | $ | 3,503 | $ | 3,140 | $ | 363 | 12 | % | ||||||||||||||||||
| Power Generation | 3,518 | 3,025 | 493 | 16 | % | |||||||||||||||||||||
| Industrial | 3,295 | 2,660 | 635 | 24 | % | |||||||||||||||||||||
| Transportation | 3,353 | 3,094 | 259 | 8 | % | |||||||||||||||||||||
| External Sales | 13,669 | 11,919 | 1,750 | 15 | % | |||||||||||||||||||||
| Inter-Segment | 3,260 | 2,640 | 620 | 23 | % | |||||||||||||||||||||
| Total Sales | $ | 16,929 | $ | 14,559 | $ | 2,370 | 16 | % | ||||||||||||||||||
Energy & Transportation’s total sales were $16.929 billion for the nine months ended September 30, 2022, an increase of $2.370 billion, or 16 percent, compared with $14.559 billion for the nine months ended September 30, 2021. Sales increased across all applications and inter-segment sales. The increase in sales was primarily due to higher sales volume and favorable price realization, partially offset by unfavorable currency impacts.
-
Oil and Gas – Sales increased due to higher sales of reciprocating engine aftermarket parts and engines used in well servicing and gas compression applications, primarily in North America, partially offset by lower sales for turbines and turbine-related services.
-
Power Generation – Sales increased in small reciprocating engine applications, reciprocating engine aftermarket parts and turbines and turbine-related services.
-
Industrial – Sales were up across all regions.
-
Transportation – Sales increased primarily in reciprocating engine aftermarket parts and marine applications. Rail services and international locomotives deliveries were also higher.
Energy & Transportation’s profit was $2.132 billion for the nine months ended September 30, 2022, about flat compared with $2.119 billion for the nine months ended September 30, 2021. Unfavorable manufacturing costs and higher SG&A/R&D expenses were offset by favorable price realization and higher sales volume. Unfavorable manufacturing costs largely reflected higher material costs, freight and the impact of manufacturing inefficiencies. The increase in SG&A/R&D expenses was primarily driven by investments aligned with strategic initiatives and higher short-term incentive compensation expense.
Energy & Transportation’s profit as a percent of total sales was 12.6 percent for the nine months ended September 30, 2022, compared with 14.6 percent for the nine months ended September 30, 2021.
Financial Products Segment
Financial Products’ segment revenues were $2.400 billion for the nine months ended September 30, 2022, an increase of $103 million, or 4 percent, compared with $2.297 billion for the nine months ended September 30, 2021. The increase was primarily due to a favorable impact from returned or repossessed equipment in North America and higher average financing rates in Latin America.
Financial Products’ segment profit was $675 million for the nine months ended September 30, 2022, an increase of $15 million, or 2 percent, compared with $660 million for the nine months ended September 30, 2021. The increase was mainly due to a favorable impact from returned or repossessed equipment and lower provision for credit losses at Cat Financial, partially offset by an unfavorable impact from equity securities in Insurance Services and an increase in SG&A expenses.
Corporate Items and Eliminations
Expense for corporate items and eliminations was $817 million for the nine months ended September 30, 2022, a decrease of $345 million from the nine months ended September 30, 2021, primarily driven by favorable impacts of segment reporting methodology, a favorable change in fair value adjustments related to deferred compensation plans and lower expenses due to timing differences, partially offset by higher corporate costs.
RESTRUCTURING COSTS
In 2022, we expect to incur about $800 million of restructuring costs primarily related to strategic actions to address a small number of products. Approximately $600 million of the total is a non-cash charge related to the release of accumulated foreign currency translation losses that will be recognized upon the sale of a business containing some of these products, which may not occur until 2023. We expect that prior restructuring actions will result in an incremental benefit to operating costs, primarily Cost of goods sold and SG&A expenses of about $75 million in 2022 compared with 2021.
Additional information related to restructuring costs is included in Note 20 - "Restructuring Costs" of Part I, Item 1 "Financial Statements".
GLOSSARY OF TERMS
1.Adjusted Operating Profit Margin – Operating profit excluding restructuring costs as a percent of sales and revenues.
2.Adjusted Profit Per Share – Profit per share excluding restructuring costs.
3.All Other Segment – Primarily includes activities such as: business strategy; product management and development; manufacturing and sourcing of filters and fluids, undercarriage, ground-engaging tools, fluid transfer products, precision seals, rubber sealing and connecting components primarily for Cat® products; parts distribution; integrated logistics solutions; distribution services responsible for dealer development and administration, including a wholly owned dealer in Japan; dealer portfolio management and ensuring the most efficient and effective distribution of machines, engines and parts; brand management and marketing strategy; and digital investments for new customer and dealer solutions that integrate data analytics with state-of-the-art digital technologies while transforming the buying experience.
4.Consolidating Adjustments – Elimination of transactions between Machinery, Energy & Transportation and Financial Products.
5.Construction Industries – A segment primarily responsible for supporting customers using machinery in infrastructure and building construction applications. Responsibilities include business strategy, product design, product management and development, manufacturing, marketing and sales and product support. The product portfolio includes asphalt pavers; backhoe loaders; compactors; cold planers; compact track and multi-terrain loaders; mini, small, medium and large track excavators; forestry machines; material handlers; motor graders; pipelayers; road reclaimers; skid steer loaders; telehandlers; small and medium track-type tractors; track-type loaders; wheel excavators; compact, small and medium wheel loaders; and related parts and work tools.
6.Corporate Items and Eliminations – Includes corporate-level expenses, timing differences (as some expenses are reported in segment profit on a cash basis), methodology differences between segment and consolidated external reporting, certain restructuring costs and inter-segment eliminations.
7.Currency – With respect to sales and revenues, currency represents the translation impact on sales resulting from changes in foreign currency exchange rates versus the U.S. dollar. With respect to operating profit, currency represents the net translation impact on sales and operating costs resulting from changes in foreign currency exchange rates versus the U.S. dollar. Currency only includes the impact on sales and operating profit for the Machinery, Energy & Transportation line of business; currency impacts on Financial Products revenues and operating profit are included in the Financial Products portions of the respective analyses. With respect to other income/expense, currency represents the effects of forward and option contracts entered into by the company to reduce the risk of fluctuations in exchange rates (hedging) and the net effect of changes in foreign currency exchange rates on our foreign currency assets and liabilities for consolidated results (translation).
8.Dealer Inventories – Represents dealer machine and engine inventories, excluding aftermarket parts.
9.EAME – A geographic region including Europe, Africa, the Middle East and the Commonwealth of Independent States (CIS).
10.Earning Assets – Assets consisting primarily of total finance receivables net of unearned income, plus equipment on operating leases, less accumulated depreciation at Cat Financial.
11.Energy & Transportation – A segment primarily responsible for supporting customers using reciprocating engines, turbines, diesel-electric locomotives and related services across industries serving Oil and Gas, Power Generation, Industrial and Transportation applications, including marine- and rail-related businesses. Responsibilities include business strategy, product design, product management, development and testing manufacturing, marketing and sales and product support. The product and services portfolio includes turbines, centrifugal gas compressors, and turbine-related services; reciprocating engine-powered generator sets; integrated systems and solutions used in the electric power generation industry; reciprocating engines, drivetrain and integrated systems and solutions for the marine and oil and gas industries; reciprocating engines, drivetrain and integrated systems and solutions supplied to the industrial industry as well as Cat machinery; electrified powertrain and zero-emission power sources and service solutions development; and diesel-electric locomotives and components and other rail-related products and services, including remanufacturing and leasing. Responsibilities also include the remanufacturing of Caterpillar reciprocating engines and components and remanufacturing services for other companies; and product support of on-highway vocational trucks for North America.
12.Financial Products – The company defines Financial Products as our finance and insurance subsidiaries, primarily Caterpillar Financial Services Corporation (Cat Financial) and Caterpillar Insurance Holdings Inc. (Insurance Services). Financial Products’ information relates to the financing to customers and dealers for the purchase and lease of Caterpillar and other equipment.
13.Financial Products Segment – Provides financing alternatives to customers and dealers around the world for Caterpillar products and services, as well as financing for vehicles, power generation facilities and marine vessels that, in most cases, incorporate Caterpillar products. Financing plans include operating and finance leases, installment sale contracts, repair/rebuild financing, working capital loans and wholesale financing plans. The segment also provides insurance and risk management products and services that help customers and dealers manage their business risk. Insurance and risk management products offered include physical damage insurance, inventory protection plans, extended service coverage and maintenance plans for machines and engines, and dealer property and casualty insurance. The various forms of financing, insurance and risk management products offered to customers and dealers help support the purchase and lease of Caterpillar equipment. The segment also earns revenues from Machinery, Energy & Transportation, but the related costs are not allocated to operating segments. Financial Products’ segment profit is determined on a pretax basis and includes other income/expense items.
14.Latin America – A geographic region including Central and South American countries and Mexico.
15.Machinery, Energy & Transportation (ME&T) – The company defines ME&T as Caterpillar Inc. and its subsidiaries, excluding Financial Products. ME&T’s information relates to the design, manufacturing and marketing of its products.
16.Machinery, Energy & Transportation Other Operating (Income) Expenses – Comprised primarily of gains/losses on disposal of long-lived assets, gains/losses on divestitures and legal settlements and accruals.
17.Manufacturing Costs – Manufacturing costs exclude the impacts of currency and represent the volume-adjusted change for variable costs and the absolute dollar change for period manufacturing costs. Variable manufacturing costs are defined as having a direct relationship with the volume of production. This includes material costs, direct labor and other costs that vary directly with production volume, such as freight, power to operate machines and supplies that are consumed in the manufacturing process. Period manufacturing costs support production but are defined as generally not having a direct relationship to short-term changes in volume. Examples include machinery and equipment repair, depreciation on manufacturing assets, facility support, procurement, factory scheduling, manufacturing planning and operations management.
18.Mark-to-market gains/losses – Represents the net gain or loss of actual results differing from the company’s assumptions and the effects of changing assumptions for our defined benefit pension and OPEB plans. These gains and losses are immediately recognized through earnings upon the annual remeasurement in the fourth quarter, or on an interim basis as triggering events warrant remeasurement.
19.Pension and Other Postemployment Benefits (OPEB) – The company’s defined-benefit pension and postretirement benefit plans.
20.Price Realization – The impact of net price changes excluding currency and new product introductions. Price realization includes geographic mix of sales, which is the impact of changes in the relative weighting of sales prices between geographic regions.
21.Resource Industries – A segment primarily responsible for supporting customers using machinery in mining, heavy construction and quarry and aggregates. Responsibilities include business strategy, product design, product management and development, manufacturing, marketing and sales and product support. The product portfolio includes large track-type tractors; large mining trucks; hard rock vehicles; longwall miners; electric rope shovels; draglines; hydraulic shovels; rotary drills; large wheel loaders; off-highway trucks; articulated trucks; wheel tractor scrapers; wheel dozers; landfill compactors; soil compactors; select work tools; machinery components; electronics and control systems and related parts. In addition to equipment, Resource Industries also develops and sells technology products and services to provide customers fleet management, equipment management analytics, autonomous machine capabilities, safety services and mining performance solutions. Resource Industries also manages areas that provide services to other parts of the company, including strategic procurement, lean center of excellence, integrated manufacturing, research and development for hydraulic systems, automation, electronics and software for Cat machines and engines.
22.Restructuring Costs – May include costs for employee separation, long-lived asset impairments and contract terminations. These costs are included in Other operating (income) expenses except for defined-benefit plan curtailment losses and special termination benefits, which are included in Other income (expense). Restructuring costs also include other exit-related costs, which may consist of accelerated depreciation, inventory write-downs, building demolition, equipment relocation and project management costs and LIFO inventory decrement benefits from inventory liquidations at closed facilities, all of which are primarily included in Cost of goods sold.
23.Sales Volume – With respect to sales and revenues, sales volume represents the impact of changes in the quantities sold for Machinery, Energy & Transportation as well as the incremental sales impact of new product introductions, including emissions-related product updates. With respect to operating profit, sales volume represents the impact of changes in the quantities sold for Machinery, Energy & Transportation combined with product mix as well as the net operating profit impact of new product introductions, including emissions-related product updates. Product mix represents the net operating profit impact of changes in the relative weighting of Machinery, Energy & Transportation sales with respect to total sales. The impact of sales volume on segment profit includes inter-segment sales.
24.Services – Enterprise services include, but are not limited to, aftermarket parts, Financial Products revenues and other service-related revenues. Machinery, Energy & Transportation segments exclude most Financial Products revenues.
LIQUIDITY AND CAPITAL RESOURCES
Sources of funds
We generate significant capital resources from operating activities, which are the primary source of funding for our ME&T operations. Funding for these businesses is also available from commercial paper and long-term debt issuances. Financial Products’ operations are funded primarily from commercial paper, term debt issuances and collections from its existing portfolio. On a consolidated basis, we had positive operating cash flow in the first nine months of 2022 and ended the third quarter with $6.35 billion of cash, a decrease of $2.91 billion from year-end 2021. In addition, ME&T has invested in available-for-sale debt securities that are considered highly liquid and are available for current operations. These securities are included in Prepaid expenses and other current assets and Other assets in the Consolidated Statement of Financial Position and were $982 million at the end of September 30, 2022. We intend to maintain a strong cash and liquidity position.
Consolidated operating cash flow for the first nine months of 2022 was $5.03 billion, down $759 million compared to the same period a year ago. The decrease was primarily due to payments for short-term incentive compensation in the first quarter of 2022 as well as higher cash taxes paid which includes payments related to settlements with the U.S. Internal Revenue Service. Partially offsetting these items was higher profit adjusted for non-cash items during the first nine months of 2022 compared to the same period last year.
Total debt as of September 30, 2022 was $36.53 billion, a decrease of $1.26 billion from year-end 2021. Debt related to ME&T decreased $192 million in the first nine months of 2022 while debt related to Financial Products decreased $1.07 billion.
As of September 30, 2022, we had three global credit facilities with a syndicate of banks totaling $10.50 billion (Credit Facility) available in the aggregate to both Caterpillar and Cat Financial for general liquidity purposes. Based on management’s allocation decision, which can be revised from time to time, the portion of the Credit Facility available to ME&T as of September 30, 2022 was $2.75 billion. Information on our Credit Facility is as follows:
-
In September 2022, we entered into a new 364-day facility. The 364-day facility of $3.15 billion (of which $825 million is available to ME&T) expires in August 2023.
-
In September 2022, we amended and restated the three-year facility (as amended and restated, the "three-year facility"). The three-year facility of $2.73 billion (of which $715 million is available to ME&T) expires in August 2025.
-
In September 2022, we amended and restated the five-year facility (as amended and restated, the "five-year facility"). The five-year facility of $4.62 billion (of which $1.21 billion is available to ME&T) expires in September 2027.
At September 30, 2022, Caterpillar’s consolidated net worth was $15.69 billion, which was above the $9.00 billion required under the Credit Facility. The consolidated net worth is defined in the Credit Facility as the consolidated shareholders’ equity including preferred stock but excluding the pension and other postretirement benefits balance within Accumulated other comprehensive income (loss).
At September 30, 2022, Cat Financial’s covenant interest coverage ratio was 2.59 to 1. This was above the 1.15 to 1 minimum ratio calculated as (1) profit excluding income taxes, interest expense and net gain (loss) from interest rate derivatives to (2) interest expense calculated at the end of each calendar quarter for the rolling four quarter period then most recently ended, required by the Credit Facility.
In addition, at September 30, 2022, Cat Financial’s six-month covenant leverage ratio was 7.03 to 1. This was below the maximum ratio of debt to net worth of 10 to 1, calculated (1) on a monthly basis as the average of the leverage ratios determined on the last day of each of the six preceding calendar months and (2) at each December 31, required by the Credit Facility.
In the event Caterpillar or Cat Financial does not meet one or more of their respective financial covenants under the Credit Facility in the future (and are unable to obtain a consent or waiver), the syndicate of banks may terminate the commitments allocated to the party that does not meet its covenants. Additionally, in such event, certain of Cat Financial’s other lenders under other loan agreements where similar financial covenants or cross default provisions are applicable may, at their election, choose to pursue remedies under those loan agreements, including accelerating the repayment of outstanding borrowings. At September 30, 2022, there were no borrowings under the Credit Facility.
Our total credit commitments and available credit as of September 30, 2022 were:
| September 30, 2022 | |||||||||||||||||
| (Millions of dollars) | Consolidated | Machinery, Energy & Transportation | Financial Products | ||||||||||||||
| Credit lines available: | |||||||||||||||||
| Global credit facilities | $ | 10,500 | $ | 2,750 | $ | 7,750 | |||||||||||
| Other external | 3,352 | 172 | 3,180 | ||||||||||||||
| Total credit lines available | 13,852 | 2,922 | 10,930 | ||||||||||||||
| Less: Commercial paper outstanding | (3,723) | — | (3,723) | ||||||||||||||
| Less: Utilized credit | (684) | (3) | (681) | ||||||||||||||
| Available credit | $ | 9,445 | $ | 2,919 | $ | 6,526 | |||||||||||
The other external consolidated credit lines with banks as of September 30, 2022 totaled $3.35 billion. These committed and uncommitted credit lines, which may be eligible for renewal at various future dates or have no specified expiration date, are used primarily by our subsidiaries for local funding requirements. Caterpillar or Cat Financial may guarantee subsidiary borrowings under these lines.
We receive debt ratings from the major credit rating agencies. Moody’s, Fitch and S&P maintain a “mid-A” debt rating. A downgrade of our credit ratings by any of the major credit rating agencies would result in increased borrowing costs and could make access to certain credit markets more difficult. In the event economic conditions deteriorate such that access to debt markets becomes unavailable, ME&T’s operations would rely on cash flow from operations, use of existing cash balances, borrowings from Cat Financial and access to our committed credit facilities. Our Financial Products’ operations would rely on cash flow from its existing portfolio, existing cash balances, access to our committed credit facilities and other credit line facilities of Cat Financial, and potential borrowings from Caterpillar. In addition, we maintain a support agreement with Cat Financial, which requires Caterpillar to remain the sole owner of Cat Financial and may, under certain circumstances, require Caterpillar to make payments to Cat Financial should Cat Financial fail to maintain certain financial ratios.
We facilitate voluntary supply chain finance programs (the “Programs”) through participating financial institutions. The Programs are available to a wide range of suppliers and allow them the option to manage their cash flow. We are not a party to the agreements between the participating financial institutions and the suppliers in connection with the Programs. The range of payment terms we negotiate with our suppliers is consistent, irrespective of whether a supplier participates in the Programs. The amounts payable to participating financial institutions for suppliers who voluntarily participate in the Programs and included in accounts payable in the Consolidated Statement of Financial Position were $894 million and $822 million at September 30, 2022 and December 31, 2021, respectively. The amounts settled through the Programs and paid to participating financial institutions were $4.0 billion and $2.9 billion during the first nine months of 2022 and 2021, respectively. We account for payments made under the Programs, the same as our other accounts payable, as a reduction to our cash flows from operations. We do not believe that changes in the availability of supply chain financing will have a significant impact on our liquidity.
Machinery, Energy & Transportation
Net cash provided by operating activities was $3.19 billion in the first nine months of 2022, compared with net cash provided of $4.90 billion for the same period in 2021. The decrease was primarily due to payments for short-term incentive compensation in the first quarter of 2022, higher payments for taxes which includes payments related to settlements with the U.S. Internal Revenue Service and increased working capital requirements during the first nine months of 2022 compared to the same period last year. Within working capital, changes in inventory, accounts payable and accrued expenses unfavorably impacted cash flow but were partially offset by favorable changes in customer advances and accounts receivable. Partially offsetting these unfavorable items was higher profit adjusted for non-cash items during the first nine months of 2022 compared to the same period a year ago.
Net cash used by investing activities in the first nine months of 2022 was $881 million, compared with net cash used of $487 million in the first nine months of 2021. The change was primarily due to decreased activity related to intercompany lending with Financial Products and was partially offset by decreases in net investment activity.
Net cash used for financing activities during the first nine months of 2022 was $5.29 billion, compared with net cash used of $4.67 billion in the same period of 2021. The change was primarily due to higher share repurchases in the first nine months of 2022 and the absence of proceeds from debt issuances which occurred in the first nine months of 2021. These items were partially offset by lower repayments of maturing debt during the first nine months of 2022.
While our short-term priorities for the use of cash may vary from time to time as business needs and conditions dictate, our long-term cash deployment strategy is focused on the following priorities. Our top priority is to maintain a strong financial position in support of a mid-A rating. Next, we intend to fund operational requirements and commitments. Then, we intend to fund priorities that profitably grow the company and return capital to shareholders through dividend growth and share repurchases. Additional information on cash deployment is as follows:
Strong financial position – Our top priority is to maintain a strong financial position in support of a mid-A rating. We track a diverse group of financial metrics that focus on liquidity, leverage, cash flow and margins which align with our cash deployment actions and the various methodologies used by the major credit rating agencies.
Operational excellence and commitments – Capital expenditures were $880 million during the first nine months of 2022, compared to $693 million for the same period in 2021. We expect ME&T’s capital expenditures in 2022 to be about $1.4 billion. We made $299 million of contributions to our pension and other postretirement benefit plans during the first nine months of 2022. We currently anticipate full-year 2022 contributions of approximately $357 million. In comparison, we made $229 million of contributions to our pension and other postretirement benefit plans during the first nine months of 2021.
Fund strategic growth initiatives and return capital to shareholders – We intend to utilize our liquidity and debt capacity to fund targeted investments that drive long-term profitable growth focused in the areas of expanded offerings and services, including acquisitions.
As part of our capital allocation strategy, ME&T free cash flow is a liquidity measure we use to determine the cash generated and available for financing activities including debt repayments, dividends and share repurchases. We define ME&T free cash flow as cash from ME&T operations less capital expenditures, excluding discretionary pension and other postretirement benefit plan contributions and cash payments related to settlements with the U.S. Internal Revenue Service. A goal of our capital allocation strategy is to return substantially all ME&T free cash flow to shareholders over time in the form of dividends and share repurchases, while maintaining our mid-A rating.
Our share repurchase plans are subject to the company’s cash deployment priorities and are evaluated on an ongoing basis considering the financial condition of the company and the economic outlook, corporate cash flow, the company’s liquidity needs, and the health and stability of global credit markets. The timing and amount of future repurchases may vary depending on market conditions and investing priorities. In July 2018, the Board approved a repurchase authorization (the 2018 Authorization) of up to $10.0 billion of Caterpillar common stock effective January 1, 2019, with no expiration. In May 2022, the Board approved a new share repurchase authorization (the 2022 Authorization) of up to $15.0 billion of Caterpillar common stock effective August 1, 2022, with no expiration. Utilization of the 2022 Authorization for all share repurchases commenced on August 1, 2022, leaving $70 million unutilized under the 2018 Authorization as of September 30, 2022. In the first nine months of 2022, we repurchased $3.31 billion of Caterpillar common stock, with $13.7 billion remaining under the 2022 Authorization as of September 30, 2022. Our basic shares outstanding as of September 30, 2022 were approximately 520 million.
Each quarter, our Board of Directors reviews the company’s dividend for the applicable quarter. The Board evaluates the financial condition of the company and considers the economic outlook, corporate cash flow, the company’s liquidity needs, and the health and stability of global credit markets to determine whether to maintain or change the quarterly dividend. In October 2022, the Board of Directors approved maintaining our quarterly dividend representing $1.20 per share, and we continue to expect our strong financial position to support the dividend. Dividends paid totaled $1.82 billion in the first nine months of 2022.
Financial Products
Financial Products operating cash flow was $1.25 billion in the first nine months of 2022, compared with $1.10 billion for the same period a year ago. Net cash used for investing activities was $228 million for the first nine months of 2022, compared with net cash used of $468 million for the same period in 2021. The change was primarily due to portfolio related activity. Net cash used for financing activities was $872 million for the first nine months of 2022 compared with net cash used of $289 million for the same period in 2021. The change was primarily due to lower portfolio funding requirements.
Financial Products ended the third quarter of 2022 with $943 million of cash, including $142 million in Russia which is currently subject to local government restrictions that substantially limit transfer outside of the country.
RECENT ACCOUNTING PRONOUNCEMENTS
For a discussion of recent accounting pronouncements, see Part I, Item 1. Note 2 - “New accounting guidance”.
CRITICAL ACCOUNTING ESTIMATES
For a discussion of the company’s critical accounting estimates, see Part II, Item 7. Management’s Discussion and Analysis of Financial Condition and Results of Operations in our 2021 Annual Report on Form 10-K. There have been no significant changes to our critical accounting estimates since our 2021 Annual Report on Form 10-K.
OTHER MATTERS
Information related to legal proceedings appears in Note 14—Environmental and Legal Matters of Part II, Item 8 “Financial Statements and Supplementary Data.”
Retirement Benefits
We recognize mark-to-market gains and losses immediately through earnings upon the remeasurement of our pension and OPEB plans. Mark-to-market gains and losses represent the effects of actual results differing from our assumptions and the effects of changing assumptions. We will record the annual mark-to-market adjustment as of the measurement date, December 31, 2022. It is difficult to predict the December 31, 2022 adjustment amount, as it will be dependent primarily on changes in discount rates during 2022, and actual returns on plan assets differing from our expected returns for 2022.
Order Backlog
At the end of the third quarter of 2022, the dollar amount of backlog believed to be firm was approximately $30.0 billion, about $1.6 billion higher than the second quarter of 2022. The order backlog increase was primarily driven by Energy & Transportation and Construction Industries. Of the total backlog at September 30, 2022, approximately $5.7 billion was not expected to be filled in the following twelve months.
NON-GAAP FINANCIAL MEASURES
We provide the following definitions for the non-GAAP financial measures used in this report. These non-GAAP financial measures have no standardized meaning prescribed by U.S. GAAP and therefore are unlikely to be comparable to the calculation of similar measures for other companies. Management does not intend these items to be considered in isolation or as a substitute for the related GAAP measures.
We believe it is important to separately quantify the profit impact of one significant item in order for our results to be meaningful to our readers. This item consists of restructuring costs, which were incurred to generate longer-term benefits. We do not consider this item indicative of earnings from ongoing business activities and believe the non-GAAP measure provides investors with useful perspective on underlying business results and trends and aids with assessing our period-over-period results. In addition, we provide a calculation of ME&T free cash flow as we believe it is an important measure for investors to determine the cash generation available for financing activities including debt repayments, dividends and share repurchases.
Reconciliations of adjusted results to the most directly comparable GAAP measures are as follows:
| (Dollars in millions except per share data) | Operating Profit | Operating Profit Margin | Profit Before Taxes | Provision (Benefit) for Income Taxes | Effective Tax Rate | Profit | Profit per Share | |||||||||||||||||||||||||||||||||||||
| Three Months Ended September 30, 2022 - U.S. GAAP | $ | 2,425 | 16.2 | % | $ | 2,558 | $ | 527 | 20.6 | % | $ | 2,041 | $ | 3.87 | ||||||||||||||||||||||||||||||
| Restructuring costs | 49 | 0.3 | % | 49 | 9 | 18.4 | % | 40 | $ | 0.08 | ||||||||||||||||||||||||||||||||||
| Three Months Ended September 30, 2022 - Adjusted | $ | 2,474 | 16.5 | % | $ | 2,607 | $ | 536 | 20.6 | % | $ | 2,081 | $ | 3.95 | ||||||||||||||||||||||||||||||
| Three Months Ended September 30, 2021 - U.S. GAAP | $ | 1,664 | 13.4 | % | $ | 1,775 | $ | 368 | 20.7 | % | $ | 1,426 | $ | 2.60 | ||||||||||||||||||||||||||||||
| Restructuring costs | 35 | 0.3 | % | 35 | 6 | 15.0 | % | 29 | $ | 0.06 | ||||||||||||||||||||||||||||||||||
| Three Months Ended September 30, 2021 - Adjusted | $ | 1,699 | 13.7 | % | $ | 1,810 | $ | 374 | 20.7 | % | $ | 1,455 | $ | 2.66 | ||||||||||||||||||||||||||||||
| Nine Months Ended September 30, 2022- U.S. GAAP | $ | 6,224 | 14.5 | % | $ | 6,653 | $ | 1,423 | 21.4 | % | $ | 5,251 | $ | 9.85 | ||||||||||||||||||||||||||||||
| Restructuring costs | 90 | 0.2 | % | 90 | 13 | 14.0 | % | 77 | $ | 0.14 | ||||||||||||||||||||||||||||||||||
| Nine Months Ended September 30, 2022 - Adjusted | $ | 6,314 | 14.7 | % | $ | 6,743 | $ | 1,436 | 21.3 | % | $ | 5,328 | $ | 9.99 | ||||||||||||||||||||||||||||||
| Nine Months Ended September 30, 2021 - U.S. GAAP | $ | 5,267 | 14.2 | % | $ | 5,642 | $ | 1,313 | 23.3 | % | $ | 4,369 | $ | 7.94 | ||||||||||||||||||||||||||||||
| Restructuring costs | 124 | 0.3 | % | 124 | 19 | 15.0 | % | 105 | $ | 0.19 | ||||||||||||||||||||||||||||||||||
| Nine Months Ended September 30, 2021 - Adjusted | $ | 5,391 | 14.5 | % | $ | 5,766 | $ | 1,332 | 23.1 | % | $ | 4,474 | $ | 8.13 | ||||||||||||||||||||||||||||||
Reconciliations of ME&T free cash flow to the most directly comparable GAAP measure, net cash provided by operating activities are as follows:
| (Millions of dollars) | Nine Months Ended September 30 | |||||||||||||||||||
| 2022 | 2021 | |||||||||||||||||||
| ME&T net cash provided by operating activities 1 | $ | 3,191 | $ | 4,899 | ||||||||||||||||
| ME&T capital expenditures | (880) | (693) | ||||||||||||||||||
| Cash payments related to settlements with the U.S. Internal Revenue Service | 467 | — | ||||||||||||||||||
| ME&T free cash flow | $ | 2,778 | $ | 4,206 | ||||||||||||||||
| 1 See reconciliation of ME&T net cash provided by operating activities to consolidated net cash provided by operating activities on pages 73 - 74. | ||||||||||||||||||||
Supplemental Consolidating Data
We are providing supplemental consolidating data for the purpose of additional analysis. The data has been grouped as follows:
Consolidated – Caterpillar Inc. and its subsidiaries.
Machinery, Energy & Transportation – We define ME&T as it is presented in the supplemental data as Caterpillar Inc. and its subsidiaries, excluding Financial Products. ME&T’s information relates to the design, manufacturing and marketing of our products.
Financial Products – We define Financial Products as it is presented in the supplemental data as our finance and insurance subsidiaries, primarily Caterpillar Financial Services Corporation (Cat Financial) and Caterpillar Insurance Holdings Inc. (Insurance Services). Financial Products’ information relates to the financing to customers and dealers for the purchase and lease of Caterpillar and other equipment.
Consolidating Adjustments – Eliminations of transactions between ME&T and Financial Products.
The nature of the ME&T and Financial Products businesses is different, especially with regard to the financial position and cash flow items. Caterpillar management utilizes this presentation internally to highlight these differences. We believe this presentation will assist readers in understanding our business.
Pages 67 to 74 reconcile ME&T and Financial Products to Caterpillar Inc. consolidated financial information. Certain amounts for prior periods have been reclassified to conform to the current period presentation.
Caterpillar Inc.
Supplemental Data for Results of Operations
For the Three Months Ended September 30, 2022
(Unaudited)
(Millions of dollars)
| Supplemental Consolidating Data | ||||||||||||||||||||||||||
| Consolidated | Machinery, Energy & Transportation | Financial Products | Consolidating Adjustments | |||||||||||||||||||||||
| Sales and revenues: | ||||||||||||||||||||||||||
| Sales of Machinery, Energy & Transportation | $ | 14,278 | $ | 14,278 | $ | — | $ | — | ||||||||||||||||||
| Revenues of Financial Products | 716 | — | 852 | (136) | 1 | |||||||||||||||||||||
| Total sales and revenues | 14,994 | 14,278 | 852 | (136) | ||||||||||||||||||||||
| Operating costs: | ||||||||||||||||||||||||||
| Cost of goods sold | 10,202 | 10,203 | — | (1) | 2 | |||||||||||||||||||||
| Selling, general and administrative expenses | 1,401 | 1,271 | 136 | (6) | 2 | |||||||||||||||||||||
| Research and development expenses | 476 | 476 | — | — | ||||||||||||||||||||||
| Interest expense of Financial Products | 151 | — | 151 | — | ||||||||||||||||||||||
| Other operating (income) expenses | 339 | 43 | 315 | (19) | 2 | |||||||||||||||||||||
| Total operating costs | 12,569 | 11,993 | 602 | (26) | ||||||||||||||||||||||
| Operating profit | 2,425 | 2,285 | 250 | (110) | ||||||||||||||||||||||
| Interest expense excluding Financial Products | 109 | 110 | — | (1) | 3 | |||||||||||||||||||||
| Other income (expense) | 242 | 160 | (27) | 109 | 4 | |||||||||||||||||||||
| Consolidated profit before taxes | 2,558 | 2,335 | 223 | — | ||||||||||||||||||||||
| Provision (benefit) for income taxes | 527 | 464 | 63 | — | ||||||||||||||||||||||
| Profit of consolidated companies | 2,031 | 1,871 | 160 | — | ||||||||||||||||||||||
| Equity in profit (loss) of unconsolidated affiliated companies | 9 | 11 | — | (2) | 5 | |||||||||||||||||||||
| Profit of consolidated and affiliated companies | 2,040 | 1,882 | 160 | (2) | ||||||||||||||||||||||
| Less: Profit (loss) attributable to noncontrolling interests | (1) | (1) | 2 | (2) | 6 | |||||||||||||||||||||
| Profit 7 | $ | 2,041 | $ | 1,883 | $ | 158 | $ | — |
1Elimination of Financial Products’ revenues earned from ME&T.
2Elimination of net expenses recorded by ME&T paid to Financial Products.
3Elimination of interest expense recorded between Financial Products and ME&T.
4Elimination of discount recorded by ME&T on receivables sold to Financial Products and of interest earned between ME&T and Financial Products as well as dividends paid by Financial Products to ME&T.
5Elimination of equity profit (loss) earned from Financial Products’ subsidiaries partially owned by ME&T subsidiaries.
6Elimination of noncontrolling interest profit (loss) recorded by Financial Products for subsidiaries partially owned by ME&T subsidiaries.
7Profit attributable to common shareholders.
Caterpillar Inc.
Supplemental Data for Results of Operations
For the Nine Months Ended September 30, 2022
(Unaudited)
(Millions of dollars)
| Supplemental Consolidating Data | ||||||||||||||||||||||||||
| Consolidated | Machinery, Energy & Transportation | Financial Products | Consolidating Adjustments | |||||||||||||||||||||||
| Sales and revenues: | ||||||||||||||||||||||||||
| Sales of Machinery, Energy & Transportation | $ | 40,703 | $ | 40,703 | $ | — | $ | — | ||||||||||||||||||
| Revenues of Financial Products | 2,127 | — | 2,493 | (366) | 1 | |||||||||||||||||||||
| Total sales and revenues | 42,830 | 40,703 | 2,493 | (366) | ||||||||||||||||||||||
| Operating costs: | ||||||||||||||||||||||||||
| Cost of goods sold | 29,736 | 29,741 | — | (5) | 2 | |||||||||||||||||||||
| Selling, general and administrative expenses | 4,172 | 3,714 | 475 | (17) | 2 | |||||||||||||||||||||
| Research and development expenses | 1,413 | 1,413 | — | — | ||||||||||||||||||||||
| Interest expense of Financial Products | 377 | — | 377 | — | ||||||||||||||||||||||
| Other operating (income) expenses | 908 | 31 | 936 | (59) | 2 | |||||||||||||||||||||
| Total operating costs | 36,606 | 34,899 | 1,788 | (81) | ||||||||||||||||||||||
| Operating profit | 6,224 | 5,804 | 705 | (285) | ||||||||||||||||||||||
| Interest expense excluding Financial Products | 326 | 327 | — | (1) | 3 | |||||||||||||||||||||
| Other income (expense) | 755 | 497 | (26) | 284 | 4 | |||||||||||||||||||||
| Consolidated profit before taxes | 6,653 | 5,974 | 679 | — | ||||||||||||||||||||||
| Provision (benefit) for income taxes | 1,423 | 1,250 | 173 | — | ||||||||||||||||||||||
| Profit of consolidated companies | 5,230 | 4,724 | 506 | — | ||||||||||||||||||||||
| Equity in profit (loss) of unconsolidated affiliated companies | 20 | 26 | — | (6) | 5 | |||||||||||||||||||||
| Profit of consolidated and affiliated companies | 5,250 | 4,750 | 506 | (6) | ||||||||||||||||||||||
| Less: Profit (loss) attributable to noncontrolling interests | (1) | (1) | 6 | (6) | 6 | |||||||||||||||||||||
| Profit 7 | $ | 5,251 | $ | 4,751 | $ | 500 | $ | — |
1Elimination of Financial Products’ revenues earned from ME&T.
2Elimination of net expenses recorded by ME&T paid to Financial Products.
3Elimination of interest expense recorded between Financial Products and ME&T.
4Elimination of discount recorded by ME&T on receivables sold to Financial Products and of interest earned between ME&T and Financial Products as well as dividends paid by Financial Products to ME&T.
5Elimination of equity profit (loss) earned from Financial Products’ subsidiaries partially owned by ME&T subsidiaries.
6Elimination of noncontrolling interest profit (loss) recorded by Financial Products for subsidiaries partially owned by ME&T subsidiaries.
7Profit attributable to common shareholders.
Caterpillar Inc.
Supplemental Data for Results of Operations
For the Three Months Ended September 30, 2021
(Unaudited)
(Millions of dollars)
| Supplemental Consolidating Data | ||||||||||||||||||||||||||
| Consolidated | Machinery, Energy & Transportation | Financial Products | Consolidating Adjustments | |||||||||||||||||||||||
| Sales and revenues: | ||||||||||||||||||||||||||
| Sales of Machinery, Energy & Transportation | $ | 11,707 | $ | 11,707 | $ | — | $ | — | ||||||||||||||||||
| Revenues of Financial Products | 690 | — | 787 | (97) | 1 | |||||||||||||||||||||
| Total sales and revenues | 12,397 | 11,707 | 787 | (97) | ||||||||||||||||||||||
| Operating costs: | ||||||||||||||||||||||||||
| Cost of goods sold | 8,617 | 8,618 | — | (1) | 2 | |||||||||||||||||||||
| Selling, general and administrative expenses | 1,340 | 1,147 | 200 | (7) | 2 | |||||||||||||||||||||
| Research and development expenses | 427 | 427 | — | — | ||||||||||||||||||||||
| Interest expense of Financial Products | 111 | — | 111 | — | ||||||||||||||||||||||
| Other operating (income) expenses | 238 | (56) | 310 | (16) | 2 | |||||||||||||||||||||
| Total operating costs | 10,733 | 10,136 | 621 | (24) | ||||||||||||||||||||||
| Operating profit | 1,664 | 1,571 | 166 | (73) | ||||||||||||||||||||||
| Interest expense excluding Financial Products | 114 | 114 | — | — | ||||||||||||||||||||||
| Other income (expense) | 225 | 143 | 9 | 73 | 3 | |||||||||||||||||||||
| Consolidated profit before taxes | 1,775 | 1,600 | 175 | — | ||||||||||||||||||||||
| Provision (benefit) for income taxes | 368 | 331 | 37 | — | ||||||||||||||||||||||
| Profit of consolidated companies | 1,407 | 1,269 | 138 | — | ||||||||||||||||||||||
| Equity in profit (loss) of unconsolidated affiliated companies | 21 | 23 | — | (2) | 4 | |||||||||||||||||||||
| Profit of consolidated and affiliated companies | 1,428 | 1,292 | 138 | (2) | ||||||||||||||||||||||
| Less: Profit (loss) attributable to noncontrolling interests | 2 | 1 | 3 | (2) | 5 | |||||||||||||||||||||
| Profit 6 | $ | 1,426 | $ | 1,291 | $ | 135 | $ | — |
1Elimination of Financial Products’ revenues earned from ME&T.
2Elimination of net expenses recorded by ME&T paid to Financial Products.
3Elimination of discount recorded by ME&T on receivables sold to Financial Products and of interest earned between ME&T and Financial Products as well as dividends paid by Financial Products to ME&T.
4Elimination of equity profit (loss) earned from Financial Products’ subsidiaries partially owned by ME&T subsidiaries.
5Elimination of noncontrolling interest profit (loss) recorded by Financial Products for subsidiaries partially owned by ME&T subsidiaries.
6Profit attributable to common shareholders.
Caterpillar Inc.
Supplemental Data for Results of Operations
For the Nine Months Ended September 30, 2021
(Unaudited)
(Millions of dollars)
| Supplemental Consolidating Data | ||||||||||||||||||||||||||
| Consolidated | Machinery, Energy & Transportation | Financial Products | Consolidating Adjustments | |||||||||||||||||||||||
| Sales and revenues: | ||||||||||||||||||||||||||
| Sales of Machinery, Energy & Transportation | $ | 35,091 | $ | 35,091 | $ | — | $ | — | ||||||||||||||||||
| Revenues of Financial Products | 2,082 | — | 2,371 | (289) | 1 | |||||||||||||||||||||
| Total sales and revenues | 37,173 | 35,091 | 2,371 | (289) | ||||||||||||||||||||||
| Operating costs: | ||||||||||||||||||||||||||
| Cost of goods sold | 25,510 | 25,515 | — | (5) | 2 | |||||||||||||||||||||
| Selling, general and administrative expenses | 3,943 | 3,471 | 483 | (11) | 2 | |||||||||||||||||||||
| Research and development expenses | 1,247 | 1,247 | — | — | ||||||||||||||||||||||
| Interest expense of Financial Products | 352 | — | 352 | — | ||||||||||||||||||||||
| Other operating (income) expenses | 854 | (30) | 931 | (47) | 2 | |||||||||||||||||||||
| Total operating costs | 31,906 | 30,203 | 1,766 | (63) | ||||||||||||||||||||||
| Operating profit | 5,267 | 4,888 | 605 | (226) | ||||||||||||||||||||||
| Interest expense excluding Financial Products | 376 | 376 | — | — | ||||||||||||||||||||||
| Other income (expense) | 751 | 819 | 56 | (124) | 3 | |||||||||||||||||||||
| Consolidated profit before taxes | 5,642 | 5,331 | 661 | (350) | ||||||||||||||||||||||
| Provision (benefit) for income taxes | 1,313 | 1,158 | 155 | — | ||||||||||||||||||||||
| Profit of consolidated companies | 4,329 | 4,173 | 506 | (350) | ||||||||||||||||||||||
| Equity in profit (loss) of unconsolidated affiliated companies | 44 | 52 | — | (8) | 4 | |||||||||||||||||||||
| Profit of consolidated and affiliated companies | 4,373 | 4,225 | 506 | (358) | ||||||||||||||||||||||
| Less: Profit (loss) attributable to noncontrolling interests | 4 | 3 | 9 | (8) | 5 | |||||||||||||||||||||
| Profit 6 | $ | 4,369 | $ | 4,222 | $ | 497 | $ | (350) |
1Elimination of Financial Products’ revenues earned from ME&T.
2Elimination of net expenses recorded by ME&T paid to Financial Products.
3Elimination of discount recorded by ME&T on receivables sold to Financial Products and of interest earned between ME&T and Financial Products as well as dividends paid by Financial Products to ME&T.
4Elimination of equity profit (loss) earned from Financial Products’ subsidiaries partially owned by ME&T subsidiaries.
5Elimination of noncontrolling interest profit (loss) recorded by Financial Products for subsidiaries partially owned by ME&T subsidiaries.
6Profit attributable to common shareholders.
Caterpillar Inc.
Supplemental Data for Financial Position
At September 30, 2022
(Unaudited)
(Millions of dollars)
| Supplemental Consolidating Data | ||||||||||||||||||||||||||
| Consolidated | Machinery, Energy & Transportation | Financial Products | Consolidating Adjustments | |||||||||||||||||||||||
| Assets | ||||||||||||||||||||||||||
| Current assets: | ||||||||||||||||||||||||||
| Cash and cash equivalents | $ | 6,346 | $ | 5,403 | $ | 943 | $ | — | ||||||||||||||||||
| Receivables – trade and other | 8,158 | 3,134 | 652 | 4,372 | 1,2 | |||||||||||||||||||||
| Receivables – finance | 8,918 | — | 13,446 | (4,528) | 2 | |||||||||||||||||||||
| Prepaid expenses and other current assets | 2,295 | 2,013 | 316 | (34) | 3 | |||||||||||||||||||||
| Inventories | 16,860 | 16,860 | — | — | ||||||||||||||||||||||
| Total current assets | 42,577 | 27,410 | 15,357 | (190) | ||||||||||||||||||||||
| Property, plant and equipment – net | 11,643 | 7,810 | 3,833 | — | ||||||||||||||||||||||
| Long-term receivables – trade and other | 1,278 | 319 | 512 | 447 | 1,2 | |||||||||||||||||||||
| Long-term receivables – finance | 11,859 | — | 12,338 | (479) | 2 | |||||||||||||||||||||
| Noncurrent deferred and refundable income taxes | 2,218 | 2,745 | 106 | (633) | 4 | |||||||||||||||||||||
| Intangible assets | 806 | 806 | — | — | ||||||||||||||||||||||
| Goodwill | 6,092 | 6,092 | — | — | ||||||||||||||||||||||
| Other assets | 4,434 | 3,663 | 1,946 | (1,175) | 5 | |||||||||||||||||||||
| Total assets | $ | 80,907 | $ | 48,845 | $ | 34,092 | $ | (2,030) | ||||||||||||||||||
| Liabilities | ||||||||||||||||||||||||||
| Current liabilities: | ||||||||||||||||||||||||||
| Short-term borrowings | $ | 4,202 | $ | 3 | $ | 4,199 | $ | — | ||||||||||||||||||
| Accounts payable | 8,260 | 8,149 | 267 | (156) | 6 | |||||||||||||||||||||
| Accrued expenses | 4,013 | 3,622 | 391 | — | ||||||||||||||||||||||
| Accrued wages, salaries and employee benefits | 2,204 | 2,160 | 44 | — | ||||||||||||||||||||||
| Customer advances | 1,831 | 1,831 | — | — | ||||||||||||||||||||||
| Other current liabilities | 2,878 | 2,126 | 807 | (55) | 4,7 | |||||||||||||||||||||
| Long-term debt due within one year | 6,814 | 120 | 6,694 | — | ||||||||||||||||||||||
| Total current liabilities | 30,202 | 18,011 | 12,402 | (211) | ||||||||||||||||||||||
| Long-term debt due after one year | 25,509 | 9,511 | 16,030 | (32) | 8 | |||||||||||||||||||||
| Liability for postemployment benefits | 5,038 | 5,038 | — | — | ||||||||||||||||||||||
| Other liabilities | 4,536 | 3,659 | 1,565 | (688) | 4 | |||||||||||||||||||||
| Total liabilities | 65,285 | 36,219 | 29,997 | (931) | ||||||||||||||||||||||
| Commitments and contingencies | ||||||||||||||||||||||||||
| Shareholders’ equity | ||||||||||||||||||||||||||
| Common stock | 6,523 | 6,523 | 905 | (905) | 9 | |||||||||||||||||||||
| Treasury stock | (30,883) | (30,883) | — | — | ||||||||||||||||||||||
| Profit employed in the business | 43,304 | 38,898 | 4,395 | 11 | 9 | |||||||||||||||||||||
| Accumulated other comprehensive income (loss) | (3,353) | (1,946) | (1,407) | — | ||||||||||||||||||||||
| Noncontrolling interests | 31 | 34 | 202 | (205) | 9 | |||||||||||||||||||||
| Total shareholders’ equity | 15,622 | 12,626 | 4,095 | (1,099) | ||||||||||||||||||||||
| Total liabilities and shareholders’ equity | $ | 80,907 | $ | 48,845 | $ | 34,092 | $ | (2,030) |
1 Elimination of receivables between ME&T and Financial Products.
2 Reclassification of ME&T’s trade receivables purchased by Financial Products and Financial Products’ wholesale inventory receivables.
3 Elimination of ME&T’s insurance premiums that are prepaid to Financial Products.
4 Reclassification reflecting required netting of deferred tax assets/liabilities by taxing jurisdiction.
5 Elimination of other intercompany assets between ME&T and Financial Products.
6 Elimination of payables between ME&T and Financial Products.
7 Elimination of prepaid insurance in Financial Products’ other liabilities.
8 Elimination of debt between ME&T and Financial Products.
9 Eliminations associated with ME&T’s investments in Financial Products’ subsidiaries.
Caterpillar Inc.
Supplemental Data for Financial Position
At December 31, 2021
(Unaudited)
(Millions of dollars)
| Supplemental Consolidating Data | ||||||||||||||||||||||||||
| Consolidated | Machinery, Energy & Transportation | Financial Products | Consolidating Adjustments | |||||||||||||||||||||||
| Assets | ||||||||||||||||||||||||||
| Current assets: | ||||||||||||||||||||||||||
| Cash and cash equivalents | $ | 9,254 | $ | 8,428 | $ | 826 | $ | — | ||||||||||||||||||
| Receivables – trade and other | 8,477 | 3,279 | 435 | 4,763 | 1,2 | |||||||||||||||||||||
| Receivables – finance | 8,898 | — | 13,828 | (4,930) | 2 | |||||||||||||||||||||
| Prepaid expenses and other current assets | 2,788 | 2,567 | 358 | (137) | 3 | |||||||||||||||||||||
| Inventories | 14,038 | 14,038 | — | — | ||||||||||||||||||||||
| Total current assets | 43,455 | 28,312 | 15,447 | (304) | ||||||||||||||||||||||
| Property, plant and equipment – net | 12,090 | 8,172 | 3,918 | — | ||||||||||||||||||||||
| Long-term receivables – trade and other | 1,204 | 375 | 204 | 625 | 1,2 | |||||||||||||||||||||
| Long-term receivables – finance | 12,707 | — | 13,358 | (651) | 2 | |||||||||||||||||||||
| Noncurrent deferred and refundable income taxes | 1,840 | 2,396 | 105 | (661) | 4 | |||||||||||||||||||||
| Intangible assets | 1,042 | 1,042 | — | — | ||||||||||||||||||||||
| Goodwill | 6,324 | 6,324 | — | — | ||||||||||||||||||||||
| Other assets | 4,131 | 3,388 | 1,952 | (1,209) | 5 | |||||||||||||||||||||
| Total assets | $ | 82,793 | $ | 50,009 | $ | 34,984 | $ | (2,200) | ||||||||||||||||||
| Liabilities | ||||||||||||||||||||||||||
| Current liabilities: | ||||||||||||||||||||||||||
| Short-term borrowings | $ | 5,404 | $ | 9 | $ | 5,395 | $ | — | ||||||||||||||||||
| Accounts payable | 8,154 | 8,079 | 242 | (167) | 6 | |||||||||||||||||||||
| Accrued expenses | 3,757 | 3,385 | 372 | — | ||||||||||||||||||||||
| Accrued wages, salaries and employee benefits | 2,242 | 2,186 | 56 | — | ||||||||||||||||||||||
| Customer advances | 1,087 | 1,086 | 1 | — | ||||||||||||||||||||||
| Dividends payable | 595 | 595 | — | — | ||||||||||||||||||||||
| Other current liabilities | 2,256 | 1,773 | 642 | (159) | 4,7 | |||||||||||||||||||||
| Long-term debt due within one year | 6,352 | 45 | 6,307 | — | ||||||||||||||||||||||
| Total current liabilities | 29,847 | 17,158 | 13,015 | (326) | ||||||||||||||||||||||
| Long-term debt due after one year | 26,033 | 9,772 | 16,287 | (26) | 8 | |||||||||||||||||||||
| Liability for postemployment benefits | 5,592 | 5,592 | — | — | ||||||||||||||||||||||
| Other liabilities | 4,805 | 4,106 | 1,425 | (726) | 4 | |||||||||||||||||||||
| Total liabilities | 66,277 | 36,628 | 30,727 | (1,078) | ||||||||||||||||||||||
| Commitments and contingencies | ||||||||||||||||||||||||||
| Shareholders’ equity | ||||||||||||||||||||||||||
| Common stock | 6,398 | 6,398 | 919 | (919) | 9 | |||||||||||||||||||||
| Treasury stock | (27,643) | (27,643) | — | — | ||||||||||||||||||||||
| Profit employed in the business | 39,282 | 35,390 | 3,881 | 11 | 9 | |||||||||||||||||||||
| Accumulated other comprehensive income (loss) | (1,553) | (799) | (754) | — | ||||||||||||||||||||||
| Noncontrolling interests | 32 | 35 | 211 | (214) | 9 | |||||||||||||||||||||
| Total shareholders’ equity | 16,516 | 13,381 | 4,257 | (1,122) | ||||||||||||||||||||||
| Total liabilities and shareholders’ equity | $ | 82,793 | $ | 50,009 | $ | 34,984 | $ | (2,200) |
1 Elimination of receivables between ME&T and Financial Products.
2 Reclassification of ME&T’s trade receivables purchased by Financial Products and Financial Products’ wholesale inventory receivables.
3 Elimination of ME&T’s insurance premiums that are prepaid to Financial Products.
4 Reclassification reflecting required netting of deferred tax assets/liabilities by taxing jurisdiction.
5 Elimination of other intercompany assets between ME&T and Financial Products.
6 Elimination of payables between ME&T and Financial Products.
7 Elimination of prepaid insurance in Financial Products' other liabilities.
8 Elimination of debt between ME&T and Financial Products.
9 Eliminations associated with ME&T’s investments in Financial Products’ subsidiaries.
Caterpillar Inc.
Supplemental Data for Cash Flow
For the Nine Months Ended September 30, 2022
(Unaudited)
(Millions of dollars)
| Supplemental Consolidating Data | ||||||||||||||||||||||||||
| Consolidated | Machinery, Energy & Transportation | Financial Products | Consolidating Adjustments | |||||||||||||||||||||||
| Cash flow from operating activities: | ||||||||||||||||||||||||||
| Profit of consolidated and affiliated companies | $ | 5,250 | $ | 4,750 | $ | 506 | $ | (6) | 1 | |||||||||||||||||
| Adjustments for non-cash items: | ||||||||||||||||||||||||||
| Depreciation and amortization | 1,661 | 1,072 | 589 | — | ||||||||||||||||||||||
| Provision (benefit) for deferred income taxes | (349) | (294) | (55) | — | ||||||||||||||||||||||
| Other | 132 | (83) | (123) | 338 | 2 | |||||||||||||||||||||
| Changes in assets and liabilities, net of acquisitions and divestitures: | ||||||||||||||||||||||||||
| Receivables – trade and other | 365 | 97 | 21 | 247 | 2,3 | |||||||||||||||||||||
| Inventories | (3,088) | (3,074) | — | (14) | 2 | |||||||||||||||||||||
| Accounts payable | 786 | 701 | 74 | 11 | 2 | |||||||||||||||||||||
| Accrued expenses | 70 | 28 | 42 | — | ||||||||||||||||||||||
| Accrued wages, salaries and employee benefits | 15 | 27 | (12) | — | ||||||||||||||||||||||
| Customer advances | 751 | 752 | (1) | — | ||||||||||||||||||||||
| Other assets – net | 57 | 128 | (28) | (43) | 2 | |||||||||||||||||||||
| Other liabilities – net | (623) | (913) | 239 | 51 | 2 | |||||||||||||||||||||
| Net cash provided by (used for) operating activities | 5,027 | 3,191 | 1,252 | 584 | ||||||||||||||||||||||
| Cash flow from investing activities: | ||||||||||||||||||||||||||
| Capital expenditures – excluding equipment leased to others | (868) | (860) | (10) | 2 | 2 | |||||||||||||||||||||
| Expenditures for equipment leased to others | (1,023) | (20) | (1,024) | 21 | 2 | |||||||||||||||||||||
| Proceeds from disposals of leased assets and property, plant and equipment | 666 | 63 | 612 | (9) | 2 | |||||||||||||||||||||
| Additions to finance receivables | (9,914) | — | (10,584) | 670 | 3 | |||||||||||||||||||||
| Collections of finance receivables | 9,738 | — | 10,328 | (590) | 3 | |||||||||||||||||||||
| Net intercompany purchased receivables | — | — | 678 | (678) | 3 | |||||||||||||||||||||
| Proceeds from sale of finance receivables | 50 | — | 50 | — | ||||||||||||||||||||||
| Net intercompany borrowings | — | — | 5 | (5) | 4 | |||||||||||||||||||||
| Investments and acquisitions (net of cash acquired) | (44) | (44) | — | — | ||||||||||||||||||||||
| Proceeds from sale of businesses and investments (net of cash sold) | 1 | 1 | — | — | ||||||||||||||||||||||
| Proceeds from sale of securities | 2,080 | 1,820 | 260 | — | ||||||||||||||||||||||
| Investments in securities | (2,399) | (1,925) | (474) | — | ||||||||||||||||||||||
| Other – net | 15 | 84 | (69) | — | ||||||||||||||||||||||
| Net cash provided by (used for) investing activities | (1,698) | (881) | (228) | (589) | ||||||||||||||||||||||
| Cash flow from financing activities: | ||||||||||||||||||||||||||
| Dividends paid | (1,820) | (1,820) | — | — | ||||||||||||||||||||||
| Common stock issued, including treasury shares reissued | 2 | 2 | — | — | ||||||||||||||||||||||
| Common shares repurchased | (3,309) | (3,309) | — | — | ||||||||||||||||||||||
| Net intercompany borrowings | — | (5) | — | 5 | 4 | |||||||||||||||||||||
| Proceeds from debt issued (original maturities greater than three months) | 5,570 | — | 5,570 | — | ||||||||||||||||||||||
| Payments on debt (original maturities greater than three months) | (5,289) | (20) | (5,269) | — | ||||||||||||||||||||||
| Short-term borrowings – net (original maturities three months or less) | (1,311) | (138) | (1,173) | — | ||||||||||||||||||||||
| Other – net | (1) | (1) | — | — | ||||||||||||||||||||||
| Net cash provided by (used for) financing activities | (6,158) | (5,291) | (872) | 5 | ||||||||||||||||||||||
| Effect of exchange rate changes on cash | (79) | (42) | (37) | — | ||||||||||||||||||||||
| Increase (decrease) in cash, cash equivalents and restricted cash | (2,908) | (3,023) | 115 | — | ||||||||||||||||||||||
| Cash, cash equivalents and restricted cash at beginning of period | 9,263 | 8,433 | 830 | — | ||||||||||||||||||||||
| Cash, cash equivalents and restricted cash at end of period | $ | 6,355 | $ | 5,410 | $ | 945 | $ | — |
1 Elimination of equity profit earned from Financial Products' subsidiaries partially owned by ME&T subsidiaries.
2 Elimination of non-cash adjustments and changes in assets and liabilities related to consolidated reporting.
3 Reclassification of Financial Products’ cash flow activity from investing to operating for receivables that arose from the sale of inventory.
4 Elimination of net proceeds and payments to/from ME&T and Financial Products.
Caterpillar Inc.
Supplemental Data for Cash Flow
For the Nine Months Ended September 30, 2021
(Unaudited)
(Millions of dollars)
| Supplemental Consolidating Data | ||||||||||||||||||||||||||
| Consolidated | Machinery, Energy & Transportation | Financial Products | Consolidating Adjustments | |||||||||||||||||||||||
| Cash flow from operating activities: | ||||||||||||||||||||||||||
| Profit of consolidated and affiliated companies | $ | 4,373 | $ | 4,225 | $ | 506 | $ | (358) | 1,5 | |||||||||||||||||
| Adjustments for non-cash items: | ||||||||||||||||||||||||||
| Depreciation and amortization | 1,766 | 1,162 | 604 | — | ||||||||||||||||||||||
| Provision (benefit) for deferred income taxes | (321) | (255) | (66) | — | ||||||||||||||||||||||
| Other | 102 | 104 | (135) | 133 | 2 | |||||||||||||||||||||
| Changes in assets and liabilities, net of acquisitions and divestitures: | ||||||||||||||||||||||||||
| Receivables – trade and other | (326) | (338) | 40 | (28) | 2,3 | |||||||||||||||||||||
| Inventories | (2,195) | (2,194) | — | (1) | 2 | |||||||||||||||||||||
| Accounts payable | 1,232 | 1,194 | 28 | 10 | 2 | |||||||||||||||||||||
| Accrued expenses | 46 | 117 | (71) | — | ||||||||||||||||||||||
| Accrued wages, salaries and employee benefits | 934 | 905 | 29 | — | ||||||||||||||||||||||
| Customer advances | 39 | 39 | — | — | ||||||||||||||||||||||
| Other assets – net | 138 | 133 | 24 | (19) | 2 | |||||||||||||||||||||
| Other liabilities – net | (2) | (193) | 144 | 47 | 2 | |||||||||||||||||||||
| Net cash provided by (used for) operating activities | 5,786 | 4,899 | 1,103 | (216) | ||||||||||||||||||||||
| Cash flow from investing activities: | ||||||||||||||||||||||||||
| Capital expenditures – excluding equipment leased to others | (673) | (670) | (11) | 8 | 2 | |||||||||||||||||||||
| Expenditures for equipment leased to others | (1,014) | (23) | (997) | 6 | 2 | |||||||||||||||||||||
| Proceeds from disposals of leased assets and property, plant and equipment | 877 | 71 | 818 | (12) | 2 | |||||||||||||||||||||
| Additions to finance receivables | (9,603) | — | (10,292) | 689 | 3 | |||||||||||||||||||||
| Collections of finance receivables | 9,221 | — | 9,946 | (725) | 3 | |||||||||||||||||||||
| Net intercompany purchased receivables | — | — | 100 | (100) | 3 | |||||||||||||||||||||
| Proceeds from sale of finance receivables | 44 | — | 44 | — | ||||||||||||||||||||||
| Net intercompany borrowings | — | 1,000 | 3 | (1,003) | 4 | |||||||||||||||||||||
| Investments and acquisitions (net of cash acquired) | (449) | (449) | — | — | ||||||||||||||||||||||
| Proceeds from sale of businesses and investments (net of cash sold) | 23 | 23 | — | — | ||||||||||||||||||||||
| Proceeds from sale of securities | 424 | 44 | 380 | — | ||||||||||||||||||||||
| Investments in securities | (934) | (542) | (392) | — | ||||||||||||||||||||||
| Other – net | (8) | 59 | (67) | — | ||||||||||||||||||||||
| Net cash provided by (used for) investing activities | (2,092) | (487) | (468) | (1,137) | ||||||||||||||||||||||
| Cash flow from financing activities: | ||||||||||||||||||||||||||
| Dividends paid | (1,733) | (1,733) | (350) | 350 | 5 | |||||||||||||||||||||
| Common stock issued, including treasury shares reissued | 122 | 122 | — | — | ||||||||||||||||||||||
| Common shares repurchased | (1,622) | (1,622) | — | — | ||||||||||||||||||||||
| Net intercompany borrowings | — | (3) | (1,000) | 1,003 | 4 | |||||||||||||||||||||
| Proceeds from debt issued (original maturities greater than three months) | 6,931 | 494 | 6,437 | — | ||||||||||||||||||||||
| Payments on debt (original maturities greater than three months) | (8,620) | (1,910) | (6,710) | — | ||||||||||||||||||||||
| Short-term borrowings – net (original maturities three months or less) | 1,324 | (10) | 1,334 | — | ||||||||||||||||||||||
| Other – net | (4) | (4) | — | — | ||||||||||||||||||||||
| Net cash provided by (used for) financing activities | (3,602) | (4,666) | (289) | 1,353 | ||||||||||||||||||||||
| Effect of exchange rate changes on cash | (9) | (14) | 5 | — | ||||||||||||||||||||||
| Increase (decrease) in cash, cash equivalents and restricted cash | 83 | (268) | 351 | — | ||||||||||||||||||||||
| Cash, cash equivalents and restricted cash at beginning of period | 9,366 | 8,822 | 544 | — | ||||||||||||||||||||||
| Cash, cash equivalents and restricted cash at end of period | $ | 9,449 | $ | 8,554 | $ | 895 | $ | — |
1 Elimination of equity profit earned from Financial Products' subsidiaries partially owned by ME&T subsidiaries.
2 Elimination of non-cash adjustments and changes in assets and liabilities related to consolidated reporting.
3 Reclassification of Financial Products’ cash flow activity from investing to operating for receivables that arose from the sale of inventory.
4 Elimination of net proceeds and payments to/from ME&T and Financial Products.
5 Elimination of dividend activity between Financial Products and ME&T.
Forward-looking Statements
Certain statements in this Form 10-Q relate to future events and expectations and are forward-looking statements within the meaning of the Private Securities Litigation Reform Act of 1995. Words such as “believe,” “estimate,” “will be,” “will,” “would,” “expect,” “anticipate,” “plan,” “forecast,” “target,” “guide,” “project,” “intend,” “could,” “should” or other similar words or expressions often identify forward-looking statements. All statements other than statements of historical fact are forward-looking statements, including, without limitation, statements regarding our outlook, projections, forecasts or trend descriptions. These statements do not guarantee future performance and speak only as of the date they are made, and we do not undertake to update our forward-looking statements.
Caterpillar’s actual results may differ materially from those described or implied in our forward-looking statements based on a number of factors, including, but not limited to: (i) global and regional economic conditions and economic conditions in the industries we serve; (ii) commodity price changes, material price increases, fluctuations in demand for our products or significant shortages of material; (iii) government monetary or fiscal policies; (iv) political and economic risks, commercial instability and events beyond our control in the countries in which we operate; (v) international trade policies and their impact on demand for our products and our competitive position, including the imposition of new tariffs or changes in existing tariff rates; (vi) our ability to develop, produce and market quality products that meet our customers’ needs; (vii) the impact of the highly competitive environment in which we operate on our sales and pricing; (viii) information technology security threats and computer crime; (ix) inventory management decisions and sourcing practices of our dealers and our OEM customers; (x) a failure to realize, or a delay in realizing, all of the anticipated benefits of our acquisitions, joint ventures or divestitures; (xi) union disputes or other employee relations issues; (xii) adverse effects of unexpected events; (xiii) disruptions or volatility in global financial markets limiting our sources of liquidity or the liquidity of our customers, dealers and suppliers; (xiv) failure to maintain our credit ratings and potential resulting increases to our cost of borrowing and adverse effects on our cost of funds, liquidity, competitive position and access to capital markets; (xv) our Financial Products segment’s risks associated with the financial services industry; (xvi) changes in interest rates or market liquidity conditions; (xvii) an increase in delinquencies, repossessions or net losses of Cat Financial’s customers; (xviii) currency fluctuations; (xix) our or Cat Financial’s compliance with financial and other restrictive covenants in debt agreements; (xx) increased pension plan funding obligations; (xxi) alleged or actual violations of trade or anti-corruption laws and regulations; (xxii) additional tax expense or exposure, including the impact of U.S. tax reform; (xxiii) significant legal proceedings, claims, lawsuits or government investigations; (xxiv) new regulations or changes in financial services regulations; (xxv) compliance with environmental laws and regulations; (xxvi) the duration and geographic spread of, business disruptions caused by, and the overall global economic impact of, the COVID-19 pandemic; and (xxvii) other factors described in more detail under the section entitled "Part I - Item 1A. Risk Factors" of Caterpillar's Annual Report on Form 10-K for the fiscal year ended December 31, 2021, as such factors may be updated from time to time in Caterpillar's periodic filings with the Securities and Exchange Commission.
Previous: Item 1. Financial Statements · Next: Item 3. Quantitative and Qualitative Disclosures About Market Risk