 filings.tools
Item 5. Market for Registrant's Common Equity, Related Stockholder Matters and Issuer Purchases of Equity Securities
5K characters. Original on sec.gov · Markdown
Item 5. Market for Registrant's Common Equity, Related Stockholder Matters and Issuer Purchases of Equity Securities
Common Stock
The Company's common stock is listed on Cboe BZX under the trading symbol CBOE. On September 17, 2018, we voluntarily delisted our common stock from Nasdaq Global Select Market and transferred the listing to Cboe BZX Exchange. As of January 31, 2019, there were approximately 163 holders of record of our common stock.
Dividends
Each share of common stock, including restricted stock awards and restricted stock units, is entitled to receive dividend and dividend equivalents, respectively, if, as and when declared by the board of directors of the Company.
The Company’s expectation is to continue to pay dividends. The decision to pay a dividend, however, remains within the discretion of the Company's board of directors and may be affected by various factors, including our earnings, financial condition, capital requirements, level of indebtedness and other considerations our board of directors deems relevant. Future debt obligations and statutory provisions, among other things, may limit, or in some cases prohibit, our ability to pay dividends.
As a holding company, the Company's ability to declare and continue to pay dividends in the future with respect to its common stock will also be dependent upon the ability of its subsidiaries to pay dividends to it under applicable corporate law.
Recent Sales of Unregistered Securities
Not applicable.
Use of Proceeds
Not applicable.
Purchases of Equity Securities by the Issuer and Affiliated Purchasers
Share Repurchase Program
In 2011, the board of directors approved an initial authorization for the Company to repurchase shares of its outstanding common stock of $100 million and approved additional authorizations of $100 million in each of 2012, 2013, 2014, 2015 and 2016, $150 million in February 2018, and $100 million in August 2018, for a total authorization of $850 million. The program permits the Company to purchase shares through a variety of methods, including in the open market or through privately negotiated transactions, in accordance with applicable securities laws. It does not obligate the Company to make any repurchases at any specific time or situation.
Under the program, for the year ended December 31, 2018, the Company repurchased 1,347,954 shares of common stock at an average cost per share of $104.52, totaling $140.9 million. Since inception of the program through December 31, 2018, the Company has repurchased 12,295,355 shares of common stock at an average cost per share of $52.37, totaling $643.9 million.
As of December 31, 2018, the Company had $206.1 million of availability remaining under its existing share repurchase authorizations.
Purchase of common stock from employees
During the fiscal quarter ended December 31, 2018, we purchased shares from employees in connection with the settlement of employee tax withholding obligations arising from the vesting of restricted stock units, restricted stock awards, and stock options. The table below represents repurchases made by or on behalf of us or any “affiliated purchaser” of our common stock during the fiscal quarter ended December 31, 2018:
| Period | Total number of shares purchased | Average price paid per share | |
| October 1 to October 31, 2018 | 120 | $ | 104.91 |
| November 1 to November 30, 2018 | 6,207 | 112.49 | |
| December 1 to December 31, 2018 | 45,870 | 106.18 | |
| Total | 52,197 | 106.93 |
Stockholder Return Performance Graph
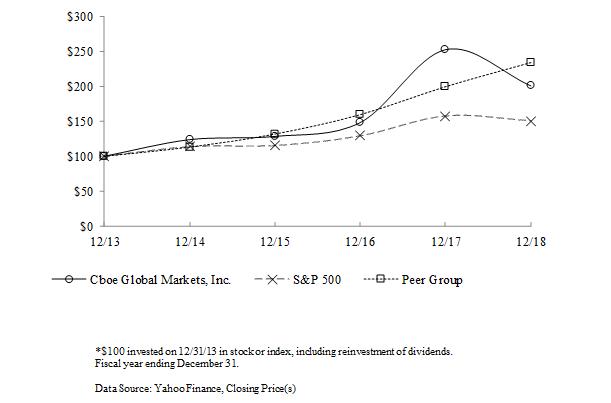
The following graph compares the cumulative total return provided to stockholders on our common stock since our initial public offering against the return of the S&P 500 Index and a customized peer group that includes CME Group Inc., Intercontinental Exchange Inc., and Nasdaq, Inc.
An investment of $100, with reinvestment of all dividends, is assumed to have been made in our common stock, the index and the peer groups on December 31, 2013, and its performance is tracked on an annual basis through December 31, 2018.
Comparison of Cumulative Total Return of the
Company, Peer Groups, Industry Indexes and/or Broad Markets
COMPARISON OF 5 YEAR CUMULATIVE TOTAL RETURN*
Among Cboe Global Markets, Inc., the S&P 500 Index
and a Peer Group
| 12/13 | 12/14 | 12/15 | 12/16 | 12/17 | 12/18 | |||||||
| Cboe Global Markets, Inc. | 100.00 | 123.82 | 128.48 | 148.42 | 253.01 | 200.89 | ||||||
| S&P 500 | 100.00 | 113.69 | 115.26 | 129.05 | 157.22 | 150.33 | ||||||
| Peer Group | 100.00 | 113.10 | 131.68 | 159.36 | 199.20 | 233.49 |
Previous: Item 4. Mine Safety Disclosures · Next: Item 6. Selected Financial Data