 filings.tools
C. H. Robinson Worldwide (CHRW) 10-K risk factor changes: FY2017 vs FY2016
The 2017-12-31 10-K against the 2016-12-31 one, compared heading by heading and sentence by sentence. One of these filings carries no fiscal year tag, so its year is the calendar year of the period end.
Item 1A12 rewritten1 added1 removed182 unchanged
All filing items646 rewritten339 added332 removed1,667 unchanged
Summary
counted, not written
- Item 1A headings could not be compared: only 0 carried over between the two years, which usually means one filing was read wrongly, so none is reported as new or removed.
- Sentence by sentence, 339 added, 332 removed, 646 rewritten and 1,667 unchanged across 12 items that differ.
Sentences by item
21 items, with every count and a link to each item that changed
| Item | Added | Removed | Rewritten | Unchanged | Page headers and footers changed |
|---|---|---|---|---|---|
| Item 1A. RISK FACTORS | 1 | 1 | 12 | 182 | 0 |
| Item 7. MANAGEMENT’S DISCUSSION AND ANALYSIS OF FINANCIAL CONDITION AND RESULTS OF OPERATIONS | 74 | 82 | 143 | 281 | 0 |
| Item 7A. QUANTITATIVE AND QUALITATIVE DISCLOSURES ABOUT MARKET RISK | 3 | 0 | 4 | 11 | 0 |
| Item 1. BUSINESS | 33 | 17 | 93 | 316 | 0 |
| Item 3. LEGAL PROCEEDINGS | 0 | 0 | 0 | 7 | 0 |
| Cover and table of contents | 8 | 7 | 29 | 54 | 0 |
| Item 1B. UNRESOLVED STAFF COMMENTS | 0 | 0 | 0 | 4 | 0 |
| Item 2. PROPERTIES | 3 | 4 | 6 | 49 | 0 |
| Item 4. MINE SAFETY DISCLOSURES | 0 | 0 | 0 | 5 | 0 |
| Item 5. MARKET FOR REGISTRANT’S COMMON EQUITY, RELATED STOCKHOLDER MATTERS, AND ISSUER PURCHASES OF EQUITY SECURITIES | 8 | 8 | 11 | 21 | 0 |
| Item 6. SELECTED FINANCIAL DATA | 0 | 4 | 16 | 17 | 0 |
| Item 8. FINANCIAL STATEMENTS AND SUPPLEMENTARY DATA | 199 | 198 | 277 | 554 | 0 |
| Item 9. CHANGES IN AND DISAGREEMENTS WITH ACCOUNTANTS ON ACCOUNTING AND FINANCIAL DISCLOSURE | 0 | 0 | 0 | 4 | 0 |
| Item 9A. CONTROLS AND PROCEDURES | 0 | 0 | 9 | 6 | 0 |
| Item 9B. OTHER INFORMATION | 0 | 0 | 0 | 5 | 0 |
| Item 10. DIRECTORS, EXECUTIVE OFFICERS, AND CORPORATE GOVERNANCE | 0 | 0 | 0 | 8 | 0 |
| Item 11. EXECUTIVE COMPENSATION | 0 | 0 | 0 | 4 | 0 |
| Item 12. SECURITY OWNERSHIP OF CERTAIN BENEFICIAL OWNERS AND MANAGEMENT AND RELATED STOCKHOLDER MATTERS | 2 | 2 | 4 | 12 | 0 |
| Item 13. CERTAIN RELATIONSHIPS AND RELATED TRANSACTIONS, AND DIRECTOR INDEPENDENCE | 0 | 0 | 0 | 4 | 0 |
| Item 14. PRINCIPAL ACCOUNTING FEES AND SERVICES | 0 | 0 | 0 | 5 | 0 |
| Item 15. EXHIBITS, FINANCIAL STATEMENT SCHEDULES | 8 | 9 | 42 | 118 | 0 |
Underlined words on a shaded ground are new in FY2017; struck-through words were in FY2016. Sentences that are wholly new or wholly gone are labelled rather than marked.
Item 1A. RISK FACTORS
12 rewritten, 1 added, 1 removed, 182 unchanged
Read the full itemFY2017 item · filed February 28, 2018FY2016 item · filed March 1, 2017
| • | Decrease in [removed: volumes-A] [added: volumes: A] reduction in overall freight volumes in the marketplace reduces our opportunities for growth. A significant portion of our freight is transactional or “spot” market opportunities. The transactional market may be more impacted than the freight market by overall economic conditions. In addition, if a downturn in our customers’ business cycles causes a reduction in the volume of freight shipped by those customers, particularly among certain national retailers or in the food, beverage, retail, manufacturing, paper, or printing industries, our operating results could be adversely affected. |
| • | Credit risk and working [removed: capital-Some] [added: capital: Some] of our customers may face economic difficulties and may not be able to pay us, and some may go out of business. In addition, some customers may not pay us as quickly as they have in the past, causing our working capital needs to increase. |
| • | Transportation provider [removed: failures-A] [added: failures: A] significant number of our transportation providers may go out of business and we may be unable to secure sufficient equipment or other transportation services to meet our commitments to our customers. |
| • | Expense [removed: management-We] [added: management: We] may not be able to appropriately adjust our expenses to changing market demands. Personnel expenses are our largest expense. In order to maintain high variability in our business model, it is necessary to adjust staffing levels to changing market demands. In periods of rapid change, it is more difficult to match our staffing levels to our business needs. In addition, we have other expenses that are fixed for a period of time, and we may not be able to adequately adjust them in a period of rapid change in market demand. |
Increased demand for truckload services and [removed: pending] changes in regulations may reduce available capacity and increase carrier pricing.
A disruption or failure of our systems or operations in the event of a major earthquake, weather event, cyber-attack, heightened security measures, actual or threatened, terrorist attack, strike, civil unrest, [removed: pandemic] [added: pandemic,] or other catastrophic event could cause delays in providing services or performing other critical functions.
We compete against traditional and non-traditional logistics companies, including transportation providers that own equipment, third party freight brokers, [removed: internet] [added: technology] matching services, internet freight brokers, carriers offering logistics services, and on-demand transportation service providers.
Our results did not follow this pattern in [removed: 2016 as we experienced] [added: 2017 due primarily to changing transportation costs and customer] pricing [removed: declines throughout] [added: in] the [added: second half of the] year.
While we are insured for up to $201 million for product liability [removed: claims, settlement of class action claims,] [added: claims] subject to a $250,000 [added: per incident] deductible, [added: settlement of class action claims] is often costly, and we cannot guarantee that our liability coverage will be adequate and will continue to be available.
We operate as a Department of Homeland Security certified [removed: Indirect Air Carrier,] [added: IAC,] providing air freight services, subject to commercial standards set forth by the International Air Transport Association and federal regulations issued by the Transportation Security Administration.
[added: No assurances can be given that we will be] able to pass these increased costs on to our customers in the form of rate increases or surcharges, and our operations and profitability may suffer as a result.
Our top 100 customers comprise approximately [removed: 30] [added: 35] percent of our consolidated total revenues and [removed: 26] [added: 23] percent of consolidated net revenues.
Long-term growth targets represent an over time perspective and do not necessarily represent an expected annual growth rate.
No assurances can be given that we will be
Item 7. MANAGEMENT’S DISCUSSION AND ANALYSIS OF FINANCIAL CONDITION AND RESULTS OF OPERATIONS
143 rewritten, 74 added, 82 removed, 281 unchanged
Read the full itemFY2017 item · filed February 28, 2018FY2016 item · filed March 1, 2017
We have contractual relationships with approximately [removed: 107,000] [added: 73,000 active] transportation [removed: companies,] [added: companies in 2017,] including motor carriers, railroads (primarily intermodal service providers), air freight, and ocean carriers.
Our model enables us to be [removed: flexible,] [added: flexible and] provide solutions that optimize service for our [removed: customers, and minimize our asset utilization risk.][added: customers.]
For financial information concerning our reportable segments and geographic regions, refer to Note [removed: 10] [added: 9] of our consolidated financial statements.
In September 2016, we completed the acquisition of APC Logistics (“APC”), a privately held company based in Australia, for the purpose of expanding our global presence and bringing additional capabilities and expertise to [removed: the] our portfolio.
Our network [added: of] offices [removed: help] [added: helps] us penetrate local markets, [removed: provide] [added: provides] face-to-face service when needed, and [added: enables us to] recruit contract carriers.
Our headcount increased by [removed: 966] [added: 949] employees during [removed: 2016,] [added: 2017,] which includes approximately [removed: 300] [added: 325] employees added as a result of the [removed: APC] [added: Milgram] acquisition.
Compensation programs are performance-based and cash [removed: incentive is] [added: incentives are] directly tied to productivity and performance.
In [removed: 2016,] [added: 2017,] we worked with more than [removed: 113,000 active] [added: 120,000] customers.
In [removed: 2016,] [added: 2017,] our top 100 customers represented approximately [removed: 30] [added: 35] percent of our total revenues and approximately [removed: 26] [added: 23] percent of our net revenues.
In [removed: 2016,] [added: 2017,] we worked with approximately [removed: 71,000] [added: 73,000] transportation providers worldwide, up from approximately [removed: 68,000] [added: 71,000] in [removed: 2015.][added: 2016.]
Motor carriers [removed: that had] [added: with] fewer than 100 tractors transported approximately [removed: 81] [added: 82] percent of our truckload shipments in [removed: 2016.][added: 2017.]
In our transportation business, no single contracted carrier represents more than approximately [removed: 1.6] [added: two] percent of our contracted carrier capacity.
| For the years ended December 31, | [removed: 2016] [added: 2017] | | | | [removed: 2015] [added: 2016] | | | | Change | | | [removed: 2014] [added: 2015] | | | | Change | |
| Transportation | $ | [removed: 11,704,745] [added: 13,502,906] | | | $ | [removed: 11,989,780] [added: 11,704,745] | | | [removed: (2.4] [added: 15.4] | [removed: )%] [added: %] | | $ | [removed: 11,936,512] [added: 11,989,780] | | | [removed: 0.4] [added: (2.4] | [removed: %] [added: )%] |
| Sourcing | [removed: 1,439,668] [added: 1,366,474] | | | | [removed: 1,486,304] [added: 1,439,668] | | | | [removed: (3.1] [added: (5.1] | )% | | [removed: 1,533,555] [added: 1,486,304] | | | | (3.1 | )% |
| Total | $ | [removed: 13,144,413] [added: 14,869,380] | | | $ | [removed: 13,476,084] [added: 13,144,413] | | | [removed: (2.5] [added: 13.1] | [removed: )%] [added: %] | | $ | [removed: 13,470,067] [added: 13,476,084] | | | [removed: —] [added: (2.5] | [removed: %] [added: )%] |
| For the years ended December 31, | [removed: 2016] [added: 2017] | | | [removed: 2015] [added: 2016] | | | [removed: 2014] [added: 2015] | |
| Transportation | [removed: 18.4] [added: 16.6] | % | | [removed: 17.9] [added: 18.4] | % | | [removed: 15.9] [added: 17.9] | % |
| Sourcing | [removed: 8.5] [added: 9.0] | % | | [removed: 8.1] [added: 8.5] | % | | [removed: 7.5] [added: 8.1] | % |
| Total | [removed: 17.3] [added: 15.9] | % | | [removed: 16.8] [added: 17.3] | % | | [removed: 14.9] [added: 16.8] | % |
| For the years ended December 31, | [removed: 2016] [added: 2017] | | | | [removed: 2015] [added: 2016] | | | | Change | | | [removed: 2014] [added: 2015] | | | | Change | |
| Truckload [removed: (1)] | $ | [removed: 1,257,191] [added: 1,229,999] | | | $ | [removed: 1,316,533] [added: 1,257,191] | | | [removed: (4.5] [added: (2.2] | )% | | $ | [removed: 1,190,372] [added: 1,316,533] | | | [removed: 10.6] [added: (4.5] | [removed: %] [added: )%] |
| LTL [removed: (2)] [added: (1)] | [removed: 381,817] [added: 407,012] | | | | [removed: 360,706] [added: 381,817] | | | | [removed: 5.9] [added: 6.6] | % | | [removed: 258,884] [added: 360,706] | | | | [removed: 39.3] [added: 5.9] | % |
| Intermodal | [removed: 33,482] [added: 29,145] | | | | [removed: 41,054] [added: 33,482] | | | | [removed: (18.4] [added: (13.0] | )% | | [removed: 40,631] [added: 41,054] | | | | [removed: 1.0] [added: (18.4] | [removed: %] [added: )%] |
| Ocean | [removed: 244,276] [added: 290,630] | | | | [removed: 223,643] [added: 244,276] | | | | [removed: 9.2] [added: 19.0] | % | | [removed: 208,422] [added: 223,643] | | | | [removed: 7.3] [added: 9.2] | % |
| Air | [removed: 82,167] [added: 100,761] | | | | [removed: 79,096] [added: 82,167] | | | | [removed: 3.9] [added: 22.6] | % | | [removed: 79,125] [added: 79,096] | | | | [removed: —] [added: 3.9] | % |
| Customs | [removed: 50,509] [added: 70,952] | | | | [removed: 43,929] [added: 50,509] | | | | [removed: 15.0] [added: 40.5] | % | | [removed: 41,575] [added: 43,929] | | | | [removed: 5.7] [added: 15.0] | % |
| Other Logistics Services | [removed: 105,369] [added: 117,117] | | | | [removed: 82,548] [added: 105,369] | | | | [removed: 27.6] [added: 11.1] | % | | [removed: 73,097] [added: 82,548] | | | | [removed: 12.9] [added: 27.6] | % |
| Total Transportation | [removed: 2,154,811] [added: 2,245,616] | | | | [removed: 2,147,509] [added: 2,154,811] | | | | [removed: 0.3] [added: 4.2] | % | | [removed: 1,892,106] [added: 2,147,509] | | | | [removed: 13.5] [added: 0.3] | % |
| Sourcing | [removed: 122,717] [added: 122,434] | | | | [removed: 120,971] [added: 122,717] | | | | [removed: 1.4] [added: (0.2] | [removed: %] [added: )%] | | [removed: 115,546] [added: 120,971] | | | | [removed: 4.7] [added: 1.4] | % |
| Total | $ | [removed: 2,277,528] [added: 2,368,050] | | | $ | [removed: 2,268,480] [added: 2,277,528] | | | [removed: 0.4] [added: 4.0] | % | | $ | [removed: 2,007,652] [added: 2,268,480] | | | [removed: 13.0] [added: 0.4] | % |
[removed: (2)] [added: (1)] Less than truckload (“LTL”).
| For the years ended December 31, | [removed: 2016] [added: 2017] | | | [removed: 2015] [added: 2016] | | | [removed: 2014] [added: 2015] | |
| Personnel expenses | [removed: 46.8] [added: 49.8] | % | | [removed: 46.3] [added: 46.8] | % | | [removed: 46.8] [added: 46.3] | % |
| Other selling, general, and administrative expenses | [removed: 16.4] [added: 17.5] | % | | [removed: 15.8] [added: 16.4] | % | | [removed: 15.9] [added: 15.8] | % |
| Total operating expenses | [removed: 63.2] [added: 67.3] | % | | [removed: 62.2] [added: 63.2] | % | | [removed: 62.7] [added: 62.2] | % |
| Income from operations | [removed: 36.8] [added: 32.7] | % | | [removed: 37.8] [added: 36.8] | % | | [removed: 37.3] [added: 37.8] | % |
| Interest and other expense | [removed: (1.1] [added: (2.0] | )% | | [removed: (1.6] [added: (1.1] | )% | | [removed: (1.2] [added: (1.6] | )% |
| Income before provision for income taxes | [removed: 35.7] [added: 30.8] | % | | [removed: 36.3] [added: 35.7] | % | | [removed: 36.0] [added: 36.3] | % |
| Provision for income taxes | [removed: 13.1] [added: 9.4] | % | | [removed: 13.8] [added: 13.1] | % | | [removed: 13.6] [added: 13.8] | % |
In 2017, changing market conditions continued to impact our results.
We had volume increases in all of our service lines, and experienced pricing and cost increases in nearly all of our service lines, which negatively impacted our margins.
Truckload margin compression was a challenge to our earnings per share during much of the year.
In August 2017, we acquired Milgram & Company Ltd. (“Milgram”), a provider of freight forwarding, customs brokerage, and surface transportation primarily in Canada.
Milgram operates primarily in our Global Forwarding segment.
| Revenues | $ | 9,728,810 | | | $ | 2,140,987 | | | $ | 2,415,740 | | | $ | 583,843 | | | $ | — | | | $ | 14,869,380 | |
| Intersegment revenues | 462,390 | | | | 30,198 | | | | 167,292 | | | | 18,174 | | | | (678,054 | | ) | | — | | |
| Total Revenues | 10,191,200 | | | | 2,171,185 | | | | 2,583,032 | | | | 602,017 | | | | (678,054 | | ) | | 14,869,380 | | |
| Net Revenues | 1,525,064 | | | | 485,280 | | | | 226,059 | | | | 131,647 | | | | — | | | | 2,368,050 | | |
| Operating Income | 628,110 | | | | 91,842 | | | | 53,374 | | | | 1,793 | | | | — | | | | 775,119 | | |
2017 COMPARED TO 2016
This increase in transportation revenues was driven by volume increases in all of our transportation services and increased customer pricing in most services.
Total sourcing revenues decreased 5.1 percent to $1.37 billion in 2017 from $1.44 billion in 2016.
This decrease in net revenue margin was driven by increases in transportation costs, including fuel.
Total sourcing net revenues decreased 0.2 percent to $122.4 million in 2017 from $122.7 million in 2016.
The increase in personnel expense was due primarily to growth in our average headcount of 7.4 percent in 2017 compared to 2016 and increases in expenses related to incentive plans that are designed to keep expenses variable with changes in net revenues and profitability.
This increase in selling, general, and administrative expenses was primarily due to increases in acquisition amortization, warehousing and occupancy expenses, and the provision for bad debt, partially offset by a decrease in travel expenses and claims.
Income from operations decreased 7.5 percent to $775.1 million in 2017 from $837.5 million in 2016.
The increase was primarily due to a higher average debt balance and higher interest rates in 2017 compared to 2016.
During the fourth quarter of 2017, the provision for income taxes decreased by $19.7 million due to the benefit of deductions under Section 199 of the Internal Revenue Code and $12.1 million due to the impact of the Tax Cuts and Jobs Act (the “Tax Act”), which was signed into law on December 22, 2017.
The $12.1 million benefit resulting from the Tax Act was primarily the result of the revaluation of deferred tax assets and liabilities due to the decrease in the corporate Federal income tax rate from 35 percent to 21 percent and was partially offset by the impact of certain transition taxes and other impacts of the Tax Act.
During the first quarter of 2017, we adopted ASU 2016-09, Compensation - Stock Compensation (Topic 718).
The adoption of ASU 2016-09 prospectively impacts the recording of income taxes related to share-based payment awards in our consolidated financial position and results of operations, as well as the operating and financing cash flows on the consolidated statements of cash flows.
This adoption resulted in a net tax benefit of $13.7 million during the year.
During 2017, our indefinite reinvestment strategy with respect to unremitted earnings of our foreign subsidiaries, provided an approximate $3.7 million benefit to our provision for income taxes.
Net income decreased 1.7 percent to $504.9 million in 2017 from $513.4 million in 2016.
Basic net income per share decreased 0.3 percent to $3.59 in 2017 from $3.60 in 2016.
Diluted net income per share decreased 0.6 percent to $3.57 in 2017 from $3.59 in 2016.
NAST revenues increased 11.3 percent to $9.7 billion in 2017 compared to $8.7 billion in 2016.
Total NAST net revenues were flat at $1.5 billion in 2017.
This was driven by a decline in truckload and intermodal net revenues, partially offset by an increase in LTL net revenues.
NAST net revenue margin decreased primarily due to transportation costs growing faster than customer pricing in 2017 compared to 2016.
NAST truckload net revenues decreased 1.8 percent in 2017 to $1.09 billion from $1.11 billion in 2016.
Excluding the estimated impacts of the change in fuel prices, our average North America truckload transportation cost per mile increased approximately 6.5 percent in 2017 compared to 2016.
NAST LTL net revenues increased 6.2 percent in 2017 to $388.8 million from $366.1 million in 2016.
NAST LTL net revenue margin decreased due to increased transportation costs.
NAST intermodal net revenues decreased 14.6 percent to $26.7 million in 2017 from $31.3 million in 2016.
This was primarily due to declines in net revenue margin, partially offset by increased volumes with our lower-margin contractual customers, partially offset by a decrease in transactional business.
NAST operating income decreased 6.9 percent to $628.1 million in 2017 from $674.4 million in 2016.
This was primarily due to increases in operating expenses, while net revenues remained flat.
The acquisition of Freightquote contributed approximately 6.5 percentage points to our consolidated net revenue growth in 2015, primarily in our LTL service line.
(1) Prior to 2015, we reported revenues from the fees we earn from our cash advance option offered to our contract carriers separately from transportation revenues.
Starting in the first quarter of 2015, on a retrospective basis, we report these payment services revenues as a part of transportation total and net revenues.
| Revenues | $ | 8,738,747 | | | $ | 1,708,789 | | | $ | 2,483,163 | | | $ | 539,368 | | | $ | — | | | $ | 13,470,067 | |
| Intersegment revenues | 254,821 | | | | 22,492 | | | | 62,575 | | | | 1,294 | | | | (341,182 | | ) | | — | | |
| Total Revenues | 8,993,568 | | | | 1,731,281 | | | | 2,545,738 | | | | 540,662 | | | | (341,182 | | ) | | 13,470,067 | | |
| Net Revenues | 1,351,335 | | | | 350,193 | | | | 203,591 | | | | 102,533 | | | | — | | | | 2,007,652 | | |
| Operating Income/(Loss) | $ | 644,708 | | | $ | 55,591 | | | $ | 62,395 | | | $ | (14,276 | ) | | $ | — | | | $ | 748,418 | |
During the fourth quarter of 2015, we wrote off an indemnification asset of $7.2 million related to the acquisition of Phoenix as the indemnification obligations of the sellers expired.
The impact of this write off was partially offset within the provision for income taxes by related tax liabilities that expired under applicable statute of limitations.
2015 COMPARED TO 2014
The increase in total transportation revenues was driven by our acquisition of Freightquote on January 1, 2015, and higher volumes in nearly all of our transportation modes.
The increase was partially offset by decreased pricing to our customers primarily related to the declining cost of fuel.
Our sourcing revenue decreased 3.1 percent to $1.49 billion in 2015 from $1.53 billion in 2014.
These decreases were primarily due to decreased revenue and cost per case, partially offset by increased case volumes.
This increase in net revenue margin was driven by a decrease in transportation costs, including fuel, and a change in the mix of business due to growth in shorter length of haul freight and the addition of Freightquote.
Total sourcing net revenues increased 4.7 percent to $121.0 million in 2015 from $115.5 million in 2014.
Freightquote contributed approximately eight percentage points of the growth in average headcount during 2015.
The increase in our selling, general, and administrative expenses is primarily due to our acquisition of Freightquote, including amortization expense of $7.6 million, and an increase in travel expenses.
Income from operations increased 14.7 percent to $858.3 million in 2015 from $748.4 million in 2014.
In addition, we had a higher average outstanding balance on our short-term borrowings throughout 2015 compared to 2014, primarily due to the acquisition of Freightquote.
The effective income tax rate for both periods is greater than the statutory federal income tax rate, primarily due to state income taxes, net of federal benefit.
Net income increased 13.3 percent to $509.7 million in 2015 from $449.7 million in 2014.
Basic net income per share increased 15.0 percent to $3.52 from $3.06 in 2014.
Diluted net income per share increased 15.1 percent to $3.51 from $3.05 in 2014.
NAST total revenues, including intersegment revenues, increased 2.7 percent to $9.2 billion in 2015 from to $9.0 billion in 2014.
This increase was due to our acquisition of Freightquote and higher volumes in nearly all of our transportation modes, offset by decreased transportation costs, primarily related to the declining cost of fuel.
Total NAST net revenues increased 15.8 percent to $1.6 billion in 2015 from $1.4 billion in 2014.
This increase was primarily driven by the Freightquote acquisition.
NAST truckload net revenues increased 11.0 percent in 2015 to $1.2 billion from $1.1 billion in 2014.
Our acquisition of Freightquote contributed approximately four percentage points to NAST truckload net revenue growth in 2015.
included in Robinson Fresh.
Our truckload transportation costs were relatively unchanged, excluding the estimated impacts of the change in fuel.
NAST LTL increased approximately 40 percent in 2015 to $348.3 million from $248.0 million in 2014.
Freightquote contributed approximately 34 percentage points to NAST LTL net revenue growth in 2015.
Net revenue margin increased in 2015 as a result of a change in our freight mix with more small customers from the higher margin Freightquote business.
NAST intermodal net revenues increased 1.7 percent to $39.2 million in 2015 from $38.6 million in 2014.
Freightquote contributed approximately $3.4 million to our NAST intermodal revenues in 2015.
Conversion to truckload from intermodal negatively impacted intermodal volumes and net revenues throughout 2015.
NAST operating income increased 11.4 percent to $718.3 million in 2015 from $644.7 million in 2014.
An excerpt. Shown here: 40 of 143 rewritten, 40 of 74 added and 40 of 82 removed. The counts are complete. For every sentence, read Item 7. MANAGEMENT’S DISCUSSION AND ANALYSIS OF FINANCIAL CONDITION AND RESULTS OF OPERATIONS in the FY2017 filing and the FY2016 filing.
Item 7A. QUANTITATIVE AND QUALITATIVE DISCLOSURES ABOUT MARKET RISK
4 rewritten, 3 added, 0 removed, 11 unchanged
Read the full itemFY2017 item · filed February 28, 2018FY2016 item · filed March 1, 2017
We had [removed: $247.7] [added: $333.9] million of cash and cash equivalents on December 31, [removed: 2016.][added: 2017.]
At December 31, [removed: 2016,] [added: 2017,] there was [removed: $740.0] [added: $715] million outstanding on the revolving loan.
We are a party to the Note Purchase Agreement, as amended, with various institutional investors with fixed rates consisting of: (i) [removed: $175,000,000] [added: $175 million] of the company’s 3.97 percent Senior Notes, Series A, due August 27, 2023, (ii) [removed: $150,000,000] [added: $150 million] of the company’s 4.26 percent Senior Notes, Series B, due August 27, 2028, and (iii) [removed: $175,000,000] [added: $175 million] of the company’s 4.60 percent Senior Notes, Series C, due August 27, 2033.
At December 31, [removed: 2016,] [added: 2017,] there was [removed: $500.0] [added: $500] million outstanding on the notes.
We are a party to a receivables securitization facility with various lenders that provides funding of up to $250 million.
Interest accrues on the facility at variable rates based on the asset-backed commercial paper rate or the 30-day LIBOR plus the applicable add-on percentage as defined therein.
At December 31, 2017, there was $250 million outstanding on the securitization facility.
Item 1. BUSINESS
93 rewritten, 33 added, 17 removed, 316 unchanged
Read the full itemFY2017 item · filed February 28, 2018FY2016 item · filed March 1, 2017
C.H. Robinson Worldwide, Inc. (“C.H. Robinson,” “the company,” “we,” “us,” or “our”) is one of the largest third party logistics companies in the world with [removed: 2016] consolidated total revenues of [removed: $13.1 billion.][added: $14.9 billion in 2017.]
During [removed: 2016,] [added: 2017,] we handled approximately [removed: 18.0] [added: 19] million shipments and worked with more than [removed: 113,000 active] [added: 120,000] customers.
For financial information concerning our reportable segments and geographic regions, refer to Note [removed: 10] [added: 9] of our consolidated financial statements.
As a third party logistics provider, we enter into contractual relationships with a wide variety of transportation companies, and utilize those relationships to efficiently and cost-effectively [added: arrange the] transport [added: of] our customers’ freight.
We [removed: have contractual relationships with] [added: utilized] approximately [removed: 107,000] [added: 73,000 contracted] transportation companies, including motor carriers, railroads (primarily intermodal service providers), and air [removed: freight] and ocean [removed: carriers.][added: carriers in 2017.]
Our model enables us to be [removed: flexible,] [added: flexible and] provide solutions that optimize service for our [removed: customers, and minimize our asset utilization risk.][added: customers.]
We supply fresh produce through [removed: our] [added: a] network of independent produce growers and suppliers.
The produce for these brands is sourced through [removed: our] [added: a] preferred grower network and packed to order through contract packing agreements.
A significant portion of most employees’ compensation is performance-oriented, based on [removed: the] profitability and their contributions to the success of the company.
Our network [added: of] offices work together to meet our customers’ needs and cross-sell our services.
The majority of our global network operates on a [removed: common] [added: single global] technology platform [added: called Navisphere®] that is used to match customer needs with supplier capabilities, to collaborate with other offices, and to utilize centralized support resources to complete all facets of the transaction.
[removed: Historically, we] [added: We] have grown primarily through internal growth, by increasing market share through the addition of new customers and expanding relationships with our current customers, adding new services, expanding our market presence and operations globally, and hiring additional employees.
[removed: Our] [added: We believe] net revenues are [removed: the primary indicator] [added: a useful measure] of our ability to source, add value, and sell services and products that are provided by third parties, and we consider [removed: them] [added: net revenues] to be our primary performance measurement.
We execute these service commitments by hiring and training people, developing proprietary systems and processes, and utilizing [removed: our] [added: a] network of contracted transportation providers, including, but not limited to, contract motor carriers, railroads, [added: and] air [removed: freight,] and ocean carriers.
| • | [removed: Truckload-Through] [added: Truckload: Through] our contracts with motor carriers, we have access to dry vans, temperature controlled vans, flatbeds, and bulk capacity. We [removed: also offer time-definite] [added: help our customers connect with carriers who are interested in their lanes] and [removed: expedited truck transportation through these motor carriers.] [added: product types, and we help carriers find shipments to make effective use of their equipment.] |
| • | Less than [removed: Truckload (“LTL”)-LTL] [added: Truckload: LTL] transportation involves the shipment of single or multiple pallets of freight. We focus on shipments of a single pallet or larger, although we handle any size shipment. Through our contracts with motor carriers and our operating system, we consolidate freight and freight information to provide our customers with a single source of information on their freight. In many instances, we will consolidate partial shipments for several customers into full truckloads. |
| • | [removed: Intermodal-Our] [added: Intermodal: Our] intermodal transportation service is the shipment of freight in trailers or containers by a combination of truck and rail. We have intermodal marketing agreements with container owners and all Class 1 railroads in North America, and we arrange local pickup and delivery (known as drayage) through local contracted motor carriers. In addition, we own approximately [removed: 1,000] [added: 1,500] intermodal containers and lease approximately [removed: 800] [added: 1,700] containers. |
| • | [removed: Ocean-As] [added: Ocean: As] a non-vessel ocean common carrier (“NVOCC”) or freight forwarder, we consolidate shipments, determine routing, select ocean carriers, contract for ocean shipments, [removed: and] [added: and/or] provide for local pickup and delivery of shipments. |
| • | [removed: Air-As] [added: Air: As] a certified indirect air carrier (“Indirect Air [removed: Carrier”)] [added: Carrier”] or [added: “IAC”) or] freight forwarder, we organize air shipments and provide door-to-door service. |
| • | [removed: Customs-Our] [added: Customs: Our] customs brokers are licensed and regulated by U.S. Customs and Border Protection to assist importers and exporters in meeting federal requirements governing imports and exports. |
| • | Other Logistics [removed: Services-We] [added: Services: We] provide fee-based managed services, warehousing services, small parcel, and other services. |
Once the contracted carrier is selected, we receive the contract [removed: carriers’] [added: carrier’s] commitment to provide the transportation.
During the time when a shipment is executed, we connect [removed: continuously] [added: frequently] with the contract carrier to track the status of the shipment [removed: and assure that] [added: to meet] the unique needs of [removed: each of] our [removed: customers is satisfied.][added: customers.]
[added: In the cases where we have agreed (either] contractually or otherwise) to pay for claims for damage to freight while in transit, we pursue reimbursement from the contracted carrier for the claims.
We will analyze [removed: the] customers’ current transportation rate structures, modes of shipping, and carrier selection.
Our transportation services are provided to numerous international [removed: customers through our worldwide network.]
See Note [removed: 10] [added: 9] to our [removed: 2016] [added: 2017] consolidated financial statements included in Part II, Item 8 of this report for disclosure of our total revenues from domestic and foreign customers for the years ended December 31, [added: 2017,] 2016, [removed: 2015,] and [removed: 2014] [added: 2015] and our long-lived assets as of December 31, [added: 2017,] 2016, [removed: 2015,] and [removed: 2014] [added: 2015] in the United States and in foreign locations.
The table below shows our net revenues by transportation mode, for the years ended December [removed: 31,] [added: 31] (in thousands):
| | [removed: 2016] [added: 2017] | | | | [removed: 2015] [added: 2016] | | | | [removed: 2014] [added: 2015] | | | | [removed: 2013] [added: 2014] | | | | [removed: 2012] [added: 2013] | | |
| Truckload [removed: (1)] | $ | [removed: 1,257,191] [added: 1,229,999] | | | $ | [removed: 1,316,533] [added: 1,257,191] | | | $ | [removed: 1,190,372] [added: 1,316,533] | | | $ | [removed: 1,065,315] [added: 1,190,372] | | | $ | [removed: 1,113,116] [added: 1,065,315] | |
| LTL | [removed: 381,817] [added: 407,012] | | | | [removed: 360,706] [added: 381,817] | | | | [removed: 258,884] [added: 360,706] | | | | [removed: 239,477] [added: 258,884] | | | | [removed: 224,160] [added: 239,477] | | |
| Intermodal | [removed: 33,482] [added: 29,145] | | | | [removed: 41,054] [added: 33,482] | | | | [removed: 40,631] [added: 41,054] | | | | [removed: 39,084] [added: 40,631] | | | | [removed: 38,815] [added: 39,084] | | |
| Ocean | [removed: 244,276] [added: 290,630] | | | | [removed: 223,643] [added: 244,276] | | | | [removed: 208,422] [added: 223,643] | | | | [removed: 187,671] [added: 208,422] | | | | [removed: 84,924] [added: 187,671] | | |
| Air | [removed: 82,167] [added: 100,761] | | | | [removed: 79,096] [added: 82,167] | | | | [removed: 79,125] [added: 79,096] | | | | [removed: 73,089] [added: 79,125] | | | | [removed: 44,444] [added: 73,089] | | |
| Customs | [removed: 50,509] [added: 70,952] | | | | [removed: 43,929] [added: 50,509] | | | | [removed: 41,575] [added: 43,929] | | | | [removed: 36,578] [added: 41,575] | | | | [removed: 18,225] [added: 36,578] | | |
| Other Logistics Services | [removed: 105,369] [added: 117,117] | | | | [removed: 82,548] [added: 105,369] | | | | [removed: 73,097] [added: 82,548] | | | | [removed: 67,931] [added: 73,097] | | | | [removed: 57,449] [added: 67,931] | | |
| Total | $ | [removed: 2,154,811] [added: 2,245,616] | | | $ | [removed: 2,147,509] [added: 2,154,811] | | | $ | [removed: 1,892,106] [added: 2,147,509] | | | $ | [removed: 1,709,145] [added: 1,892,106] | | | $ | [removed: 1,581,133] [added: 1,709,145] | |
Transportation services accounted for approximately 95 percent of net revenues in [removed: 2016 and 2015,] [added: 2017, 2016,] and [removed: 94 percent of our net revenues in 2014.][added: 2015.]
Because of its perishable nature, produce must be rapidly [removed: packaged,] [added: packaged;] carefully transported within tight timetables, usually in temperature controlled [removed: equipment,] [added: equipment;] and quickly distributed to replenish high-turnover inventories maintained by [removed: grocery retailers, restaurants, foodservice distributors, and produce wholesalers.][added: our customers.]
In many instances, we consolidate individual [removed: customers’] [added: customer’s] produce orders into truckload quantities at the point of origin and arrange for transportation of the truckloads, often to multiple destinations.
We continually look to grow through selective acquisitions.
In August 2017, we acquired Milgram & Company Ltd. (“Milgram”), a provider of freight forwarding, customs brokerage, and surface transportation primarily in Canada.
The acquisition strengthens our freight forwarding and customs brokerage offerings in Canada.
Milgram operates primarily in our Global Forwarding segment.
On January 1, 2015, we acquired all of the outstanding stock of Freightquote.com, Inc. (“Freightquote”) for the purpose of enhancing our less than truckload (“LTL”) and truckload businesses and expanding our ecommerce capabilities.
Freightquote operates in our NAST segment.
Net revenues are a Non-GAAP financial measure calculated as total revenues less the cost of purchased transportation and related services and the cost of purchased products sourced for resale.
The reconciliation of total revenues to net revenues is presented below (in thousands):
| | | | | | | | | | | | | |
| --- | --- | --- | --- | --- | --- | --- | --- | --- | --- | --- | --- | --- |
| | | | | | | | | | | | | |
| | | For the years ended December 31, | | | | | | | | | | |
| | | 2017 | | | | 2016 | | | | 2015 | | |
| Revenues: | | | | | | | | | | | | |
| Transportation | | $ | 13,502,906 | | | $ | 11,704,745 | | | $ | 11,989,780 | |
| Sourcing | | 1,366,474 | | | | 1,439,668 | | | | 1,486,304 | | |
| Total revenues | | 14,869,380 | | | | 13,144,413 | | | | 13,476,084 | | |
| Costs and expenses: | | | | | | | | | | | | |
| Purchased transportation and related services | | 11,257,290 | | | | 9,549,934 | | | | 9,842,271 | | |
| Purchased products sourced for resale | | 1,244,040 | | | | 1,316,951 | | | | 1,365,333 | | |
| Total costs and expenses | | 12,501,330 | | | | 10,866,885 | | | | 11,207,604 | | |
| Net revenues | | $ | 2,368,050 | | | $ | 2,277,528 | | | $ | 2,268,480 | |
customers through our worldwide network.
Robinson Fresh sources products from around the world.
To strengthen and maintain our relationships with motor carriers, our employees regularly communicate with
We operate both as a consolidator and as a transactional IAC in the United States and internationally.
The Navisphere Vision web-based product allows our customers to see all of their freight across all modes and services globally in a single view.
Details of shipment contents, status of shipments based on milestones, disruptions to shipments and resulting estimated time of arrival adjustment using Artificial Intelligence are provided for the user to manage their supply chain exceptions.
Collaboration, intelligent notifications, and performance score carding allow customers to manage their supply chain and identify inefficiencies.
The Navisphere Driver mobile application provides drivers with load status automation capabilities.
Drivers can elect to allow the application to complete all stop updates and in-transit calls.
Drivers can also capture and upload bill of lading documentation to initiate payment processes.
The high fidelity track and trace capabilities give our systems and customers frequent load status information.
Our transportation services are primarily provided through our NAST and Global Forwarding reportable segments.
We have augmented our growth through selective acquisitions.
Our net revenues are our total revenues less purchased transportation and related services, including contracted motor carrier, rail, ocean, air, and other costs, and the purchase price and services related to the products we sell.
In the cases where we have agreed (either
____________________________
(1) Prior to 2015, we reported revenues from the fees we earn from our cash advance option offered to our contract carriers separately from transportation revenues.
Starting in the first quarter of 2015, on a retrospective basis, we are reporting these payment services revenues as a part of transportation total and net revenues.
The increase in LTL in 2015 was primarily due to the acquisition of Freightquote.com, Inc. (“Freightquote”) on January 1, 2015.
The increases in ocean, air, and customs revenues in 2013 were primarily related to our acquisition of
Phoenix International Freight Services, Ltd., (“Phoenix”), on November 1, 2012.
In late 2016, we made changes to our internal financial information that we use to make decisions, including the allocation of all shared costs to the business segments.
We group offices primarily by services they provide.
Robinson Fresh sources products from around the world and has a physical presence in North America, Europe, Asia, and South America.
Within our 401(k) plan, employees can also receive profit sharing contributions that depend on our overall profitability and other factors.
In 2016, we continued to expand our corporate sales, account management, and marketing support to enhance sales capabilities.
Our executives and our corporate sales staff support our offices in the pursuit of new business with companies that have more complex logistics requirements.
We operate both as a consolidator and as a transactional Indirect Air Carrier (“IAC”) internationally and in North America.
An excerpt. Shown here: 40 of 93 rewritten, all 33 added and all 17 removed. The counts are complete. For every sentence, read Item 1. BUSINESS in the FY2017 filing and the FY2016 filing.
Cover and table of contents
29 rewritten, 8 added, 7 removed, 54 unchanged
Read the full itemFY2017 item · filed February 28, 2018FY2016 item · filed March 1, 2017
For the fiscal year ended December 31, [removed: 2016][added: 2017]
| Common Stock, par value $.10 per share [removed: Preferred Share Purchase Rights] | | The NASDAQ [removed: National] [added: Global Select] Market |
Indicate by check mark whether the registrant is a large accelerated filer, an accelerated filer, a non-accelerated filer, [removed: or] a smaller reporting [added: company, or emerging growth] company.
See definitions of “large accelerated filer,” “accelerated filer,” [removed: and] “smaller reporting [added: company,” “emerging growth] company” in Rule 12b-2 of the Exchange Act.
| Large accelerated filer | [removed: |] ý | [removed: |] Accelerated filer | [added: ¨] | [added: Non-accelerated filer |] ¨ | [added: Smaller reporting company | ¨ |]
The aggregate market value of voting stock held by non-affiliates of the registrant as of June 30, [removed: 2016] [added: 2017] was approximately [removed: $10,572,633,621] [added: $9,616,075,533] (based upon the closing price of [removed: $74.25] [added: $68.68] per common share on that date as quoted on The NASDAQ Global Select Market).
As of February [removed: 24, 2017,] [added: 22, 2018,] the number of shares outstanding of the registrant’s common stock, par value $.10 per share, was [removed: 141,359,579.][added: 139,748,794.]
Portions of the Registrant’s Proxy Statement relating to its Annual Meeting of Stockholders to be held May [removed: 12, 2017] [added: 10, 2018] (the “Proxy Statement”), are incorporated by reference in Part III.
For the Year Ended December 31, [removed: 2016][added: 2017]
| Item 1. | [removed: [Business](#sFB4FDF7607157DF7037C4F0530268792)] [added: [Business](#sAB95DB0222905CBEB0C121F6229FA398)] | [removed: [3](#sFB4FDF7607157DF7037C4F0530268792)] [added: [3](#sAB95DB0222905CBEB0C121F6229FA398)] |
| Item 1A. | [Risk [removed: Factors](#sD2A6532AFAF3A07E90B04F052EC99706)] [added: Factors](#sA86C06570E2951BF99860A9485AE94BB)] | [removed: [14](#sD2A6532AFAF3A07E90B04F052EC99706)] [added: [14](#sA86C06570E2951BF99860A9485AE94BB)] |
| Item 1B. | [Unresolved Staff [removed: Comments](#s2BF5FD9418077A3A371E4F0538AF8885)] [added: Comments](#sDA11A7964F01574B8119E14665AA726C)] | [removed: [18](#s2BF5FD9418077A3A371E4F0538AF8885)] [added: [18](#sDA11A7964F01574B8119E14665AA726C)] |
| Item 2. | [removed: [Properties](#s8D51F98E79620C45877C4F0538E00B8D)] [added: [Properties](#sA57182C06BD953DDBB3A084E4AEC5967)] | [removed: [19](#s8D51F98E79620C45877C4F0538E00B8D)] [added: [19](#sA57182C06BD953DDBB3A084E4AEC5967)] |
| Item 3. | [Legal [removed: Proceedings](#s1CDEC199DDE2A203BCF34F0539017BBD)] [added: Proceedings](#s42F62C99C69852E2B743D03A13C3D45C)] | [removed: [20](#s1CDEC199DDE2A203BCF34F0539017BBD)] [added: [20](#s42F62C99C69852E2B743D03A13C3D45C)] |
| Item 4. | [Mine Safety [removed: Disclosures](#s4B18C3157D6E3702F94A4F0539341BA6)] [added: Disclosures](#sBF2ADD3B68DB5225A4453D61CF869E30)] | [removed: [20](#s4B18C3157D6E3702F94A4F0539341BA6)] [added: [20](#sBF2ADD3B68DB5225A4453D61CF869E30)] |
| Item 5. | [Market for Registrant’s Common Equity, Related Stockholder Matters, and Issuer Purchases of Equity [removed: Securities](#s179C00C2E4D129654FFC4F052DD64F2C)] [added: Securities](#sBC13A67BB8245A1C8E2275B68D8F4052)] | [removed: [21](#s179C00C2E4D129654FFC4F052DD64F2C)] [added: [21](#sBC13A67BB8245A1C8E2275B68D8F4052)] |
| Item 6. | [Selected Financial [removed: Data](#s0BAA83DFAD8F538E7E144F0539AA09CB)] [added: Data](#s25B05C532FCC52E68F0B8B0CE4ABEB5B)] | [removed: [23](#s0BAA83DFAD8F538E7E144F0539AA09CB)] [added: [23](#s25B05C532FCC52E68F0B8B0CE4ABEB5B)] |
| Item 7. | [Management’s Discussion and Analysis of Financial Condition and Results of [removed: Operations](#s83361D07C09330E445934F053A0A3325)] [added: Operations](#s4D449318C7C95FC3B515810DA99C531B)] | [removed: [24](#s83361D07C09330E445934F053A0A3325)] [added: [24](#s4D449318C7C95FC3B515810DA99C531B)] |
| Item 7A. | [Quantitative and Qualitative Disclosures about Market [removed: Risk](#s6C6D6325951C4BB3DA6A4F053B6422A4)] [added: Risk](#s1A64C06661F45B20BD6E8868F00E1F35)] | [removed: [35](#s6C6D6325951C4BB3DA6A4F053B6422A4)] [added: [35](#s1A64C06661F45B20BD6E8868F00E1F35)] |
| Item 8. | [Financial Statements and Supplementary [removed: Data](#s09253A998819375B9EC64F053B6FAFC2)] [added: Data](#sC9ECBD8E1CB25BB28764BB06AE5E6802)] | [removed: [36](#s09253A998819375B9EC64F053B6FAFC2)] [added: [36](#sC9ECBD8E1CB25BB28764BB06AE5E6802)] |
| Item 9. | [Changes in and Disagreements with Accountants on Accounting and Financial [removed: Disclosure](#s320A1D1D0330AB13F04D4F053F63A40D)] [added: Disclosure](#s2D81ED978FE256B088A4FE2CEE9617D7)] | [removed: [64](#s320A1D1D0330AB13F04D4F053F63A40D)] [added: [64](#s2D81ED978FE256B088A4FE2CEE9617D7)] |
| Item 9A. | [Controls and [removed: Procedures](#sD95B48B82899547460D24F053F84792A)] [added: Procedures](#sE4BE46CF8D465B0580DC94FC05D7B8E4)] | [removed: [64](#sD95B48B82899547460D24F053F84792A)] [added: [64](#sE4BE46CF8D465B0580DC94FC05D7B8E4)] |
| Item 9B. | [Other [removed: Information](#sBC88D34F667044C6366A4F053FB7E2C1)] [added: Information](#s1FE1430CA09455A49DB696E32A030F40)] | [removed: [64](#sBC88D34F667044C6366A4F053FB7E2C1)] [added: [64](#s1FE1430CA09455A49DB696E32A030F40)] |
| Item 10. | [Directors, Executive Officers, and Corporate [removed: Governance](#sB27DBC5D47E3CE82D7554F05400954AC)] [added: Governance](#s7865A94E3BBA53B09DEBACBA5F8045EE)] | [removed: [65](#sB27DBC5D47E3CE82D7554F05400954AC)] [added: [65](#s7865A94E3BBA53B09DEBACBA5F8045EE)] |
| Item 11. | [Executive [removed: Compensation](#s427717013E42FC8522144F05402ABE4C)] [added: Compensation](#s278B83C4E60052EE9888D979512EC6F3)] | [removed: [65](#s427717013E42FC8522144F05402ABE4C)] [added: [65](#s278B83C4E60052EE9888D979512EC6F3)] |
| Item 12. | [Security Ownership of Certain Beneficial Owners and Management and Related Stockholder [removed: Matters](#sD13849CD0DF0451C31F04F05405C8594)] [added: Matters](#s685E063F0F4F58DA8E7F5B102CE1BB8E)] | [removed: [65](#sD13849CD0DF0451C31F04F05405C8594)] [added: [65](#s685E063F0F4F58DA8E7F5B102CE1BB8E)] |
| Item 13. | [Certain Relationships and Related Transactions, and Director [removed: Independence](#s15292A9D769145656DC74F05407ED9AE)] [added: Independence](#s70DB9FC4BFB251FABF545F778E0D81B1)] | [removed: [65](#s15292A9D769145656DC74F05407ED9AE)] [added: [65](#s70DB9FC4BFB251FABF545F778E0D81B1)] |
| Item 14. | [Principal Accounting Fees and [removed: Services](#sD05D204DA8165241C0444F0540B11B79)] [added: Services](#sBBBB463D7610509ABAAD930FFCA272EA)] | [removed: [66](#sD05D204DA8165241C0444F0540B11B79)] [added: [66](#sBBBB463D7610509ABAAD930FFCA272EA)] |
| Item 15. | [Exhibits, Financial Statement [removed: Schedules](#sFA8717A205A2C11F43A84F0527542280)] [added: Schedules](#sD24545014BE0586696A9916242827B7A)] | [removed: [66](#sFA8717A205A2C11F43A84F0527542280)] [added: [66](#sD24545014BE0586696A9916242827B7A)] |
10-K 1 chrw-10k2017.htm 10-K
| | | | | | | | |
| --- | --- | --- | --- | --- | --- | --- | --- |
| | | | | | | | |
| | | | | | | | |
| Emerging growth company | ¨ | | | | | | |
If an emerging growth company, indicate by check mark if the registrant has elected not to use the extended transition period for complying with any new or revised financial accounting standards provided pursuant to Section 13(a) of the Exchange Act.¨
| | [Signatures](#sB42B5716803E5AF892B9AC128542968A) | [69](#sB42B5716803E5AF892B9AC128542968A) |
10-K 1 chrw-10k2016.htm 10-K
| | | | | | | |
| --- | --- | --- | --- | --- | --- | --- |
| | | | | | | |
| | | | | | | |
| Non-accelerated filer | | ¨ | | Smaller reporting company | | ¨ |
| | [Signatures](#s07628B8F1A9A8F7885D94F054124236B) | [67](#s07628B8F1A9A8F7885D94F054124236B) |
Item 2. PROPERTIES
6 rewritten, 3 added, 4 removed, 49 unchanged
Read the full itemFY2017 item · filed February 28, 2018FY2016 item · filed March 1, 2017
| Amsterdam, [removed: NL] [added: Netherlands] | 37,000 | |
| Shanghai, [removed: CN] [added: China] | [removed: 29,000] [added: 43,000] | |
| (1) | [removed: These properties are] [added: This property is] owned. All other properties in the table above are leased from third parties. |
We also own or lease warehouses totaling approximately [removed: 1.4] [added: 1.5] million square feet of space in nearly 40 cities around the world.
| Bydgoszcz, [removed: PL] [added: Poland] | 52,000 | |
We have entered into a lease for a [removed: portion of a] building to be built in Chicago, Illinois, with a substantial completion date in 2018.
| Miami, FL | 25,200 | |
| Rancho Dominguez, CA | 130,000 | |
| San Bernardino, CA | 105,000 | |
Additionally, during 2016, we completed construction of a second data recovery center of 32,000 square feet in southeastern Minnesota.
| Atlanta, GA | 27,350 | |
| Elk Grove Village, IL | 25,000 | |
| San Bernardino, CA | 104,500 | |
Item 5. MARKET FOR REGISTRANT’S COMMON EQUITY, RELATED STOCKHOLDER MATTERS, AND ISSUER PURCHASES OF EQUITY SECURITIES
11 rewritten, 8 added, 8 removed, 21 unchanged
Read the full itemFY2017 item · filed February 28, 2018FY2016 item · filed March 1, 2017
Financial Statements and Supplementary Data, Note [removed: 13.][added: 12.]
On February [removed: 24, 2017,] [added: 22, 2018,] the closing sales price per share of our common stock as quoted on the NASDAQ Global Select Market was [removed: $80.13] [added: $90.09] per share.
On February [removed: 24, 2017,] [added: 22, 2018,] there were approximately [removed: 148] [added: 140] holders of record and approximately [removed: 84,799] [added: 79,442] beneficial owners of our common stock.
We declared quarterly dividends during [removed: 2015] [added: 2016] aggregating to [removed: $1.57] [added: $1.74] per share and quarterly dividends during [removed: 2016] [added: 2017] aggregating to [removed: $1.74] [added: $1.81] per share.
We have declared a quarterly dividend of [removed: $0.45] [added: $0.46] per share payable to shareholders of record as of March [removed: 3, 2017,] [added: 2, 2018,] payable on March [removed: 31, 2017.][added: 30, 2018.]
The following table provides information about company purchases of common stock during the quarter ended December 31, [removed: 2016:][added: 2017:]
(a) The total number of shares purchased includes: (i) [removed: 913,100] [added: 662,144] shares of common stock purchased under the authorization described below; and (ii) [removed: 6,372] [added: 10,257] shares of common stock surrendered to satisfy [removed: minimum] statutory tax [added: withholding] obligations under our stock incentive plans.
As of December 31, [removed: 2016,] [added: 2017,] there were [removed: 4,418,564] [added: 1,992,157] shares remaining for future repurchases under this authorization.
The graph tracks the performance of a $100 investment in our common stock and in each index (with the reinvestment of all dividends) from December 31, [removed: 2011] [added: 2012,] to December 31, [removed: 2016.][added: 2017.]
[removed: ][added: 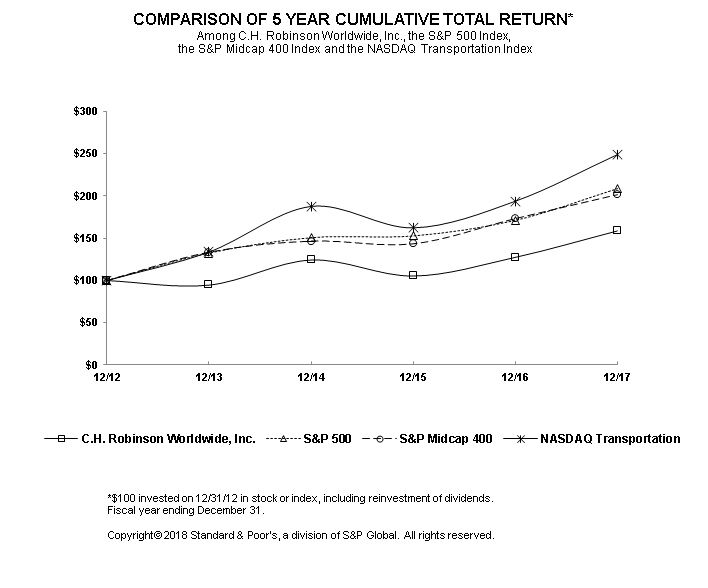]
| | [removed: 2011 | | | |] 2012 | | | [added: |] 2013 | | | 2014 | | | 2015 | | | 2016 | | [added: | 2017 | |]
| October 1, 2017-October 31, 2017 | 573,266 | | | $ | 77.49 | | | 567,793 | | | 2,086,508 | |
| November 1, 2017-November 30, 2017 | 41,124 | | | 80.30 | | | | 37,307 | | | 2,049,201 | |
| December 1, 2017-December 31, 2017 | 58,011 | | | 87.60 | | | | 57,044 | | | 1,992,157 | |
| Fourth quarter 2017 | 672,401 | | | $ | 78.53 | | | 662,144 | | | 1,992,157 | |
| C.H. Robinson Worldwide, Inc. | $ | 100.00 | | | 94.59 | | | 124.24 | | | 105.33 | | | 127.44 | | | 158.69 | |
| S&P 500 | $ | 100.00 | | | 132.39 | | | 150.51 | | | 152.59 | | | 170.84 | | | 208.14 | |
| S&P Midcap 400 | $ | 100.00 | | | 133.50 | | | 146.54 | | | 143.35 | | | 173.08 | | | 201.20 | |
| NASDAQ Transportation | $ | 100.00 | | | 133.76 | | | 187.65 | | | 162.30 | | | 193.79 | | | 248.92 | |
| October 1, 2016-October 31, 2016 | 304,383 | | | $ | 69.25 | | | 302,100 | | | 5,029,564 | |
| November 1, 2016-November 30, 2016 | 81,430 | | | 74.83 | | | | 80,000 | | | 4,949,564 | |
| December 1, 2016-December 31, 2016 | 533,659 | | | 75.15 | | | | 531,000 | | | 4,418,564 | |
| Fourth quarter 2016 | 919,472 | | | $ | 73.18 | | | 913,100 | | | 4,418,564 | |
| C.H. Robinson Worldwide, Inc. | $ | 100.00 | | | 92.62 | | | 87.61 | | | 115.07 | | | 97.55 | | | 118.03 | |
| S&P 500 | $ | 100.00 | | | 116.00 | | | 153.58 | | | 174.60 | | | 177.01 | | | 198.18 | |
| S&P Midcap 400 | $ | 100.00 | | | 117.88 | | | 157.37 | | | 172.74 | | | 168.98 | | | 204.03 | |
| NASDAQ Transportation | $ | 100.00 | | | 106.01 | | | 143.98 | | | 202.99 | | | 173.16 | | | 207.87 | |
Item 6. SELECTED FINANCIAL DATA
16 rewritten, 0 added, 4 removed, 17 unchanged
Read the full itemFY2017 item · filed February 28, 2018FY2016 item · filed March 1, 2017
| Year Ended December 31, | [removed: 2016] [added: 2017] | | | | [removed: 2015] [added: 2016] | | | | [removed: 2014] [added: 2015] | | | | [removed: 2013] [added: 2014] | | | | [removed: 2012 (1)] [added: 2013] | | |
| Total revenues | $ | [removed: 13,144,413] [added: 14,869,380] | | | $ | [removed: 13,476,084] [added: 13,144,413] | | | $ | [removed: 13,470,067] [added: 13,476,084] | | | $ | [removed: 12,752,076] [added: 13,470,067] | | | $ | [removed: 11,359,113] [added: 12,752,076] | |
| Net revenues | [removed: 2,277,528] [added: 2,368,050] | | | | [removed: 2,268,480] [added: 2,277,528] | | | | [removed: 2,007,652] [added: 2,268,480] | | | | [removed: 1,836,095] [added: 2,007,652] | | | | [removed: 1,717,571] [added: 1,836,095] | | |
| Income from operations | [removed: 837,531] [added: 775,119] | | | | [removed: 858,310] [added: 837,531] | | | | [removed: 748,418] [added: 858,310] | | | | [removed: 682,650] [added: 748,418] | | | | [removed: 675,320] [added: 682,650] | | |
| Net income | [removed: 513,384] [added: 504,893] | | | | [removed: 509,699] [added: 513,384] | | | | [removed: 449,711] [added: 509,699] | | | | [removed: 415,904] [added: 449,711] | | | | [removed: 593,804] [added: 415,904] | | |
| Basic | $ | [removed: 3.60] [added: 3.59] | | | $ | [removed: 3.52] [added: 3.60] | | | $ | [removed: 3.06] [added: 3.52] | | | $ | [removed: 2.65] [added: 3.06] | | | $ | [removed: 3.68] [added: 2.65] | |
| Diluted | $ | [removed: 3.59] [added: 3.57] | | | $ | [removed: 3.51] [added: 3.59] | | | $ | [removed: 3.05] [added: 3.51] | | | $ | [removed: 2.65] [added: 3.05] | | | $ | [removed: 3.67] [added: 2.65] | |
| Basic | [removed: 142,706] [added: 140,610] | | | | [removed: 144,967] [added: 142,706] | | | | [removed: 147,202] [added: 144,967] | | | | [removed: 156,915] [added: 147,202] | | | | [removed: 161,557] [added: 156,915] | | |
| Diluted | [removed: 142,991] [added: 141,382] | | | | [removed: 145,349] [added: 142,991] | | | | [removed: 147,542] [added: 145,349] | | | | [removed: 157,080] [added: 147,542] | | | | [removed: 161,946] [added: 157,080] | | |
| Dividends per share | $ | [removed: 1.74] [added: 1.81] | | | $ | [removed: 1.57] [added: 1.74] | | | $ | [removed: 1.43] [added: 1.57] | | | $ | [removed: 1.40] [added: 1.43] | | | $ | [removed: 1.34] [added: 1.40] | |
| Working capital | $ | [removed: 162,384] [added: 523,487] | | | $ | [removed: 282,101] [added: 162,384] | | | $ | [removed: 529,599] [added: 282,101] | | | $ | [removed: 394,504] [added: 529,599] | | | $ | [removed: 440,073] [added: 394,504] | |
| Total assets | [removed: 3,687,758] [added: 4,235,834] | | | | [removed: 3,184,358] [added: 3,687,758] | | | | [removed: 3,214,338] [added: 3,184,358] | | | | [removed: 2,802,818] [added: 3,214,338] | | | | [removed: 2,804,225] [added: 2,802,818] | | |
| Current portion of debt | [removed: 740,000] [added: 715,000] | | | | [removed: 450,000] [added: 740,000] | | | | [removed: 605,000] [added: 450,000] | | | | [removed: 375,000] [added: 605,000] | | | | [removed: 253,646] [added: 375,000] | | |
| Long-term notes payable | [removed: 500,000] [added: 750,000] | | | | 500,000 | | | | 500,000 | | | | 500,000 | | | | [removed: —] [added: 500,000] | | |
| Stockholders’ investment | [removed: 1,257,847] [added: 1,425,745] | | | | [removed: 1,150,450] [added: 1,257,847] | | | | [removed: 1,047,015] [added: 1,150,450] | | | | [removed: 939,724] [added: 1,047,015] | | | | [removed: 1,504,372] [added: 939,724] | | |
| Employees | [removed: 14,125] [added: 15,074] | | | | [removed: 13,159] [added: 14,125] | | | | [removed: 11,521] [added: 13,159] | | | | [removed: 11,676] [added: 11,521] | | | | [removed: 10,929] [added: 11,676] | | |
_________________________
| | |
| --- | --- |
| (1) | The company’s results for 2012 were effected by certain significant event-specific charges or credits related to our acquisitions and divestitures. The adjustment to income from operations includes $34.6 million of personnel expense and $10.6 million of other selling, general, and administrative expenses. Adjustments to personnel expense include $33.0 million in incremental vesting expense of our equity awards triggered by the gain on the divestiture of T-Chek Systems, Inc., (“T-Chek”) and $1.4 million of transaction-related bonuses. Adjustments to other selling, general, and administrative expenses include amounts paid to third parties for investment banking, legal, and accounting fees related to acquisitions and divestitures. The adjustment to interest and other (expense) income reflects the gain from the divestiture of T-Chek. |
Item 8. FINANCIAL STATEMENTS AND SUPPLEMENTARY DATA
277 rewritten, 199 added, 198 removed, 554 unchanged
Read the full itemFY2017 item · filed February 28, 2018FY2016 item · filed March 1, 2017
The [added: Stockholders and the] Board of Directors [removed: and Stockholders] of
We have audited the accompanying consolidated balance sheets of C.H. Robinson Worldwide, Inc. and subsidiaries (the “Company”) as of December 31, [removed: 2016] [added: 2017] and [removed: 2015,] [added: 2016,] and the related consolidated statements of operations and comprehensive income, stockholders’ investment, and cash flows for each of the three years in the period ended December 31, [removed: 2016.][added: 2017, and the related notes and the schedule listed in the Index at Item 15 (collectively referred to as the "financial statements").]
These [removed: consolidated] financial statements [removed: and financial statement schedule] are the responsibility of the [removed: Company’s] [added: Company's] management.
Our responsibility is to express an opinion on the [removed: consolidated] [added: Company's] financial statements [removed: and financial statement schedule] based on our audits.
Those standards require that we plan and perform the audit to obtain reasonable assurance about whether the financial statements are free of material [removed: misstatement.][added: misstatement, whether due to error or fraud.]
[removed: An audit includes] [added: Such procedures included] examining, on a test basis, evidence supporting the amounts and disclosures in the financial statements.
[removed: An audit] [added: Our audits] also [removed: includes] [added: included] assessing the accounting principles used and significant estimates made by management, as well as evaluating the overall financial statement presentation.
In our opinion, [removed: such consolidated] [added: the] financial statements present fairly, in all material respects, the [removed: consolidated] financial position of [removed: C.H. Robinson Worldwide, Inc. and subsidiaries at] [added: the Company as of] December 31, [removed: 2016] [added: 2017] and [removed: 2015,] [added: 2016,] and the results of their operations and their cash flows for each of the three years in the period ended December 31, [removed: 2016,] [added: 2017,] in conformity with accounting principles generally accepted in the United States of America.
We [removed: also] have [added: also] audited, in accordance with the standards of the Public Company Accounting Oversight Board (United [removed: States),] [added: States) (PCAOB),] the [removed: Company’s] [added: Company's] internal control over financial reporting as of December 31, [removed: 2016,] [added: 2017,] based on [removed: the] criteria established in Internal [removed: Control-Integrated] [added: Control - Integrated] Framework (2013) issued by the Committee of Sponsoring Organizations of the Treadway Commission and our report dated [removed: March 1, 2017] [added: February 28, 2018,] expressed an unqualified opinion on the Company’s internal control over financial reporting.
[removed: ][added: ]
[removed: March 1,] [added: |] 2017 [added: | | March 31 (a) | | | | June 30 | | | | September 30 | | | | December 31 (b) | | |]
To the [added: Stockholders and the] Board of Directors [removed: and Stockholders] of
We have audited the internal control over financial reporting of C.H. Robinson Worldwide, Inc. and subsidiaries (the "Company") as of December 31, [removed: 2016,] [added: 2017,] based on criteria established in Internal Control - Integrated Framework (2013) issued by the Committee of Sponsoring Organizations of the Treadway [removed: Commission.][added: Commission (COSO).]
The [removed: Company's] [added: Company’s] management is responsible for maintaining effective internal control over financial reporting and for its assessment of the effectiveness of internal control over financial reporting, included in the accompanying Management’s Report on Internal [removed: Controls over] [added: Control Over] Financial Reporting.
We conducted our audit in accordance with the standards of the [removed: Public Company Accounting Oversight Board (United States).][added: PCAOB.]
A company's internal control over financial reporting is a process designed [removed: by, or under the supervision of, the company's principal executive and principal financial officers, or persons performing similar functions, and effected by the company's board of directors, management, and other personnel] to provide reasonable assurance regarding the reliability of financial reporting and the preparation of financial statements for external purposes in accordance with generally accepted accounting principles.
Also, projections of any evaluation of the effectiveness [removed: of the internal control over financial reporting] to future periods are subject to the risk that the controls may become inadequate because of changes in conditions, or that the degree of compliance with the policies or procedures may deteriorate.
In our opinion, the Company maintained, in all material respects, effective internal control over financial reporting as of December 31, [removed: 2016,] [added: 2017,] based on [removed: the] criteria established in Internal Control - Integrated Framework (2013) issued by [removed: the Committee of Sponsoring Organizations of the Treadway Commission.][added: COSO.]
We have also audited, in accordance with the standards of the Public Company Accounting Oversight Board (United [removed: States),] [added: States) (PCAOB),] the consolidated financial statements and financial statement schedule as of and for the [added: fiscal] year ended December 31, [removed: 2016] [added: 2017,] of the Company and our report dated [removed: March 1, 2017] [added: February 28, 2018,] expressed an unqualified opinion on those consolidated financial statements and financial statement schedule.
[removed: ][added: ]
| | [added: 2017 | | | |] 2016 | | | | 2015 | | |
| Cash and cash [removed: equivalents | $] [added: equivalents, beginning of year] | 247,666 | | | [removed: $] | 168,229 | | [added: | | 128,940 | | |]
| Receivables, net of allowance for doubtful accounts of [removed: $39,543] [added: $42,409] and [removed: $43,455] [added: $39,543] | [removed: 1,711,191] [added: 2,113,930] | | | | [removed: 1,505,620] [added: 1,711,191] | | |
| Prepaid expenses and other | [removed: 49,245] [added: 63,116] | | | | [removed: 40,061] [added: 49,245] | | |
| Total current assets | [removed: 2,008,102] [added: 2,510,936] | | | | [removed: 1,730,698] [added: 2,008,102] | | |
| Property and equipment | [removed: 450,045] [added: 497,909] | | | | [removed: 379,139] [added: 450,045] | | |
| Accumulated depreciation and amortization | [removed: (217,092] [added: (267,583] | | ) | | [removed: (188,265] [added: (217,092] | | ) |
| Net property and equipment | [removed: 232,953] [added: 230,326] | | | | [removed: 190,874] [added: 232,953] | | |
| Goodwill | [removed: 1,232,796] [added: 1,275,816] | | | | [removed: 1,108,337] [added: 1,232,796] | | |
| Other intangible assets, net of accumulated amortization of [removed: $87,486] [added: $122,283] and [removed: $61,405] [added: $87,486] | [removed: 167,525] [added: 151,585] | | | | [removed: 120,242] [added: 167,525] | | |
| Deferred tax [removed: asset] [added: assets] | [removed: 2,250] [added: 6,870] | | | | [removed: —] [added: 2,250] | | |
| Other assets | [removed: 44,132] [added: 60,301] | | | | [removed: 34,207] [added: 44,132] | | |
| Total assets | $ | [removed: 3,687,758] [added: 4,235,834] | | | $ | [removed: 3,184,358] [added: 3,687,758] | |
| Accounts payable | $ | [removed: 839,736] [added: 1,000,305] | | | $ | [removed: 697,585] [added: 839,736] | |
| Outstanding checks | [removed: 82,052] [added: 96,359] | | | | [removed: 86,298] [added: 82,052] | | |
| Income taxes | [removed: 15,472] [added: 12,240] | | | | [removed: 12,573] [added: 15,472] | | |
| Other accrued liabilities | [removed: 70,351] [added: 58,229] | | | | [removed: 55,475] [added: 70,351] | | |
| Current portion of debt | [removed: 740,000] [added: 715,000] | | | | [removed: 450,000] [added: 740,000] | | |
| Total current liabilities | [removed: 1,845,718] [added: 1,987,449] | | | | [removed: 1,448,597] [added: 1,845,718] | | |
| Long-term debt | [removed: 500,000] [added: 750,000] | | | | 500,000 | | |
Opinion on the Financial Statements
Basis for Opinion
We are a public accounting firm registered with the PCAOB and are required to be independent with respect to the Company in accordance with the U.S. federal securities laws and the applicable rules and regulations of the Securities and Exchange Commission and the PCAOB.
Our audits included performing procedures to assess the risks of material misstatement of the financial statements, whether due to error or fraud, and performing procedures that respond to those risks.
February 28, 2018
We have served as the Company's auditor since 2002.
Opinion on Internal Control over Financial Reporting
Basis for Opinion
We are a public accounting firm registered with the PCAOB and are required to be independent with respect to the Company in accordance with the U.S. federal securities laws and the applicable rules and regulations of the Securities and Exchange Commission and the PCAOB.
Definition and Limitations of Internal Control over Financial Reporting
Because of the inherent limitations of internal control over financial reporting may not prevent or detect misstatements.
February 28, 2018
| | 2017 | | | | 2016 | | |
| Cash and cash equivalents | $ | 333,890 | | | $ | 247,666 | |
| Compensation | 105,316 | | | | 98,107 | | |
| Net income | | | | | | | | | | | | 504,893 | | | | | | | | | | | | 504,893 | | |
| Repurchase of common stock | (2,426 | ) | | (243 | | ) | | | | | | | | | | | | | | (179,742 | | ) | | (179,985 | | ) |
| Balance December 31, 2017 | 139,542 | | | $ | 13,954 | | | $ | 444,280 | | | $ | 3,437,093 | | | $ | (18,460 | ) | | $ | (2,451,122 | ) | | $ | 1,425,745 | |
| Excess tax benefit on stock-based compensation | (13,657 | | ) | | (18,462 | | ) | | (8,548 | | ) |
| Accrued income taxes | 18,817 | | | | 19,921 | | | | 13,726 | | |
| Proceeds from long-term borrowings | 250,000 | | | | — | | | | — | | |
| 2017 | | $ | 42,817 | |
| | | | | |
| --- | --- | --- | --- | --- |
| | | | | |
| 2017 | | $ | 13,887 | |
| | 2017 | | | | 2016 | | |
| Acquisitions | | 3,673 | | | | 24,918 | | | | — | | | | — | | | | 28,591 | | |
| Translation | | 10,583 | | | | 1,905 | | | | 1,627 | | | | 314 | | | | 14,429 | | |
| December 31, 2017 balance | | $ | 921,486 | | | $ | 185,873 | | | $ | 141,185 | | | $ | 27,272 | | | $ | 1,275,816 | |
We first perform a qualitative assessment to determine whether it is more likely than not that the fair value of our reporting units is less than their respective carrying value (“Step Zero analysis”).
If the Step Zero analysis indicates it is more likely than not that the fair value of our reporting units is less than their respective carrying value, and additional impairment assessment is performed (“Step One Analysis”).
Refer to Critical Accounting Policies and Estimates.
No goodwill impairment has been recorded in any period presented.
| | 2017 | | | | | | | | | | | | 2016 | | | | | | | | | | |
| Customer relationships | $ | 263,093 | | | $ | (122,103 | ) | | $ | 140,990 | | | $ | 244,036 | | | $ | (87,199 | ) | | $ | 156,837 | |
| Total intangibles | $ | 273,868 | | | $ | (122,283 | ) | | $ | 151,585 | | | $ | 255,011 | | | $ | (87,486 | ) | | $ | 167,525 | |
| 2017 | $ | 36,273 | |
| 2018 | $ | 7,820 | | | $ | 29,297 | | | $ | — | | | $ | 41 | | | $ | 37,158 | |
| 2019 | 7,820 | | | | 29,297 | | | | — | | | | — | | | | 37,117 | | |
Eden Prairie, Minnesota
Our audits also included the financial statement schedule listed in the Index at Item 15.
Also, in our opinion, such financial statement schedule, when considered in relation to the basic consolidated financial statements taken as a whole, presents fairly, in all material respects, the information set forth therein.
Eden Prairie, Minnesota
Because of the inherent limitations of internal control over financial reporting, including the possibility of collusion or improper management override of controls, material misstatements due to error or fraud may not be prevented or detected on a timely basis.
March 1, 2017
| Deferred tax asset | — | | | | 16,788 | | |
| Compensation | 98,107 | | | | 146,666 | | |
| | | | | | | | | | | | |
| --- | --- | --- | --- | --- | --- | --- | --- | --- | --- | --- | --- |
| | | | | | | | | | | | |
| Balance December 31, 2013 | 150,197 | | | $ | 15,020 | | | $ | 217,894 | | | $ | 2,413,833 | | | $ | (10,620 | ) | | $ | (1,696,403 | ) | | $ | 939,724 | |
| Net income | | | | | | | | | | | | 449,711 | | | | | | | | | | | | 449,711 | | |
| Excess tax benefit on deferred compensation and employee stock plans | | | | | | | | 7,558 | | | | | | | | | | | | | | | | 7,558 | | |
| Repurchase of common stock | (3,764 | ) | | (376 | | ) | | 75,000 | | | | | | | | | | | | (238,661 | | ) | | (164,037 | | ) |
| Gain on divestiture | — | | | | — | | | | (1,848 | | ) |
| Accrued income taxes | 1,459 | | | | 5,178 | | | | (4,370 | | ) |
| Debt issuance costs | — | | | | — | | | | (1,484 | | ) |
| Cash and cash equivalents, beginning of year | 168,229 | | | | 128,940 | | | | 162,047 | | |
Prior to 2015 we reported payment services revenues separately from transportation revenues.
Amounts prior to 2015 have been combined to conform to the current period presentation.
This change in presentation had no effect on our prior year consolidated results of operations, financial condition, or cash flows.
We are also required to disclose contingent assets and liabilities at the date of the financial statements and the reported amounts of revenues and expenses during the reporting period.
| | | | |
| --- | --- | --- | --- |
| | | | |
| 2014 | 29,340 | | |
| 2014 | | 8,921 | | |
Comprehensive income includes any changes in the equity of an enterprise from transactions and other events and circumstances from non-owner sources.
See Note 5.
| December 31, 2014 balance | | $ | 607,156 | | | $ | 106,443 | | | $ | 93,398 | | | $ | 18,041 | | | $ | 825,038 | |
| Acquisitions | | 211,369 | | | | 37,056 | | | | 32,515 | | | | 6,280 | | | | 287,220 | | |
| Translation | | (2,886 | | ) | | (506 | | ) | | (444 | | ) | | (85 | | ) | | (3,921 | | ) |
We evaluate our reporting units on a continual basis and, if necessary, reassign goodwill using a relative fair value allocation approach.
Goodwill is tested for impairment at the reporting unit level on an annual basis and between annual tests if an event occurs or circumstances change that would more likely than not reduce the fair value of a reporting unit below its carrying value.
These events or circumstances could include a significant change in the business climate, legal factors, operating performance indicators, competition, or sale or disposition of a significant portion of a reporting unit.
During the quarter ended December 31, 2016, due to the reorganization of our reporting structure, we concluded that we had seven reporting units.
As a result of this change in reporting units, we allocated goodwill to our reporting units based on each reporting unit’s fair value using a discounted cash flow analysis and market approach.
Additionally at this time, we changed our annual quantitative goodwill impairment testing date from December 31 to November 30 of each year.
The change in the goodwill impairment test date better aligns the impairment testing procedures with the timing of our long-term planning
An excerpt. Shown here: 40 of 277 rewritten, 40 of 199 added and 40 of 198 removed. The counts are complete. For every sentence, read Item 8. FINANCIAL STATEMENTS AND SUPPLEMENTARY DATA in the FY2017 filing and the FY2016 filing.
Item 9A. CONTROLS AND PROCEDURES
9 rewritten, 0 added, 0 removed, 6 unchanged
Read the full itemFY2017 item · filed February 28, 2018FY2016 item · filed March 1, 2017
[removed: Under] [added: As of December 31, 2017, under] the supervision and with the participation of our management, including our Chief Executive Officer and Chief Financial Officer, we evaluated the effectiveness of the design and operation of our disclosure controls and procedures (as defined in Rule 13a-15(e) under the Securities Exchange Act of 1934 (the “Exchange Act”)).
Based upon that evaluation, the Chief Executive Officer and Chief Financial Officer concluded [removed: that, as of the end of the period covered by this report,] [added: that] our disclosure controls and procedures [added: as of December 31, 2017] were effective.
Management’s Report on Internal [removed: Controls] [added: Control] Over Financial Reporting
Our management is responsible for establishing and maintaining adequate internal control over financial [removed: reporting,] [added: reporting] as such term is defined in Rule 13a-15(f) under the Exchange Act.
Under the supervision and with the participation of our management, including our Chief Executive Officer and Chief Financial Officer, we conducted an evaluation of the effectiveness of our internal control over financial reporting [added: as of December 31, 2017] based on the framework in Internal Control-Integrated Framework (2013) issued by the Committee of Sponsoring Organizations of the Treadway Commission.
Based on our evaluation under the framework in Internal Control-Integrated Framework (2013), our management concluded that our internal control over financial reporting was effective as of December 31, [removed: 2016.][added: 2017.]
The effectiveness of our internal control over financial reporting as of December 31, [removed: 2016,] [added: 2017,] has been audited by Deloitte & Touche LLP, an independent registered public accounting firm, as stated in their report, which is included in Item 8.
Changes in Internal [removed: Controls] [added: Control] Over Financial Reporting
There have not been any changes to the company’s internal control over financial reporting during the quarter ended December 31, [removed: 2016,] [added: 2017,] to which this report relates, that have materially affected, or are reasonably likely to materially affect, the company’s internal control over financial reporting.
Item 12. SECURITY OWNERSHIP OF CERTAIN BENEFICIAL OWNERS AND MANAGEMENT AND RELATED STOCKHOLDER MATTERS
4 rewritten, 2 added, 2 removed, 12 unchanged
Read the full itemFY2017 item · filed February 28, 2018FY2016 item · filed March 1, 2017
The following table summarizes share and exercise price information about our equity compensation plans as of December 31, [removed: 2016][added: 2017:]
| Plan Category | | Number of Securities to Be Issued Upon Exercise of Outstanding Options, [removed: Warrants] [added: Warrants,] and Rights | | | Weighted Average Exercise Price of Outstanding Options, [removed: Warrants] [added: Warrants,] and Rights | | | | Number of Securities Remaining Available for Future Issuance Under Equity Compensation Plans (Excluding Securities Reflected in the First Column) | |
Specifically, [removed: 3,433,745] [added: 3,218,132] shares remain available under our Employee Stock Purchase Plan, and [removed: 7,007,923] [added: 7,382,072] options remain outstanding for future exercise.
Under our 2013 Equity Incentive Plan, [removed: 4,851,473] [added: 2,920,099] shares may become subject to future awards in the form of stock option grants or the issuance of restricted stock.
| Equity compensation plans approved by security holders (1) | | 10,600,204 | | | $ | 71.58 | | | 2,920,099 | |
| Total | | 10,600,204 | | | $ | 71.58 | | | 2,920,099 | |
| Equity compensation plans approved by security holders (1) | | 10,432,398 | | | $ | 67.07 | | | 4,851,473 | |
| Total | | 10,432,398 | | | $ | 67.07 | | | 4,851,473 | |
Item 15. EXHIBITS, FINANCIAL STATEMENT SCHEDULES
42 rewritten, 8 added, 9 removed, 118 unchanged
Read the full itemFY2017 item · filed February 28, 2018FY2016 item · filed March 1, 2017
[added: (a)] The following documents are filed as part of this report:
(1) The company’s [removed: 2016] [added: 2017] Consolidated Financial Statements and the Report of Independent Registered Public Accounting Firm are included in Part II, Item 8.
The transactions in the allowance for doubtful accounts for the years ended December [removed: 31] [added: 31,] were as follows (in thousands):
| | [removed: 2016] [added: 2017] | | | | [removed: 2015] [added: 2016] | | | | [removed: 2014] [added: 2015] | | |
| Balance, beginning of year | $ | [removed: 43,455] [added: 39,543] | | | $ | [removed: 41,051] [added: 43,455] | | | $ | [removed: 39,292] [added: 41,051] | |
| Provision | [removed: 5,136] [added: 13,489] | | | | [removed: 11,538] [added: 5,136] | | | | [removed: 15,092] [added: 11,538] | | |
| Write-offs | [removed: (9,048] [added: (10,623] | | ) | | [removed: (9,134] [added: (9,048] | | ) | | [removed: (13,333] [added: (9,134] | | ) |
| Balance, end of year | $ | [removed: 39,543] [added: 42,409] | | | $ | [removed: 43,455] [added: 39,543] | | | $ | [removed: 41,051] [added: 43,455] | |
Pursuant to the requirements of the Section 13 or 15(d) of the Securities Exchange Act of 1934, the registrant has duly caused this Report to be signed on its behalf by the undersigned, thereunto duly authorized, in the City of Eden Prairie, State of Minnesota, on [removed: March 1, 2017.][added: February 28, 2018.]
Pursuant to the requirements of the Securities Exchange Act of 1934, this Report has been signed below by the following persons on behalf of the registrant and in the capacities indicated on [removed: March 1, 2017.][added: February 28, 2018.]
| 2.1 | | [removed: Agreement] [added: [Agreement] and Plan of Merger dated December 1, 2014 among C.H. Robinson Company Inc., Jayhawk Merger Subsidiary, Inc., Freightquote.com, Inc., and the Stockholders’ Representative named therein (Incorporated by reference to Exhibit 2.1 to the Company’s Current Report on Form 8-K dated December 2, [removed: 2014)] [added: 2014)](http://www.sec.gov/Archives/edgar/data/1043277/000119312514430175/d829426dex21.htm)] |
| 2.2 | | [removed: Share] [added: [Share] Sale Agreement dated August 26, 2016 by and among C.H. Robinson (Australia) Pty Ltd, and each of the vendors set forth on Schedule 1 of the Agreement (Incorporated by reference to Exhibit 2.1 to the Company’s Current Report on Form 8-K, filed on August 31, [removed: 2016)] [added: 2016)](http://www.sec.gov/Archives/edgar/data/1043277/000119312516698578/d241715dex21.htm)] |
| 3.1 | | [removed: Certificate] [added: [Certificate] of Incorporation of the Company (as amended on May 19, 2012 and incorporated by reference to Exhibit 3.1 to the Registrant’s Current Report on Form 8-K, filed May 15, [removed: 2012)] [added: 2012)](http://www.sec.gov/Archives/edgar/data/1043277/000119312512233730/d353095dex31.htm)] |
| 3.2 | | [removed: Bylaws] [added: [Bylaws] of the Company (Incorporated by reference to Exhibit 3.2 to the Registrant’s Registration Statement on Form S-1 filed on August 15, 1997, Registration No. [removed: 333-33731)] [added: 333-33731)](http://www.sec.gov/Archives/edgar/data/1043277/0000950109-97-005464.txt)] |
| [removed: 3.3] [added: 4.1] | | [removed: Certificate of Designation] [added: [Form] of [removed: Series A Junior Participating Preferred] [added: Certificate for Common] Stock [removed: of the Company] (Incorporated by reference to Exhibit [removed: 3.3] [added: 4.1] to the Registrant’s Registration Statement on Form S-1 filed on October 9, 1997, Registration No. [removed: 333-33731)] [added: 333-33731, file no. 000-23189)](http://www.sec.gov/Archives/edgar/data/1043277/0001045969-97-000019.txt)] |
| †10.1 | | [removed: 1997] [added: [1997] Omnibus Stock Plan (as amended May 18, 2006) (Incorporated by reference to Appendix A to the Proxy Statement on Form DEF 14A, filed on April 6, 2006, file no. [removed: 000-23189)] [added: 000-23189)](http://www.sec.gov/Archives/edgar/data/1043277/000119312506074936/ddef14a.htm)] |
| †10.2 | | [removed: Amended] [added: [Amended] and restated C.H. Robinson Worldwide, Inc. 2013 Equity Incentive Plan (incorporated by reference to Appendix A to the Proxy Statement on Form DEF 14A filed on April 1, 2016 on file no. [removed: 000-23189)] [added: 000-23189)](http://www.sec.gov/Archives/edgar/data/1043277/000119312516526928/d113799ddef14a.htm)] |
| 10.3 | | [removed: Credit] [added: [Credit] Agreement dated as of October 29, 2012, among C.H. Robinson Worldwide, Inc., the lenders party thereto, and U.S. Bank National Association, as Administrative Agent for the Lenders, as Swing Line Lender and as LC Issuer (Incorporated by reference to Exhibit 10.1 to the Registrant’s Current Report on Form 8-K, filed November 1, [removed: 2012)] [added: 2012)](http://www.sec.gov/Archives/edgar/data/1043277/000119312512446987/d430822dex101.htm)] |
| 10.4 | | [removed: Omnibus] [added: [Omnibus] Amendment dated December 31, 2014 among C.H. Robinson Worldwide, Inc., the guarantors and lenders party thereto and U.S. Bank National Association, as LC Issuer, Swing Line Lender and Administrative Agent for the lenders, to that certain Credit Agreement dated, as of October 29, 2012, by and among the C.H. Robinson Company, Inc., the lenders, and U.S. Bank National Association, as LC Issuer Swing Line Lender and Administrative Agent for the Lenders (Incorporated by reference to Exhibit 10.1 to the Company’s Current Report on Form 8-K filed on January 6, [removed: 2015)] [added: 2015)](http://www.sec.gov/Archives/edgar/data/1043277/000119312515002961/d845863dex101.htm)] |
| 10.5 | | [removed: Letter] [added: [Letter] Agreement dated as of August 24, 2013, by and between C.H. Robinson Worldwide, Inc. and J.P. Morgan Securities LLC, as agent for JP Morgan Chase Bank, National Association (incorporated by reference to Exhibit 10.1 to the Company’s Current Report on Form 8-K filed on August 26, [removed: 2013)] [added: 2013)](http://www.sec.gov/Archives/edgar/data/1043277/000119312513345894/d589271dex101.htm)] |
| 10.6 | | [removed: Letter] [added: [Letter] Agreement dated as of August 24, 2013, by and between C.H. Robinson Worldwide, Inc. and Morgan Stanley & Co. LLC (incorporated by reference to Exhibit 10.2 to the Company’s Current Report on Form 8-K filed on August 26, [removed: 2013)] [added: 2013)](http://www.sec.gov/Archives/edgar/data/1043277/000119312513345894/d589271dex102.htm)] |
| 10.7 | | [removed: Note] [added: [Note] Purchase Agreement dated as of August 23, 2013, by and among the Company and the Purchasers (incorporated by reference to Exhibit 10.3 to the Company’s Current Report on Form 8-K filed on August 26, [removed: 2013)] [added: 2013)](http://www.sec.gov/Archives/edgar/data/1043277/000119312513345894/d589271dex103.htm)] |
| 10.8 | | [removed: First] [added: [First] Amendment to Note Purchase Agreement dated February 20, 2015, by and among the Company and the Purchasers (incorporated by reference to Exhibit 10.8 to the Registrant Annual Report on Form 10-K for the year ended December 31, [removed: 2014)] [added: 2014)](http://www.sec.gov/Archives/edgar/data/1043277/000162828015001350/exhibit108.htm)] |
| [removed: †10.9] [added: †10.15] | | [added: [2012] Form of [removed: Management-Employee] [added: Incentive Stock Option] Agreement [removed: (Key Employee)] (Incorporated by reference to Exhibit [removed: 10.4] [added: 10.13] to the Registrant’s Annual Report on Form 10-K for the year ended December 31, [removed: 2007,] [added: 2011,] file no. [removed: 000-23189)] [added: 000-23189)](http://www.sec.gov/Archives/edgar/data/1043277/000119312512088389/d270024dex1013.htm)] |
| [removed: †10.11] [added: †10.12] | | [removed: C.H.] [added: [C.H.] Robinson Worldwide, Inc. 2015 Non-Equity Incentive Plan (Incorporated by reference to Appendix A to the Proxy Statement on Form DEF 14A, filed on March 27, 2015, file no. [removed: 000-23189)] [added: 000-23189)](http://www.sec.gov/Archives/edgar/data/1043277/000119312515108590/d849590ddef14a.htm)] |
| [removed: †10.12] [added: †10.13] | | [removed: Robinson] [added: [Robinson] Companies Nonqualified Deferred Compensation Plan (Incorporated by reference to Exhibit 10.8 to the Registrant’s Annual Report on 10-K for the year ended December 31, [removed: 2012)] [added: 2012)](http://www.sec.gov/Archives/edgar/data/1043277/000104327713000004/exhibit108.htm)] |
| [removed: †10.13] [added: †10.14] | | [removed: Award] [added: [Award] of Deferred Shares into the Robinson Companies Nonqualified Deferred Compensation Plan, dated December 21, 2000, by and between C.H. Robinson Worldwide, Inc. and John P. Wiehoff (Incorporated by reference to Exhibit 10.22 to the Registrant’s Annual Report on Form 10-K for the year ended December 31, 2000, file no. [removed: 000-23189)] [added: 000-23189)](http://www.sec.gov/Archives/edgar/data/1043277/000095010901500359/dex1022.txt)] |
| [removed: †10.14] [added: †10.16] | | [added: [2012] Form of Restricted Stock Award for U.S. Managerial Employees (Incorporated by reference to Exhibit [removed: 10.12] [added: 10.14] to the Registrant’s Annual Report on Form 10-K for the year ended December 31, [removed: 2008, file no. 000-23189)] [added: 2011)](http://www.sec.gov/Archives/edgar/data/1043277/000119312512088389/d270024dex1014.htm)] |
| [removed: †10.15] [added: †10.18] | | [added: [2012] Form of [added: Time-Based] Restricted [added: Stock] Unit Award [removed: for U.S. Managerial Employees] (Incorporated by reference to Exhibit [removed: 10.13] [added: 10.15] to the Registrant’s Annual Report on Form 10-K for the year ended December 31, [removed: 2008, file no. 000-23189)] [added: 2012)](http://www.sec.gov/Archives/edgar/data/1043277/000104327713000004/exhibit1015.htm)] |
| [removed: †10.16] [added: †10.19] | | [removed: 2012 Form] [added: [Form] of Incentive Stock Option Agreement (Incorporated by reference to Exhibit [removed: 10.13] [added: 10.20] to the Registrant’s Annual Report on Form 10-K for the year ended December 31, [removed: 2011, file no. 000-23189)] [added: 2014)](http://www.sec.gov/Archives/edgar/data/1043277/000162828015001350/exhibit102012312014.htm)] |
| †10.17 | | [removed: 2012] [added: [2012] Form of Restricted Stock Award for [removed: U.S. Managerial Employees] [added: Officers] (Incorporated by reference to Exhibit [removed: 10.14] [added: 10.15] to the Registrant’s Annual Report on Form 10-K for the year ended December 31, [removed: 2011)] [added: 2011)](http://www.sec.gov/Archives/edgar/data/1043277/000119312512088389/d270024dex1015.htm)] |
| [removed: †10.18] [added: †10.22] | | [removed: 2012 Form] [added: [Form] of [added: Time-Based] Restricted Stock [added: Unit] Award [removed: for Officers] (Incorporated by reference to Exhibit [removed: 10.15] [added: 10.23] to the Registrant’s Annual Report on Form 10-K for the year ended December 31, [removed: 2011)] [added: 2014)](http://www.sec.gov/Archives/edgar/data/1043277/000162828015001350/exhibit102312312014.htm)] |
| [removed: †10.19] [added: †10.23] | | [removed: 2012 Form] [added: [Form] of [removed: Time-Based Restricted] [added: Incentive] Stock [removed: Unit Award] [added: Option (Time-Based U.S.) Agreement] (Incorporated by reference to Exhibit [removed: 10.15 to] [added: 10.24 of] the Registrant’s Annual Report on Form 10-K for the year ended December 31, [removed: 2012)] [added: 2015)](http://www.sec.gov/Archives/edgar/data/1043277/000104327716000020/exhibit1024.htm)] |
| †10.20 | | [removed: Form] [added: [Form] of [removed: Incentive Stock Option Agreement] [added: Performance Share Award for Officers] (Incorporated by reference to Exhibit [removed: 10.20] [added: 10.21] to the Registrant’s Annual Report on Form 10-K for the year ended December 31, [removed: 2014)] [added: 2014)](http://www.sec.gov/Archives/edgar/data/1043277/000162828015001350/exhibit102112312014.htm)] |
| †10.21 | | [removed: Form] [added: [Form] of Performance Share Award for [removed: Officers] [added: U.S. Managerial Employees] (Incorporated by reference to Exhibit [removed: 10.21] [added: 10.22] to the Registrant’s Annual Report on Form 10-K for the year ended December 31, [removed: 2014)] [added: 2014)](http://www.sec.gov/Archives/edgar/data/1043277/000162828015001350/exhibit102212312014.htm)] |
| †10.24 | | [removed: Form] [added: [Form] of [removed: Incentive Stock Option (Time-Based U.S.)] [added: Key Employee] Agreement (Incorporated by reference to Exhibit [removed: 10.24 of] [added: 10.22 to] the Registrant’s Annual Report on Form 10-K for the year ended December 31, [removed: 2015)] [added: 2013)](http://www.sec.gov/Archives/edgar/data/1043277/000104327714000004/exhibit102212312013.htm)] |
| †10.25 | | [removed: Form] [added: [Form] of [removed: Key] Employee [added: Confidentiality and Protection of Business] Agreement (Incorporated by reference to Exhibit [removed: 10.22] [added: 10.23] to the Registrant’s Annual Report on Form 10-K for the year ended December 31, [removed: 2013)] [added: 2013)](http://www.sec.gov/Archives/edgar/data/1043277/000104327714000004/exhibit102312312013.htm)] |
| *31.1 | | [removed: Certification] [added: [Certification] of the Chief Executive Officer pursuant to Section 302 of the Sarbanes-Oxley Act of [removed: 2002] [added: 2002](https://www.sec.gov/Archives/edgar/data/1043277/000104327718000007/chrw10k-ex31112312017.htm)] |
| *31.2 | | [removed: Certification] [added: [Certification] of the Chief Financial Officer pursuant to Section 302 of the Sarbanes-Oxley Act of [removed: 2002] [added: 2002](https://www.sec.gov/Archives/edgar/data/1043277/000104327718000007/chrw10k-ex31212312017.htm)] |
| *32.1 | | [removed: Certification] [added: [Certification] of the Chief Executive Officer pursuant to Section 906 of the Sarbanes-Oxley Act of [removed: 2002] [added: 2002](https://www.sec.gov/Archives/edgar/data/1043277/000104327718000007/chrw10k-ex32112312017.htm)] |
| 10.9 | | [Receivables Purchase Agreement, dated as of April 26, 2017, by and among C.H. Robinson Worldwide, Inc., C.H. Robinson Receivables, LLC, Gotham Funding Corporation, The Bank of Tokyo-Mitsubishi UFJ, Ltd., New York Branch, and Wells Fargo Bank, National Association (incorporated by reference to Exhibit 10.1 to the Company’s Current Report on Form 8-K filed on April 28, 2017)](http://www.sec.gov/Archives/edgar/data/1043277/000119312517148697/d387572dex101.htm) |
| 10.10 | | [Receivables Sale Agreement, dated as of April 26, 2017, by and among C.H. Robinson Company Inc., C.H. Robinson Receivables, LLC, and C.H. Robinson Worldwide, Inc. (incorporated by reference to Exhibit 10.2 to the Company’s Current Report on Form 8-K filed on April 28, 2017)](http://www.sec.gov/Archives/edgar/data/1043277/000119312517148697/d387572dex102.htm) |
| 10.11 | | [Performance Guaranty, dated as of April 26, 2017, made by C.H. Robinson Worldwide, Inc. for the benefit of The Bank of Tokyo-Mitsubishi UFJ, Ltd., New York Branch, Wells Fargo Bank, National Association, Gotham Funding Corporation and other affected parties (incorporated by reference to Exhibit 10.3 to the Company’s Current Report on Form 8-K filed on April 28, 2017)](http://www.sec.gov/Archives/edgar/data/1043277/000119312517148697/d387572dex103.htm) |
| *21 | | [Subsidiaries of the Company](https://www.sec.gov/Archives/edgar/data/1043277/000104327718000007/exhibit21123117.htm) |
| *23.1 | | [Consent of Deloitte & Touche LLP](https://www.sec.gov/Archives/edgar/data/1043277/000104327718000007/exhibit23112312017.htm) |
| *24 | | [Powers of Attorney](https://www.sec.gov/Archives/edgar/data/1043277/000104327718000007/exhibit24.htm) |
| Timothy C. Gokey | | |
| * | | Director |
| 4.1 | | Form of Certificate for Common Stock (Incorporated by reference to Exhibit 4.1 to the Registrant’s Registration Statement on Form S-1 filed on October 9, 1997, Registration No. 333-33731, file no. 000-23189) |
| 4.2 | | Amended and Restated Rights Agreement between the Company and Wells Fargo Bank, National Association (Incorporated by reference to Exhibit 4.1 to the Registrant’s Current Report on Form 8-K, dated September 10, 2007, file no. 000-23189) |
| †10.10 | | Form of Management Confidentiality and Noncompetition Agreement (Incorporated by reference to Exhibit 10.5 to the Registrant’s Annual Report on Form 10-K for the year ended December 31, 2007, file no. 000-23189) |
| †10.22 | | Form of Performance Share Award for U.S. Managerial Employees (Incorporated by reference to Exhibit 10.22 to the Registrant’s Annual Report on Form 10-K for the year ended December 31, 2014) |
| †10.23 | | Form of Time-Based Restricted Stock Unit Award (Incorporated by reference to Exhibit 10.23 to the Registrant’s Annual Report on Form 10-K for the year ended December 31, 2014) |
| †10.26 | | Form of Employee Confidentiality and Protection of Business Agreement (Incorporated by reference to Exhibit 10.23 to the Registrant’s Annual Report on Form 10-K for the year ended December 31, 2013) |
| *21 | | Subsidiaries of the Company |
| *23.1 | | Consent of Deloitte & Touche LLP |
| *24 | | Powers of Attorney |
An excerpt. Shown here: 40 of 42 rewritten, all 8 added and all 9 removed. The counts are complete. For every sentence, read Item 15. EXHIBITS, FINANCIAL STATEMENT SCHEDULES in the FY2017 filing and the FY2016 filing.