 filings.tools
Item 5. MARKET FOR REGISTRANT’S COMMON EQUITY, RELATED SHAREHOLDER MATTERS AND ISSUER PURCHASES OF EQUITY SECURITIES
5K characters. Original on sec.gov ·
Item 5. MARKET FOR REGISTRANT’S COMMON EQUITY, RELATED SHAREHOLDER MATTERS AND ISSUER PURCHASES OF EQUITY SECURITIES
Class A Common Stock
Our Class A common stock is currently listed on Nasdaq under the ticker symbol "CME." As of February 10, 2021, there were approximately 6,170 holders of record of our Class A common stock.
Class B Common Stock
Our Class B common stock is not listed on a national securities exchange or traded in an organized over-the-counter market. Each class of our Class B common stock is associated with a membership in a specific division of our CME exchange. CME's rules provide exchange members with trading rights and the ability to use or lease these trading rights. Each share of our Class B common stock can be transferred only in connection with the transfer of the associated trading rights.
Class B shares and the associated trading rights are bought and sold or leased through our membership department. Although our Class B shareholders have special voting rights, because our Class B shares have the same equitable interest in our earnings and the same dividend payments as our Class A shares, we expect that the market price of our Class B common stock, if reported separately from the associated trading rights, would be primarily determined by the value of our Class A common stock. As of February 10, 2021, there were approximately 1,565 holders of record of our Class B common stock.
PERFORMANCE GRAPH
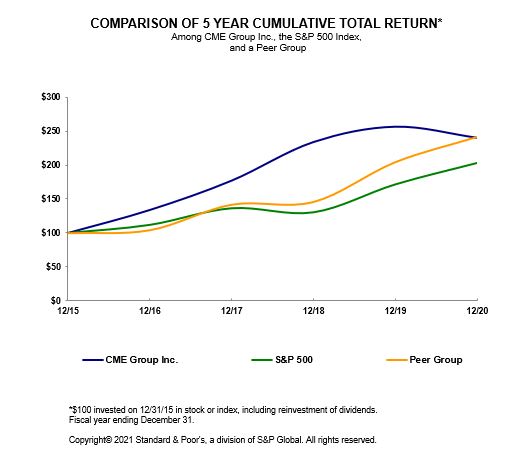
The graph below compares the cumulative five-year total return on CME Group Inc.'s Class A common stock relative to the cumulative total returns of the S&P 500 index and a customized peer group of five companies that include: Cboe Global Markets Inc, Deutsche Boerse Ag, Intercontinental Exchange Inc, London Stock Exchange Group Plc and Nasdaq Inc. An investment of $100 (with reinvestment of all dividends) is assumed to have been made in our Class A common stock, in the peer group and the S&P 500 index on December 31, 2015 and its relative performance is tracked through December 31, 2020.
The stock price performance included in this graph is not necessarily indicative of future stock price performance.
| 2016 | 2017 | 2018 | 2019 | 2020 | |||||||||||||||||||||||||
| CME Group Inc. | $ | 133.93 | $ | 177.23 | $ | 234.16 | $ | 256.81 | $ | 240.54 | |||||||||||||||||||
| S&P 500 | 111.96 | 136.40 | 130.42 | 171.49 | 203.04 | ||||||||||||||||||||||||
| Peer Group | 104.28 | 141.75 | 145.74 | 204.15 | 241.29 | ||||||||||||||||||||||||
Unregistered Sales of Equity Securities
None.
Issuer Purchases of Equity Securities
| Period in 2020 | Total Number of Shares (or Units) Purchased**(1)** | Average Price Paid Per Share (or Unit) | Total Number of Shares (or Units) Purchased as Part of Publicly Announced Plans or Programs | Maximum Number (or Approximate Dollar Value) of Shares (or Units) that May Yet Be Purchased Under the Plans or Programs (in millions) | ||||||||||||||||||||||
| October 1 to October 31 | 114 | $ | 159.47 | — | $ | — | ||||||||||||||||||||
| November 1 to November 30 | — | — | — | — | ||||||||||||||||||||||
| December 1 to December 31 | 24,810 | 182.02 | — | — | ||||||||||||||||||||||
| Total | 24,924 | — |
(1)Shares purchased consist of an aggregate of 24,924 shares of Class A common stock surrendered to satisfy employee tax obligations upon the vesting of restricted stock.
Previous: Item 4. MINE SAFETY DISCLOSURES · Next: Item 6. SELECTED FINANCIAL DATA