 filings.tools
Item 7. Management's Discussion and Analysis of Financial Condition and Results of Operations.
58K characters. Original on sec.gov · Markdown
Item 7. Management's Discussion and Analysis of Financial Condition and Results of Operations.
Note numbers refer to “Notes to Consolidated Financial Statements” in Item 8. Financial Statements and Supplementary Data.
RESULTS OF OPERATIONS
In this section, we discuss the results of our operations for fiscal 2019 compared with fiscal 2018. We discuss our cash flows and current financial condition under “Capital Resources and Liquidity.” For a discussion related to fiscal 2018 compared with fiscal 2017, please refer to Item 7 of Part II, “Management’s Discussion and Analysis of Financial Condition and Results of Operations” in our Annual Report on Form 10-K for the Year Ended October 31, 2018, which was filed with the United States Securities and Exchange Commission (SEC) on December 21, 2018, and is available on the SEC's website at www.sec.gov and our Investor Relations website at investor.coopercos.com.
Within the tables presented, percentages are calculated based on the underlying whole-dollar amounts and, therefore, may not recalculate exactly from the rounded numbers used for disclosure purposes.
Outlook
Overall, we remain optimistic about the long-term prospects for the worldwide contact lens and general health care markets. However, events affecting the economy as a whole, including but not limited to the uncertainty and instability of global markets driven by foreign currency volatility, changes in tax legislation, debt concerns, the uncertainty caused by the United Kingdom's planned withdrawal from the European Union, global trade barriers including additional tariffs and the trend of consolidations within the health care industry, impact our current performance and continue to represent a risk to our future performance.
CooperVision - We compete in the worldwide contact lens market with our spherical, toric and multifocal contact lenses offered in a variety of materials including using silicone hydrogel Aquaform® technology and PC Technology™. We believe that there will be lower contact lens wearer dropout rates as technology improves and enhances the wearing experience through a combination of improved designs and materials and the growth of preferred modalities such as single-use and monthly wearing options. Recent acquisitions also expanded CooperVision's access to myopia management and specialty eye care markets with new products, such as ortho-k and scleral lenses. In November 2019, CooperVision received United States Food & Drug Administration (FDA) approval for its MiSight® 1 day lens, which is the first and only FDA-approved product indicated to slow the progression of myopia in children with treatment initiated between the ages of 8-12 and is expected to be available in the United States in 2020. CooperVision is focused on greater worldwide market penetration using recently introduced products, and we continue to expand our presence in existing and emerging markets, including through acquisitions.
CooperVision acquired the following entity during fiscal 2019:
Blanchard Contact Lenses on December 28, 2018 - a privately-held scleral lens company, which expands CooperVision's specialty and scleral lens portfolio.
CooperVision acquired the following entities during fiscal 2018:
Blueyes on January 4, 2018 - a long-standing distribution partner, which had a leading position in the distribution of contact lenses to the optical and pharmacy sector in Israel
| • | Paragon Vision Sciences on December 1, 2017 - a leading provider of ortho-k specialty contact lenses and oxygen permeable rigid contact lens materials. |
THE COOPER COMPANIES, INC. AND SUBSIDIARIES
Management’s Discussion and Analysis of Financial Condition and Results of Operations
Our ability to compete successfully with a full range of silicone hydrogel products is an important factor to achieving our desired future levels of sales growth and profitability. CooperVision manufactures and markets a wide variety of silicone hydrogel contact lenses. Our single-use silicone hydrogel product franchises, clariti® and MyDay®, remain a focus as we expect increasing demand for these products, as well as future single-use products as the global contact lens market continues to shift to this modality. Outside of single-use, the Biofinity® and Avaira Vitality® product families comprise our focus in the FRP, or frequent replacement product, market which encompasses the 2-week and monthly modalities. Included in this segment are unique products such as Biofinity Energys®, which helps individuals with digital eye fatigue.
CooperSurgical - Our CooperSurgical business competes in the general health care market with a focus on advancing the health of women, babies and families through a diversified portfolio of products and services focusing on women's health, fertility, diagnostics and contraception. CooperSurgical has established its market presence and distribution system by developing products and acquiring companies, products and services that complement its business model.
CooperSurgical acquired the following entity during fiscal 2019:
Incisive Surgical Inc. on December 31, 2018 - a privately-held U.S. medical device company that develops mechanical surgical solutions for skin closure.
CooperSurgical acquired the following entities and assets during fiscal 2018:
LifeGlobal Group on April 3, 2018 - a privately held company that specializes primarily in IVF media. LifeGlobal’s product categories include media products, IVF laboratory air filtration products and dishware
| • | PARAGARD on November 1, 2017 - CooperSurgical acquired the assets of the PARAGARD IUS business from Teva for $1.1 billion. PARAGARD broadened and strengthened CooperSurgical's women's health product portfolio and it is the only non-hormonal, long lasting, reversible contraceptive option approved by the FDA and available in the United States. IUS represent a large and growing segment of the Long Acting Reversible Contraceptive market. |
We intend to continue investing in CooperSurgical's business with the goal of expanding our integrated solutions model within the areas of women's health, fertility, diagnostics and contraception.
Capital Resources - At October 31, 2019, we had $89.0 million in unrestricted cash, primarily held outside the United States, and $734.8 million available under our 2016 Revolving Credit Facility (as defined below). Debt outstanding at October 31, 2019 consisted of:
| • | $1.0 billion outstanding on a $1.425 billion syndicated Term Loan Agreement (the 2017 Term Loan Agreement) used to fund the acquisition of PARAGARD, which matures on November 1, 2022 |
| • | A $500.0 million 364-day senior unsecured term loan agreement (the 2019 Term Loan Agreement), which matures on September 25, 2020 |
| • | $264.0 million outstanding on a $1.0 billion multi-currency revolving credit facility (the 2016 Revolving Credit Facility), which matures on March 1, 2021. |
See Note 4. Debt of the Consolidated Financial Statements for additional information.
THE COOPER COMPANIES, INC. AND SUBSIDIARIES
Management’s Discussion and Analysis of Financial Condition and Results of Operations
Transition from LIBOR
The United Kingdom’s Financial Conduct Authority, which regulates the London Interbank Offered Rate (LIBOR), announced in July 2017 that it will no longer persuade or require banks to submit rates for LIBOR after 2021. We have undertaken an assessment of contracts that will be impacted by the transition away from LIBOR. To date, we have identified that substantially all of our term loan and credit facility agreements include an adjusted LIBOR option. We are continuing to evaluate the scope of impacted contracts and the potential impact. We are also monitoring the developments regarding alternative rates and may amend certain contracts to accommodate those rates if the contract does not already specify a replacement rate. While the notional value of agreements potentially indexed to LIBOR is material, we are not yet able to reasonably estimate the expected impact.
We believe that current cash, cash equivalents and future cash flow from operating activities will be sufficient to meet our anticipated cash needs, including working capital needs, capital expenditures and contractual obligations for at least 12 months from the issuance date of the financial statements included in this annual report. To the extent additional funds are necessary to meet our liquidity needs such as that for acquisitions, share repurchases, cash dividends or other activities as we execute our business strategy, we anticipate that additional funds will be obtained through the incurrence of additional indebtedness, additional equity financings or a combination of these potential sources of funds; however, such financing may not be available on favorable terms, or at all.
THE COOPER COMPANIES, INC. AND SUBSIDIARIES
Management’s Discussion and Analysis of Financial Condition and Results of Operations
2019 Compared with 2018

Highlights: 2019 vs. 2018
| • | Gross margin increased to 66% of net sales compared with 64% in fiscal 2018 |
| • | Operating income increased 36% to $546.7 million from $403.1 million |
| • | Interest expense decreased to $68.0 million from $82.7 million due to lower average debt balances, partially offset by higher interest rates |
| • | Diluted earnings per share increased 232% to $9.33 from $2.81 |
| • | Operating cash flow increased 7% to $713.2 million from $668.9 million. |
Selected Statistical Information – Percentage of Net Sales
| Years Ended October 31, | 2019 | 2018 | 2019 vs. 2018 % Change in Absolute Values | ||||
| Net sales | 100 | % | 100 | % | 5 | % | |
| Cost of sales | 34 | % | 36 | % | — | % | |
| Gross profit | 66 | % | 64 | % | 8 | % | |
| Selling, general and administrative expense | 38 | % | 38 | % | 2 | % | |
| Research and development expense | 3 | % | 3 | % | 2 | % | |
| Amortization of intangibles | 5 | % | 6 | % | (1 | )% | |
| Impairment of intangibles | — | % | 1 | % | — | % | |
| Gain on sale of an intangible | 1 | % | — | % | — | % | |
| Operating income | 21 | % | 16 | % | 36 | % |
THE COOPER COMPANIES, INC. AND SUBSIDIARIES
Management’s Discussion and Analysis of Financial Condition and Results of Operations
Net Sales Growth by Business Unit
| ($ in millions) | 2019 | 2018 | Increase | 2019 vs 2018 % Change | ||||||||||
| CooperVision | $ | 1,972.9 | $ | 1,882.0 | $ | 90.9 | 5 | % | ||||||
| CooperSurgical | 680.5 | 650.8 | 29.7 | 5 | % | |||||||||
| Net sales | $ | 2,653.4 | $ | 2,532.8 | $ | 120.6 | 5 | % |
CooperVision Net Sales
The contact lens market has two major product categories:
| • | Spherical lenses including lenses that correct near- and farsightedness uncomplicated by more complex visual defects |
| • | Toric and multifocal lenses including lenses that, in addition to correcting near- and farsightedness, address more complex visual defects such as astigmatism and presbyopia by adding optical properties of cylinder and axis, which correct for irregularities in the shape of the cornea. |
CooperVision Net Sales by Category
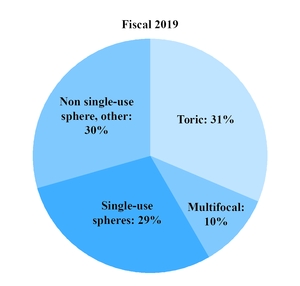
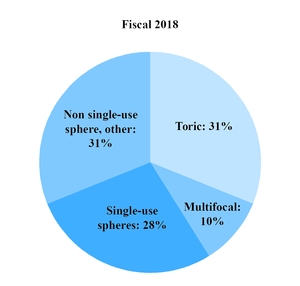
| ($ in millions) | 2019 | 2018 | 2019 vs. 2018 % Change | |||||||
| Toric | $ | 620.0 | $ | 591.4 | 5 | % | ||||
| Multifocal | 202.9 | 196.6 | 3 | % | ||||||
| Single-use spheres | 568.2 | 520.1 | 9 | % | ||||||
| Non single-use sphere, other | 581.8 | 573.9 | 1 | % | ||||||
| $ | 1,972.9 | $ | 1,882.0 | 5 | % |
In the fiscal year ended October 31, 2019:
| • | Sales growth in fiscal 2019 was largely organic |
| • | Toric lenses grew primarily through the success of Biofinity, clariti and MyDay |
THE COOPER COMPANIES, INC. AND SUBSIDIARIES
Management’s Discussion and Analysis of Financial Condition and Results of Operations
| • | Multifocal lenses increased in fiscal 2019, compared to fiscal 2018 due to higher Biofinity and clariti sales, partially offset by a decrease in sales of older hydrogel products |
| • | Single-use sphere lenses growth was primarily attributed to clariti and MyDay lenses |
| • | Non-single-use spheres increased in fiscal 2019, compared to fiscal 2018 due to higher Biofinity sales |
| • | "Other" products primarily include lens care which represented approximately 2% of net sales in fiscal 2019 and 2018 |
| • | Increased sales of silicone hydrogel products were partially offset by lower sales of older hydrogel products. Total silicone hydrogel products grew 9% in fiscal 2019, representing 72% of net sales in fiscal 2019 compared to 69% in fiscal 2018 |
| • | Foreign exchange rates negatively impacted sales by approximately $53.6 million in fiscal 2019 and positively impacted sales by $43.9 million in fiscal 2018, primarily attributable to fluctuations in the Euro and British Pound |
| • | Sales growth was primarily driven by increases in the volume of lenses sold. Average realized prices by product did not materially influence sales growth. |
CooperVision Net Sales by Geography
CooperVision competes in the worldwide soft contact lens market and services in three primary regions: the Americas, EMEA (Europe, Middle East and Africa) and Asia Pacific.
| ($ in millions) | 2019 | 2018 | 2019 vs. 2018 % Change | |||||||
| Americas | $ | 763.8 | $ | 722.9 | 6 | % | ||||
| EMEA | 746.5 | 744.3 | — | % | ||||||
| Asia Pacific | 462.6 | 414.8 | 12 | % | ||||||
| $ | 1,972.9 | $ | 1,882.0 | 5 | % |
CooperVision's regional growth in Americas, EMEA and Asia Pacific was primarily attributable to market gains of silicone hydrogel contact lenses. Refer to CooperVision Net Sales by Category above for further discussion.
CooperSurgical Net Sales by Category
CooperSurgical supplies the family health care market with a diversified portfolio of products and services. Our office and surgical offerings include products that facilitate surgical and non-surgical procedures that are commonly performed primarily by OB/GYN in hospitals, surgical centers, fertility clinics and medical offices. Fertility offerings include highly specialized products and services that target the IVF process, including diagnostics testing with a goal to make fertility treatment safer, more efficient and convenient.
THE COOPER COMPANIES, INC. AND SUBSIDIARIES
Management’s Discussion and Analysis of Financial Condition and Results of Operations
The chart below shows the percentage of net sales of office and surgical products and fertility.
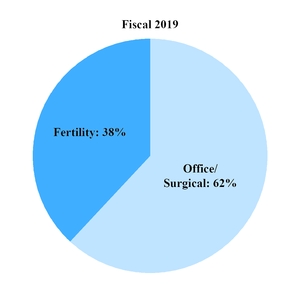
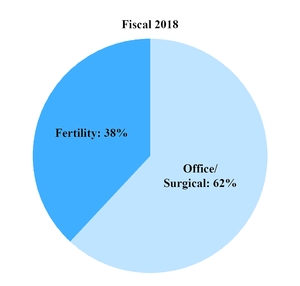
| ($ in millions) | 2019 | 2018 | 2019 vs 2018 % Change | ||||||||
| Office and surgical products | $ | 422.4 | $ | 400.4 | 6 | % | |||||
| Fertility | 258.1 | 250.4 | 3 | % | |||||||
| $ | 680.5 | $ | 650.8 | 5 | % |
In the fiscal year ended October 31, 2019:
| • | Office and surgical products increased compared to prior year due to continued growth in PARAGARD and surgical products, primarily Uterine Manipulators, Surgical Retractors and recently acquired products of Incisive Surgical, partially offset by a decrease in revenue from sales of the Filshie Clip system. On February 1, 2019, the Company agreed to the early termination of an exclusive distribution agreement which had given CooperSurgical the rights to distribute the Filshie Clip System in the United States |
| • | Fertility net sales increased in fiscal 2019 compared to fiscal 2018, primarily due to increased sales of IVF consumables, IVF equipment and LifeGlobal products, partially offset by a decrease in diagnostics revenue and exit of the carrier screening and non-invasive prenatal testing (NIPT) product lines on June 1, 2018 |
| • | Unit growth and product mix positively impacted sales growth. |
Gross Margin
| 2019 | 2018 | ||||
| CooperVision | 65 | % | 66 | % | |
| CooperSurgical | 69 | % | 61 | % | |
| Consolidated | 66 | % | 64 | % |
THE COOPER COMPANIES, INC. AND SUBSIDIARIES
Management’s Discussion and Analysis of Financial Condition and Results of Operations
CooperVision's gross margin decreased in fiscal 2019 compared to fiscal 2018 due to:
| • | the unfavorable impact to revenue from exchange rate fluctuations, primarily attributable to the Euro and British Pound; and product mix |
| • | $14.0 million of costs primarily product transition, integration and manufacturing related costs |
| • | partially offset by an increase in sales of higher margin products including Biofinity |
| • | fiscal 2018 included $10.1 million of costs primarily product transition and manufacturing related costs. |
CooperSurgical's gross margin increased in fiscal 2019 compared to fiscal 2018 due to:
| • | an increase in sales of PARAGARD IUS product and inclusion of LifeGlobal products with higher gross margin |
| • | partially offset by $14.2 million of costs, primarily integration and manufacturing related costs |
| • | fiscal 2018 included $49.3 million of PARAGARD and LifeGlobal acquisitions inventory step-up charges |
| • | fiscal 2018 included $16.2 million of costs primarily integration and manufacturing related costs. |
Selling, General and Administrative Expense (SGA)
| ($ in millions) | 2019 | % Net Sales | 2018 | % Net Sales | 2019 vs. 2018 % Change | |||||||||||
| CooperVision | $ | 682.4 | 35 | % | $ | 657.2 | 35 | % | 4 | % | ||||||
| CooperSurgical | 266.2 | 39 | % | 259.3 | 40 | % | 3 | % | ||||||||
| Corporate | 47.6 | — | 56.8 | — | (16 | )% | ||||||||||
| $ | 996.2 | 38 | % | $ | 973.3 | 38 | % | 2 | % |
CooperVision's SGA increased in fiscal 2019 compared to fiscal 2018 due to investments to support our long-term objectives, including increased headcount in SGA and higher distribution and selling expenses to support revenue growth. CooperVision's SGA in fiscal 2019 included $7.1 million of acquisition costs, integration costs and costs related to new product launches, including that of MiSight. CooperVision's SGA in fiscal 2018 included $8.7 million of integration and third-party consulting costs.
The increase in CooperSurgical's SGA in fiscal 2019 compared to fiscal 2018 was primarily due to higher PARAGARD advertising and marketing expenses. CooperSurgical's SGA in fiscal 2019, included $19.6 million of acquisition and integration expenses of acquired companies, as well as European Medical Devices Regulation costs. CooperSurgical's SGA in fiscal 2018 included $34.0 million of acquisition and integration expenses of acquired companies and exit costs for the carrier screening and NIPT product lines.
The decrease in Corporate SGA in fiscal 2019 compared to fiscal 2018 was primarily due to $6.2 million of compensation costs related to executives' retirements in fiscal 2018.
THE COOPER COMPANIES, INC. AND SUBSIDIARIES
Management’s Discussion and Analysis of Financial Condition and Results of Operations
Research and Development Expense (R&D)
| ($ in millions) | 2019 | % Net Sales | 2018 | % Net Sales | 2019 vs. 2018 % Change | ||||||||||||
| CooperVision | $ | 55.5 | 3 | % | $ | 54.3 | 3 | % | 2 | % | |||||||
| CooperSurgical | 31.2 | 5 | % | 30.5 | 5 | % | 3 | % | |||||||||
| $ | 86.7 | 3 | % | $ | 84.8 | 3 | % | 2 | % |
CooperVision's R&D increase in fiscal 2019 compared to fiscal 2018 was mainly due to increased costs from clinical studies. As a percentage of sales, R&D expense remained flat. CooperVision's R&D activities are primarily focused on the development of contact lenses, manufacturing technology and process enhancements.
The increase in CooperSurgical's R&D in fiscal 2019 compared to fiscal 2018 was primarily due to acquisitions, increased investment and activities in developing new products and services and upgrades of existing products. As a percentage of sales, R&D expense remained flat. CooperSurgical's R&D activities include diagnostics, IVF product development, design and upgrade of surgical procedure devices.
Amortization Expense
| ($ in millions) | 2019 | % Net Sales | 2018 | % Net Sales | 2019 vs. 2018 % Change | |||||||||||
| CooperVision | $ | 40.9 | 2 | % | $ | 43.6 | 2 | % | (6 | )% | ||||||
| CooperSurgical | 104.9 | 15 | % | 103.1 | 16 | % | 2 | % | ||||||||
| $ | 145.8 | 5 | % | $ | 146.7 | 6 | % | (1 | )% |
CooperVision amortization expense decreased in fiscal 2019 compared to fiscal 2018 due to certain intangible assets becoming fully amortized.
CooperSurgical's amortization expense remained relatively flat.
Impairment of Intangible Assets
In the second quarter of fiscal 2018, CooperSurgical recognized an impairment charge of $24.4 million on the intangible assets acquired from Recombine Inc. In fiscal 2016, CooperSurgical acquired Recombine Inc., a clinical genetic testing company specializing in carrier screening. In connection with the impairment charge, on June 1, 2018, CooperSurgical announced the exit of the carrier screening and NIPT product lines. Both product lines were categorized in Fertility. Exit and restructuring charges which were substantially completed at the end of fiscal 2018, consisted primarily of compensation and benefits to terminated employees, which were approximately $10.0 million. The net loss from both product lines were not material to our consolidated results of operations.
Gain on Sale of an Intangible Asset
In the second quarter of fiscal 2019, CooperSurgical sold an exclusive distribution right to distribute Filshie Clip System in the United States for $21.0 million and recognized a gain of $19.0 million.
THE COOPER COMPANIES, INC. AND SUBSIDIARIES
Management’s Discussion and Analysis of Financial Condition and Results of Operations
Operating Income
| ($ in millions) | 2019 | % Net Sales | 2018 | % Net Sales | 2019 vs. 2018 % Change | |||||||||||
| CooperVision | $ | 506.4 | 26 | % | $ | 479.8 | 25 | % | 6 | % | ||||||
| CooperSurgical | 87.9 | 13 | % | (19.9 | ) | (3 | )% | 542 | % | |||||||
| Corporate | (47.6 | ) | — | (56.8 | ) | — | 16 | % | ||||||||
| $ | 546.7 | 21 | % | $ | 403.1 | 16 | % | 36 | % |
CooperVision operating income remained relatively flat as a percentage of net sales but increased in absolute dollars in fiscal 2019 compared to fiscal 2018 primarily due to improved sales of higher margin products, including Biofinity, partially offset by the negative impact of foreign exchange rates.
CooperSurgical operating income increased in fiscal 2019 compared to fiscal 2018, due to an increase in sales of higher margin products, gain of $19.0 million on sale of an intangible asset, as discussed above, and recent acquisitions. CooperSurgical operating income in fiscal 2018 included $49.3 million of PARAGARD and LifeGlobal acquisitions inventory step-up charges and an intangible asset impairment charge of $24.4 million.
The decrease of Corporate operating loss in fiscal 2019 compared to fiscal 2018 was primarily due to higher compensation costs related to executives' retirements which impacted the prior year.
On a consolidated basis, operating income increased due to the factors above.
Interest Expense
| ($ in millions) | 2019 | % Net Sales | 2018 | % Net Sales | 2019 vs. 2018 % Change | |||||||||||
| Interest expense | $ | 68.0 | 3 | % | $ | 82.7 | 3 | % | (18 | )% |
Interest expense remained relatively flat as a percentage of net sales and decreased in absolute dollar, primarily due to lower average debt balances, partially offset by higher interest rates compared to prior year period. Fiscal 2019 interest expense included $0.8 million of write off of debt issuance costs on early repayment of the 2018 term loan. Fiscal 2018 interest expense included $2.5 million write off of debt issuance costs related to partial prepayments of the 2016 term loan and $1.7 million of Bridge Loan Facility fees that were incurred related to the PARAGARD acquisition.
Other Expense (Income), Net
| ($ in millions) | 2019 | 2018 | |||||
| Foreign exchange loss | $ | 2.2 | $ | 3.4 | |||
| Other income, net | (0.9 | ) | (14.9 | ) | |||
| $ | 1.3 | $ | (11.5 | ) |
Foreign exchange loss primarily resulted from the revaluation and settlement of foreign currencies-denominated balances.
Other income in fiscal 2018 is primarily from the realization of a Puerto Rico research and development credit of $14.2 million.
THE COOPER COMPANIES, INC. AND SUBSIDIARIES
Management’s Discussion and Analysis of Financial Condition and Results of Operations
Provision for Income Taxes
The Company’s effective tax rate (ETR) was 2.3%, 57.9%, and 5.3% for fiscal 2019, 2018 and 2017 respectively. The ETR in fiscal 2019 decreased in comparison to fiscal 2018 primarily due to the net charge related to the enactment of the 2017 Act which was recorded in fiscal 2018, tax benefits from audit settlements in fiscal 2019, and additional taxes in the United States from the inclusion of earnings from our foreign subsidiaries pursuant to the GILTI provisions that became effective in fiscal 2019. The ETR in fiscal 2018 increased in comparison to fiscal 2017 primarily due to the net charge related to the enactment of the 2017 Act which was partially offset by a shift in the geographic mix of income.
The ETR for 2019 was less than the U.S. federal statutory tax rate primarily due to a majority of our taxable income being earned in foreign jurisdictions with lower tax rates, discrete tax benefits from settling income tax audits, excess tax benefits from share-based compensation, and additional taxes in the United States from the inclusion of earnings from our foreign subsidiaries pursuant to the GILTI provisions. The ETR for 2018 was greater than the U.S. federal statutory tax rate primarily due to the tax expense related to the enactment of the 2017 Act. The ETR for 2017 was less than the U.S. federal statutory tax rate because a majority of our taxable income was earned in foreign jurisdictions with lower tax rates and excess tax benefits from share-based compensation. The ratio of domestic income to worldwide income significantly impacted our overall tax rate due to the fact that the tax rates in some of the foreign jurisdictions where we operate are significantly lower than the statutory rate in the United States. The foreign jurisdictions with lower tax rates compared to the U.S. federal statutory tax rate that had the most significant impact on our provision for foreign income taxes in the fiscal years presented include the United Kingdom, Barbados and Puerto Rico. See Note 5. Income Taxes of the Consolidated Financial Statements for additional information.
ASC 740, Income Taxes, requires companies to recognize the effect of the tax law changes in the period of enactment. However, in December 2017, the SEC provided regulatory guidance for accounting of the 2017 Act referred to as Staff Accounting Bulletin (SAB) 118. Under the guidance in SAB 118, we recognized in fiscal 2018 a provisional amount of $214.6 million as a reasonable estimate of the impact of the provisions of the 2017 Act. As of January 31, 2019, we completed our accounting for the tax effects of the enactment of the 2017 Act and did not recognize any material adjustments to the provisional tax expense previously recorded.
Share-Based Compensation Plans
We grant various share-based compensation awards, including stock options, performance shares and restricted stock units. The share-based compensation and related income tax benefit recognized in the Consolidated Financial Statements in fiscal 2019 was $36.3 million and $5.1 million, respectively, compared to $43.2 million and $8.8 million, respectively, in fiscal 2018. As of October 31, 2019, there was $86.5 million of total unrecognized share-based compensation cost related to non-vested awards. See Note 8. Stock Plans of the Consolidated Financial Statements for additional information.
We estimate the fair value of each stock option award on the date of grant using the Black-Scholes valuation model, which requires management to make estimates regarding expected option life, stock price volatility and other assumptions. The use of different assumptions could lead to a different estimate of fair value. The expected life of the stock option is based on the observed and expected time to post-vesting forfeiture and/or exercise. Groups of employees that have similar historical exercise behavior are considered separately for valuation purposes. If our assumption for the expected life increased by one year, the fair value of an individual option granted in fiscal 2019 would have increased by approximately $7.62. To determine the stock price volatility, management considers implied volatility from publicly-
THE COOPER COMPANIES, INC. AND SUBSIDIARIES
Management’s Discussion and Analysis of Financial Condition and Results of Operations
traded options on the Company's stock at the date of grant, historical volatility and other factors. If our assumption for stock price volatility increased by one percentage point, the fair value of an individual option granted in fiscal 2019 would have increased by approximately $1.88.
As of October 31, 2019, the 2006 Long-Term Incentive Plan for Non-Employee Directors has expired and no shares remain available under this plan for future grants.
Retirement Income Plan Soft Freeze
On June 18, 2019 the Board of Directors of the Company approved a soft freeze of the Plan effective August 1, 2019. The Plan was closed to employees hired on or after August 1, 2019, including former participants or employees rehired on or after August 1, 2019 and employees hired in connection with a stock or asset acquisition, merger or other similar transaction on or after August 1, 2019. Existing employees already covered by the Plan, continue to accrue their benefits. There is no material impact on the Company's results of operations, financial position and cash flows for the fiscal 2019.
Employee Stock Purchase Plan
On March 18, 2019, the Company received stockholder approval of the Employee Stock Purchase Plan (ESPP). The first offering period is for U.S. employees and began on November 4, 2019. The purpose of the ESPP is to provide eligible employees of the Company with the opportunity to acquire shares of common stock at 85% of the market price on the last business day of each offering period by means of accumulated payroll deductions. Payroll deductions will be limited to a maximum of 15% of the employee’s eligible compensation, not to exceed $21.3 thousand in any one calendar year. The ESPP would initially authorize the issuance of 1,000,000 shares of common stock. These shares will be made available from shares of common stock reacquired by the Company as Treasury Stock. At October 31, 2019, there were approximately 4.1 million shares of Treasury Stock.
THE COOPER COMPANIES, INC. AND SUBSIDIARIES
Management’s Discussion and Analysis of Financial Condition and Results of Operations
CAPITAL RESOURCES AND LIQUIDITY
2019 Highlights
| • | Operating cash flow of $713.2 million up from $668.9 million in fiscal 2018 |
| • | Expenditures for purchases of property, plant and equipment of $292.1 million up from $193.6 million in fiscal 2018 |
| • | Cash payments for acquisitions and others of, $59.2 million compared to $1,323.9 million in fiscal 2018 |
| • | Total debt, net of debt issuance cost, at $1.8 billion at the end of fiscal 2019 compared to $2.0 billion at the end of fiscal 2018 |
Comparative Statistics
| Years Ended October 31, ($ in millions) | 2019 | 2018 | |||||
| Cash and cash equivalents | $ | 89.0 | $ | 77.7 | |||
| Total assets | $ | 6,274.5 | $ | 6,112.8 | |||
| Working capital | $ | 52.8 | $ | 554.4 | |||
| Total debt | $ | 1,826.3 | $ | 2,022.8 | |||
| Stockholders’ equity | $ | 3,628.5 | $ | 3,307.8 | |||
| Ratio of debt to equity | 0.50:1 | 0.61:1 | |||||
| Debt as a percentage of total capitalization | 33 | % | 38 | % |
Working Capital
The decrease in working capital at October 31, 2019 from the end of fiscal 2018 was primarily due to:
| • | increase in short-term debt $526.6 million, primarily from the $500 million 2019 Term Loan Agreement entered into on September 27, 2019 |
| • | decrease of $37.5 million in prepaid expense and other current assets, primarily due to a $29.0 million refund from the U.K. Tax Authorities in the current year |
| • | increase in other current liabilities of $33.1 million due to timing of payments |
| • | increase in employee compensation and benefits of $10.7 million, partially offset by; |
| • | increase in cash $11.3 million |
| • | increase in accounts receivables $60.6 million from increased revenue |
| • | increase in inventories $38.1 million. |
At October 31, 2019, our inventory months on hand were 6.4 compared to 6.3 at October 31, 2018. The $38.1 million increase in inventories was primarily due to increase in finished goods and raw materials to support demand and production levels.
Our days sales outstanding (DSO) was 56 days at October 31, 2019 compared to 53 days at October 31, 2018. The increase in DSO from October 31, 2018 to October 31, 2019 was primarily due to increased revenue and timing of collections.
We are no longer asserting that cash from our foreign operations are indefinitely reinvested which allows more flexibility in using cash from our foreign operations to fund future working capital in the United States.
THE COOPER COMPANIES, INC. AND SUBSIDIARIES
Management’s Discussion and Analysis of Financial Condition and Results of Operations
Operating Cash Flow
Cash provided by operating activities increased by $44.3 million from $668.9 million in fiscal 2018 to $713.2 million in fiscal 2019. This increase in cash flow provided by operating activities primarily consists of:
| • | increase in net income of $326.8 million from a net income of $139.9 million in fiscal 2018 to $466.7 million in fiscal 2019; fiscal 2018 net income was unfavorably impacted by a $214.6 million tax expense charge related to the 2017 Act |
| • | $104.7 million increase in the net changes in prepayments and other assets primarily due to a $42.0 million payment to the U.K. Tax Authorities in the prior year period compared to a $29.0 million refund in the current year, partially offset by |
| • | $192.9 million decrease in the net changes in other long-term liabilities, primarily due to a decrease in the provisional tax liability for the mandatory deemed repatriation of deferred foreign earnings under the 2017 Act of $141.5 million in fiscal 2018 |
| • | $50.4 million decrease of step-up charges related to inventory acquired mainly from PARAGARD in fiscal 2018 |
| • | $48.1 million decrease in the net changes in accrued liabilities |
| • | $32.3 million decrease in the net changes in inventories, driven by acquisitions and higher raw materials to support production levels |
| • | decrease of $24.0 million in impairment of intangibles, from $24.4 million in fiscal 2018 to $0.4 million in fiscal 2019, primarily due to an impairment charge recognized by CooperSurgical on its exit from the carrier screening and NIPT product lines in fiscal 2018 |
| • | increase of $19.0 million due to a gain on sale of an intangible asset, representing the sale by CooperSurgical of the Filshie Clip exclusive distribution right |
| • | $18.8 million decrease in the net changes in deferred taxes |
| • | $10.8 million decrease in the net changes in provision for doubtful accounts. |
Investing Cash Flow
Cash used in investing activities decreased by $1,166.2 million to $351.3 million in fiscal 2019 from $1,517.5 million in fiscal 2018 due to:
| • | decrease of $1,264.7 million in payments made for acquisitions in fiscal 2019 compared to the prior year period, largely due to the acquisition of PARAGARD at $1.1 billion in first quarter of fiscal 2018, partially offset by; |
| • | increase of $98.5 million in capital expenditures primarily used to invest in the expansion of our manufacturing capacity. |
Financing Cash Flow
Cash provided by financing activities decreased by $1,195.8 million to $351.4 million cash outflow in fiscal 2019 compared to $844.4 million cash inflow in fiscal 2018, primarily due to:
| • | $1,561.0 million decrease of net proceeds from long-term debt primarily due to additional debt taken on to fund the PARAGARD acquisition in fiscal 2018 |
| • | $156.1 million was used for share repurchases in fiscal 2019 compared to nil in the fiscal 2018, partially offset by; |
| • | $511.7 million increase in short-term notes payable, primarily due to $500 million short term loan taken on September 27, 2019 |
| • | $5.9 million increase in the net proceeds related to share-based compensation awards. |
The 2019 Term Loan Agreement and the 2017 Term Loan Agreement contain customary restrictive covenants, as well as financial covenants that require the Company to maintain a certain Total Leverage
THE COOPER COMPANIES, INC. AND SUBSIDIARIES
Management’s Discussion and Analysis of Financial Condition and Results of Operations
Ratio and Interest Coverage Ratio (each as defined in the 2019 Term Loan Agreement and the 2017 Term Loan Agreement, respectively), consistent with the 2016 Credit Agreement. As defined in the 2019 Term Loan Agreement, the 2017 Term Loan Agreement and the 2016 Credit Agreement, we are required to maintain an Interest Coverage Ratio of at least 3.00 to 1.00, and a Total Leverage Ratio of no higher than 3.75 to 1.00. At October 31, 2019, we were in compliance with the Interest Coverage Ratio at 13.82 to 1.00 and the Total Leverage Ratio at 1.85 to 1.00.
At October 31, 2019, we had $500.0 million outstanding under the 2019 Term Loan Agreement, $1.0 billion outstanding under the 2017 Term Loan Agreement, $264.0 million outstanding under the 2016 Revolving Credit Facility and $734.8 million available under the 2016 Revolving Credit Facility.
At October 31, 2019, we had $89.0 million in cash and cash equivalents, predominantly outside the United States.
Share Repurchases
In December 2011, our Board of Directors authorized the 2012 Share Repurchase Program and through subsequent amendments, the most recent in March 2017, the total repurchase authorization was increased from $500.0 million to $1.0 billion of the Company's common stock. The program has no expiration date and may be discontinued at any time.
In the fourth quarter of fiscal 2019, we repurchased 512 thousand shares of the Company's common stock for $150.0 million, at an average purchase price of $292.7 per share. During the fiscal year ended October 31, 2019, we repurchased 537 thousand shares of our common stock for $156.1 million under the 2012 Share Repurchase Program. During the fiscal year ended October 31, 2018, we did not repurchase any shares. At October 31, 2019, $407.4 million remained authorized for repurchase under the program.
OFF BALANCE SHEET ARRANGEMENTS
None.
CONTRACTUAL OBLIGATIONS AND COMMERCIAL COMMITMENTS
As of October 31, 2019, we had the following contractual obligations and commercial commitments:
| Payments Due by Period (In millions) | Total | 2020 | 2021 & 2022 | 2023 & 2024 | 2025 & Beyond | ||||||||||||||
| Contractual obligations: | |||||||||||||||||||
| Long-term debt | $ | 1,264.2 | $ | — | $ | 264.2 | $ | 1,000.0 | $ | — | |||||||||
| Interest payments | 112.5 | 47.8 | 64.6 | 0.1 | — | ||||||||||||||
| Operating leases | 332.2 | 38.4 | 65.9 | 54.3 | 173.6 | ||||||||||||||
| Transition tax on unremitted foreign earnings and profits (1) | 135.8 | 11.8 | 23.6 | 23.6 | 76.8 | ||||||||||||||
| Purchase obligation (2) | 96.0 | 83.7 | 11.8 | 0.5 | — | ||||||||||||||
| Defined benefit plan (3) | 118.3 | 8.7 | 20.0 | 22.9 | 66.7 | ||||||||||||||
| Total contractual obligations | 2,059.0 | 190.4 | 450.1 | 1,101.4 | 317.1 | ||||||||||||||
| Commercial commitments: | |||||||||||||||||||
| Stand-by letters of credit | 4.8 | 4.8 | — | — | — | ||||||||||||||
| Total | $ | 2,063.8 | $ | 195.2 | $ | 450.1 | $ | 1,101.4 | $ | 317.1 |
(1) As of October 31, 2019, we had recorded $135.8 million of income tax liabilities related to the one-time transition tax that resulted from the enactment of the 2017 Act, which will be payable in seven annual installments. The installment for 2020 is classified as a current income tax payable on our consolidated balance sheet.
THE COOPER COMPANIES, INC. AND SUBSIDIARIES
Management’s Discussion and Analysis of Financial Condition and Results of Operations
The expected future benefit payments for pension plans through 2028 are disclosed in Note 9. Employee Benefits of the Consolidated Financial Statements.
We are unable to reliably estimate the timing of future payments related to uncertain tax positions; therefore, about $49.7 million of our long-term income taxes payable have been excluded from the table above. However, other long-term liabilities, included in our consolidated balance sheet, include these uncertain tax positions. See Note 6. Income Taxes of the Consolidated Financial Statements for additional information.
(2) Purchase obligations consist of agreements to purchase goods and services that are enforceable and legally binding and includes obligations for inventory, capital expenditures, information technology and other operating expense commitments.
(3) See Note 9, "Employee Benefits" for more information.
Inflation and Changing Prices
Inflation has had no appreciable effect on our operations in the last three fiscal years.
THE COOPER COMPANIES, INC. AND SUBSIDIARIES
Management’s Discussion and Analysis of Financial Condition and Results of Operations
Accounting Pronouncements
Information regarding new accounting pronouncements is included in Note 1. Accounting Policies of the Consolidated Financial Statements.
Estimates and Critical Accounting Policies
Management estimates and judgments are an integral part of financial statements prepared in accordance with accounting principles generally accepted in the United States of America (GAAP). We believe that the critical accounting policies described in this section address the more significant estimates required of management when preparing the Consolidated Financial Statements in accordance with GAAP. We consider an accounting estimate critical if changes in the estimate may have a material impact on our financial condition or results of operations. We believe that the accounting estimates employed are appropriate and resulting balances are reasonable; however, actual results could differ from the original estimates, requiring adjustment to these balances in future periods.
| • | Revenue recognition - We recognize revenue from product sales when obligations under the terms of a contract with the customer are satisfied; generally, this occurs with the transfer of control of the goods to customers and/or when services are rendered. Our payment terms are typically between 30 to 120 days. Provisions for certain rebates, sales incentives, volume discounts, contractual pricing allowances and product returns are accounted for as variable consideration and recorded as a reduction in sales. See Note 1 to the Consolidated Financial Statements for the Accounting Standards Update related to revenue, which was adopted in 2019. |
Product discounts, including certain rebates, sales incentives, and volume discounts are granted based on terms of the arrangement with direct distribution customers and at times the indirect end consumer. We evaluate contractual terms, historical experience, and perform internal analysis to estimate total product discounts at the time revenue is recognized. Our PARAGARD program is subject to Medicaid rebates, which are estimated at the time of sale based upon the difference between current retail pricing and contractual Medicaid pricing and an estimate of the number of units that will be sold to Medicaid patients, which is informed by historical trends of claim history.
Sales returns are estimated and recorded based on historical sales return data. Promotional programs, such as cooperative advertising arrangements, are recorded in the same period as related sales. Reasonably likely changes to assumptions used to calculate the accruals for rebates, sales incentives, volume discounts, contractual pricing allowances and product returns are not anticipated to have a material effect on the financial statements. We currently disclose the impact of changes to assumptions in the quarterly or annual filing in which there is a material financial statement impact.
| • | Valuation of goodwill - Effective April 30, 2019, there was a change in the reporting units as a result of realignment in the internal reporting structure of the business around markets and customers at CooperSurgical. As such, Cooper Surgical has evolved into two reporting units, namely, Office/Surgical and Fertility, which reflects management oversight of operations. The change in reporting units did not result in a change in operating segments. We allocated CooperSurgical's goodwill based on relative fair values utilizing the discounted cash flow method and guideline public company method as our allocation base. The key assumptions and estimates for the market and income approaches used to determine fair value of the reporting units included market data and market multiples, discount rates and terminal growth rates, as well as future levels of revenue growth, and operating margins, which were based upon the Company’s strategic plan. The allocated fair values exceeded the carrying values for each of the three reporting units |
THE COOPER COMPANIES, INC. AND SUBSIDIARIES
Management’s Discussion and Analysis of Financial Condition and Results of Operations
as of April 30, 2019. Our reporting units are CooperVision, Office/Surgical and Fertility reflecting the current way we manage our business.
We evaluate goodwill for impairment annually during the fiscal third quarter and when an event occurs or circumstances change such that it is reasonably possible that impairment may exist. We account for goodwill and evaluate our goodwill balances and test them for impairment in accordance with related accounting standards. We performed our annual impairment assessment in our third quarter of fiscal 2019 and 2018, and our analysis indicated that we had no impairment of goodwill in our reporting units.
Goodwill impairment analysis and measurement is a process that requires significant judgment. If our common stock price trades below book value per share, there are changes in market conditions or a future downturn in our business, or a future goodwill impairment test indicates an impairment of our goodwill, we may have to recognize a non-cash impairment of goodwill that could be material and could adversely affect our results of operations in the period recognized and also adversely affect our total assets and stockholders' equity.
We test goodwill impairment in accordance with ASU 2017-04, Intangibles - Goodwill and other (Topic 350): Simplifying the Test for Goodwill Impairment. We perform a qualitative assessment to test each reporting unit's goodwill for impairment. Qualitative factors considered in this assessment include industry and market considerations, overall financial performance and other relevant events and factors affecting each reporting unit. Based on our qualitative assessment, if we determine that the fair value of a reporting unit is more likely than not to be less than its carrying amount, the fair value of a reporting unit will be compared with its carrying amount and an impairment charge will be recognized for the amount that the carrying value exceeds the fair value of the reporting unit. A reporting unit is the level of reporting at which goodwill is tested for impairment.
| • | Business combinations - We routinely consummate business combinations. Results of operations for acquired companies are included in our consolidated results of operations from the date of acquisition. We recognize separately from goodwill, the identifiable assets acquired, including acquired in-process research and development, the liabilities assumed, and any noncontrolling interest in the acquiree at the acquisition date fair values as defined by accounting standards related to fair value measurements. Key assumptions routinely utilized in allocation of purchase price to intangible assets include projected financial information such as revenue projections for companies acquired. As of the acquisition date, goodwill is measured as the excess of consideration given, over the net of the acquisition date fair values of the identifiable assets acquired and the liabilities assumed. Direct acquisition costs are expensed as incurred. |
| • | Income taxes - We account for income taxes under the asset and liability method. Deferred tax assets and liabilities are recognized for the future tax consequences attributable to differences between the financial statement carrying amounts of existing assets and liabilities and their respective tax bases, and for tax losses and tax credit carry forwards. Deferred tax assets and liabilities are measured using enacted tax rates expected to apply to taxable income in the years in which those temporary differences are expected to be recovered or settled. The effect on deferred tax assets and liabilities of a change in tax rates is recognized in income in the period that includes the enactment date. In assessing the realizability of deferred tax assets, management considers whether it is more likely than not that some portion or all of the deferred tax assets will not be realized. |
As part of the process of preparing our Consolidated Financial Statements, we must estimate our income tax expense for each of the jurisdictions in which we operate. This process requires significant management judgments and involves estimating our current tax exposures in each jurisdiction including the impact, if any, of additional taxes resulting from tax examinations as well as judging the recoverability of deferred tax assets. To the extent recovery of deferred tax
THE COOPER COMPANIES, INC. AND SUBSIDIARIES
Management’s Discussion and Analysis of Financial Condition and Results of Operations
assets is not likely based on our estimation of future taxable income in each jurisdiction, a valuation allowance is established. Tax exposures can involve complex issues and may require an extended period to resolve. Frequent changes in tax laws in each jurisdiction complicate future estimates. To determine the tax rate, we use the full-year income and the related income tax expense in each jurisdiction. We update the estimated effective tax rate for the effect of significant unusual items as they are identified. Changes in the geographic mix or estimated level of annual pre-tax income can affect the overall effective tax rate, and such changes could be material.
We file income tax returns in all jurisdictions in which we operate. We record a liability for uncertain tax positions taken or expected to be taken in income tax returns. Our financial statements reflect expected future tax consequences of such positions presuming the taxing authorities' full knowledge of the position and all relevant facts. We record a liability for the portion of unrecognized tax benefits claimed that we have determined are not more-likely-than-not realizable. These tax reserves have been established based on management's assessment as to the potential exposure attributable to our uncertain tax positions as well as interest and penalties attributable to these uncertain tax positions. All tax reserves are analyzed quarterly and adjustments are made as events occur that result in changes in judgment.
THE COOPER COMPANIES, INC. AND SUBSIDIARIES
Management’s Discussion and Analysis of Financial Condition and Results of Operations
Trademarks
Aquaform®, Avaira®, Avaira Vitality®, Biofinity®, MyDay®, MiSight®, ActiveControl® and Proclear® are registered trademarks of The Cooper Companies, Inc., its affiliates and/or subsidiaries. PC Technology™ and FIPS™ are trademarks of The Cooper Companies, Inc., its affiliates and/or subsidiaries. The clariti® mark is a registered trademark of The Cooper Companies, Inc., its affiliates and/or subsidiaries worldwide except in the United States where the use of clariti® is licensed. PARAGARD® is a registered trademark of CooperSurgical, Inc.
Previous: Item 6. Selected Financial Data. · Next: Item 7A. Quantitative and Qualitative Disclosure About Market Risk