 filings.tools
Item 5. MARKET FOR REGISTRANT'S COMMON EQUITY, RELATED STOCKHOLDER MATTERS AND ISSUER PURCHASES OF EQUITY SECURITIES
6K characters. Original on sec.gov · Markdown
Item 5. MARKET FOR REGISTRANT'S COMMON EQUITY, RELATED STOCKHOLDER MATTERS AND ISSUER PURCHASES OF EQUITY SECURITIES
The Company's common stock is traded on the New York Stock Exchange under the trading symbol "ABC." As of October 31, 2020, there were 2,385 record holders of the Company's common stock.
In November 2018, the Company's board of directors increased the quarterly dividend by 5% from $0.38 per share to $0.40 per share. In January 2020, the Company's board of directors increased the quarterly dividend by 5% from $0.40 per share to $0.42 per share. In November 2020, the Company's board of directors increased the quarterly dividend by 5% from $0.42 per share to $0.44 per share. The Company anticipates that it will continue to pay quarterly cash dividends in the future. However, the payment and amount of future dividends remain within the discretion of the Company's board of directors and will depend upon the Company's future earnings, financial condition, capital requirements, and other factors.
Computershare is the Company's transfer agent. Computershare can be reached at (mail) AmerisourceBergen Corporation c/o Computershare, P.O. Box 50500, Louisville, KY 40233-500; (telephone): Domestic 1-800-522-6645, International 1-201-680-6578, and (internet) www.computershare.com/investor.
ISSUER PURCHASES OF EQUITY SECURITIES
The following sets forth the total number of shares purchased, the average price paid per share, the total number of shares purchased as part of publicly announced programs, and the approximate dollar value of shares that may yet be purchased under the programs during each month in the fiscal year ended September 30, 2020.
| Period | Total Number of Shares Purchased | Average Price Paid Per Share | Total Number of Shares Purchased as Part of Publicly Announced Programs | Approximate Dollar Value of Shares that May Yet Be Purchased Under the Programs | ||||||||||||||||||||||
| October 1 to October 31 | 928,528 | $ | 81.89 | 928,528 | $ | 385,099,144 | ||||||||||||||||||||
| November 1 to November 30 | 383,920 | $ | 84.57 | 272,014 | $ | 362,228,055 | ||||||||||||||||||||
| December 1 to December 31 | 367,012 | $ | 84.04 | 367,012 | $ | 331,384,669 | ||||||||||||||||||||
| January 1 to January 31 | 193,502 | $ | 84.48 | 193,502 | $ | 315,037,604 | ||||||||||||||||||||
| February 1 to February 29 | 352,025 | $ | 82.84 | 352,025 | $ | 285,874,551 | ||||||||||||||||||||
| March 1 to March 31 | 2,643,138 | $ | 82.12 | 2,643,138 | $ | 68,813,634 | ||||||||||||||||||||
| April 1 to April 30 | — | $ | — | — | $ | 68,813,634 | ||||||||||||||||||||
| May 1 to May 31 | 159,247 | $ | 83.49 | 159,247 | $ | 555,518,116 | ||||||||||||||||||||
| June 1 to June 30 | 784 | $ | 95.15 | — | $ | 555,518,116 | ||||||||||||||||||||
| July 1 to July 31 | — | $ | — | — | $ | 555,518,116 | ||||||||||||||||||||
| August 1 to August 31 | — | $ | — | — | $ | 555,518,116 | ||||||||||||||||||||
| September 1 to September 30 | 1,342 | $ | 94.30 | — | $ | 555,518,116 | ||||||||||||||||||||
| Total | 5,029,498 | $ | 82.60 | 4,915,466 |
(a)In October 2018, the Company's board of directors authorized a share repurchase program allowing the Company to purchase up to $1.0 billion of its outstanding shares of common stock, subject to market conditions. During the fiscal year ended September 30, 2020, the Company purchased 4.9 million shares of its common stock for a total of $405.6 million, which excluded $14.8 million of September 2019 purchases that cash settled in October 2019. As of September 30, 2020, the Company had $55.5 million of availability under this program.
(b)In May 2020, the Company's board of directors authorized a new share repurchase program allowing the Company to purchase up to $500 million of its outstanding shares of common stock, subject to market conditions.
(c)Employees surrendered 114,032 shares during the fiscal year ended September 30, 2020 to meet minimum tax-withholding obligations upon vesting of restricted stock.
STOCK PERFORMANCE GRAPH
This graph depicts the Company's five year cumulative total stockholder returns relative to the performance of the Standard and Poor's 500 Composite Stock Index, the S&P Health Care Index, and an index of peer companies selected by the Company from the market close on September 30, 2015 to September 30, 2020. The graph assumes $100 invested at the closing price of the common stock of the Company and of each of the other indices on the New York Stock Exchange on September 30, 2015. The points on the graph represent fiscal year-end index levels based upon the last trading day in each fiscal quarter. The Peer Group index (which is weighted on the basis of market capitalization) consists of the following companies engaged primarily in wholesale pharmaceutical distribution and related services: McKesson Corporation and Cardinal Health, Inc.
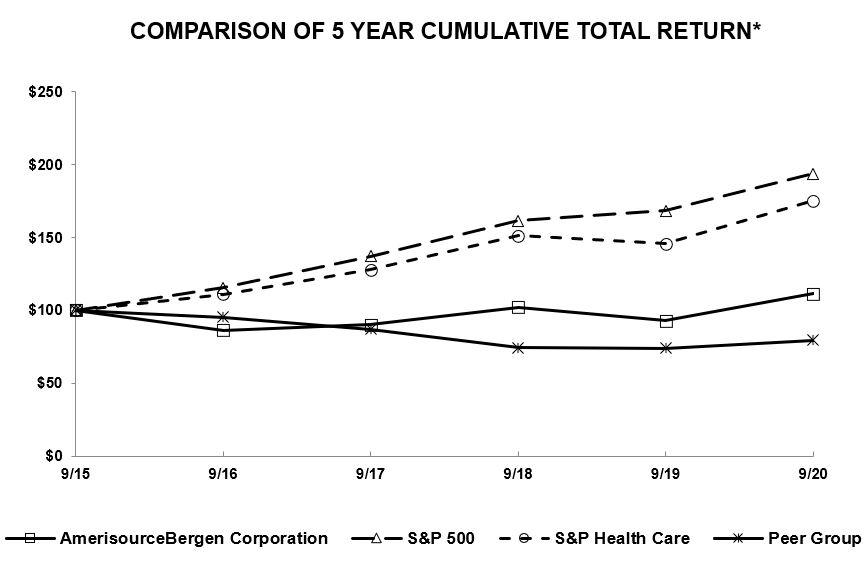
- $100 invested on September 30, 2015 in stock or index, including reinvestment of dividends.
Previous: Item 4. MINE SAFETY DISCLOSURES · Next: Item 6. SELECTED FINANCIAL DATA