 filings.tools
Corpay 10-K 2015-12-31
Filed 2016-02-29. 21 sections, 500K characters. Original on sec.gov · Markdown · JSON
Cover and table of contents
10-K 1 d18451d10k.htm 10-K
Table of Contents
UNITED STATES
SECURITIES AND EXCHANGE COMMISSION
Washington, D.C. 20549
FORM 10-K
| x | ANNUAL REPORT PURSUANT TO SECTION 13 OR 15(d) OF THE SECURITIES EXCHANGE ACT OF 1934 |
|---|
For the Fiscal Year Ended December 31, 2015
OR
| ¨ | TRANSITION REPORT PURSUANT TO SECTION 13 OR 15(d) OF THE SECURITIES EXCHANGE ACT OF 1934 |
|---|
For the Transition Period From to
Commission File Number 001-35004
FLEETCOR TECHNOLOGIES, INC.
| DELAWARE | 72-1074903 | |
| (STATE OF INCORPORATION) | (I.R.S. ID) |
5445 Triangle Parkway, Suite 400, Norcross, Georgia 30092-2575
(770) 449-0479
Securities registered pursuant to Section 12(b) of the Act:
| COMMON STOCK, $0.001 PAR VALUE PER SHARE | NEW YORK STOCK EXCHANGE |
Securities registered pursuant to Section 12(g) of the Act:
NONE
Indicate by check mark if the registrant is a well-known seasoned issuer, as defined in Rule 405 of the Securities Act. Yes x No ¨
Indicate by check mark if the registrant is not required to file reports pursuant to Section 13 or Section 15(d) of the Exchange Act. Yes ¨ No x
Indicate by check mark whether the registrant (1) has filed all reports required to be filed by Section 13 or 15(d) of the Securities Exchange Act of 1934 during the preceding 12 months (or for such shorter period that the registrant was required to file such reports), and (2) has been subject to such filing requirements for the past 90 days. Yes x No ¨
Indicate by check mark whether the registrant has submitted electronically and posted on its corporate Web site, if any, every Interactive Data File required to be submitted and posted pursuant to Rule 405 of Regulation S-T (§232.405 of this chapter) during the preceding 12 months (or for such shorter period that the registrant was required to submit and post such files). Yes x No ¨
Indicate by check mark if disclosure of delinquent filers pursuant to Item 405 of Regulation S-K (§229.405 of this chapter) is not contained herein, and will not be contained, to the best of registrant’s knowledge, in definitive proxy or information statements incorporated by reference in Part III of this Form 10-K or any amendment to this Form 10-K. ¨
Indicate by check mark whether the registrant is a large accelerated filer, an accelerated filer, a non-accelerated filer, or a smaller reporting company. See the definitions of “large accelerated filer,” “accelerated filer” and “smaller reporting company” in Rule 12b-2 of the Exchange Act.
| Large accelerated filer | x | Accelerated filer | ¨ | |||
| Non-accelerated filer | ¨ (Do not check if a smaller reporting company) | Smaller reporting company | ¨ |
Indicate by check mark whether the registrant is a shell company (as defined in Rule 12b-2 of the Exchange Act). Yes ¨ No x
The aggregate market value of the registrant’s common stock held by non-affiliates of the registrant was approximately $13,498,625,921 as of June 30, 2015, the last business day of the registrant’s most recently completed second fiscal quarter, based on the closing sale price as reported on the New York Stock Exchange.
As of February 15, 2016, there were 92,616,940 shares of common stock outstanding.
DOCUMENTS INCORPORATED BY REFERENCE
Portions of the registrant’s definitive Proxy Statement to be delivered to shareholders in connection with the Annual Meeting of Shareholders to be held on June 8, 2016 are incorporated by reference into Part III of this report.
Table of Contents
FLEETCOR TECHNOLOGIES, INC.
FORM 10-K
For The Year Ended December 31, 2015
INDEX
Table of Contents
Note About Forward-Looking Statements
This report contains forward-looking statements within the meaning of the federal securities laws. Statements that are not historical facts, including statements about FleetCor’s beliefs, expectations and future performance, are forward-looking statements. Forward-looking statements can be identified by the use of words such as “anticipate,” “intend,” “believe,” “estimate,” “plan,” “seek,” “project” or “expect,” “may,” “will,” “would,” “could” or “should,” the negative of these terms or other comparable terminology.
These forward-looking statements are not a guarantee of performance, and you should not place undue reliance on such statements. We have based these forward-looking statements largely on our current expectations and projections about future events. Forward-looking statements are subject to many uncertainties and other variable circumstances, including those discussed in this report in Item 1A, “Risk factors,” and Item 7, “Management’s Discussion and Analysis of Financial Condition and Results of Operations,” many of which are outside of our control, that could cause our actual results and experience to differ materially from any forward-looking statement. Given these risks and uncertainties, you are cautioned not to place undue reliance on these forward-looking statements. The forward-looking statements included in this report are made only as of the date hereof. We do not undertake, and specifically disclaim, any obligation to update any such statements or to publicly announce the results of any revisions to any of such statements to reflect future events or developments.
Table of Contents
PART I
Item 1. BUSINESS
General
FleetCor is a leading independent global provider of fuel cards, commercial payment and data solutions, lodging and transportation management services, stored value solutions, and workforce payment products and services to businesses, retailers, commercial fleets, major oil companies, petroleum marketers and government entities in countries throughout North America, Latin America, Europe, Australia and New Zealand. Our payment programs enable our customers to better manage and control their commercial payments, card programs, and employee spending and provide card-accepting merchants with a high volume customer base that can increase their sales and customer loyalty. We also provide a suite of fleet related and workforce payment solution products, including mobile telematics services, fleet maintenance management and employee benefit and transportation related payments. In 2015, we processed approximately 1.9 billion transactions on our proprietary networks and third-party networks (which includes approximately 1.3 billion transactions related to our SVS product, acquired with Comdata, Inc. (“Comdata”)). We believe that our size and scale, geographic reach, advanced technology and our expansive suite of products, services, brands and proprietary networks contribute to our leading industry position.
We provide our payment products and services in a variety of combinations to create customized payment solutions for our customers and partners. In order to deliver our payment programs and services and process transactions, we own and operate proprietary “closed-loop” networks through which we electronically connect to merchants and capture, analyze and report customized information. We also use third-party networks to deliver our payment programs and services in order to broaden our card acceptance and use. To support our payment products, we also provide a range of services, such as issuing and processing, as well as specialized information services that provide our customers with value-added functionality and data. Our customers can use this data to track important business productivity metrics, combat fraud and employee misuse, streamline expense administration and lower overall workforce and fleet operating costs.
We market our fleet payment products directly to a broad range of commercial fleet customers, oil companies, petroleum marketers and government entities. Among these customers, we provide our products and services to commercial fleets of all sizes. These fleets include small and medium commercial fleets, which we believe represent an attractive segment of the global commercial fleet market given their relatively high use of less efficient payment products, such as cash and general purpose credit cards. We also manage commercial fleet card programs for major oil companies, such as British Petroleum (BP) (including its subsidiary Arco), Chevron and Shell, and over 900 petroleum marketers.
We distribute our commercial payment solutions through direct and indirect channels to businesses of all sizes and types across a broad number of industry verticals, including retail, healthcare, construction and hospitality. Our indirect channel includes a broad range of value-added resellers (VARs) and other referral partners.
We refer to these major oil companies, leasing companies, petroleum marketers, VARs and other referral partners with whom we have strategic relationships as our “partners.” These partners collectively maintain hundreds of thousands of end-customer relationships with commercial fleets, commercial payment solutions customers and other businesses.
FleetCor’s predecessor company was organized in the United States in 1986.
Our products and services
We collectively refer to our suite of product offerings as workforce productivity enhancement products for commercial businesses. We sell a range of customized fleet and lodging payment programs directly and indirectly to our customers through partners, such as major oil companies, leasing companies and petroleum
Table of Contents
marketers. We provide our customers with various card products that typically function like a charge card to purchase fuel, lodging, food, toll, transportation and related products and services at participating locations. We support these cards with specialized issuing, processing and information services that enable us to manage card accounts, facilitate the routing, authorization, clearing and settlement of transactions, and provide value-added functionality and data, including customizable card-level controls and productivity analysis tools. Depending on our customers and partners needs, we provide these services in a variety of outsourced solutions ranging from a comprehensive “end-to-end” solution (encompassing issuing, processing and network services) to limited back office processing services.
Our broad suite of commercial payment solutions with vertical-specific applications enable our corporate customers to manage and control electronic payments across their enterprise, optimize corporate spending and offer innovative services that increase employee efficiency and customer loyalty. Our commercial payment solutions offer integrated components that create a powerful combination of robust payment functionality, deep business insights and comprehensive technical capabilities and support services.
In addition, we offer a telematics solution that combines global positioning, satellite tracking and other wireless technology to allow fleet operators to monitor the capacity utilization and movement of their vehicles and drivers. We also provide a vehicle maintenance service offering that helps fleet customers to better manage their vehicle maintenance, service, and repair needs in the U.K. In Mexico, we offer primarily prepaid fuel and food vouchers and cards that may be used as a form of payment in restaurants, grocery stores and gas stations. We market these payment products to small, medium and large businesses, which provide these cards and vouchers to their employees as benefits, as well as a tool to manage fuel expenses. We offer a similar workforce payment product in Brazil related to public transportation and toll vouchers. Additionally in Brazil, we have designed proprietary equipment which, when installed at the fueling site and on the vehicle and combined with our processing system, significantly reduces the likelihood of unauthorized and fraudulent transactions. We offer this product to over-the-road trucking fleets, shipping fleets and other operators of heavily industrialized equipment, including sea-going vessels, mining equipment, agricultural equipment, and locomotives. Other than our fuel card products and services, no other products or services accounted for 10% or more of consolidated revenues in any of the last three fiscal years.
Networks
In order to deliver our payment programs and services, we own and operate proprietary closed-loop networks in North America and internationally. We also utilize the networks of our major oil and petroleum marketer partners in certain markets. Our networks have well-established brands in local markets and proprietary technology that enable us to capture, transact, analyze and report value-added information pertinent to managing and controlling employee spending. Examples of our networks include:
North America proprietary closed-loop networks
| • | Fuelman network—our primary proprietary fleet card network in the United States. We have negotiated card acceptance and settlement terms with over 11,000 individual merchants, providing the Fuelman network with approximately 56,000 fueling sites and over 29,000 maintenance sites across the country. |
|---|
| | • | | Comdata Network—our network of truck stops and fuel merchants for the over-the-road trucking industry. We have negotiated card acceptance and settlement term
Showing the first 8K of 75K characters. Open the full section
Item 1A. RISK FACTORS
You should carefully consider the following risks applicable to us. If any of the following risks actually occur, our business, operating results, financial condition and the trading price of our common stock could be materially adversely affected. The risks discussed below also include forward-looking statements, and our actual results may differ substantially from those discussed in these forward-looking statements. See “Note Regarding Forward-Looking Statements” in this report.
Risks related to our business
A decline in retail fuel prices could adversely affect our revenue and operating results.
Our fleet customers use our products and services primarily in connection with the purchase of fuel. Accordingly, our revenue is affected by fuel prices, which are subject to significant volatility. A decline in retail fuel prices could cause a decrease in our revenue from fees paid to us by merchants based on a percentage of each transaction purchase amount. We believe that in 2015, approximately 15% of our consolidated revenue was directly influenced by the absolute price of fuel. Changes in the absolute price of fuel may also impact unpaid account balances and the late fees and charges based on these amounts. A decline in retail fuel prices could adversely affect our revenue and operating results.
Fuel prices are dependent on several factors, all of which are beyond our control. These factors include, among others:
| • | supply and demand for oil and gas, and market expectations regarding supply and demand; |
|---|
| • | actions by members of OPEC and other major oil-producing nations; |
|---|
| • | new oil production being developed in the U.S. and elsewhere; |
|---|
| • | political conditions in oil-producing and gas-producing nations, including insurgency, terrorism or war; |
|---|
| • | oil refinery capacity; |
|---|
| • | weather; |
|---|
| • | the prices of foreign exports; |
|---|
| • | speculative trading; |
|---|
| • | the implementation of fuel efficiency standards and the adoption by our fleet customers of vehicles with greater fuel efficiency or alternative fuel sources; |
|---|
| • | general worldwide economic conditions; and |
|---|
| • | governmental regulations, taxes and tariffs. |
|---|
A portion of our revenue is derived from fuel-price spreads. As a result, a contraction in fuel-price spreads could adversely affect our operating results.
Approximately 12% of our consolidated revenue in 2015 was derived from transactions where our revenue is tied to fuel-price spreads. Fuel-price spreads equal the difference between the fuel price we charge to the fleet customer and the fuel price paid to the fuel merchant. In transactions where we derive revenue from fuel-price spreads, the fuel price paid to the fuel merchant is calculated as the merchant’s wholesale cost of fuel plus a commission. The merchant’s wholesale cost of fuel is dependent on several factors including, among others, the factors described above affecting fuel prices. The fuel price that we charge to our fleet customer is dependent on several factors including, among others, the fuel price paid to the fuel merchant, posted retail fuel prices and competitive fuel prices. We experience fuel-price spread contraction when the merchant’s wholesale cost of fuel increases at a faster rate than the fuel price we charge to our fleet customers, or the fuel price we charge to our fleet customers decreases at a faster rate than the merchant’s wholesale cost of fuel. Accordingly, when fuel-price spreads contract, we generate less revenue, which could adversely affect our operating results.
Table of Contents
If we fail to adequately assess and monitor credit risks of our customers, we could experience an increase in credit loss.
We are subject to the credit risk of our customers, which range in size from small, sole proprietorships to large, publicly traded companies. We use various methods to screen potential customers and establish appropriate credit limits, but these methods cannot eliminate all potential credit risks and may not always prevent us from approving customer applications that are not credit worthy or are fraudulently completed. Changes in our industry, customer demand, and, in relation to our fleet customers, movement in fuel prices may result in periodic increases to customer credit limits and spending and, as a result, could lead to increased credit losses. We may also fail to detect changes to the credit risk of customers over time. Further, during a declining economic environment, we experience increased customer defaults and preference claims by bankrupt customers. If we fail to adequately manage our credit risks, our bad debt expense could be significantly higher than historic levels and adversely affect our business, operating results and financial condition.
We derive a significant portion of our revenue from program fees and charges paid by the users of our cards. Any decrease in our receipt of such fees and charges, or limitations on our fees and charges, could adversely affect our business, results of operations and financial condition.
Our card programs include a variety of fees and charges associated with transactions, cards, reports, optional services and late payments. We derived approximately 72% of our consolidated revenues from these fees and charges during the year ended December 31, 2015. If the users of our cards decrease their transaction activity, or the extent to which they use optional services or pay invoices late, our revenue could be materially adversely affected. In addition, several market factors can affect the amount of our fees and charges, including the market for similar charges for competitive card products and the availability of alternative payment methods such as cash or house accounts. Furthermore, regulators and Congress have scrutinized the electronic payments industry’s pricing, charges and other practices related to its customers. Any legislative or regulatory restrictions on our ability to price our products and services could materially and adversely affect our revenue. Any decrease in our revenue derived from these fees and charges could materially and adversely affect our business, operating results and financial condition.
We operate in a competitive business environment, and if we are unable to compete effectively, our business, operating results and financial condition would be adversely affected.
The market for our products and services is highly competitive, and competition could intensify in the future. Our competitors vary in size and in the scope and breadth of the products and services they offer. In the fleet card business, our primary competitors in North America are small, regional and large independent fleet card providers, major oil companies and petroleum marketers that issue their own fleet cards and major financial services companies that provide card services to major oil companies and petroleum marketers. In the commercial payments business, we face a variety of competitors, some of which have greater financial resources, name recognition and scope and breadth of products and services. Competitors in the hotel card business include travel agencies, online lodging discounters, internal corporate procurement and travel resources, and independent services companies, among others. Competitors in the mobile telematics business include the major car companies, wireless phone service providers and independent services companies, among others. We also compete for customers with providers of alternative payment mechanisms, such as merchants offering house cash a
Showing the first 8K of 86K characters. Open the full section
Item 1B. UNRESOLVED STAFF COMMENTS
We have no unresolved written comments regarding our periodic or current reports from the staff of the SEC.
Table of Contents
Item 2. PROPERTIES
We lease all of the real property used in our business, except as noted below. The following table lists each of our material facilities and its location, use and approximate square footage, at December 31, 2015.
| Facility | Use | Approximate size | ||||
| United States | Square Feet | |||||
| Norcross, Georgia | Corporate headquarters and operations | 81,000 | ||||
| Covington, Louisiana | Corporate accounting, treasury and merchant authorization | 13,600 | ||||
| Houston, Texas | Credit and collections | 6,300 | ||||
| Concord, California | Customer support | 7,100 | ||||
| Wichita, Kansas | CLC operations and customer support | 31,100 | ||||
| Atlanta, Georgia | NexTraq sales, operations and customer support | 36,800 | ||||
| Tampa, Florida | NexTraq sales | 8,300 | ||||
| Sunnyvale, California | Telenav sales, operations and customer support | 15,100 | ||||
| Salem, Oregon | Pacific Pride sales, operations and customer support | 10,000 | ||||
| Brentwood, Tennessee | Comdata sales, operations and customer support | 228,000 | ||||
| Nashville, Tennessee | Comdata operations | 38,300 | ||||
| Franklin, Tennessee | Comdata warehouse facility | 20,100 | ||||
| Louisville, Kentucky | SVS sales, operations and customer support | 66,000 | ||||
| Austin, Texas | Comdata operations | 4,300 | ||||
| International | ||||||
| Prague, Czech Republic | CCS headquarters and Shell Europe (Germany, Austria, Poland and Hungary) operations | 35,000 | ||||
| Mexico City, Mexico(1) | FleetCor Mexico headquarters and operations | 22,500 | ||||
| Moscow, Russia | PPR and NKT headquarters, sales, customer support, operations, credit and collections | 16,300 | ||||
| Bryansk, Russia | Sales and marketing | 19,900 | ||||
| Ipswich, United Kingdom(1) | Operations, sales and customer support | 17,900 | ||||
| Knaresborough, United Kingdom | Operations, sales and customer support | 5,100 | ||||
| London, United Kingdom | Europe headquarters | 2,800 | ||||
| Swindon, United Kingdom | Allstar and Shell Europe (Belgium, Netherlands and France) operations, sales and customer support | 18,300 | ||||
| Walsall, United Kingdom | Operations, sales and customer support | 9,500 | ||||
| Birmingham, United Kingdom | EPYX headquarters, sales, operations and customer support | 12,500 | ||||
| Sao Paulo, Brazil | CTF and VB Servicios headquarters, sales, customer support and operations | 32,300 | ||||
| Osasco, Brazil | CTF and VB Servicios operations | 7,100 | ||||
| Rio de Janeiro, Brazil | DB Trans and AExpresso headquarters, sales, operations and customer support | 15,300 | ||||
| Auckland, New Zealand | CardLink headquarters, sales, operations and customer support | 12,100 | ||||
| Nurnberg, Germany | Shell Europe sales | 3,800 |
| (1) | We own these facilities. |
|---|
We also lease a number of minor additional facilities, including local sales and operations offices less than 2,550 square feet, small storage facilities and a small number of service stations in the United Kingdom; which are not included in the above list. We believe our facilities are adequate for our needs for at least the next 12 months. We anticipate that suitable additional or alternative facilities will be available to accommodate foreseeable expansion of our operations.
Table of Contents
Item 3. LEGAL PROCEEDINGS
As of the date of this filing, we are not currently party to any legal proceedings or governmental inquiries or investigations that we consider to be material and we were not involved in any material legal proceedings that terminated during the fourth quarter. We are and may become, however, subject to lawsuits from time to time in the ordinary course of our business.
Item 4. MINE SAFETY DISCLOSURES
Item 5. MARKET FOR REGISTRANT’S COMMON EQUITY, RELATED STOCKHOLDER
MATTERS, AND ISSUER PURCHASES OF EQUITY SECURITIES
Our common stock is traded on the New York Stock Exchange (NYSE) under the symbol “FLT”. As of December 31, 2015, there were 45 holders of record of our common stock. The table set forth below provides the intraday high and low sales prices per share of our common stock for the four quarters during 2015 and 2014.
| High | Low | |||||||
| 2015: | ||||||||
| First Quarter | $ | 158.45 | $ | 135.73 | ||||
| Second Quarter | 165.67 | 149.75 | ||||||
| Third Quarter | 164.61 | 135.16 | ||||||
| Fourth Quarter | 157.97 | 134.55 | ||||||
| 2014: | ||||||||
| First Quarter | $ | 130.57 | $ | 101.69 | ||||
| Second Quarter | 133.73 | 108.75 | ||||||
| Third Quarter | 148.60 | 128.64 | ||||||
| Fourth Quarter | 156.05 | 123.44 |
DIVIDENDS AND SHARE REPURCHASES
We currently expect to retain all future earnings, if any, for use in the operation and expansion of our business. We have never declared or paid any dividends on our common stock and do not anticipate paying cash dividends to holders of our common stock in the foreseeable future. In addition, our credit agreements restrict our ability to pay dividends. Any determination to pay dividends in the future will be at the discretion of our board of directors and will depend upon, among other factors, our results of operations, financial condition, capital requirements and covenants in our existing financing arrangements and any future financing arrangements.
On February 4, 2016, our Board of Directors approved a stock repurchase program under which we may begin purchasing up to $500 million of its common stock over the next 18 months. Any stock repurchases may be made at times and in such amounts as we deem appropriate. The timing and amount of stock repurchase, if any, will depend on a variety of factors including the stock price, market conditions, corporate and regulatory requirements, and any additional constraints related to material inside information we may possess. The repurchases are expected to be funded by available cash flow from the business and working capital.
PERFORMANCE GRAPH
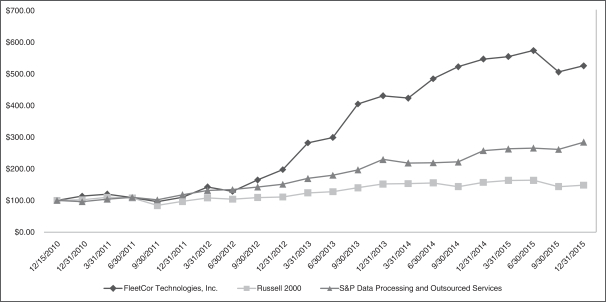
The following graph assumes $100 invested on December 15, 2010 (the date our shares first commenced trading), at the closing price ($27.25) of our common stock on that day, and compares (a) the percentage change of our cumulative total stockholder return on the common stock (as measured by dividing (i) the difference between our share price at the end and the beginning of the period presented by (ii) the share price at the beginning of the periods presented) with (b) (i) the Russell 2000 Index and (ii) the S&P 500® Data Processing & Outsourced Services.
| Period Ending | FleetCor Technologies, Inc. | Russell 2000 | S&P Data Processing and Outsourced Services | |||||||||
| 12/15/2010 | $ | 100.00 | $ | 100.00 | $ | 100.00 | ||||||
| 12/31/2010 | $ | 113.47 | $ | 101.99 | $ | 95.81 |
Table of Contents
| Period Ending | FleetCor Technologies, Inc. | Russell 2000 | S&P Data Processing and Outsourced Services | |||||||||
| 3/31/2011 | $ | 119.85 | $ | 109.79 | $ | 103.76 | ||||||
| 6/30/2011 | $ | 108.77 | $ | 107.69 | $ | 109.64 | ||||||
| 9/30/2011 | $ | 96.37 | $ | 83.84 | $ | 101.69 | ||||||
| 12/31/2011 | $ | 109.61 | $ | 96.43 | $ | 117.84 | ||||||
| 3/31/2012 | $ | 142.28 | $ | 108.06 | $ | 131.45 | ||||||
| 6/30/2012 | $ | 128.59 | $ | 103.92 | $ | 134.18 | ||||||
| 9/30/2012 | $ | 164.40 | $ | 108.99 | $ | 142.48 | ||||||
| 12/31/2012 | $ | 196.88 | $ | 110.54 | $ | 150.84 | ||||||
| 3/31/2013 | $ | 281.36 | $ | 123.84 | $ | 169.26 | ||||||
| 6/30/2013 | $ | 298.35 | $ | 127.22 | $ | 179.29 | ||||||
| 9/30/2013 | $ | 404.26 | $ | 139.75 | $ | 196.49 | ||||||
| 12/31/2013 | $ | 429.98 | $ | 151.44 | $ | 228.94 | ||||||
| 3/31/2014 | $ | 422.39 | $ | 152.67 | $ | 217.93 | ||||||
| 6/30/2014 | $ | 483.67 | $ | 155.26 | $ | 218.52 | ||||||
| 9/30/2014 | $ | 521.54 | $ | 143.38 | $ | 221.34 | ||||||
| 12/31/2014 | $ | 545.72 | $ | 156.79 | $ | 256.74 | ||||||
| 3/31/2015 | $ | 553.83 | $ | 163.04 | $ | 262.43 | ||||||
| 6/30/2015 | $ | 572.70 | $ | 163.20 | $ | 265.08 | ||||||
| 9/30/2015 | $ | 505.03 | $ | 143.25 | $ | 260.96 | ||||||
| 12/31/2015 | $ | 524.51 | $ | 147.83 | $ | 283.80 |
RECENT SALES OF UNREGISTERED SECURITIES AND USE OF PROCEEDS
Not Applicable.
Table of Contents
Item 6. SELECTED FINANCIAL DATA
We derived the consolidated statement of income and other financial data for the years ended December 31, 2015, 2014 and 2013 and the selected consolidated balance sheet data as of December 31, 2015 and 2014 from the audited consolidated financial statements included elsewhere in this report. We derived the selected historical financial data for the years ended December 31, 2012 and 2011 and the selected consolidated balance sheets as of December 31, 2013, 2012 and 2011 from our audited consolidated financial statements that are not included in this report.
The selected consolidated financial data set forth below should be read in conjunction with “Management’s Discussion and Analysis of Financial Condition and Results of Operations” and our audited consolidated financial statements and notes thereto included elsewhere in this report. Our historical results are not necessarily indicative of the results to be expected in any future period.
| (in thousands, except per share data) | 2015 | 2014 | 2013 | 2012 | 2011 | |||||||||||||||
| Consolidated statement of income data: | ||||||||||||||||||||
| Revenues, net | $ | 1,702,865 | $ | 1,199,390 | $ | 895,171 | $ | 707,534 | $ | 519,591 | ||||||||||
| Expenses: | ||||||||||||||||||||
| Merchant commissions | 108,257 | 96,254 | 68,143 | 58,573 | 51,199 | |||||||||||||||
| Processing | 331,073 | 173,337 | 134,030 | 115,446 | 84,516 | |||||||||||||||
| Selling | 109,075 | 75,527 | 57,346 | 46,429 | 36,606 | |||||||||||||||
| General and administrative | 297,715 | 205,963 | 142,283 | 110,122 | 84,765 | |||||||||||||||
| Depreciation and amortization | 193,453 | 112,361 | 72,737 | 52,036 | 36,171 | |||||||||||||||
| Other operating, net | (4,242 | ) | (29,501 | ) | — | — | — | |||||||||||||
| Operating income | 667,534 | 565,449 | 420,632 | 324,928 | 226,334 | |||||||||||||||
| Equity method investment loss | 57,668 | 8,586 | — | — | — | |||||||||||||||
| Other expense (income), net | 2,523 | (700 | ) | 602 | 1,121 | (589 | ) | |||||||||||||
| Interest expense, net | 71,339 | 28,856 | 16,461 | 13,017 | 13,377 | |||||||||||||||
| Loss on early extinguishment of debt | — | 15,764 | — | — | 2,669 | |||||||||||||||
| Total other expense | 131,530 | 52,506 | 17,063 | 14,138 | 15,457 | |||||||||||||||
| Income before income taxes | 536,004 | 512,943 | 403,569 | 310,790 | 210,877 | |||||||||||||||
| Provision for income taxes | 173,573 | 144,236 | 119,068 | 94,591 | 63,542 | |||||||||||||||
| Net income | $ | 362,431 | $ | 368,707 | $ | 284,501 | $ | 216,199 | $ | 147,335 | ||||||||||
| Earnings per share: | ||||||||||||||||||||
| Earnings per share, basic | $ | 3.94 | $ | 4.37 | $ | 3.48 | $ | 2.59 | $ | 1.83 | ||||||||||
| Earnings per share, diluted | $ | 3.85 | $ | 4.24 | $ | 3.36 | $ | 2.52 | $ | 1.76 | ||||||||||
| Weighted average shares outstanding, basic | 92,023 | 84,317 | 81,793 | 83,328 | 80,610 | |||||||||||||||
| Weighted average shares outstanding, diluted | 94,139 | 86,982 | 84,655 | 85,736 | 83,654 | |||||||||||||||
| As of December 31, | ||||||||||||||||||||
| (in thousands) | 2015 | 2014 | 2013 | 2012 | 2011 | |||||||||||||||
| Consolidated balance sheet data: | ||||||||||||||||||||
| Cash and cash equivalents | $ | 447,152 | $ | 477,069 | $ | 338,105 | $ | 283,649 | $ | 285,159 | ||||||||||
| Restricted cash(1) | 167,492 | 135,144 | 48,244 | 53,674 | 55,762 | |||||||||||||||
| Total assets(2) | 7,891,868 | 8,524,701 | 3,908,717 | 2,721,870 | 2,349,169 | |||||||||||||||
| Total debt | 2,937,062 | 3,593,717 | 1,486,378 | 925,092 | 704,265 | |||||||||||||||
| Total stockholders’ equity(2) | 2,830,047 | 2,618,562 | 1,223,502 | 913,822 | 811,436 |
Table of Contents
| (1) | Restricted cash represents customer deposits repayable on demand. |
|---|
| (2) | Revision of Previously Issued Financial Statements— We have revised previously reported balances within our Consolidated Balance Sheets as of December 31, 2014 and 2013, to translate these balances using the correct functional currencies. This revision had no effect on our Consolidated Statements of Income or Consolidated Statements of Cash Flows. We do not believe this revision was material to any prior period financial statement. See Footnote 2 to the Consolidated Financial Statements, Summary of Significant Accounting Policies. |
|---|
Table of Contents
Item 7. MANAGEMENT’S DISCUSSION AND ANALYSIS OF FINANCIAL CONDITION AND
RESULTS OF OPERATIONS
The following discussion and analysis of our financial condition and results of operations should be read in conjunction with the consolidated financial statements and related notes appearing elsewhere in this report. In addition to historical information, this discussion contains forward-looking statements that involve risks, uncertainties and assumptions that could cause actual results to differ materially from management’s expectations. Factors that could cause such differences include, but are not limited to, those identified below and those described in Item 1A “Risk Factors” appearing elsewhere in this report. All foreign currency amounts that have been converted into U.S. dollars in this discussion are based on the exchange rate as reported by Oanda for the applicable periods.
General Business
FleetCor is a leading independent global provider of fuel cards, commercial payment and data solutions, stored value solutions, and workforce payment products and services to businesses, retailers, commercial fleets, major oil companies, petroleum marketers and government entities in countries throughout North America, South America, Europe, Australia and New Zealand. Our payment programs enable our customers to better manage and control their commercial payments, card programs, and employee spending and provide card-accepting merchants with a high volume customer base that can increase their sales and customer loyalty. We also provide a suite of fleet related and workforce payment solution products, including a mobile telematics service, fleet maintenance management and employee benefit and transportation related payments. In 2015, we processed approximately 1.9 billion transactions on our proprietary networks and third-party networks (which includes approximately 1.3 billion transactions related to our SVS product, acquired with Comdata). We believe that our size and scale, geographic reach, advanced technology and our expansive suite of products, services, brands and proprietary networks contribute to our leading industry position.
We provide our payment products and services in a variety of combinations to create customized payment solutions for our customers and partners. We collectively refer to our suite of product offerings as workforce productivity enhancement products for commercial businesses. We sell a range of customized fleet and lodging payment programs directly and indirectly to our customers through partners, such as major oil companies, leasing companies and petroleum marketers. We refer to these major oil companies, leasing companies, petroleum marketers, value-added resellers (VARs) and other referral partners with whom we have strategic relationships as our “partners.” We provide our customers with various card products that typically function like a charge card to purchase fuel, lodging, food, toll, transportation and related products and services at participating locations.
We support our products with specialized issuing, processing and information services that enable us to manage card accounts, facilitate the routing, authorization, clearing and settlement of transactions, and provide value-added functionality and data, including customizable card-level controls and productivity analysis tools. In order to deliver our payment programs and services and process transactions, we own and operate proprietary “closed-loop” networks through which we electronically connect to merchants and capture, analyze and report customized information in North America and internationally. We also use third-party networks to deliver our payment programs and services in order to broaden our card acceptance and use. To support our payment products, we also provide a range of services, such as issuing and processing, as well as specialized information services that provide our customers with value-added functionality and data. Our customers can use this data to track important business productivity metrics, combat fraud and employee misuse, streamline expense administration and lower overall workforce and fleet operating costs. Depending on our customers’ and partners’ needs, we provide these services in a variety of outsourced solutions ranging from a comprehensive “end-to-end” solution (encompassing issuing, processing and network services) to limited back office processing services.
FleetCor’s predecessor company was organized in the United States in 1986. In 2000, our current chief executive officer joined us and we changed our name to FleetCor Technologies, Inc. Since 2000, we have grown significantly
Table of Contents
through a combination of organic initiatives, product and service innovation and over 65 acquisitions of businesses and commercial account portfolios. Our corporate headquarters are located in Norcross, Georgia. As of December 31, 2015, we employed approximately 5,330 employees, approximately 2,660 of whom are located in the United States.
Executive Overview
We operate in two segments, which we refer to as our North America and International segments. See “Results of Operations” for additional segment information.
Our revenue is reported net of the wholesale cost for underlying products and services. In this report, we refer to this net revenue as “revenue.” For the years ended December 31, 2015, 2014 and 2013, our North America and International segments generated the following revenue:
| Year ended December 31, | ||||||||||||||||||||||||
| 2015 | 2014 | 2013 | ||||||||||||||||||||||
| (dollars in millions) | Revenues, net | % of total revenues, net | Revenues, net | % of total revenues, net | Revenues, net | % of total revenues, net | ||||||||||||||||||
| North America | $ | 1,232.0 | 72.3 | % | $ | 668.3 | 55.7 | % | $ | 460.7 | 51.5 | % | ||||||||||||
| International | 470.9 | 27.7 | % | 531.1 | 44.3 | % | 434.5 | 48.5 | % | |||||||||||||||
| $ | 1,702.9 | 100.0 | % | $ | 1,199.4 | 100.0 | % | $ | 895.2 | 100.0 | % | |||||||||||||
Sources of Revenue
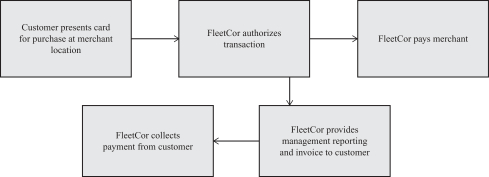
Transactions. In both of our segments, we derive revenue from transactions. As illustrated in the diagram below, a transaction is defined as a purchase by a customer. Our customers include holders of our card products and those of our partners, for whom we manage card programs, members of our proprietary networks who are provided access to our products and services and commercial businesses to whom we provide workforce payment productivity solutions. Revenue from transactions is derived from our merchant and network relationships, as well as our customers and partners. Through our merchant and network relationships we primarily offer fuel cards, corporate cards, virtual cards, purchasing cards, T&E cards, gift cards, stored value payroll cards, vehicle maintenance, food, fuel, toll and transportation cards and vouchers or lodging services to our customers.
The following diagram illustrates a typical card transaction flow, but may also be applied to our vehicle maintenance, lodging and food, fuel, toll and transportation card and voucher products, substituting transactions for gallons. This representative model may not include all of our businesses.
Illustrative Transaction Flow
[Table of Con
Showing the first 8K of 142K characters. Open the full section
Item 7A. QUANTITATIVE AND QUALITATIVE DISCLOSURES ABOUT MARKET RISK
Foreign currency risk
Our International segment exposes us to foreign currency exchange rate changes that can impact translations of foreign-denominated assets and liabilities into U.S. dollars and future earnings and cash flows from transactions denominated in different currencies. Revenue from our International segment was 27.7%, 44.3% and 48.5% of total revenue for the years ended December 31, 2015, 2014, and 2013, respectively. We measure foreign currency exchange risk based on changes in foreign currency exchange rates using a sensitivity analysis. The sensitivity analysis measures the potential change in earnings based on a hypothetical 10% change in currency exchange rates. Exchange rates and currency positions as of December 31, 2015 were used to perform the sensitivity analysis. Such analysis indicated that a hypothetical 10% change in foreign currency exchange rates would have increased or decreased consolidated operating income during the year ended December 31, 2015 by approximately $22.5 million had the U.S. dollar exchange rate increased or decreased relative to the currencies to which we had exposure. When exchange rates and currency positions as of December 31, 2014 and 2013 were used to perform this sensitivity analysis, the analysis indicated that a hypothetical 10% change in currency exchange rates would have increased or decreased consolidated operating income for the years ended December 31, 2014 and 2013 by approximately $27.8 million and $20.0 million, respectively.
Interest rate risk
We are exposed to changes in interest rates on our cash investments and debt. We invest our excess cash either to pay down our Securitization Facility debt or in securities that we believe are highly liquid and marketable in the short term. These investments are not held for trading or other speculative purposes. Under our $3.355 billion Credit Facility, we have syndicated $2.02 billion and $300 million term loan agreements with a syndicate of term loan A and term loan B investors in the United States, respectively, as well as a revolving A credit facility of $1.0 billion and a revolving B credit facility of $35 million. Interest on amounts outstanding under the Credit Agreement bear interest, at our election, at the British Bankers Association LIBOR Rate (the Eurocurrency Rate), plus a margin based on a leverage ratio, or at our option, the Base Rate (defined as the rate equal to the highest of (a) the Federal Funds Rate plus 0.50%, (b) the prime rate announced by Bank of America, N.A., or (c) the Eurocurrency Rate plus 1.00%) plus a margin based on a leverage ratio.
Prior to entering into our New Credit Agreement, we had borrowings outstanding under the Existing Credit Facility. On November 14, 2014, proceeds from our New Credit Agreement were used to retire our existing indebtedness under the Existing Credit Facility. Under our previously Existing Credit Facility, we had a syndicated $550 million term loan agreement with a syndicate of term loan B investors in the United States, as well as a $850 million revolving credit facility. Interest on amounts outstanding under the previously Existing Credit Agreement bore interest, at our election, at the British Bankers Association LIBOR Rate (the Eurocurrency Rate), plus a margin based on a leverage ratio, or at our option, the Base Rate (defined as the rate equal to the highest of (a) the Federal Funds Rate plus 0.50%, (b) the prime rate announced by Bank of America, N.A., or (c) the Eurocurrency Rate plus 1.00%) plus a margin based on a leverage ratio.
Based on the amounts and mix of our fixed and floating rate debt (exclusive of our Securitization Facility) at December 31, 2015, 2014 and 2013, if market interest rates had increased or decreased an average of 100 basis points, our interest expense would have changed by $23.2 million, $29.2 million and $11.4 million, respectively. We determined these amounts by considering the impact of the hypothetical interest rates on our borrowing costs. These analyses do not consider the effects of changes in the level of overall economic activity that could exist in such an environment.
Fuel price risk
Our fleet customers use our products and services primarily in connection with the purchase of fuel. Accordingly, our revenue is affected by fuel prices, which are subject to significant volatility. A decline in retail fuel prices
Table of Contents
could cause a change in our revenue from several sources, including fees paid to us based on a percentage of each customer’s total purchase. Changes in the absolute price of fuel may also impact unpaid account balances and the late fees and charges based on these amounts. The impact of changes in fuel price is somewhat mitigated by our agreements with certain merchants, where the price paid to the merchant is equal to the lesser of the merchant’s cost plus a markup or a percentage of the transaction purchase price. We do not enter into any fuel price derivative instruments.
Fuel-price spread risk
From our merchant and network relationships, we derive revenue from the difference between the price charged to a fleet customer for a transaction and the price paid to the merchant or network for the same transaction. The price paid to a merchant or network is calculated as the merchant’s wholesale cost of fuel plus a markup. The merchant’s wholesale cost of fuel is dependent on several factors including, among others, the factors described above affecting fuel prices. The fuel price that we charge to our customer is dependent on several factors including, among others, the fuel price paid to the fuel merchant, posted retail fuel prices and competitive fuel prices. We experience fuel-price spread contraction when the merchant’s wholesale cost of fuel increases at a faster rate than the fuel price we charge to our customers, or the fuel price we charge to our customers decreases at a faster rate than the merchant’s wholesale cost of fuel. Accordingly, if fuel-price spreads contract, we may generate less revenue, which could adversely affect our operating results. The impact of volatility in fuel spreads is somewhat mitigated by our agreements with certain merchants, where the price paid to the merchant is equal to the lesser of the merchant’s cost plus a markup or a percentage of the transaction purchase price.
Table of Contents
Item 8. FINANCIAL STATEMENTS AND SUPPLEMENTARY DATA
INDEX TO CONSOLIDATED FINANCIAL STATEMENTS
Table of Contents
Report of Independent Registered Public Accounting Firm
The Board of Directors and Stockholders of FleetCor Technologies, Inc. and Subsidiaries
We have audited the accompanying consolidated balance sheets of FleetCor Technologies, Inc. and subsidiaries as of December 31, 2015 and 2014, and the related consolidated statements of income, comprehensive income, stockholders’ equity, and cash flows for each of the three years in the period ended December 31, 2015. These financial statements are the responsibility of the Company’s management. Our responsibility is to express an opinion on these financial statements based on our audits.
We conducted our audits in accordance with the standards of the Public Company Accounting Oversight Board (United States). Those standards require that we plan and perform the audit to obtain reasonable assurance about whether the financial statements are free of material misstatement. An audit includes examining, on a test basis, evidence supporting the amounts and disclosures in the financial statements. An audit also includes assessing the accounting principles used and significant estimates made by management, as well as evaluating the overall financial statement presentation. We believe that our audits provide a reasonable basis for our opinion.
In our opinion, the financial statements referred to above present fairly, in all material respects, the consolidated financial position of FleetCor Technologies, Inc. and subsidiaries at December 31, 2015 and 2014, and the consolidated results of their operations and their cash flows for each of the three years in the period ended December 31, 2015, in conformity with U.S. generally accepted accounting principles.
We also have audited, in accordance with the standards of the Public Company Accounting Oversight Board (United States), FleetCor Technologies, Inc. and subsidiaries’ internal control over financial reporting as of December 31, 2015, based on criteria established in Internal Control-Integrated Framework issued by the Committee of Sponsoring Organizations of the Treadway Commission (2013 framework) and our report dated February 29, 2016 expressed an unqualified opinion thereon.
/s/ Ernst & Young LLP
Atlanta, Georgia
February 29, 2016
Table of Contents
Report of Independent Registered Public Accounting Firm
The Board of Directors and Stockholders of FleetCor Technologies, Inc. and Subsidiaries
We have audited FleetCor Technologies, Inc. and subsidiaries’ internal control over financial reporting as of December 31, 2015, based on criteria established in Internal Control—Integrated Framework issued by the Committee of Sponsoring Organizations of the Treadway Commission (2013 framework) (the COSO criteria). FleetCor Technologies, Inc. and subsidiaries’ management is responsible for maintaining effective internal control over financial reporting, and for its assessment of the effectiveness of internal control over financial reporting included in the accompanying Management’s Report on Internal Control Over Financial Reporting. Our responsibility is to express an opinion on the company’s internal control over financial reporting based on our audit.
We conducted our audit in accordance with the standards of the Public Company Accounting Oversight Board (United States). Those standards require that we plan and perform the audit to obtain reasonable assurance about whether effective internal control over financial reporting was maintained in all material respects. Our audit included obtaining an understanding of internal control over financial reporting, assessing the risk that a material weakness exists, testing and evaluating the design and operating effectiveness of internal control based on the assessed risk, and performing such other procedures as we considered necessary in the circumstances. We believe that our audit provides a reasonable basis for our opinion.
A company’s internal control over financial reporting is a process designed to provide reasonable assurance regarding the reliability of financial reporting and the preparation of financial statements for external purposes in accordance with generally accepted accounting principles. A company’s internal control over financial reporting includes those policies and procedures that (1) pertain to the maintenance of records that, in reasonable detail, accurately and fairly reflect the transactions and dispositions of the assets of the company; (2) provide reasonable assurance that transactions are recorded as necessary to permit preparation of financial statements in accordance with generally accepted accounting principles, and that receipts and expenditures of the company are being made only in accordance with authorizations of management and directors of the company; and (3) provide reasonable assurance regarding prevention or timely detection of unauthorized acquisition, use, or disposition of the company’s assets that could have a material effect on the financial statements.
Because of its inherent limitations, internal control over financial reporting may not prevent or detect misstatements. Also, projections of any evaluation of effectiveness to future periods are subject to the risk that controls may become inadequate because of changes in conditions, or that the degree of compliance with the policies or procedures may deteriorate.
In our opinion, FleetCor Technologies, Inc. and subsidiaries maintained, in all material respects, effective internal control over financial reporting as of December 31, 2015, based on the COSO criteria**.**
We also have audited, in accordance with the standards of the Public Company Accounting Oversight Board (United States), the consolidated balance sheets of FleetCor Technologies, Inc. and subsidiaries as of December 31, 2015 and 2014, and the related consolidated statements of income, comprehensive income, stockholders’ equity, and cash flows for each of the three years in the period ended December 31, 2015 of FleetCor Technologies, Inc. and subsidiaries and our report dated February 29, 2016 expressed an unqualified opinion thereon.
/s/ Ernst & Young LLP
Atlanta, Georgia
February 29, 2016
Table of Contents
FleetCor Technologies, Inc. and Subsidiaries
Consolidated Balance Sheets
(In Thousands, Except Share and Par Value Amounts)
| December 31, | ||||||||
| 2015 | 2014 | |||||||
| Assets | ||||||||
| Current assets: | ||||||||
| Cash and cash equivalents | $ | 447,152 | $ | 477,069 | ||||
| Restricted cash | 167,492 | 135,144 | ||||||
| Accounts receivable (less allowance for doubtful accounts of $21,903 and $23,842, respectively) | 638,954 | 673,797 | ||||||
| Securitized accounts receivable—restricted for securitization investors | 614,000 | 675,000 | ||||||
| Prepaid expenses and other current assets | 68,661 |
Showing the first 8K of 143K characters. Open the full section
Item 9. CHANGES IN AND DISAGREEMENTS WITH ACCOUNTANTS ON ACCOUNTING AND FINANCIAL DISCLOSURE
Not applicable.
Item 9A. CONTROLS AND PROCEDURES
Evaluation of Disclosure Controls and Procedures
As of December 31, 2015, management carried out, under the supervision and with the participation of our Chief Executive Officer and Chief Financial Officer, an evaluation of the effectiveness of the design and operation of our disclosure controls and procedures (as defined in Rules 13a-15(e) and 15d-15(e) under the Securities Exchange Act of 1934). Based on this evaluation, our Chief Executive Officer and Chief Financial Officer concluded that, as of December 31, 2015, our disclosure controls and procedures were effective in ensuring that information required to be disclosed by us in the reports that we file or submit under the Securities Exchange Act of 1934, as amended, is recorded, processed, summarized and reported within the time periods specified in applicable rules and forms and are designed to ensure that information required to be disclosed in those reports is accumulated and communicated to management, including our Chief Executive Officer and Chief Financial Officer, as appropriate to allow timely decisions regarding required disclosure.
Management Report on Internal Control over Financial Reporting
Our management team is responsible for establishing and maintaining adequate internal control over financial reporting as defined in Rules 13a-15(f) and 15d-15(f) under the Securities Exchange Act of 1934. Our management assessed the effectiveness of our internal control over financial reporting as of December 31, 2015. In making this assessment, our management used the criteria set forth by the Committee of Sponsoring Organizations of the Treadway Commission (COSO) in Internal Control-Integrated Framework. As of December 31, 2015, management believes that the Company’s internal control over financial reporting is effective based on those criteria. Our independent registered public accounting firm has issued an audit report on our internal control over financial reporting, which is included in this annual report.
Because of its inherent limitations, internal control over financial reporting may not prevent or detect all misstatements. Projections of any evaluation of effectiveness to future periods are subject to the risk that controls may become inadequate because of changes in conditions or that the degree of compliance with the policies or procedures may deteriorate. Internal control over financial reporting cannot provide absolute assurance of achieving financial reporting objectives because of its inherent limitations. Internal control over financial reporting is a process that involves human diligence and compliance and is subject to lapses in judgment and breakdowns resulting from human failures. Internal control over financial reporting also can be circumvented by collusion or improper management override. Due to such limitations, there is a risk that material misstatements may not be prevented or detected on a timely basis by internal control over financial reporting. However, these inherent limitations are known features of the financial reporting process. Therefore, it is possible to design into the process safeguards to reduce, though not eliminate, such risk.
Changes in Internal Control over Financial Reporting
There were no changes in our internal control over financial reporting during the quarter ended December 31, 2015 that have materially affected, or are reasonably likely to materially affect, our internal control over financial reporting.
Table of Contents
Item 9B. OTHER INFORMATION
Not applicable.
PART III
Item 10. DIRECTORS, EXECUTIVE OFFICERS AND CORPORATE GOVERNANCE
A list of our executive officers and biographical information appears in Part I, Item X of this Form 10-K. Information about our directors may be found under the caption “Nominees” and “Continuing Directors” in our Proxy Statement for the Annual Meeting of Shareholders to be held June 8, 2016 (the “Proxy Statement”). Information about our Audit Committee may be found under the caption “Board Committees” in the Proxy Statement. That information is incorporated herein by reference.
The information in the Proxy Statement set forth under the caption “Section 16(a) Beneficial Ownership Reporting Compliance” is incorporated herein by reference.
We have adopted the FleetCor Code of Business Conduct and Ethics (the “code of ethics”), which applies to our Chief Executive Officer, Chief Financial Officer, Chief Accounting Officer and Corporate Controller, and other finance organization employees. The code of ethics is publicly available on our Web site at www.fleetcor.com under Investor Relations. If we make any substantive amendments to the code of ethics or grant any waiver, including any implicit waiver, from a provision of the code to our Chief Executive Officer, Chief Financial Officer, or Chief Accounting Officer, we will disclose the nature of the amendment or waiver on that Web site or in a report on Form 8-K.
Item 11. EXECUTIVE COMPENSATION
The information in the Proxy Statement set forth under the captions “Director Compensation,” “Named Executive Officer Compensation,” “Compensation Committee Report,” and “Compensation Committee Interlocks and Insider Participation” is incorporated herein by reference.
Item 12. SECURITY OWNERSHIP OF CERTAIN BENEFICIAL OWNERS AND MANAGEMENT
AND RELATED STOCKHOLDER MATTERS
The information in the Proxy Statement set forth under the captions “Securities Authorized for Issuance Under Equity Compensation Plans,” “Information Regarding Beneficial Ownership of Principal Shareholders, Directors, and Management” and “Equity Compensation Plan Information” is incorporated herein by reference.
Item 13. CERTAIN RELATIONSHIPS AND RELATED TRANSACTIONS, AND DIRECTOR
INDEPENDENCE
The information set forth in the Proxy Statement under the captions “Director Independence” and “Certain Relationships and Related Transactions” is incorporated herein by reference.
Item 14. PRINCIPAL ACCOUNTANT FEES AND SERVICES
Information concerning principal accountant fees and services appears in the Proxy Statement under the headings “Fees Billed by Ernst & Young” and “Policy on Audit Committee Pre-Approval of Audit and Permissible Non-Audit Services of Independent Auditor” and is incorporated herein by reference.
Table of Contents
PART IV
Item 15. EXHIBITS AND FINANCIAL STATEMENT SCHEDULES
(a) Financial Statements and Schedules
The financial statements are set forth under Item 8 of this Form 10-K, as indexed below. Financial statement schedules have been omitted since they either are not required, not applicable, or the information is otherwise included.
Index to Financial Statements
Financial statement schedules have been omitted since they either are not required, not applicable, or the information is otherwise included.
(b) Exhibit Listing
| Exhibit no. | ||
| 2.1 | Stock Purchase Agreement, dated as of April 1, 2009, among FleetCor Technologies Operating Company, LLC, CLC Group, Inc., and the entities and individuals identified on the signature pages thereto (incorporated by reference to Exhibit No. 2.1 to Amendment No. 1 to the registrant’s Registration Statement on Form S-1, file number 333-166092, filed with the SEC on May 20, 2010) | |
| 2.2 | Share Purchase Agreement among Arval UK Group Limited, FleetCor UK Acquisition Limited and FleetCor Technologies, Inc. (incorporated by reference to exhibit No. 2.1 to the registrant’s Form 8-K, filed with the SEC on December 13, 2011) | |
| 2.3 | Agreement and Plan of Merger, dated August 12, 2014, by and among Comdata Inc., Ceridian LLC, FleetCor Technologies, Inc. and FCHC Project, Inc. (incorporated by reference to Exhibit No. 2.1 to the registrant’s Form 10-Q, filed with the SEC with the SEC on November 10, 2014) | |
| 2.4 | Amendment to Agreement and Plan of Merger, dated November 10, 2014, by and among Comdata Inc., Ceridian LLC, FleetCor Technologies, Inc. and FCHC Project, Inc. (incorporated by reference to Exhibit No. 10.2 to the registrant’s Form 8-K, filed with the SEC on November 17, 2014) | |
| 3.1 | Amended and Restated Certificate of Incorporation of FleetCor Technologies, Inc. (incorporated by reference to Exhibit 3.1 to the registrant’s Annual Report on Form 10-K, File No. 001-35004, filed with SEC on March 25, 2011) | |
| 3.2 | Amended and Restated Bylaws of FleetCor Technologies, Inc. (incorporated by reference to Exhibit 3.2 to the registrant’s Annual Report on Form 10-K, File No. 001-35004, filed with the SEC on March 25, 2011) | |
| 4.1 | Form of Stock Certificate for Common Stock (incorporated by reference to Exhibit 4.1 to Amendment No. 3 to the registrant’s Registration Statement on Form S-1, File No. 333-166092, filed with the SEC on June 29, 2010) |
Table of Contents
| Exhibit no. | ||
| 10.1* | Form of Indemnity Agreement entered into between FleetCor and its directors and executive officers (incorporated by reference to Exhibit 10.1 to Amendment No. 3 to the registrant’s Registration Statement on Form S-1, file number 333-166092, filed with the SEC on June 29, 2010) | |
| 10.2* | FleetCor Technologies, Inc. Amended and Restated Stock Incentive Plan (incorporated by reference to Exhibit 10.2 to Amendment No. 1 to the registrant’s Registration Statement on Form S-1, file number 333-166092, filed with the SEC on May 20, 2010) | |
| 10.3* | First Amendment to FleetCor Technologies, Inc. Amended and Restated Stock Incentive Plan (incorporated by reference to Exhibit 10.3 to Amendment No. 1 to the registrant’s Registration Statement on Form S-1, file number 333-166092, filed with the SEC on May 20, 2010) | |
| 10.4* | Second Amendment to FleetCor Technologies, Inc. Amended and Restated Stock Incentive Plan (incorporated by reference to Exhibit 10.4 to Amendment No. 1 to the registrant’s Registration Statement on Form S-1, file number 333-166092, filed with the SEC on May 20, 2010) | |
| 10.5* | Third Amendment to FleetCor Technologies, Inc. Amended and Restated Stock Incentive Plan (incorporated by reference to Exhibit 10.5 to Amendment No. 1 to the registrant’s Registration Statement on Form S-1, file number 333-166092, filed with the SEC on May 20, 2010) | |
| 10.6* | Fourth Amendment to FleetCor Technologies, Inc. Amended and Restated Stock Incentive Plan (incorporated by reference to Exhibit 10.6 to Amendment No. 1 to the registrant’s Registration Statement on Form S-1, file number 333-166092, filed with the SEC on May 20, 2010) | |
| 10.7* | Form of Incentive Stock Option Award Agreement pursuant to the FleetCor Technologies, Inc. Amended and Restated Stock Incentive Plan (incorporated by reference to Exhibit 10.7 to Amendment No. 1 to the registrant’s Registration Statement on Form S-1, file number 333-166092, filed with the SEC on May 20, 2010) | |
| 10.8* | Form of Non-Qualified Stock Option Award Agreement pursuant to the FleetCor Technologies, Inc. Amended and Restated Stock Incentive Plan (incorporated by reference to Exhibit 10.8 to Amendment No. 1 to the registrant’s Registration Statement on Form S-1, file number 333-166092, filed with the SEC on May 20, 2010) | |
| 10.9* | Form of Performance Share Restricted Stock Agreement pursuant to the FleetCor Technologies, Inc. Amended and Restated Stock Incentive Plan (incorporated by reference to Exhibit 10.9 to Amendment No. 1 to the registrant’s Registration Statement on Form S-1, file number 333-166092, filed with the SEC on May 20, 2010) | |
| 10.10* | Form of FleetCor Technologies, Inc. 2010 Equity Compensation Plan (incorporated by reference to Exhibit 10.10 to Amendment No. 2 to the registrant’s Registration Statement on Form S-1, file number 333-166092, filed with the SEC with the SEC on June 8, 2010) | |
| 10.11* | FleetCor Technologies, Inc. Annual Executive Bonus Program (incorporated by reference to Exhibit 10.11 to Amendment No. 2 to the registrant’s Registration Statement on Form S-1, file number 333-166092, filed with the SEC with the SEC on June 8, 2010) | |
| 10.12* | Employee Noncompetition, Nondisclosure and Developments Agreement, dated September 25, 2000, between Fleetman, Inc. and Ronald F. Clarke (incorporated by reference to Exhibit 10.12 to Amendment No. 2 to the registrant’s Registration Statement on Form S-1, file number 333-166092, filed with the SEC with the SEC on June 8, 2010) | |
| 10.13* | Offer Letter, dated September 20, 2002, between FleetCor Technologies, Inc. and Eric R. Dey (incorporated by reference to Exhibit 10.13 to Amendment No. 2 to the registrant’s Registration Statement on Form S-1, file number 333-166092, filed with the SEC with the SEC on June 8, 2010) |
Table of Contents
| Exhibit no. | ||
| 10.14* | Offer Letter, dated March 17, 2009, between FleetCor Technologies, Inc. and Todd W. House (incorporated by reference to Exhibit 10.15 to Amendment No. 2 to the registrant’s Registration Statement on Form S-1, file number 333-166092, filed with the SEC with the SEC on June 8, 2010) | |
| 10.15* | Service Agreement, dated July 9, 2007, between FleetCor Technologies, Inc. and Andrew R. Blazye (incorporated by reference to Exhibit 10.16 to Amendment No. 2 to the registrant’s Registration Statement on Form S-1, file number 333-166092, filed with the SEC with the SEC on June 8, 2010) | |
| 10.16 | Sixth Amended and Restated Registration Rights Agreement, dated April 1, 2009, between FleetCor Technologies, Inc. and each of the stockholders party thereto (incorporated by reference to Exhibit 10.17 to Amendment No. 2 to the registrant’s Registration Statement on Form S-1, file number 333-166092, filed with the SEC with the SEC on June 8, 2010) | |
| 10.17 | First Amendment to Sixth Amended and Restated Registration Rights Agreement (incorporated by reference to Exhibit No. 10.17 to the registrant’s form 10-K, filed with the SEC with the SEC on March 25, 2011) | |
| 10.18 | Form of Indemnity Agreement to be entered into between FleetCor and representatives of its major stockholders (incorporated by reference to Exhibit 10.37 to Amendment No. 3 to the registrant’s Registration Statement on Form S-1, file number 333-166092, filed with the SEC with the SEC on June 29, 2010). | |
| 10.19 | Form of Director Restricted Stock Grant Agreement pursuant to the FleetCor Technologies, Inc. 2010 Equity Compensation Plan (incorporated by reference to Exhibit 10.38 to Amendment No. 6 to the registrant’s Registration Statement on Form S-1, file number 333-166092, filed with the SEC with the SEC on November 30, 2010). | |
| 10.20* | Form of Employee Performance Share Restricted Stock Agreement pursuant to the FleetCor Technologies, Inc. 2010 Equity Compensation Plan (incorporated by reference to Exhibit 10.39 to Amendment No. 6 to the registrant’s Registration Statement on Form S-1, file number 333-166092, filed with the SEC with the SEC on November 30, 2010). | |
| 10.21* | Form of Employee Incentive Stock Option Award Agreement pursuant to the FleetCor Technologies, Inc. 2010 Equity Compensation Plan (incorporated by reference to Exhibit 10.40 to Amendment No. 6 to the registrant’s Registration Statement on Form S-1, file number 333-166092, filed with the SEC on November 30, 2010). | |
| 10.22* | Form of Employee Non-Qualified Stock Option Award Agreement pursuant to the FleetCor Technologies, Inc. 2010 Equity Compensation Plan (incorporated by reference to Exhibit 10.41 to Amendment No. 6 to the registrant’s Registration Statement on Form S-1, file number 333-166092, filed with the SEC with the SEC on November 30, 2010). | |
| 10.23 | Form of Director Non-Qualified Stock Option Award Agreement pursuant to the FleetCor Technologies, Inc. 2010 Equity Compensation Plan (incorporated by reference to Exhibit 10.42 to Amendment No. 6 to the registrant’s Registration Statement on Form S-1, file number 333-166092, filed with the SEC with the SEC on November 30, 2010). | |
| 10.24* | Amended and Restated Employee Noncompetition, Nondisclosure and Developments Agreement, dated November 29, 2010, between FleetCor Technologies, Inc. and Ronald F. Clarke (incorporated by reference to Exhibit No. 10.43 to Amendment No. 6 to the registrant’s Registration Statement on Form S-1, file number 333-166092, filed with the SEC with the SEC on November 30, 2010). | |
| 10.25 | Arrangement Agreement Among FleetCor Luxembourg Holdings2 S.À.R.L, FleetCor Technologies, Inc. and CTF Technologies, Inc. (incorporated by reference to Exhibit 10.1 to the Registrant’s Quarterly Report on Form 10-Q, filed with the SEC on May 10, 2012) |
Table of Contents
| Exhibit no. | ||
| 10.26 | Repurchase Agreement, dated November 26, 2012, among the Company and the Repurchase Stockholders (incorporated by reference to Exhibit 10.1 to the Registrant’s Form 8-K, filed with the SEC on November 27, 2012) | |
| 10.27* | FleetCor Technologies, Inc. 2010 Equity Compensation Plan, as amended and restated effective May 30, 2013 (incorporated by reference from Appendix A to the Proxy Statement, filed with the SEC on April 24, 2013) | |
| 10.28 | FleetCor Technologies, Inc. Section 162(M) Performance—Based Program (incorporated by reference to Annex A to the Registrant’s Proxy Statement, filed with the SEC on April 18, 2014) | |
| 10.29 | Credit Agreement, dated October 24, 2014, among FleetCor Technologies Operating Company, LLC, as Borrower, FleetCor Technologies, Inc., as Parent, FleetCor Technologies Operating Company, LLC, as a borrower and guarantor, certain of the our foreign subsidiaries as borrowers, Bank of America, N.A., as administrative agent, swing line lender and L/C issuer and a syndicate of financial institutions (incorporated by reference to Exhibit No. 10.4 to the Registrant’s Form 10-Q filed with the SEC on November 10, 2014) | |
| 10.30 | Fifth Amended and Restated Receivables Purchase Agreement, dated November 14, 2014, by and among FleetCor Technologies, Inc. and PNC Bank, National Association, as administrator for a group of purchasers and purchaser agents, and certain other parties (incorporated by reference to Exhibit No. 10.1 to the Registrant’s Form 8-K, filed with the SEC on November 17, 2014) | |
| 10.31 | Amended and Restated Performance Guaranty dated as of November 14, 2014 made by FleetCor Technologies, Inc. and FleetCor Technologies Operating Company, LLC, in favor of PNC Bank, National Association, as administrator under the Fifth Amended and Restated Receivables Purchase Agreement (incorporated by reference to Exhibit 10.32 to the registrant’s Form 10-K, file number 001-35004, filed with the SEC on March 2, 2015) | |
| 10.32 | Amended and Restated Purchase and Sale Agreement dated as of November 14, 2014, among various entities listed on Schedule I thereto, as originators, and FleetCor Funding LLC (incorporated by reference to Exhibit 10.32 to the registrant’s Form 10-K, file number 001-35004, filed with the SEC on March 2, 2015) | |
| 10.33 | Receivables Purchase and Sale Agreement dated as of November 14, 2014, among Comdata TN, Inc. and Comdata Network, Inc. of California, as the sellers, and Comdata Inc., as the buyer (incorporated by reference to Exhibit 10.32 to the registrant’s Form 10-K, file number 001-35004, filed with the SEC on March 2, 2015) | |
| 10.34 | Investor Rights Agreement, dated November 14, 2014, between FleetCor Technologies, Inc. and Ceridian LLC (incorporated by reference to Exhibit 10.32 to the registrant’s Form 10-K, file number 001-35004, filed with the SEC on March 2, 2015) | |
| 10.35* | Offer Letter, dated June 19, 2013, between FleetCor Technologies, Inc. and John A. Reed (incorporated by reference to Exhibit No. 10.3 to the registrant’s Form 10-Q, filed with the SEC on March 12, 2014) | |
| 10.36* | Offer Letter, dated July 29, 2014, between FleetCor Technologies, Inc. and Armando Lins Netto (incorporated by reference to Exhibit 10.1 to the registrant’s Form 10-Q, file number 001-35004, filed with the SEC on May 11, 2015) | |
| 10.37 | First Amendment to the Fifth Amended and Restated Receivables Purchase Agreement, dated as of November 5, 2015, by and among FleetCor Funding LLC, FleetCor Technologies Operating Company, LLC and PNC Bank, National Association, as administrator for a group of purchasers and purchaser agents, and certain other parties **(**incorporated by reference to Exhibit 10.2 to the registrant’s Form 10-Q, file number 001-35004, filed with the SEC on November 9, 2015) |
Table of Contents
| Exhibit no. | ||
| 10.38* | Employee agreement on confidentiality, work product, non-competition, and non-solicitation | |
| 10.39 | Second Amendment to the Fifth Amended and Restated Receivables Purchase Agreement, dated as of December 1, 2015, by and among FleetCor Funding LLC, FleetCor Technologies Operating Company, LLC and PNC Bank, National Association, as administrator for a group of purchasers and purchaser agents, and certain other parties | |
| 11.1 | Statement of Computation of Share Earnings (See Note 14) | |
| 21.1 | List of subsidiaries of FleetCor Technologies, Inc. | |
| 23.1 | Consent of Independent Registered Public Accounting Firm | |
| 31.1 | Certification of Chief Executive Officer Pursuant to Section 302 | |
| 31.2 | Certification of Chief Financial Officer Pursuant to Section 302 | |
| 32.1 | Certification of Chief Executive Officer Pursuant to Section 906 | |
| 32.2 | Certification of Chief Financial Officer Pursuant to Section 906 | |
| 101 | The following financial information for the Registrant formatted in XBRL (Extensible Business Reporting Language): (i) the Consolidated Balance Sheets, (ii) the Unaudited Consolidated Statements of Income, (iii) the Unaudited Consolidated Statements of Comprehensive Income; (iv) the Unaudited Consolidated Statements of Cash Flows and (v) the Notes to Unaudited Consolidated Financial Statements |
| * | Identifies management contract or compensatory plan or arrangement. |
|---|
Table of Contents
Pursuant to the requirements of Section 13 or 15(d) of the Securities Exchange Act of 1934, the Registrant has duly caused this report to be signed on its behalf by the undersigned; thereunto duly authorized, in the City of Atlanta, State of Georgia, on February 29, 2016.
| FleetCor Technologies, Inc. | ||
| By: | /S/ RONALD F. CLARKE | |
| Ronald F. Clarke | ||
| President and Chief Executive Officer |
Pursuant to the requirements of the Securities Exchange Act of 1934, this report has been signed below by the following persons on behalf of Registrant and in the capacities indicated on February 29, 2016.
| Signature | Title | |
| /S/ RONALD F. CLARKE Ronald F. Clarke | President, Chief Executive Officer and Chairman of the Board of Directors (Principal Executive Officer) | |
| /S/ ERIC R. DEY Eric R. Dey | Chief Financial Officer (Principal Financial Officer and Principal Accounting Officer) | |
| /s/ MICHAEL BUCKMAN Michael Buckman | Director | |
| /s/ JOSEPH W. FARRELLY Joseph W. Farrelly | Director | |
| /s/ THOMAS M. HAGERTY Thomas M. Hagerty | Director | |
| /s/ MARK A. JOHNSON Mark A. Johnson | Director | |
| /s/ RICHARD MACCHIA Richard Macchia | Director | |
| /s/ JEFFREY S. SLOAN Jeffrey S. Sloan | Director | |
| /s/ STEVEN T. STULL Steven T. Stull | Director |