 filings.tools
Corpay (CPAY) 10-K risk factor changes: FY2015 vs FY2014
The 2015-12-31 10-K against the 2014-12-31 one, compared heading by heading and sentence by sentence. One of these filings carries no fiscal year tag, so its year is the calendar year of the period end.
Item 1A33 rewritten18 added6 removed501 unchanged
All filing items829 rewritten500 added459 removed2,552 unchanged
Summary
counted, not written
- Item 1A lists 42 risk factor headings: 1 new, 2 reworded and 39 unchanged since FY2014. 0 headings from FY2014 no longer appear.
- Sentence by sentence, 500 added, 459 removed, 829 rewritten and 2,552 unchanged across 13 items that differ.
New Item 1A headings (1)
- _We depend on our relationships with major truck stop merchants to serve our over-the-road fuel card customers. We must maintain these relationships to effectively serve our customers that use these merchants. If we are unable to maintain these relationships, our over-the-road card businesses may be adversely affected._
Removed Item 1A headings (0)
Every FY2014 risk factor heading is still here, word for word or reworded.
Reworded Item 1A headings (2)
- _Our [added: fuel card, workforce payment solutions and] gift card
[removed: business][added: businesses’] results are subject to seasonality, which could result in fluctuations in our quarterly net income._ - _Governmental regulations designed to protect or limit access to
[removed: consumer][added: personal] information could adversely affect our ability to effectively provide our services._
A heading is new when no FY2014 heading matches it after ignoring case and punctuation, and reworded when it shares at least 60 percent of its words with one that went away. All current risk factor headings.
Sentences by item
21 items, with every count and a link to each item that changed
| Item | Added | Removed | Rewritten | Unchanged | Page headers and footers changed |
|---|---|---|---|---|---|
| Item 1A. RISK FACTORS | 18 | 6 | 33 | 501 | 0 |
| Item 7. MANAGEMENT’S DISCUSSION AND ANALYSIS OF FINANCIAL CONDITION AND | 192 | 163 | 190 | 600 | 0 |
| Item 7A. QUANTITATIVE AND QUALITATIVE DISCLOSURES ABOUT MARKET RISK | 1 | 0 | 7 | 31 | 0 |
| Item 1. BUSINESS | 30 | 21 | 73 | 356 | 0 |
| Item 3. LEGAL PROCEEDINGS | 0 | 0 | 0 | 2 | 0 |
| Cover and table of contents | 6 | 4 | 31 | 61 | 0 |
| Item 1B. UNRESOLVED STAFF COMMENTS | 0 | 0 | 1 | 1 | 0 |
| Item 2. PROPERTIES | 3 | 0 | 16 | 24 | 0 |
| Item 4. MINE SAFETY DISCLOSURES | 0 | 0 | 0 | 3 | 0 |
| Item 5. MARKET FOR REGISTRANT’S COMMON EQUITY, RELATED STOCKHOLDER | 17 | 7 | 3 | 41 | 0 |
| Item 6. SELECTED FINANCIAL DATA | 5 | 3 | 27 | 19 | 0 |
| Item 8. FINANCIAL STATEMENTS AND SUPPLEMENTARY DATA | 218 | 247 | 389 | 768 | 0 |
| Item 9. CHANGES IN AND DISAGREEMENTS WITH ACCOUNTANTS ON ACCOUNTING AND FINANCIAL DISCLOSURE | 0 | 0 | 0 | 1 | 0 |
| Item 9A. CONTROLS AND PROCEDURES | 0 | 7 | 6 | 13 | 0 |
| Item 9B. OTHER INFORMATION | 0 | 0 | 0 | 2 | 0 |
| Item 10. DIRECTORS, EXECUTIVE OFFICERS AND CORPORATE GOVERNANCE | 0 | 0 | 1 | 7 | 0 |
| Item 11. EXECUTIVE COMPENSATION | 0 | 0 | 0 | 1 | 0 |
| Item 12. SECURITY OWNERSHIP OF CERTAIN BENEFICIAL OWNERS AND MANAGEMENT | 0 | 0 | 0 | 2 | 0 |
| Item 13. CERTAIN RELATIONSHIPS AND RELATED TRANSACTIONS, AND DIRECTOR | 0 | 0 | 0 | 2 | 0 |
| Item 14. PRINCIPAL ACCOUNTANT FEES AND SERVICES | 0 | 0 | 0 | 3 | 0 |
| Item 15. EXHIBITS AND FINANCIAL STATEMENT SCHEDULES | 10 | 1 | 52 | 114 | 0 |
Underlined words on a shaded ground are new in FY2015; struck-through words were in FY2014. Sentences that are wholly new or wholly gone are labelled rather than marked.
Item 1A. RISK FACTORS
33 rewritten, 18 added, 6 removed, 501 unchanged
Read the full itemFY2015 item · filed February 29, 2016FY2014 item · filed March 2, 2015
We believe that in [removed: 2014,] [added: 2015,] approximately [removed: 17%] [added: 15%] of our consolidated revenue was directly influenced by the absolute price of fuel.
| | • | | new oil production being developed in the [removed: US] [added: U.S.] and elsewhere; |
Approximately [removed: 17%] [added: 12%] of our consolidated revenue in [removed: 2014] [added: 2015] was derived from transactions where our revenue is tied to fuel-price spreads.
We derived approximately [removed: 66%] [added: 72%] of our consolidated revenues from these fees and charges during the year ended December 31, [removed: 2014.][added: 2015.]
If the users of our cards decrease their transaction activity, [added: or] the extent to which [removed: their] [added: they] use [removed: of] optional services or pay invoices late, our revenue could be materially adversely affected.
[removed: We may experience competitive] disadvantages with respect to any of these factors from time to time as potential customers prioritize or value [added: these competitive factors differently.]
We refer to the major oil companies and petroleum marketers with whom we have strategic relationships as our “partners.” During [removed: 2014,] [added: 2015,] our top three strategic relationships with major oil companies accounted for [removed: approximately 9%] [added: less than 7%] of our consolidated revenue.
Our agreements with our major oil company partners typically have initial terms of five to ten years with current remaining terms ranging from about [removed: one] [added: two] to [removed: six] [added: seven] years.
[removed: The use] of these processes may affect our ability to effectively compete for these relationships.
[added: Our competitors may be] willing to bid for these contracts on pricing or other terms that we consider uneconomical in order to win this business.
Our contractual agreements with fuel merchants and service garages typically have initial terms of one [removed: year] [added: or two years] and automatically renew on [removed: a year-to-year] [added: the same] basis unless either party gives notice of termination.
The loss of existing merchant relationships, [added: failure to continue such relationships on similarly attractive economic terms,] the contraction of our existing merchants’ operations or the inability to acquire new merchant relationships could adversely affect our ability to serve our customers and our business and operating results.
Any failure to deliver an effective and secure product or service or any performance issue that arises with a new product [added: or] service could result in significant processing or reporting errors or other losses.
At December 31, [removed: 2014,] [added: 2015,] we had approximately [removed: $3.59] [added: $2.94] billion of debt outstanding under our Credit Facility and Securitization Facility.
For the year ended December 31, [removed: 2014,] [added: 2015,] approximately [removed: 44%] [added: 28%] of our revenue was denominated in currencies other than the U.S. dollar [removed: (primarily Czech koruna, Russian ruble,] [added: (primarily,] British pound, Brazilian real, [added: Russian ruble,] Mexican peso, [added: Czech koruna, Euro,] Australian dollar and New Zealand dollar).
[added: If we raise additional funds through further issuances of equity or convertible] debt securities, our existing stockholders could suffer significant dilution, and any new equity securities we issue could have rights, preferences and privileges senior to those of holders of our common stock.
We have foreign operations in, or provide services for commercial card accounts in Australia, Austria, Azerbaijan, Belarus, Belgium, Botswana, Brazil, [added: Bulgaria,] Canada, [added: Croatia,] the Czech Republic, [added: Denmark,] Estonia, [added: Finland,] France, Georgia, Germany, [added: Greece,] Hong Kong, [added: Hungary,] Ireland, [added: Italy,] Kazakhstan, Latvia, Lithuania, Luxembourg, Macau, Malaysia, Mexico, Moldova, Mongolia, Morocco, the Netherlands, New Zealand, [added: Norway,] Papua New Guinea, Philippines, Poland, Portugal, [added: Romania,] Russia, [added: Singapore,] Slovakia, [removed: Spain,] [added: Slovenia,] South Africa, [added: Spain,] Sweden, [added: Switzerland, Turkey,] United Arab Emirates, the United Kingdom, and Ukraine.
Our ability to provide reliable service to customers, cardholders and other network participants depends upon uninterrupted operation of our data [removed: center] [added: centers] and call centers as well as third party labor and services providers.
We do not maintain [removed: any] insurance to protect us against [removed: any] such losses.
We cannot assure you that there are written agreements in place with every associated participant or that such written agreements will ensure the adequate safeguarding [removed: of such data or information or allow us to seek reimbursement from associated participants.]
[added: In order for us to] consistently increase and maintain profitability, businesses must continue to use and increase the use of electronic payment methods, including credit, debit and stored value cards.
During [removed: 2014,] [added: 2015,] a majority of our gift card revenue was derived from the design and purchase of gift card inventory, with the remaining portion of our [removed: 2014] [added: 2015] gift card revenue derived primarily from processing fees.
_Our [added: fuel card, workforce payment solutions and] gift card [removed: business] [added: businesses’] results are subject to seasonality, which could result in fluctuations in our quarterly net income._
Historically gift card business revenues have been strongest in the third and fourth [removed: quarters,] [added: quarters] and weakest in the first and second quarters, as the retail industry has its highest level of activity during and leading up to the Christmas holiday [removed: season.][added: season.]
Our balance sheet includes goodwill and intangible assets that represent approximately [removed: 72%] [added: 73%] of our total assets at December 31, [removed: 2014.][added: 2015.]
Some of our competitors may have the capability to dedicate substantially greater resources to enforcing their intellectual [added: property rights and to defending claims that may be brought against them than we do.]
Domestic and foreign government regulations impose compliance obligations on us and restrictions on our operating activities, which can be difficult to administer because of their scope, mandates and varied [removed: requirements.]
[removed: If we fail or are unable to comply with existing or changed government regulations in a timely and] appropriate manner, we may be subject to injunctions, other sanctions and the payment of fines and penalties, and our reputation may be harmed, which could have a material adverse effect on our business, financial condition and results of operations.
_Governmental regulations designed to protect or limit access to [removed: consumer] [added: personal] information could adversely affect our ability to effectively provide our services._
Our acquisition documents include warranties, covenants and conditions regarding various tax matters that occurred prior to the acquisition, supported by indemnification and, in some cases, holdbacks or escrows from [removed: the sellers.]
If our sponsor banks should stop providing sponsorship for us or determine to provide sponsorship on materially less favorable terms, we would need to find other financial institutions to provide those services or we would need to become a MasterCard [removed: member bank,] [added: member,] either of which could prove to be difficult and expensive.
[added: Even if we pursue] sponsorship by alternative member banks, similar requirements and dependencies would likely still exist_._ In addition, MasterCard routinely updates and modifies its requirements.
[removed: The FCPA prohibits improper payments or offers of payments to] foreign governments and their officials and political parties by U.S. and other business entities for the purpose of obtaining or retaining business.
| | • | | speculative trading; |
We may experience competitive
The use
_We depend on our relationships with major truck stop merchants to serve our over-the-road fuel card customers.
We must maintain these relationships to effectively serve our customers that use these merchants.
If we are unable to maintain these relationships, our over-the-road card businesses may be adversely affected._
We have long standing relationships with major truck stop merchants to accept our over-the-road fuel cards.
Over-the-road customers purchase a significant proportion of their fuel at major truck stop merchants.
The loss of existing major truck stop merchant relationships or failure to continue such relationships on similar terms could adversely affect our ability to serve our over-the-road fuel card customers and our business and operating results.
We bear similar risk relating to fraudulent acts of employees or contractors, for which we maintain insurance.
However, the conditions or limits of coverage may be insufficient to protect us against such losses.
of such data or information or allow us to seek reimbursement from associated participants.
Our fuel card and workforce payment solutions businesses have experienced in the past, and expect to continue to experience, seasonal fluctuations in revenues and profit, which are impacted during the first and fourth quarter each year by the weather, holidays in the U.S., Christmas being celebrated in Russia in January, and lower business levels in Brazil due to summer break and the Carnival celebration.
requirements.
If we fail or are unable to comply with existing or changed government regulations in a timely and
the sellers.
The FCPA prohibits improper payments or offers of payments to
| --- | --- | --- | --- |
these competitive factors differently.
Our competitors may be
If we raise additional funds through further issuances of equity or convertible
In order for us to
property rights and to defending claims that may be brought against them than we do.
Even if we pursue
Item 7. MANAGEMENT’S DISCUSSION AND ANALYSIS OF FINANCIAL CONDITION AND
190 rewritten, 192 added, 163 removed, 600 unchanged
Read the full itemFY2015 item · filed February 29, 2016FY2014 item · filed March 2, 2015
FleetCor is a leading independent global provider of fuel cards, commercial payment and data solutions, stored value solutions, and workforce payment products and services to businesses, retailers, commercial fleets, major oil companies, petroleum marketers and government entities in countries throughout North America, [removed: Latin] [added: South] America, Europe, Australia and New Zealand.
In [removed: 2014,] [added: 2015,] we processed approximately [removed: 652 million] [added: 1.9 billion] transactions on our proprietary networks and third-party networks (which includes approximately [removed: 270 million] [added: 1.3 billion] transactions related to our SVS product, acquired with Comdata).
Depending on our [removed: customer’s] [added: customers’] and [removed: partner’s] [added: partners’] needs, we provide these services in a variety of outsourced solutions ranging from a comprehensive “end-to-end” solution (encompassing issuing, processing and network services) to limited back office processing services.
In 2000, our current chief executive officer joined us and we changed our name to FleetCor Technologies, Inc. Since 2000, we have grown significantly [removed: through a combination of organic initiatives, product and service innovation and over 65 acquisitions of businesses and commercial account portfolios.]
As of December 31, [removed: 2014,] [added: 2015,] we employed approximately [removed: 4,780] [added: 5,330] employees, approximately [removed: 2,180] [added: 2,660] of whom are located in the United States.
In this report, we refer to this net revenue as “revenue.” For the years ended December 31, [removed: 2014, 2013] [added: 2015, 2014] and [removed: 2012,] [added: 2013,] our North America and International segments generated the following revenue:
| | | [removed: 2014] [added: 2015] | | | | | | | | [removed: 2013] [added: 2014] | | | | | | | | [removed: 2012] [added: 2013] | | | | | | |
| North America | | $ | [removed: 668.3] [added: 1,232.0] | | | | [removed: 55.7] [added: 72.3] | % | | $ | [removed: 460.7] [added: 668.3] | | | | [removed: 51.5] [added: 55.7] | % | | $ | [removed: 400.1] [added: 460.7] | | | | [removed: 56.6] [added: 51.5] | % |
| International | | | [removed: 531.1] [added: 470.9] | | | | [removed: 44.3] [added: 27.7] | % | | | [removed: 434.5] [added: 531.1] | | | | [removed: 48.5] [added: 44.3] | % | | | [removed: 307.4] [added: 434.5] | | | | [removed: 43.4] [added: 48.5] | % |
| | | $ | [removed: 1,199.4] [added: 1,702.9] | | | | 100.0 | % | | $ | [removed: 895.2] [added: 1,199.4] | | | | 100.0 | % | | $ | [removed: 707.5] [added: 895.2] | | | | 100.0 | % |
_Transactions._ In both of our segments, we derive revenue from [removed: transactions and the related revenue per transaction.][added: transactions.]
Through our merchant and network relationships we primarily offer fuel cards, corporate cards, virtual cards, purchasing cards, T&E cards, gift cards, [removed: store] [added: stored] value payroll cards, vehicle maintenance, food, fuel, toll and transportation cards and vouchers or lodging services to our customers.
[removed: ][added: 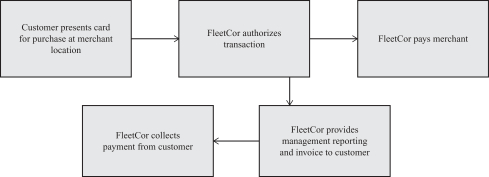]
Set forth below are our sources of revenue for the years ended December 31, [removed: 2014, 2013] [added: 2015, 2014] and [removed: 2012,] [added: 2013,] expressed as a percentage of consolidated revenues:
[removed: | | |] Year [removed: Ended] [added: ended] December [removed: 31, | | | | | | | | | | |][added: 31, 2015 compared to the year ended December 31, 2014]
| | | [removed: 2014] [added: 2015] | | | | [removed: 2013] [added: 2014] | | | | [removed: 2012] [added: 2013] | | |
| Revenue from customers and partners | | | [removed: 54.9] [added: 64.8] | % | | | [removed: 53.6] [added: 54.9] | % | | | [removed: 46.9] [added: 53.6] | % |
| Revenue from merchants and networks | | | [removed: 45.1] [added: 35.2] | % | | | [removed: 46.4] [added: 45.1] | % | | | [removed: 53.1] [added: 46.4] | % |
| Revenue [added: directly] tied to fuel-price spreads1 | | | [removed: 16.5] [added: 12.4] | % | | | [removed: 15.7] [added: 16.5] | % | | | [removed: 17.5] [added: 15.7] | % |
| Revenue [added: directly] influenced by [added: the] absolute price of fuel1 | | | [removed: 17.0] [added: 15.1] | % | | | [removed: 19.6] [added: 17.0] | % | | | [removed: 20.7] [added: 19.6] | % |
| Revenue from program fees, [removed: transaction fees,] late [removed: fees] [added: fees, interest] and other | | | [removed: 66.5] [added: 72.5] | % | | | [removed: 64.7] [added: 66.5] | % | | | [removed: 61.8] [added: 64.7] | % |
| 1 | Although we cannot precisely calculate the [added: absolute] impact of fuel price spreads and the absolute price of fuel on our consolidated revenues, we believe these percentages approximate their relative impacts. |
_Revenue per transaction._ Set forth below is revenue per transaction information for the years ended December 31, [removed: 2014, 2013] [added: 2015, 2014] and [removed: 2012:][added: 2013:]
| | | [removed: 2014] [added: 2015] | | | | [removed: 2013] [added: 2014] | | | | [removed: 2012] [added: 2013] | | |
| North America | | | 459.9 | | | | 165.0 | | [removed: | | 156.9 | |]
| International | | | [removed: 192.5] [added: 183.9] | | | | [removed: 162.5] [added: 192.5] | | | | [removed: 146.9] [added: 162.5] | |
| Total transactions | | | 652.4 | | | | 327.5 | | [removed: | | 303.8 | |]
| North America | | $ | [removed: 1.45] [added: 0.74] | | | $ | [removed: 2.79] [added: 1.45] | | | $ | [removed: 2.55] [added: 2.79] | |
| International | | | [removed: 2.76] [added: 2.56] | | | | [removed: 2.67] [added: 2.76] | | | | [removed: 2.09] [added: 2.67] | |
| Consolidated revenue per transaction | | | [removed: 1.84] [added: 0.92] | | | | [removed: 2.73] [added: 1.84] | | | | [removed: 2.33] [added: 2.73] | |
| Consolidated adjusted revenue per transaction3 | | | [removed: 1.69] [added: 0.86] | | | | [removed: 2.53] [added: 1.69] | | | | [removed: 2.14] [added: 2.53] | |
| [removed: 2] [added: 1] | Transactions in 2014 [removed: includes] [added: include] appropriately 270 million transactions related to our SVS product, which is part of the Comdata business acquired in November 2014. |
| 3 | Adjusted revenues is a non-GAAP financial measure defined as revenues, net less merchant commissions. We believe this measure is a more effective way to evaluate our revenue performance. We use adjusted revenues as a basis to evaluate our revenues, net of the commissions that are paid to merchants to participate in our card programs. Adjusted revenues is a supplemental non-GAAP financial [removed: measures] [added: measure] of operating performance. See the heading entitled “Management’s Use of Non-GAAP Financial Measures.” |
Revenue per transaction per customer changes as the level of services we provide to a customer increases or decreases, as macroeconomic factors [removed: changes] [added: change] and as adjustments are made to merchant and customer rates.
[removed: Furthermore, as previously discussed,] [added: North American] revenue per transaction [removed: in our North America segment has been significantly impacted by our acquisition] [added: includes] the [added: impact of the] SVS product, which is part of our Comdata business acquired in November 2014.
[removed: For discussion of revenue per transactions, we are going to exclude the impact of the] [added: The] SVS product [removed: which] had approximately 270 million transactions [removed: in] [added: during] 2014 at [removed: a very low] [added: lower] revenue per transaction.
| | [removed: • | | _Merchant commissions_—In certain of our card programs, we incur merchant commissions expense when we reimburse merchants with whom we have direct, contractual relationships for specific] transactions where a customer purchases products or services from the merchant. In the card programs where it is paid, merchant commissions equal the difference between the price paid by us to the merchant and the merchant’s wholesale cost of the underlying products or services. |
| | • | | _Depreciation and amortization_—Our depreciation [removed: and amortization] expenses include depreciation of property and equipment, consisting of computer hardware and software (including proprietary software development amortization expense), card-reading equipment, furniture, fixtures, vehicles and buildings and leasehold improvements related to office space. Our amortization expenses include [added: amortization of] intangible assets related to customer and vendor relationships, trade names and trademarks and non-compete agreements. We are amortizing intangible assets related to business acquisitions and certain private label contracts associated with the purchase of accounts receivable. |
| | • | | _Other [removed: income,] [added: expense (income),] net_—Other [removed: income,] [added: expense (income),] net includes foreign currency transaction gains or losses, proceeds/costs from the sale of assets and other miscellaneous operating costs and revenue. |
| | • | | _Equity method investment [removed: loss_—Equity] [added: loss_—Our equity] method investment loss relates to our minority interest in [removed: Masternaut,] [added: Masternaut Group Holdings Limited (“Masternaut”),] a provider of telematics solutions to commercial fleets in Europe, which we account for [removed: as an] [added: using the] equity [removed: method investment.] [added: method.] |
through a combination of organic initiatives, product and service innovation and over 65 acquisitions of businesses and commercial account portfolios.
| | | | 100.0 | % | | | 100.0 | % | | | 100.0 | % |
| | | | 100.0 | % | | | 100.0 | % | | | 100.0 | % |
From 2014 to 2015, total transactions increased from 652.4 million to 1.9 billion, an increase of 1.2 billion or 183.8%.
We experienced an increase in transactions in our North America segment primarily due to our acquisition of Comdata in November 2014, of which 1.3 billion and 270 million transactions are attributable to SVS for 2015 and 2014, respectively, as well as from organic growth in our U.S. businesses.
Transaction volumes in our international segment decreased slightly by 4.5% primarily due to market softness in some of our international businesses.
| | • | | _Merchant commissions_—In certain of our card programs, we incur merchant commissions expense when we reimburse merchants with whom we have direct, contractual relationships for specific |
During 2015, we completed acquisitions of Shell portfolios related to our fuel card business in Europe, as well as a small acquisition internationally, with an aggregate purchase price of $45.7 million, made additional investments of $8.4 million related to our equity method investment at Masternaut and deferred payments of $3.4 million related to acquisitions occurring in prior years.
included the impact of an unfavorable tax judgment against VB during the fourth quarter of 2014.
In February 2015, the Company paid $39.8 million of contingent consideration.
| North America | | $ | 1,232.0 | | | | 72.3 | % | | $ | 668.3 | | | | 55.7 | % | | $ | 563.6 | | | | 84.3 | % |
| International | | | 470.9 | | | | 27.7 | % | | | 531.1 | | | | 44.3 | % | | | (60.2 | ) | | | (11.3 | %) |
| Total revenues, net | | | 1,702.9 | | | | 100.0 | % | | | 1,199.4 | | | | 100.0 | % | | | 503.5 | | | | 42.0 | % |
| Merchant commissions | | | 108.3 | | | | 6.4 | % | | | 96.3 | | | | 8.0 | % | | | 12.0 | | | | 12.5 | % |
| Processing | | | 331.1 | | | | 19.4 | % | | | 173.3 | | | | 14.4 | % | | | 157.7 | | | | 91.0 | % |
| Selling | | | 109.1 | | | | 6.4 | % | | | 75.5 | | | | 6.3 | % | | | 33.5 | | | | 44.4 | % |
| General and administrative | | | 297.7 | | | | 17.5 | % | | | 206.0 | | | | 17.2 | % | | | 91.8 | | | | 44.5 | % |
| Depreciation and amortization | | | 193.5 | | | | 11.4 | % | | | 112.4 | | | | 9.4 | % | | | 81.1 | | | | 72.2 | % |
| Other operating, net | | | (4.2 | ) | | | (0.2 | %) | | | (29.5 | ) | | | 2.5 | % | | | (25.3 | ) | | | (85.6 | %) |
| Operating income | | | 667.5 | | | | 39.2 | % | | | 565.4 | | | | 47.1 | % | | | 102.1 | | | | 18.1 | % |
| Equity method investment loss | | | 57.7 | | | | 3.4 | % | | | 8.6 | | | | 0.7 | % | | | 49.1 | | | | 571.7 | % |
| Interest expense, net | | | 71.3 | | | | 4.2 | % | | | 28.9 | | | | 2.4 | % | | | 42.5 | | | | 147.2 | % |
| Loss on early extinguishment of debt | | | — | | | | — | | | | 15.8 | | | | 1.3 | % | | | (15.8 | ) | | | (100.0 | %) |
| Provision for income taxes | | | 173.6 | | | | 10.2 | % | | | 144.2 | | | | 12.0 | % | | | 29.3 | | | | 20.3 | % |
| Net income | | $ | 362.4 | | | | 21.3 | % | | $ | 368.7 | | | | 30.7 | % | | $ | (6.3 | ) | | | (1.7 | %) |
| North America | | $ | 442.0 | | | | | | | $ | 287.3 | | | | | | | $ | 154.7 | | | | 53.9 | % |
| International | | | 225.5 | | | | | | | | 278.1 | | | | | | | | (52.7 | ) | | | (18.9 | %) |
| Operating income | | $ | 667.5 | | | | | | | $ | 565.4 | | | | | | | $ | 102.1 | | | | 18.1 | % |
| North America | | | 35.9 | % | | | | | | | 43.0 | % | | | | | | | (7.1 | )% | | | | |
| International | | | 47.9 | % | | | | | | | 52.4 | % | | | | | | | (4.5 | )% | | | | |
| Total | | | 39.2 | % | | | | | | | 47.1 | % | | | | | | | (7.9 | %) | | | | |
| | | 2015 | | | | 2014 | | |
| North America | | | 1,667.5 | | | | 459.9 | |
| International | | | 183.9 | | | | 192.5 | |
| Total transactions | | | 1,851.4 | | | | 652.4 | |
| North America | | $ | 0.74 | | | $ | 1.45 | |
| International | | | 2.56 | | | | 2.76 | |
| 1 | Transactions in 2015 and 2014 include approximately 1.3 billion and 270 million transactions, respectively, related to our SVS product, which is part of the Comdata business acquired in November 2014. Revenue per transaction for the SVS product is lower than that generated by our other products. |
Our consolidated revenue increased from $1,199.4 million in 2014 to $1,702.9 million in 2015, an increase of $503.5 million, or 42.0%.
We use adjusted revenues as a basis to evaluate our revenues, net of the commissions that are paid to merchants that participate in certain of our card programs.
RESULTS OF OPERATIONS
In this report, when we refer to consolidated revenue, the provision for bad debts and interest expense on a “managed basis,” such amounts have been adjusted for the impact of the new accounting guidance related to our securitization facility as further discussed below.
The term “managed basis” is used throughout “Management’s Discussion and Analysis of Financial Condition and Results of Operations”.
_Segments_
The results from our Shell Germany business acquired during the third quarter of 2014 are reported in our International segment.
The results from our Pacific Pride business acquired in the second quarter of 2014 and Comdata business acquired in the fourth quarter of 2014 are included within our North America segment.
| --- | --- | --- | --- | --- | --- | --- | --- | --- | --- | --- | --- | --- |
From 2012 to 2013, total transactions increased from 303.8 million to 327.5 million, an increase of 23.7 million or 7.8%.
We experienced an increase in transactions in our North America and International segments primarily due to organic growth in certain payment programs and the impact of the acquisitions completed in 2013 and the full year impact of acquisitions completed in 2012.
Revenue per transaction in our International segment has historically run higher than in our North America segment.
Included in revenue per transactions is the impact of recent acquisitions.
Revenue per transaction on a consolidated basis has been significantly impacted by acquisitions in our International segment from 2012 through 2014.
In 2012, we acquired a Russian fuel card business and CTF Technologies, Inc. (CTF), both in our International segment, which have higher revenue per transaction products in comparison to our other businesses.
In 2013, we acquired several businesses in our international segment; FleetCard in Australia, CardLink in New Zealand, VB Servicos (VB) and DB Trans S.A. (DB) in Brazil and Epyx in the U.K. Certain of these international acquisitions have higher revenue per transaction products in comparison to our other international businesses, which when combined with the impact of 2012 acquisitions, contributes to the increase in transaction volumes and revenue per transaction in our International segment in 2013 over 2012.
We also acquired NexTraq in the U.S in 2013 which has a higher revenue per transaction product in comparison to our other North America businesses.
This contributed to higher transaction volumes and revenue per transaction in our North America segment in 2013 over 2012, in addition to organic growth.
In 2014, we acquired Comdata in the U.S., which has a higher revenue per transaction product in comparison to our other North American business, when excluding the impact of SVS, a part of the Comdata business.
The SVS product carries a very high volume of transactions at a very low revenue per transaction.
| --- | --- | --- | --- |
| --- | --- | --- | --- |
| --- | --- | --- | --- |
| Adjusted EBITDA | | | 677,810 | | | | 493,369 | | | | 376,964 | |
We use adjusted EBITDA, calculated as earnings before interest, taxes, depreciation and amortization, other expense, net, equity method investment loss and loss on extinguishment of debt to eliminate the impact of certain non-core items during the period.
| | into a $12.0 million New Zealand dollar ($9.8 million) revolving line of credit, which will be used to fund the working capital needs of the CardLink business. The purpose of this acquisition was to enter the Australia and New Zealand regions and follows our recent purchase of GE Capital’s Fleet Card business in Australia. |
During 2012, we completed several foreign acquisitions with an aggregate purchase price of $207.4 million, net of cash acquired, which included deferred payments of $11.3 million and contingent consideration payments of $4.9 million.
The Company estimated the fair value of remaining payments related to this contingent consideration of $0.5 million at December 31, 2014.
The results of our additional Russian fuel card company and CTF businesses are included within our International segment, from the date of acquisition.
| | • | | In June 2012, we acquired all of the outstanding stock of a leading Russian fuel card company, which is a Russian leader in fuel card systems, and serves major oil clients and hundreds of independent fuel card issuers. The consideration for the transaction was paid using existing cash and credit facilities. As a result of this acquisition, we further expanded our presence in the Russian fuel card marketplace. |
| | • | | In July 2012, we acquired all of the outstanding stock of CTF, a fuel payment processor in Brazil, for $156 million. The consideration for the transaction was paid with existing cash and credit facilities CTF provides fuel payment processing services for over-the-road fleets, ships, mining equipment, and railroads in Brazil. CTF’s payment platform links together fleet operators, banks, and oil companies. With this acquisition, we established our presence in the Brazilian fuel processing services marketplace. |
North American revenue per transaction includes the impact of the SVS product,
which is part of our Comdata business acquired in November 2014.
The SVS product had approximately 270 million transactions during 2014 at a very low revenue per transaction.
Our general and administrative expenses
2013, due primarily to unfavorable fluctuations in the Brazilian Real, British Pound and Russian Ruble.
| Term loan, including unused credit facility fee | | | 2.35 | % | | | 2.02 | % |
| Domestic Revolver A, including unused credit facility fee | | | 2.24 | % | | | 2.07 | % |
Discrete items and changes in the estimate of the annual tax rate are recorded in the period they occur.
Year ended December 31, 2013 compared to the year ended December 31, 2012
| North America | | $ | 460.7 | | | | 51.5 | % | | $ | 400.1 | | | | 56.6 | % | | $ | 60.6 | | | | 15.1 | % |
| International | | | 434.5 | | | | 48.5 | % | | | 307.4 | | | | 43.4 | % | | | 127.1 | | | | 41.3 | % |
An excerpt. Shown here: 40 of 190 rewritten, 40 of 192 added and 40 of 163 removed. The counts are complete. For every sentence, read Item 7. MANAGEMENT’S DISCUSSION AND ANALYSIS OF FINANCIAL CONDITION AND in the FY2015 filing and the FY2014 filing.
Item 7A. QUANTITATIVE AND QUALITATIVE DISCLOSURES ABOUT MARKET RISK
7 rewritten, 1 added, 0 removed, 31 unchanged
Read the full itemFY2015 item · filed February 29, 2016FY2014 item · filed March 2, 2015
Revenue from our International segment was [removed: 44.3%, 48.5%] [added: 27.7%, 44.3%] and [removed: 43.4%] [added: 48.5%] of total revenue for the years ended December 31, [added: 2015,] 2014, [removed: 2013,] and [removed: 2012,] [added: 2013,] respectively.
Exchange rates and currency positions as of December 31, [removed: 2014] [added: 2015] were used to perform the sensitivity analysis.
Such analysis indicated that a hypothetical 10% change in foreign currency exchange rates would have increased or decreased consolidated operating income during the year ended December 31, [removed: 2014] [added: 2015] by approximately [removed: $27.8] [added: $22.5] million had the U.S. dollar exchange rate increased or decreased relative to the currencies to which we had exposure.
When exchange rates and currency positions as of December 31, [removed: 2013] [added: 2014] and [removed: 2012] [added: 2013] were used to perform this sensitivity analysis, the analysis indicated that a hypothetical 10% change in currency exchange rates would have increased or decreased consolidated operating income for the years ended December 31, [removed: 2013] [added: 2014] and [removed: 2012] [added: 2013] by approximately [removed: $20.0] [added: $27.8] million and [removed: $12.8] [added: $20.0] million, respectively.
Based on the amounts and mix of our fixed and floating rate debt (exclusive of our Securitization Facility) at December 31, [removed: 2014, 2013] [added: 2015, 2014] and [removed: 2012,] [added: 2013,] if market interest rates had increased or decreased an average of 100 basis points, our interest expense would have changed by [removed: $2.9] [added: $23.2] million, [removed: $1.6] [added: $29.2] million and [removed: $1.3] [added: $11.4] million, respectively.
We determined these amounts by considering the impact of the hypothetical interest rates on our borrowing [removed: costs and interest rate swap agreement.][added: costs.]
[removed: A decline in retail fuel prices] could cause a change in our revenue from several sources, including fees paid to us based on a percentage of each customer’s total purchase.
A decline in retail fuel prices
Item 1. BUSINESS
73 rewritten, 30 added, 21 removed, 356 unchanged
Read the full itemFY2015 item · filed February 29, 2016FY2014 item · filed March 2, 2015
FleetCor is a leading independent global provider of fuel cards, commercial payment and data solutions, [added: lodging and transportation management services,] stored value solutions, and workforce payment products and services to businesses, retailers, commercial fleets, major oil companies, petroleum marketers and government entities in countries throughout North America, Latin America, Europe, Australia and New Zealand.
In [removed: 2014,] [added: 2015,] we processed approximately [removed: 652 million] [added: 1.9 billion] transactions on our proprietary networks and third-party networks (which includes approximately [removed: 270 million] [added: 1.3 billion] transactions related to our SVS product, acquired with [removed: Comdata).][added: Comdata, Inc. (“Comdata”)).]
We also manage commercial fleet card programs for major oil companies, such as British Petroleum (BP) (including its subsidiary Arco), Chevron and Shell, and over [removed: 1,100] [added: 900] petroleum marketers.
We sell a range of customized fleet and lodging payment programs directly and [added: indirectly to our customers through partners, such as major oil companies, leasing companies and petroleum]
[removed: In other cases we] [added: We also] utilize the networks of our major oil and petroleum marketer [removed: partners.][added: partners in certain markets.]
| | • | | _Fuelman network_—our primary proprietary fleet card network in the United States. We have negotiated card acceptance and settlement terms with over 11,000 individual merchants, providing the Fuelman network with approximately [removed: 50,000] [added: 56,000] fueling sites and over [removed: 26,000] [added: 29,000] maintenance sites across the country. |
| | • | | _Comdata Network_—our network of truck stops and fuel merchants for the over-the-road trucking industry. We have negotiated card acceptance and settlement terms at over [removed: 6,500] [added: 6,900] truck stops and fuel merchants across the United States and Canada. |
| | • | | _Corporate Lodging Consultants network (CLC)_—our proprietary lodging network in the United States and Canada. The CLC Lodging network includes approximately [removed: 17,000 hotels across the United States and Canada.] [added: 17,400 hotels.] |
| | [removed: • | | _Commercial Fueling Network (CFN)_—our “members only” unattended fueling location network in the United States and Canada. The CFN network is composed of over 2,500 fueling sites, each of which is owned by a CFN] member, and the majority of which are unattended cardlock facilities. The CFN network provides fuel card authorization, transaction processing and cardlock site branding for over [removed: 240] [added: 230] independent petroleum marketers. Through a CFN affiliation, petroleum marketers can offer commercial fleets an integrated [removed: fueling] [added: fuel card] solution with access to over [removed: 50,000] [added: 56,000] locations via [removed: CFN’s FleetWide] [added: FleetCor’s Fuelman] network. |
| | • | | _Pacific Pride Fueling Network (PacPride)_—our [added: branded] fueling network in the United States [removed: and Canada] composed of over [removed: 2,000] [added: 1,000] fueling sites, each of which is franchisee [removed: owned, of which approximately 940 are unattended cardlock facilities.] [added: owned.] Our franchisees join PacPride to provide network access to their fleet customers and benefit from fleet card volume generated by our other franchisees’ fleet customers fueling at their locations. [removed: With] [added: In 2015, PacPride launched] the [removed: launch of our] PrideAdvantage [removed: card,] fleet [removed: customer cards will be honored at both PacPride and Fuelman locations across the U.S., expanding the network] [added: card providing fleet customers] of [added: franchisees access to over 56,000] locations [removed: for fueling.] [added: via FleetCor’s Fuelman network.] |
| | • | | _Allstar network_—our proprietary fleet card network in the United Kingdom. We have negotiated card acceptance and settlement terms with approximately [removed: 3,500] [added: 2,600] individual merchants, providing this network with over 7,600 fueling sites. |
| | • | | _Keyfuels network_—our proprietary fleet card network in the United Kingdom. We have negotiated card acceptance and settlement terms with more than 480 individual merchants, providing the Keyfuels network with over [removed: 2,300] [added: 2,600] fueling sites. |
| | • | | _CCS network_—our primary proprietary fleet card network in the Czech Republic and Slovakia. We have negotiated card acceptance and settlement terms with several major oil companies on a brand-wide basis, including Agip, Benzina, OMV and Shell, and with approximately [removed: 1,400] [added: 1,300] other merchants, providing the CCS network with over [removed: 2,300] [added: 2,400] fueling sites and over [removed: 1,200] [added: 1,100] other sites accepting our cards. |
| | • | | _Petrol Plus Region (PPR) network_—our primary proprietary fleet card network in Russia, Poland, Ukraine, [removed: Belarus] [added: Belarus, Kazakhstan] and [removed: Kazakhstan.] [added: Moldova.] We have negotiated card acceptance and settlement terms with [removed: about 725] [added: over 650] individual merchants, providing the PPR network with approximately [removed: 11,600] [added: 11,200] fueling sites across the region. |
| | • | | _Efectivale network_—our proprietary fuel and food card and voucher networks in Mexico. We have negotiated acceptance and settlement terms with over [removed: 22,000] [added: 44,000] individual merchants, providing the Mexican network with over [removed: 6,900] [added: 4,000] fueling [removed: sites and 69,000] [added: sites, 36,000] food [removed: sites.] [added: locations and 4,000 restaurants.] |
| | • | | _CTF network_—our proprietary fuel controls network in Brazil. We have partnerships with BR Distribuidora (Petrobas) and Ipiranga Distribuidora, retail oil distributors, as well as other fuel providers, in Brazil. CTF’s processing system works at over [removed: 1,600] [added: 1,700] highway fueling sites through these partnerships and is integrated with two main banks, Banco Bradesco and Banco Itau. |
| | • | | _RODOCRED network_—our proprietary toll network in Brazil. The RODOCRED network processes toll transactions for more than [removed: 50,000] [added: 65,000] customers [removed: and approximately 95% of] [added: on all] toll roads across Brazil. |
| | • | | _VB Distribution system_—our proprietary distribution network in Brazil for transportation cards, meal/grocery cards, and fuel cards. The VB distribution network distributes cards for more than [removed: 28,000] [added: 26,000] clients and negotiates with more than [removed: 900] [added: 1,300] public transportation agencies across Brazil. |
| | • | | _MasterCard network_—In the United States and Canada, we issue corporate cards that utilize the MasterCard payment network, which includes over [removed: 179,000] [added: 176,000] fuel sites and [removed: 500,000] [added: 522,000] maintenance locations. Our co-branded MasterCard corporate cards, virtual card corporate payment solution, purchasing cards, T&E cards and multi-use cards have additional purchasing capabilities and can be accepted at over [removed: 8.6] [added: 10.3] million locations throughout the United States and Canada. We market these cards to customers who require card acceptance beyond our proprietary merchant locations. The MasterCard network delivers the ability to capture value-added transaction data at the point-of-sale and allows us to provide customers with fleet controls and reporting comparable to those of our proprietary fleet card networks. |
| | • | | _UTA network_—UNION TANK Eckstein GmbH & Co. KG (UTA) operates a network of over [removed: 49,000] [added: 52,000] points of acceptance in 40 European countries, including more than [removed: 34,000] [added: 37,000] fueling sites. The UTA network is generally utilized by European transport companies that travel between multiple countries. |
| | • | | _DKV network_—DKV operates a network of over [removed: 54,000] [added: 58,500] fleet card-accepting locations across more than 40 countries throughout Europe. The DKV network is generally utilized by European transport companies that travel between multiple countries. |
| | • | | _Carnet networks_—In Mexico, we issue fuel cards and food cards that utilize the Carnet payment network, which includes over [removed: 10,000] [added: 11,000] fueling [removed: sites and] [added: sites,] over [removed: 76,000] [added: 31,000] food locations [added: and over 500,000 restaurants] across the country. |
In addition, we provide network services to those major oil company partners who choose to offer a co-branded MasterCard as [removed: part of their card program.]
Our agreements with our major oil company partners typically have initial terms of [added: five to ten years with current remaining terms ranging from two to seven years.]
No single partner represented more than 10% of our consolidated revenue in [removed: 2014, 2013] [added: 2015, 2014] or [removed: 2012.][added: 2013.]
We also leverage the sales and marketing capabilities of our strategic relationships with over [removed: 1,100] [added: 900] oil companies, petroleum marketers, card marketers, leasing companies, VARs and other referral partners.
We employ sales and marketing employees worldwide that are focused on acquiring new customers for all of our direct business card [removed: programs] [added: programs,] select card programs for oil companies, petroleum marketers and other services to fleets.
| | • | | _Field sales_—Our direct sales team includes field sales representatives, who conduct face-to-face sales presentations and product demonstrations with prospects, assist with post-sale program implementation and training and provide in-person account management. Field sales representatives also attend and manage our marketing at tradeshows. Our field sales force is dedicated to fleet products and other services and generally targets fleets with more than 15 vehicles or cards. Our field sales force for corporate payment solutions targets large and mid-sized businesses primarily in the United States. We [added: also have small field sales teams targeting large and medium sized retailers as prospective customers of our stored value products in the Americas, Asia-Pacific and Europe.] |
| | • | | _Strategic relationships_—We have developed and currently manage relationships with over [removed: 1,100] [added: 900] oil companies, independent petroleum marketers, card marketers and leasing companies. Our major oil company and petroleum marketer relationships offer our payment processing and information management services to their fleet customers in order to establish and enhance customer loyalty. Our card programs for major oil companies and petroleum marketers carry their proprietary branding and [added: may or may not be accepted in one of our merchant networks. We benefit from the marketing efforts of major oil companies and petroleum marketers with whom we have strategic relationships to attract customers to their fueling locations. We manage the fleet card sales and marketing efforts for several major oil companies across the full spectrum of channels, including field sales, telesales, direct marketing, point-of-sale marketing and internet marketing. In these cases, we establish dedicated sales] |
| | [removed: may or may not be accepted in one of our merchant networks. We benefit from the marketing efforts of major oil companies] and [removed: petroleum marketers with whom we have strategic relationships to attract customers to their fueling locations. We manage the fleet card sales and] marketing [removed: efforts for several major oil companies across the full spectrum of channels, including field sales, telesales, direct marketing, point-of-sale marketing and internet marketing. In these cases, we establish dedicated sales and marketing] teams to focus exclusively on marketing the products of major oil companies and petroleum marketers. Our major oil company relationships include some of the world’s largest oil companies such as BP, Chevron and Shell. Through our leasing company relationships, we offer our payment processing, vehicle maintenance and information management services to their fleet customers as part of the leasing company’s broader package of fleet services. Our leasing company relationships all reside outside of North America, and we view these relationships as an important strategic growth area. |
| | • | | _Credit underwriting and collections._ We follow detailed application credit review, account management, and collections procedures for all customers of our payment solutions. We use multiple levers including billing frequency, payment terms, spending limits and security to manage risk in our portfolio. For the years ended December 31, [removed: 2014] [added: 2015] and [removed: 2013,] [added: 2014,] our bad debt expense was [removed: $24.4] [added: $24.6] million and [removed: $18.9] [added: $24.4] million, respectively. |
The most significant competitive factors in our business are the breadth of product and service features, network acceptance size, customer service and account management [removed: and price.]
We recognize the importance of state-of-the-art, secure, efficient and reliable technology in our business and have [added: made significant investments in our applications and infrastructure.]
In [removed: 2014,] [added: 2015,] we spent more than [removed: $59] [added: $100] million in capital and operating expenses to operate, protect and enhance our technology and [removed: that amount is expected to increase to more than $113 million in 2015 due] [added: expect] to [added: continue] the [removed: continued] build out of our proprietary processing platform in Europe and Asia, as well as the integration of our recently acquired businesses.
We operate [removed: four] [added: six] primary data centers, located in Atlanta, Georgia, [added: Brentwood, Tennessee,] Prague, Czech Republic, Las Vegas, [removed: Nevada] [added: Nevada, Louisville, Kentucky] and Moscow, Russia.
Our systems [removed: meet the highest] [added: align with industry] standards for security with multiple industry certifications.
We use [removed: sophisticated] security protocols for communication among applications, and our employees access critical components on a need-only basis.
As of December 31, [removed: 2014,] [added: 2015,] we have not experienced any [removed: breaches in network, application or] data [removed: security.][added: security breaches.]
We maintain [removed: up-to-date] disaster recovery and business continuity plans.
In [removed: 2014,] [added: 2015,] we experienced 99.99% up-time for authorizations.
marketers.
| | • | | _Commercial Fueling Network (CFN)_—our “members only” fueling network in the United States and Canada. The CFN network is composed of over 2,500 fueling sites, each of which is owned by a CFN |
part of their card program.
and price.
Since 2002, we have completed over 65 acquisitions of companies and commercial account portfolios.
Acquisitions have been an important part of our growth strategy, and it is our intention to continue to seek opportunities to increase our customer base and diversify our service offering through further strategic acquisitions.
These laws and regulations restrict the collection, processing, storage, use and disclosure of personal
| Kurt Adams | | | 46 | | | President—Comdata Corporate Payments |
| Alexey Gavrilenya | | | 39 | | | President—Continental Europe |
| Todd W. House | | | 44 | | | President—North America Direct Issuing, U.S. Telematics and Efectivale |
| David D. Maxsimic | | | 56 | | | President—North America Partners |
| Gregory Secord | | | 53 | | | President—Comdata North America Trucking |
_Kurt Adams_ joined us in September 2015 as our President—Comdata Corporate Payments.
Prior to joining us, Mr. Adams was most recently President, Corporate Payments Solutions for U.S. Bancorp.
Prior to that, Mr. Adams led strategy and planning for NOVA Information Systems (now Elavon – a U.S. Bancorp subsidiary) in Europe.
Prior to his career in payments, Mr. Adams enjoyed a successful investment banking career with Piper Jaffray.
From 1994 to 2005, Mr. Coughlin was with The Parthenon
From 1990 to 1992, Mr. Coughlin was an investment banker with Credit Suisse First Boston.
_Charles Freund_ was named our Executive Vice President—Global Sales in January 2016 and has been with us since 2000.
_Alexey Gavrilenya_ was named President—Continental Europe in February 2016, adding to his responsibilities as President—Central/Eastern Europe announced in January 2016.
Mr. Gavrilenya has been President, Eastern Europe since May 2011, where he has been responsible for PPR and NKT.
From March 2009 to April 2011, Mr. Gavrilenya served as our Executive Vice President Strategy and Finance, Eastern Europe.
Prior to joining us, Mr. Gavrilenya was CFO of Matarex, Ltd.
Prior to this, Mr. House served as the president for several of our businesses throughout North America and Mexico, after joining us in April 2009 as our Chief Operating Officer.
Mr. House was at Capital One from 1993-2004 in a variety of leadership roles, most recently VP Credit Risk Management.
Maxsimic_ was named President—North America Partners in November 2015.
_Gregory Secord_ joined us in July 2015 as our President—Comdata North America Trucking.
Prior to joining us, Mr. Secord worked with ADP, where he was President—ADP Canada operations.
Prior to his 20 year career with ADP, Mr. Secord held sales and marketing management roles with Canon and Xerox.
##### [Table of Contents](#toc)
indirectly to our customers through partners, such as major oil companies, leasing companies and petroleum marketers.
five to ten years with current remaining terms ranging from two to seven years.
Our top three strategic relationships with major oil companies represented in the aggregate approximately 9%, 13%, and 16% of our consolidated revenue for the years ended December 31, 2014, 2013 and 2012, respectively.
| | also have small field sales teams targeting large and medium sized retailers as prospective customers of our stored value products in the Americas, Asia-Pacific and Europe. |
made significant investments in our applications and infrastructure.
States.
Among its most notable provisions is the creation of the Consumer Financial Protection
| Alisher Ashurov | | | 38 | | | President—Czech and Russia & International Corporate Development |
| Todd W. House | | | 43 | | | President—North America Fuel Cards |
| David D. Maxsimic | | | 55 | | | Group CEO—UK and Australasia |
| Michael Scarbrough | | | 50 | | | President—Telematics |
_Alisher Ashurov_ was named our President—Czech and Russia in December 2014 and continues to serve as Executive Vice President, International Corporate Development since July 2011.
Prior to this, Mr. Ashurov served as our Interim Managing Director—Central and Eastern Europe since April 2013.
From July 2008 to July 2011, Mr. Ashurov served as President of our Russian business, PPR.
From August 2005 to July 2008, Mr. Ashurov served as Director and then Vice President of Business Development.
Prior to joining FleetCor, Mr. Ashurov was Assistant Vice President at Legacy Securities LLC, a middle-market investment banking firm.
associated with this role until a replacement is identified.
Prior to this Mr. House was President—U.S. Direct Business since December 2010 and our Chief Operating Officer since April 2009.
On November 20, 2009, Axiant, LLC filed a petition for bankruptcy under the federal bankruptcy laws.
From August 1993 to April 2005, Mr. House was Vice President—Credit Risk Management with Capital One Financial Corp., a financial services company.
_Michael Scarbrough_ joined us as President—Telematics in connection with our acquisition of NexTraq in October 2013 and has since taken on responsibility for our full telematics product line in the U.S. Prior to joining us, Mr. Scarbrough held various positions with NexTraq, including Chief Operating Officer and Chief Financial Officer from 2005 to 2009 and President since 2009.
An excerpt. Shown here: 40 of 73 rewritten, all 30 added and all 21 removed. The counts are complete. For every sentence, read Item 1. BUSINESS in the FY2015 filing and the FY2014 filing.
Cover and table of contents
31 rewritten, 6 added, 4 removed, 61 unchanged
Read the full itemFY2015 item · filed February 29, 2016FY2014 item · filed March 2, 2015
For the Fiscal Year Ended December 31, [removed: 2014][added: 2015]
The aggregate market value of the registrant’s common stock held by non-affiliates of the registrant was approximately [removed: $10,086,100,000] [added: $13,498,625,921] as of June 30, [removed: 2014,] [added: 2015,] the last business day of the registrant’s most recently completed second fiscal quarter, based on the closing sale price as reported on the New York Stock Exchange.
As of February [removed: 6, 2015,] [added: 15, 2016,] there were [removed: 91,677,376] [added: 92,616,940] shares of common stock outstanding.
Portions of the registrant’s definitive Proxy Statement to be delivered to shareholders in connection with the Annual Meeting of Shareholders to be held on June [removed: 10, 2015] [added: 8, 2016] are incorporated by reference into Part III of this report.
For The Year Ended December 31, [removed: 2014][added: 2015]
| | | | | [removed: | |] Page | | |
| PART I | | | | | | | [removed: | |]
| [removed: | |] Item 1. | | [removed: [Business](#tx831300_1)] [added: [Business](#osm18451_1)] | | | 4 | |
| [removed: | |] Item X. | | [Executive Officers of the [removed: Registrant](#tx831300_2)] [added: Registrant](#osm18451_2)] | | | [removed: 19] [added: 20] | |
| [removed: | |] Item 1A. | | [Risk [removed: Factors](#tx831300_3)] [added: Factors](#osm18451_3)] | | | [removed: 21] [added: 22] | |
| [removed: | |] Item 1B. | | [Unresolved Staff [removed: Comments](#tx831300_4)] [added: Comments](#osm18451_4)] | | | [removed: 39] [added: 40] | |
| [removed: | |] Item 2. | | [removed: [Properties](#tx831300_5)] [added: [Properties](#osm18451_5)] | | | [removed: 40] [added: 41] | |
| [removed: | |] Item 3. | | [Legal [removed: Proceedings](#tx831300_6)] [added: Proceedings](#osm18451_6)] | | | [removed: 41] [added: 42] | |
| [removed: | |] Item 4. | | [Mine Safety [removed: Disclosures](#tx831300_7)] [added: Disclosures](#osm18451_7)] | | | [removed: 41] [added: 42] | |
| PART II | | | | | | | [removed: | |]
| [removed: | |] Item 5. | | [Market for Registrant’s Common Equity, Related Stockholder Matters, and Issuer Purchases of Equity [removed: Securities](#tx831300_8)] [added: Securities](#osm18451_8)] | | | [removed: 42] [added: 43] | |
| [removed: | |] Item 6. | | [Selected Financial [removed: Data](#tx831300_9)] [added: Data](#osm18451_9)] | | | 45 | |
| [removed: | |] Item 7. | | [Management’s Discussion and Analysis of Financial Condition and Results of [removed: Operations](#tx831300_10)] [added: Operations](#osm18451_10)] | | | [removed: 46] [added: 47] | |
| [removed: | |] Item 7A. | | [Quantitative and Qualitative Disclosures about Market [removed: Risk](#tx831300_11)] [added: Risk](#osm18451_11)] | | | [removed: 79] [added: 80] | |
| [removed: | |] Item 8. | | [Financial Statements and Supplementary [removed: Data](#tx831300_12)] [added: Data](#osm18451_12)] | | | [removed: 81] [added: 82] | |
| [removed: | |] Item 9. | | [Changes in and Disagreements with Accountants on Accounting and Financial [removed: Disclosure](#tx831300_13)] [added: Disclosure](#osm18451_13)] | | | [removed: 121] [added: 120] | |
| [removed: | |] Item 9A. | | [Controls and [removed: Procedures](#tx831300_14)] [added: Procedures](#osm18451_14)] | | | [removed: 121] [added: 120] | |
| [removed: | |] Item 9B. | | [Other [removed: Information](#tx831300_15)] [added: Information](#osm18451_15)] | | | [removed: 123] [added: 121] | |
| PART III | | | | | | | [removed: | |]
| [removed: | |] Item 10. | | [Directors, Executive Officers and Corporate [removed: Governance](#tx831300_16)] [added: Governance](#osm18451_16)] | | | [removed: 123] [added: 121] | |
| [removed: | |] Item 11. | | [Executive [removed: Compensation](#tx831300_17)] [added: Compensation](#osm18451_17)] | | | [removed: 123] [added: 121] | |
| [removed: | |] Item 12. | | [Security Ownership of Certain Beneficial Owners and Management and Related Stockholder [removed: Matters](#tx831300_18)] [added: Matters](#osm18451_18)] | | | [removed: 123] [added: 121] | |
| [removed: | |] Item 13. | | [Certain Relationships and Related Transactions, and Director [removed: Independence](#tx831300_19)] [added: Independence](#osm18451_19)] | | | [removed: 123] [added: 121] | |
| [removed: | |] Item 14. | | [Principal Accountant Fees and [removed: Services](#tx831300_20)] [added: Services](#osm18451_20)] | | | [removed: 123] [added: 121] | |
| PART IV | | | | | | | [removed: | |]
| [removed: | |] Item 15. | | [Exhibits and Financial Statement [removed: Schedules](#tx831300_21)] [added: Schedules](#osm18451_21)] | | | [removed: 124] [added: 122] | |
10-K 1 d18451d10k.htm 10-K
| --- | --- | --- | --- | --- | --- | --- |
| | | | | | | |
| | | | | | | |
| | | | | | | |
| | | [Signatures](#osm18451_22) | | | 127 | |
10-K 1 d831300d10k.htm 10-K
| | | | | | | | | |
| --- | --- | --- | --- | --- | --- | --- | --- | --- |
| | | | | Signatures | | | | |
Item 1B. UNRESOLVED STAFF COMMENTS
1 rewritten, 0 added, 0 removed, 1 unchanged
Read the full itemFY2015 item · filed February 29, 2016FY2014 item · filed March 2, 2015
We have [removed: received] no [added: unresolved] written comments regarding our periodic or current reports from the staff of the SEC.
Item 2. PROPERTIES
16 rewritten, 3 added, 0 removed, 24 unchanged
Read the full itemFY2015 item · filed February 29, 2016FY2014 item · filed March 2, 2015
The following table lists each of our material facilities and its location, use and approximate square footage, at December 31, [removed: 2014.][added: 2015.]
| Covington, Louisiana | | Corporate accounting, [removed: treasury,] [added: treasury and] merchant authorization | | | 13,600 | |
| Salem, Oregon | | Pacific Pride sales, [removed: operations,] [added: operations] and customer support | | | 10,000 | |
| Brentwood, Tennessee | | Comdata sales, [removed: operations,] [added: operations] and customer support | | | 228,000 | |
| Louisville, Kentucky | | SVS sales, [removed: operations,] [added: operations] and customer support | | | 66,000 | |
| Prague, Czech Republic | | CCS [removed: headquarters, operations, customer service] [added: headquarters] and [removed: sales] [added: Shell Europe (Germany, Austria, Poland and Hungary) operations] | | | [removed: 32,000] [added: 35,000] | |
| Mexico City, Mexico(1) | | FleetCor Mexico headquarters and operations | | | [removed: 6,900] [added: 22,500] | |
| Moscow, Russia | | PPR and NKT headquarters, sales, customer support, operations, credit and collections | | | [removed: 35,200] [added: 16,300] | |
| Bryansk, Russia | | [removed: Customer support, operations, accounting, sales] [added: Sales] and marketing | | | [removed: 6,800] [added: 19,900] | |
| Swindon, United Kingdom | | Allstar [added: and Shell Europe (Belgium, Netherlands and France)] operations, sales and customer support | | | [removed: 34,000] [added: 18,300] | |
| Birmingham, United Kingdom | | EPYX headquarters, sales, operations and customer support | | | [removed: 11,000] [added: 12,500] | |
| Sao Paulo, Brazil | | CTF and VB Servicios [added: headquarters,] sales, customer support and operations | | | 32,300 | |
| Osasco, Brazil | | CTF [added: and VB Servicios] operations | | | 7,100 | |
| Rio de Janeiro, Brazil | | DB Trans [added: and AExpresso] headquarters, sales, operations and customer support | | | [removed: 17,200] [added: 15,300] | |
| Auckland, New Zealand | | CardLink headquarters, sales, [removed: operations,] [added: operations] and customer support | | | 12,100 | |
We also lease a number of minor additional facilities, including local sales and operations offices less than [removed: 2,500] [added: 2,550] square feet, small storage facilities and a small number of service stations in the United [removed: Kingdom.][added: Kingdom; which are not included in the above list.]
| Sunnyvale, California | | Telenav sales, operations and customer support | | | 15,100 | |
| Nashville, Tennessee | | Comdata operations | | | 38,300 | |
| Nurnberg, Germany | | Shell Europe sales | | | 3,800 | |
Item 5. MARKET FOR REGISTRANT’S COMMON EQUITY, RELATED STOCKHOLDER
3 rewritten, 17 added, 7 removed, 41 unchanged
Read the full itemFY2015 item · filed February 29, 2016FY2014 item · filed March 2, 2015
As of December 31, [removed: 2014,] [added: 2015,] there were [removed: 42] [added: 45] holders of record of our common stock.
The table set forth below provides the intraday high and low sales prices per share of our common stock for the four quarters during [removed: 2014] [added: 2015] and [removed: 2013.][added: 2014.]
[removed: ][added: 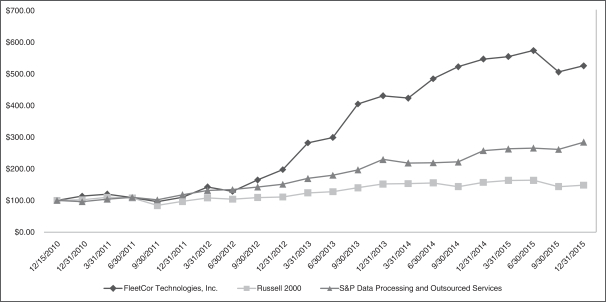]
| 2015: | | | | | | | | |
| First Quarter | | $ | 158.45 | | | $ | 135.73 | |
| Second Quarter | | | 165.67 | | | | 149.75 | |
| Third Quarter | | | 164.61 | | | | 135.16 | |
| Fourth Quarter | | | 157.97 | | | | 134.55 | |
On February 4, 2016, our Board of Directors approved a stock repurchase program under which we may begin purchasing up to $500 million of its common stock over the next 18 months.
Any stock repurchases may be made at times and in such amounts as we deem appropriate.
The timing and amount of stock repurchase, if any, will depend on a variety of factors including the stock price, market conditions, corporate and regulatory requirements, and any additional constraints related to material inside information we may possess.
The repurchases are expected to be funded by available cash flow from the business and working capital.
| | | | | | | | | | | | | |
| --- | --- | --- | --- | --- | --- | --- | --- | --- | --- | --- | --- | --- |
| Period Ending | | FleetCor Technologies, Inc. | | | | Russell 2000 | | | | S&P Data Processing and Outsourced Services | | |
| 3/31/2015 | | $ | 553.83 | | | $ | 163.04 | | | $ | 262.43 | |
| 6/30/2015 | | $ | 572.70 | | | $ | 163.20 | | | $ | 265.08 | |
| 9/30/2015 | | $ | 505.03 | | | $ | 143.25 | | | $ | 260.96 | |
| 12/31/2015 | | $ | 524.51 | | | $ | 147.83 | | | $ | 283.80 | |
Not Applicable.
| 2013: | | | | | | | | |
| First Quarter | | $ | 77.46 | | | $ | 54.10 | |
| Second Quarter | | | 89.75 | | | | 78.88 | |
| Third Quarter | | | 112.50 | | | | 81.10 | |
| Fourth Quarter | | | 123.96 | | | | 98.41 | |
##### [Table of Contents](#toc)
Except as previously disclosed on Form 8-K dated August 12, 2014 and Form 8-K dated November 17, 2014, there were no unregistered sales of equity securities during 2014.
Item 6. SELECTED FINANCIAL DATA
27 rewritten, 5 added, 3 removed, 19 unchanged
Read the full itemFY2015 item · filed February 29, 2016FY2014 item · filed March 2, 2015
We derived the consolidated statement of income and other financial data for the years ended December 31, [removed: 2014, 2013] [added: 2015, 2014] and [removed: 2012] [added: 2013] and the selected consolidated balance sheet data as of December 31, [removed: 2014] [added: 2015] and [removed: 2013] [added: 2014] from the audited consolidated financial statements included elsewhere in this report.
We derived the selected historical financial data for the years ended December 31, [removed: 2011] [added: 2012] and [removed: 2010] [added: 2011] and the selected consolidated balance sheets as of December 31, [removed: 2012, 2011] [added: 2013, 2012] and [removed: 2010] [added: 2011] from our audited consolidated financial statements that are not included in this report.
| (in thousands, except per share data) | | [removed: 2014] [added: 2015] | | | | [removed: 2013] [added: 2014] | | | | [removed: 2012] [added: 2013] | | | | [removed: 2011] [added: 2012] | | | | [removed: 2010] [added: 2011] | | |
| Revenues, net | | $ | [removed: 1,199,390] [added: 1,702,865] | | | $ | [removed: 895,171] [added: 1,199,390] | | | $ | [removed: 707,534] [added: 895,171] | | | $ | [removed: 519,591] [added: 707,534] | | | $ | [removed: 433,841] [added: 519,591] | |
| Merchant commissions | | | [removed: 96,254] [added: 108,257] | | | | [removed: 68,143] [added: 96,254] | | | | [removed: 58,573] [added: 68,143] | | | | [removed: 51,199] [added: 58,573] | | | | [removed: 49,050] [added: 51,199] | |
| Processing | | | [removed: 173,337] [added: 331,073] | | | | [removed: 134,030] [added: 173,337] | | | | [removed: 115,446] [added: 134,030] | | | | [removed: 84,516] [added: 115,446] | | | | [removed: 69,687] [added: 84,516] | |
| Selling | | | [removed: 75,527] [added: 109,075] | | | | [removed: 57,346] [added: 75,527] | | | | [removed: 46,429] [added: 57,346] | | | | [removed: 36,606] [added: 46,429] | | | | [removed: 32,731] [added: 36,606] | |
| General and administrative | | | [removed: 205,963] [added: 297,715] | | | | [removed: 142,283] [added: 205,963] | | | | [removed: 110,122] [added: 142,283] | | | | [removed: 84,765] [added: 110,122] | | | | [removed: 78,135] [added: 84,765] | |
| Depreciation and amortization | | | [removed: 112,361] [added: 193,453] | | | | [removed: 72,737] [added: 112,361] | | | | [removed: 52,036] [added: 72,737] | | | | [removed: 36,171] [added: 52,036] | | | | [removed: 33,745] [added: 36,171] | |
| Other operating, net | | | [removed: (29,501] [added: (4,242] | ) | | | [removed: —] [added: (29,501] | [added: )] | | | — | | | | — | | | | — | |
| Operating income | | | [removed: 565,449] [added: 667,534] | | | | [removed: 420,632] [added: 565,449] | | | | [removed: 324,928] [added: 420,632] | | | | [removed: 226,334] [added: 324,928] | | | | [removed: 170,493] [added: 226,334] | |
| Other expense (income), net | | | [added: 2,523 | | | |] (700 | ) | | | 602 | | | | 1,121 | | | | (589 | ) | [removed: | | (1,319 | ) |]
| Equity method investment loss | | | [removed: 8,586] [added: 57,668] | | | | [removed: —] [added: 8,586] | | | | — | | | | — | | | | — | |
| Interest expense, net | | | [removed: 28,856] [added: 71,339] | | | | [removed: 16,461] [added: 28,856] | | | | [removed: 13,017] [added: 16,461] | | | | [removed: 13,377] [added: 13,017] | | | | [removed: 20,532] [added: 13,377] | |
| Loss on early extinguishment of debt | | | [removed: 15,764] [added: —] | | | | [removed: —] [added: 15,764] | | | | — | | | | [removed: 2,669] [added: —] | | | | [removed: —] [added: 2,669] | |
| Total other expense | | | [removed: 52,506] [added: 131,530] | | | | [removed: 17,063] [added: 52,506] | | | | [removed: 14,138] [added: 17,063] | | | | [removed: 15,457] [added: 14,138] | | | | [removed: 19,213] [added: 15,457] | |
| Income before income taxes | | | [removed: 512,943] [added: 536,004] | | | | [removed: 403,569] [added: 512,943] | | | | [removed: 310,790] [added: 403,569] | | | | [removed: 210,877] [added: 310,790] | | | | [removed: 151,280] [added: 210,877] | |
| Provision for income taxes | | | [removed: 144,236] [added: 173,573] | | | | [removed: 119,068] [added: 144,236] | | | | [removed: 94,591] [added: 119,068] | | | | [removed: 63,542] [added: 94,591] | | | | [removed: 43,384] [added: 63,542] | |
| Net income | | $ | [removed: 368,707] [added: 362,431] | | | $ | [removed: 284,501] [added: 368,707] | | | $ | [removed: 216,199] [added: 284,501] | | | $ | [removed: 147,335] [added: 216,199] | | | $ | [removed: 107,896] [added: 147,335] | |
| Earnings per share, basic | | $ | [removed: 4.37] [added: 3.94] | | | $ | [removed: 3.48] [added: 4.37] | | | $ | [removed: 2.59] [added: 3.48] | | | $ | [removed: 1.83] [added: 2.59] | | | $ | [removed: 3.00] [added: 1.83] | |
| Earnings per share, diluted | | $ | [removed: 4.24] [added: 3.85] | | | $ | [removed: 3.36] [added: 4.24] | | | $ | [removed: 2.52] [added: 3.36] | | | $ | [removed: 1.76] [added: 2.52] | | | $ | [removed: 1.34] [added: 1.76] | |
| Weighted average shares outstanding, basic | | | [removed: 84,317] [added: 92,023] | | | | [removed: 81,793] [added: 84,317] | | | | [removed: 83,328] [added: 81,793] | | | | [removed: 80,610] [added: 83,328] | | | | [removed: 35,434] [added: 80,610] | |
| Weighted average shares outstanding, diluted | | | [removed: 86,982] [added: 94,139] | | | | [removed: 84,655] [added: 86,982] | | | | [removed: 85,736] [added: 84,655] | | | | [removed: 83,654] [added: 85,736] | | | | [removed: 80,751] [added: 83,654] | |
| (in thousands) | | [removed: 2014] [added: 2015] | | | | [removed: 2013] [added: 2014] | | | | [removed: 2012] [added: 2013] | | | | [removed: 2011] [added: 2012] | | | | [removed: 2010] [added: 2011] | | |
| Cash and cash equivalents | | $ | [removed: 477,069] [added: 447,152] | | | $ | [removed: 338,105] [added: 477,069] | | | $ | [removed: 283,649] [added: 338,105] | | | $ | [removed: 285,159] [added: 283,649] | | | $ | [removed: 114,804] [added: 285,159] | |
| Restricted cash(1) | | | [removed: 135,144] [added: 167,492] | | | | [removed: 48,244] [added: 135,144] | | | | [removed: 53,674] [added: 48,244] | | | | [removed: 55,762] [added: 53,674] | | | | [removed: 62,341] [added: 55,762] | |
| Total debt | | | [removed: 3,593,717] [added: 2,937,062] | | | | [removed: 1,486,378] [added: 3,593,717] | | | | [removed: 925,092] [added: 1,486,378] | | | | [removed: 704,265] [added: 925,092] | | | | [removed: 469,413] [added: 704,265] | |
| Total assets(2) | | | 7,891,868 | | | | 8,524,701 | | | | 3,908,717 | | | | 2,721,870 | | | | 2,349,169 | |
| Total stockholders’ equity(2) | | | 2,830,047 | | | | 2,618,562 | | | | 1,223,502 | | | | 913,822 | | | | 811,436 | |
| (2) | Revision of Previously Issued Financial Statements— We have revised previously reported balances within our Consolidated Balance Sheets as of December 31, 2014 and 2013, to translate these balances using the correct functional currencies. This revision had no effect on our Consolidated Statements of Income or Consolidated Statements of Cash Flows. We do not believe this revision was material to any prior period financial statement. See Footnote 2 to the Consolidated Financial Statements, Summary of Significant Accounting Policies. |
| --- | --- |
##### [Table of Contents](#toc)
| --- | --- | --- | --- | --- | --- | --- | --- | --- | --- | --- | --- | --- | --- | --- | --- | --- | --- | --- | --- | --- |
| Total assets | | | 8,674,506 | | | | 3,932,235 | | | | 2,721,870 | | | | 2,349,169 | | | | 1,484,118 | |
| Total stockholders’ equity | | | 2,753,137 | | | | 1,243,893 | | | | 913,822 | | | | 811,436 | | | | 625,945 | |
Item 8. FINANCIAL STATEMENTS AND SUPPLEMENTARY DATA
389 rewritten, 218 added, 247 removed, 768 unchanged
Read the full itemFY2015 item · filed February 29, 2016FY2014 item · filed March 2, 2015
| [Reports of Independent Registered Public Accounting [removed: Firm](#fin831300_1)] [added: Firm](#tx18451_23)] | | | [removed: 82] [added: 83] | |
| [Consolidated Balance Sheets at December 31, [removed: 2014] [added: 2015] and [removed: 2013](#fin831300_2)] [added: 2014 4](#tx18451_24)] | | | [removed: 84] [added: 85] | |
| [Consolidated Statements of Income for the Years Ended December 31, [removed: 2014, 2013] [added: 2015, 2014] and [removed: 2012](#fin831300_3)] [added: 2013](#tx18451_25)] | | | [removed: 85] [added: 86] | |
| [Consolidated Statements of Comprehensive Income for the Years Ended December 31, [removed: 2014, 2013] [added: 2015, 2014] and [removed: 2012](#fin831300_4)] [added: 2013](#tx18451_26)] | | | [removed: 86] [added: 87] | |
| [Consolidated Statements of Stockholders’ Equity for the Years Ended December 31, [removed: 2014, 2013] [added: 2015, 2014] and [removed: 2012](#fin831300_5)] [added: 2013](#tx18451_27)] | | | [removed: 87] [added: 88] | |
| [Consolidated Statements of Cash Flows for the Years Ended December 31, [removed: 2014, 2013] [added: 2015, 2014] and [removed: 2012](#fin831300_6)] [added: 2013](#tx18451_28)] | | | [removed: 88] [added: 89] | |
| [Notes to Consolidated Financial [removed: Statements](#fin831300_7)] [added: Statements](#tx18451_29)] | | | [removed: 89] [added: 90] | |
We have audited the accompanying consolidated balance sheets of FleetCor Technologies, Inc. and subsidiaries as of December 31, [removed: 2014] [added: 2015] and [removed: 2013,] [added: 2014,] and the related consolidated statements of income, comprehensive income, stockholders’ equity, and cash flows for each of the three years in the period ended December 31, [removed: 2014.][added: 2015.]
In our opinion, the financial statements referred to above present fairly, in all material respects, the consolidated financial position of FleetCor Technologies, Inc. and subsidiaries at December 31, [removed: 2014] [added: 2015] and [removed: 2013,] [added: 2014,] and the consolidated results of their operations and their cash flows for each of the three years in the period ended December 31, [removed: 2014,] [added: 2015,] in conformity with U.S. generally accepted accounting principles.
We also have audited, in accordance with the standards of the Public Company Accounting Oversight Board (United States), FleetCor Technologies, Inc. and subsidiaries’ internal control over financial reporting as of December 31, [removed: 2014,] [added: 2015,] based on criteria established in Internal Control-Integrated Framework issued by the Committee of Sponsoring Organizations of the Treadway Commission (2013 framework) and our report dated [removed: March 2, 2015] [added: February 29, 2016] expressed an unqualified opinion thereon.
We have audited FleetCor Technologies, Inc. and subsidiaries’ internal control over financial reporting as of December 31, [removed: 2014,] [added: 2015,] based on criteria established in Internal Control—Integrated Framework issued by the Committee of Sponsoring Organizations of the Treadway Commission (2013 framework) (the COSO criteria).
A company’s internal control over financial reporting includes those policies and procedures that (1) pertain to the maintenance of records that, in reasonable detail, accurately and fairly reflect the transactions and dispositions of the assets of the company; (2) provide reasonable assurance that transactions are recorded as necessary to permit preparation of financial statements in accordance with generally accepted accounting principles, and that receipts and expenditures of the company are being made only in accordance with authorizations of management and directors of the company; and (3) provide reasonable assurance regarding prevention or timely detection of unauthorized acquisition, [removed: use] [added: use,] or disposition of the company’s assets that could have a material effect on the financial statements.
In our opinion, FleetCor Technologies, Inc. and subsidiaries maintained, in all material respects, effective internal control over financial reporting as of December 31, [removed: 2014,] [added: 2015,] based on the COSO criteria.
We also have audited, in accordance with the standards of the Public Company Accounting Oversight Board (United States), the consolidated balance sheets of FleetCor Technologies, Inc. and subsidiaries as of December 31, [removed: 2014] [added: 2015] and [removed: 2013,] [added: 2014,] and the related consolidated statements of income, comprehensive income, stockholders’ equity, and cash flows for each of the three years in the period ended December 31, [removed: 2014] [added: 2015] of FleetCor Technologies, Inc. and subsidiaries and our report dated [removed: March 2, 2015] [added: February 29, 2016] expressed an unqualified opinion thereon.
| | | December [removed: 31] [added: 31,] | | | | | | |
| | | [added: 2015 | | | |] 2014 | | | | 2013 | | |
| Cash and cash [removed: equivalents] [added: equivalents, beginning of year] | | [removed: $] | 477,069 | | | [removed: $] | 338,105 | | [added: | | 283,649 | |]
| Restricted cash | | | [removed: 135,144] [added: 167,492] | | | | [removed: 48,244] [added: 135,144] | |
| Accounts receivable (less allowance for doubtful accounts of [removed: $23,842] [added: $21,903] and [removed: $22,416,] [added: $23,842,] respectively) | | | [removed: 673,797] [added: 638,954] | | | | [removed: 573,351] [added: 673,797] | |
| Securitized accounts receivable—restricted for securitization investors | | | [removed: 675,000] [added: 614,000] | | | | [removed: 349,000] [added: 675,000] | |
| Prepaid expenses and other current assets | | | [removed: 74,889] [added: 68,661] | | | | [removed: 40,062] [added: 74,889] | |
| Deferred income taxes | | | [removed: 101,451] [added: 8,913] | | | | [removed: 4,750] [added: 101,451] | |
| Total current assets | | | [removed: 2,137,350] [added: 1,945,172] | | | | [removed: 1,353,512] [added: 2,137,350] | |
| Property and equipment | | | [removed: 135,062] [added: 163,569] | | | | [removed: 111,100] [added: 135,062] | |
| Less accumulated depreciation and amortization | | | [removed: (61,499] [added: (82,809] | ) | | | [removed: (57,144] [added: (61,499] | ) |
| Net property and equipment | | | [removed: 73,563] [added: 80,760] | | | | [removed: 53,956] [added: 73,563] | |
| Other intangibles, net | | | 2,437,367 | | | | [removed: 871,263] [added: (51,125] | [added: )] | [added: | | 2,386,242 | |]
| Equity method investment | | | [removed: 141,933] [added: 76,568] | | | | [removed: —] [added: 141,933] | |
| Other assets | | | [removed: 72,431] [added: 59,739] | | | | [removed: 100,779] [added: 72,431] | |
| Accounts payable | | $ | [removed: 716,676] [added: 669,528] | | | $ | [removed: 467,202] [added: 716,676] | |
| Accrued expenses | | | [removed: 178,375] [added: 150,677] | | | | [removed: 114,870] [added: 178,375] | |
| Customer deposits | | | [removed: 492,257] [added: 507,233] | | | | [removed: 182,541] [added: 492,257] | |
| Securitization facility | | | [removed: 675,000] [added: 614,000] | | | | [removed: 349,000] [added: 675,000] | |
| Current portion of notes payable and lines of credit | | | [removed: 749,764] [added: 261,647] | | | | [removed: 662,439] [added: 749,764] | |
| Other current liabilities | | | [removed: 84,546] [added: 44,936] | | | | [removed: 132,846] [added: 84,546] | |
| Total current liabilities | | | [removed: 2,896,618] [added: 2,248,021] | | | | [removed: 1,908,898] [added: 2,896,618] | |
| Notes payable and other obligations, less current portion | | | [removed: 2,168,953] [added: 2,061,415] | | | | [removed: 474,939] [added: 2,168,953] | |
| Deferred income taxes | | | 815,169 | | | | [removed: 249,504] [added: (15,230] | [added: )] | [added: | | 799,939 | |]
| Other noncurrent liabilities | | | [removed: 40,629] [added: 38,957] | | | | [removed: 55,001] [added: 40,629] | |
| [removed: Preferred] [added: Common] stock, $0.001 par value; [removed: 25,000,000] [added: 475,000,000] shares [removed: authorized] [added: authorized; 120,539,041 shares issued] and [removed: no] [added: 92,376,334] shares [added: outstanding at December 31, 2015; and 119,771,155 shares] issued and [added: 91,662,043 shares] outstanding at December 31, 2014 [removed: and 2013] | | | [removed: —] [added: 121] | | | | [removed: —] [added: 120] | |
February 29, 2016
February 29, 2016
| | | 2015 | | | | 2014 | | |
| Cash and cash equivalents | | $ | 447,152 | | | $ | 477,069 | |
| Goodwill | | | 3,546,034 | | | | 3,713,182 | |
| Other intangibles, net | | | 2,183,595 | | | | 2,386,242 | |
| Total assets | | $ | 7,891,868 | | | $ | 8,524,701 | |
| Deferred income taxes | | | 713,428 | | | | 799,939 | |
| Total noncurrent liabilities | | | 2,813,800 | | | | 3,009,521 | |
| Accumulated other comprehensive loss | | | (570,811 | ) | | | (291,508 | ) |
| Total stockholders’ equity | | | 2,830,047 | | | | 2,618,562 | |
| Total liabilities and stockholders’ equity | | $ | 7,891,868 | | | $ | 8,524,701 | |
| Foreign currency translation loss, net of tax | | | (279,303 | ) | | | (223,691 | ) | | | (64,471 | ) |
| Total other comprehensive loss | | | (279,303 | ) | | | (223,691 | ) | | | (64,471 | ) |
| Total comprehensive income | | $ | 83,128 | | | $ | 145,016 | | | $ | 220,030 | |
| Net income | | | — | | | | — | | | | 362,431 | | | | — | | | | — | | | | 362,431 | |
| Other comprehensive loss, net of tax of $0 | | | — | | | | — | | | | — | | | | (279,303 | ) | | | — | | | | (279,303 | ) |
| Issuance of treasury stock | | | — | | | | — | | | | — | | | | — | | | | (8,119 | ) | | | (8,119 | ) |
| Issuance of common stock | | | 1 | | | | 136,475 | | | | — | | | | — | | | | — | | | | 136,476 | |
| Balance at December 31, 2015 | | $ | 121 | | | $ | 1,988,917 | | | $ | 1,766,336 | | | $ | (570,811 | ) | | $ | (354,516 | ) | | $ | 2,830,047 | |
| Other non-cash operating expenses | | | (4,242 | ) | | | (27,501 | ) | | | — | |
| Accounts payable, accrued expenses and customer deposits | | | 30,023 | | | | (185,875 | ) | | | 11,635 | |
| Payment of contingent consideration | | | (42,177 | ) | | | — | | | | — | |
December 31, 2015
In North America, the Company sells a fuel card product, commercial payment and data solutions, lodging and transportation management services, gift card and stored value solutions, as well as a fleet telematics offering.
In its International segment, the Company provides fuel card and related fuel services, work force payment and vehicle maintenance management solutions.
The Company recognizes revenue on fees generated through services to commercial fleets, commercial
The Company ceases billing and accruing for late fees and finance charges approximately 30-40 days after the customer’s balance becomes delinquent.
Accounts receivable are deemed uncollectible once they age past 90 days and are deemed uncollectible from the customer.
The Company also provides an allowance for receivables aged less than 90 days that it expects will be uncollectible based on historical collections experience including accounts that have filed for bankruptcy.
At December 31, 2015 and 2014, approximately 98% of outstanding accounts receivable were current.
goodwill.
The Company regularly evaluates the carrying value of its equity method investment, which is not carried at fair value, for other-than-temporary impairment.
The Company estimates the fair value of its equity method investment using a combination of the income approach and the market approach.
The income approach utilizes a discounted cash flow model incorporating management’s expectations for future revenue, operating expenses, earnings before interest, taxes, depreciation and amortization, capital expenditures and an anticipated tax rate.
The Company discounts the related cash flow forecasts using an estimated weighted-average cost of capital for each reporting unit at the date of valuation.
The market approach utilizes comparative market multiples in the valuation estimate.
Multiples are derived by relating the value of guideline companies, based on either the market price of publicly traded shares or the prices of companies being acquired in the marketplace, to various measures of their earnings and cash flow.
Such multiples are then applied to the historical and projected earnings and cash flow of our equity method investment in developing the valuation estimate.
During the fourth quarter of 2015, the Company determined that the performance improvement initiatives in its equity method investment in Masternaut will take longer to implement than originally projected.
##### [Table of Contents](#toc)
March 2, 2015
##### [Table of Contents](#toc)
As indicated in the accompanying Management’s Report on Internal Control Over Financial Reporting, management’s assessment of and conclusion on the effectiveness of internal control over financial reporting did not include the internal controls of Pacific Pride Services, LLC, FleetCor Deutschland GmbH, and Comdata, Inc., which are included in the 2014 consolidated financial statements of FleetCor Technologies, Inc. and subsidiaries and constituted approximately $4.8 billion of total assets, as of December 31, 2014 and $77 million and $20 million of revenues and net income, respectively, for the year then ended.
Our audit of internal control over financial reporting of FleetCor Technologies, Inc. and subsidiaries also did not include an evaluation of the internal control over financial reporting of Pacific Pride Services, LLC, FleetCor Deutschland GmbH, and Comdata, Inc.
March 2, 2015
| --- | --- | --- | --- | --- | --- | --- | --- | --- |
| Goodwill | | | 3,811,862 | | | | 1,552,725 | |
| Total assets | | $ | 8,674,506 | | | $ | 3,932,235 | |
| Total noncurrent liabilities | | | 3,024,751 | | | | 779,444 | |
| Common stock, $0.001 par value; 475,000,000 shares authorized, 119,771,155 shares issued and 91,662,043 shares outstanding at December 31, 2014; and 118,206,262 shares issued and 82,471,770 shares outstanding at December 31, 2013 | | | 120 | | | | 117 | |
| Total stockholders’ equity | | | 2,753,137 | | | | 1,243,893 | |
| Total liabilities and stockholders’ equity | | $ | 8,674,506 | | | $ | 3,932,235 | |
| Foreign currency translation adjustment (loss) gain, net of tax | | | (109,507 | ) | | | (44,080 | ) | | | 10,370 | |
| | | | | | | | | | | | | | | | | | | | | | | | | |
| Balance at December 31, 2011 | | $ | 114 | | | $ | 466,203 | | | $ | 534,498 | | | $ | (175,663 | ) | | $ | (13,716 | ) | | $ | 811,436 | |
| Net income | | | — | | | | — | | | | 216,199 | | | | — | | | | — | | | | 216,199 | |
| Other comprehensive income from currency exchange, net of tax of $0 | | | — | | | | — | | | | — | | | | — | | | | 10,370 | | | | 10,370 | |
| Total comprehensive income | | | | | | | | | | | | | | | | | | | | | | | 226,569 | |
| Issuance of common stock | | | 2 | | | | 75,815 | | | | — | | | | — | | | | — | | | | 75,817 | |
| Total comprehensive income | | | | | | | | | | | | | | | | | | | | | | | 240,421 | |
| Total comprehensive income | | | | | | | | | | | | | | | | | | | | | | | 259,200 | |
| Fair value adjustment for contingent consideration arrangements | | | (27,501 | ) | | | — | | | | — | |
| Repurchase of common stock | | | — | | | | — | | | | (200,000 | ) |
| Cash and cash equivalents at beginning of year | | | 338,105 | | | | 283,649 | | | | 285,159 | |
In North America, the Company sells a fuel card product, commercial payment and data solutions, as well as a fleet telematics offering, which allows customers to track the location of mobile workers in field-based businesses, primarily to small and mid-sized fleets, as well as over-the-road trucking fleets.
The Company also provides lodging and transportation management services in North America.
In its International segment, the Company provides small and mid-sized fleets with fuel cards to control and manage spending.
Additionally, the Company provides a similar fuel product in its International segment to over-the-road trucking fleets, shipping fleets and other operators of heavily industrialized equipment, that when utilized at the fueling site and by the vehicle, significantly reduces the likelihood of unauthorized and fraudulent transactions and allows fleet owners to monitor and control fuel consumption.
The Company also provides a vehicle maintenance service offering in its International segment that helps fleet customers to better manage their vehicle maintenance, service, and
repair needs.
Furthermore, the Company also provides prepaid fuel, transportation, toll and food vouchers and cards internationally that may be used as a form of payment in restaurants, grocery stores, gas stations, public transportation and toll roads.
In 2014, the Company processed approximately 652 million transactions on our proprietary networks and third-party networks (which includes approximately 270 million transactions related to our SVS product, acquired with Comdata).
provided, the sales price is fixed or determinable and collectability is reasonably assured.
flow analysis, as well as market multiples for comparable companies.
straight-line method over the estimated useful life of the software.
The Company has
| Add: | | | | | | | | | | | | |
| Less: | | | | | | | | | | | | |
Purchase of Receivables
An excerpt. Shown here: 40 of 389 rewritten, 40 of 218 added and 40 of 247 removed. The counts are complete. For every sentence, read Item 8. FINANCIAL STATEMENTS AND SUPPLEMENTARY DATA in the FY2015 filing and the FY2014 filing.
Item 9A. CONTROLS AND PROCEDURES
6 rewritten, 0 added, 7 removed, 13 unchanged
Read the full itemFY2015 item · filed February 29, 2016FY2014 item · filed March 2, 2015
As of December 31, [removed: 2014,] [added: 2015,] management carried out, under the supervision and with the participation of our [removed: principal executive officer] [added: Chief Executive Officer] and [removed: principal financial officer,] [added: Chief Financial Officer,] an evaluation of the effectiveness of the design and operation of our disclosure controls and procedures (as defined in Rules 13a-15(e) and 15d-15(e) under the Securities Exchange Act of 1934).
Based on this evaluation, our [removed: principal executive officer] [added: Chief Executive Officer] and [removed: principal financial officer] [added: Chief Financial Officer] concluded that, as of December 31, [removed: 2014,] [added: 2015,] our disclosure controls and procedures were effective in ensuring that information required to be disclosed by us in the reports that we file or submit under the Securities Exchange Act of 1934, as amended, is recorded, processed, summarized and reported within the time periods specified in applicable rules and forms and are designed to ensure that information required to be disclosed in those reports is accumulated and communicated to management, including our [removed: principal executive] [added: Chief Executive Officer] and [removed: principal financial officers,] [added: Chief Financial Officer,] as appropriate to allow timely decisions regarding required disclosure.
Our management assessed the effectiveness of our internal control over financial reporting as of December 31, [removed: 2014.][added: 2015.]
In making this assessment, our management used the criteria set forth by the Committee of Sponsoring Organizations of the Treadway Commission (COSO) in _Internal Control-Integrated Framework._ As of December 31, [removed: 2014,] [added: 2015,] management believes that the Company’s internal control over financial reporting is effective based on those criteria.
Due to such limitations, there is a risk that material misstatements [added: may not be prevented or detected on a timely basis by internal control over financial reporting.]
There were no changes in our internal control over financial reporting during the quarter ended December 31, [removed: 2014] [added: 2015] that have materially affected, or are reasonably likely to materially affect, our internal control over financial reporting.
In connection with management’s evaluation, our management team excluded from its assessment of the effectiveness of our internal control over financial reporting as of December 31, 2014 the internal controls relating to six subsidiaries that we acquired during the year ended December 31, 2014 and for which financial results are included in our consolidated financial statements.
On November 14, 2014, we acquired all of the outstanding stock of Comdata Inc., a provider of electronic payment solutions in the U.S. We also acquired two other insignificant businesses during 2014.
Collectively we refer to these transactions as the Acquisitions.
These Acquisitions constituted $4.8 billion of total assets at December 31, 2014, $77 million of revenues and a net loss of $20 million, respectively, for the year then ended.
This exclusion was in accordance with Securities and Exchange Commission guidance that an assessment of a recently acquired business may be omitted in management’s report on internal control over financial reporting in the year of acquisition.
##### [Table of Contents](#toc)
may not be prevented or detected on a timely basis by internal control over financial reporting.
Item 10. DIRECTORS, EXECUTIVE OFFICERS AND CORPORATE GOVERNANCE
1 rewritten, 0 added, 0 removed, 7 unchanged
Read the full itemFY2015 item · filed February 29, 2016FY2014 item · filed March 2, 2015
Information about our directors may be found under the caption “Nominees” and “Continuing Directors” in our Proxy Statement for the Annual Meeting of Shareholders to be held June [removed: 10, 2015] [added: 8, 2016] (the “Proxy Statement”).
Item 15. EXHIBITS AND FINANCIAL STATEMENT SCHEDULES
52 rewritten, 10 added, 1 removed, 114 unchanged
Read the full itemFY2015 item · filed February 29, 2016FY2014 item · filed March 2, 2015
| [Reports of Independent Registered Public Accounting [removed: Firm](#fin831300_1)] [added: Firm](#tx18451_23)] | | | [removed: 82] [added: 83] | |
| [Consolidated Balance Sheets at December 31, [removed: 2014] [added: 2015] and [removed: 2013](#fin831300_2)] [added: 2014](#tx18451_24)] | | | [removed: 84] [added: 85] | |
| [Consolidated Statements of Income for the Years Ended December 31, [removed: 2014, 2013] [added: 2015, 2014] and [removed: 2012](#fin831300_3)] [added: 2013](#tx18451_25)] | | | [removed: 85] [added: 86] | |
| [Consolidated Statements of Comprehensive Income for the Years Ended December 31, [removed: 2014, 2013] [added: 2015, 2014] and [removed: 2012](#fin831300_4)] [added: 2013](#tx18451_26)] | | | [removed: 86] [added: 87] | |
| [Consolidated Statements of Stockholders’ Equity for the Years Ended December 31, [removed: 2014, 2013] [added: 2015, 2014] and [removed: 2012](#fin831300_5)] [added: 2013](#tx18451_27)] | | | [removed: 87] [added: 88] | |
| [Consolidated Statements of Cash Flows for the Years Ended December 31, [removed: 2014, 2013] [added: 2015, 2014] and [removed: 2012](#fin831300_6)] [added: 2013](#tx18451_28)] | | | [removed: 88] [added: 89] | |
| [Notes to Consolidated Financial [removed: Statements](#fin831300_7)] [added: Statements](#tx18451_29)] | | | [removed: 89] [added: 90] | |
| 2.1 | | Stock Purchase Agreement, dated as of April 1, 2009, among FleetCor Technologies Operating Company, LLC, CLC Group, Inc., and the entities and individuals identified on the signature pages thereto (incorporated by reference to Exhibit No. 2.1 to Amendment No. 1 to the registrant’s Registration Statement on [removed: form] [added: Form] S-1, file number 333-166092, filed [added: with the SEC] on May 20, 2010) |
| 2.2 | | Share Purchase Agreement among Arval UK Group Limited, FleetCor UK Acquisition Limited and FleetCor Technologies, Inc. (incorporated by reference to exhibit No. 2.1 to the registrant’s [removed: form] [added: Form] 8-K, filed [added: with the SEC] on December 13, 2011) |
| 2.3 | | Agreement and Plan of Merger, dated August 12, 2014, by and among Comdata Inc., Ceridian LLC, FleetCor Technologies, Inc. and FCHC Project, Inc. (incorporated by reference to Exhibit No. 2.1 to the registrant’s [removed: form] [added: Form] 10-Q, filed [added: with the SEC with the SEC] on November 10, 2014) |
| 2.4 | | Amendment to Agreement and Plan of Merger, dated November 10, 2014, by and among Comdata Inc., Ceridian LLC, FleetCor Technologies, Inc. and FCHC Project, Inc. (incorporated by reference to Exhibit No. 10.2 to the [removed: Registrant’s form] [added: registrant’s Form] 8-K, filed [added: with the SEC] on November 17, 2014) |
| 3.1 | | Amended and Restated Certificate of Incorporation of FleetCor Technologies, Inc. (incorporated by reference to Exhibit [removed: No.] 3.1 to the registrant’s [removed: form] [added: Annual Report on Form] 10-K, [added: File No. 001-35004,] filed [added: with SEC] on March 25, 2011) |
| 3.2 | | Amended and Restated Bylaws of FleetCor Technologies, Inc. (incorporated by reference to Exhibit [removed: No.] 3.2 to the registrant’s [removed: form] [added: Annual Report on Form] 10-K, [added: File No. 001-35004,] filed [added: with the SEC] on March 25, 2011) |
| 4.1 | | Form of Stock Certificate for Common Stock (incorporated by reference to Exhibit [removed: No.] 4.1 to Amendment No. 3 to the registrant’s Registration Statement on [removed: form] [added: Form] S-1, [removed: file number] [added: File No.] 333-166092, filed [added: with the SEC] on June 29, 2010) |
| 10.1* | | Form of Indemnity Agreement entered into between FleetCor and its directors and executive officers (incorporated by reference to Exhibit 10.1 to Amendment No. 3 to the registrant’s Registration Statement on [removed: form] [added: Form] S-1, file number 333-166092, filed [added: with the SEC] on June 29, 2010) |
| 10.2* | | FleetCor Technologies, Inc. Amended and Restated Stock Incentive Plan (incorporated by reference to Exhibit 10.2 to Amendment No. 1 to the registrant’s Registration Statement on [removed: form] [added: Form] S-1, file number 333-166092, filed [added: with the SEC] on May 20, 2010) |
| 10.3* | | First Amendment to FleetCor Technologies, Inc. Amended and Restated Stock Incentive Plan (incorporated by reference to Exhibit 10.3 to Amendment No. 1 to the registrant’s Registration Statement on [removed: form] [added: Form] S-1, file number 333-166092, filed [added: with the SEC] on May 20, 2010) |
| 10.4* | | Second Amendment to FleetCor Technologies, Inc. Amended and Restated Stock Incentive Plan (incorporated by reference to Exhibit 10.4 to Amendment No. 1 to the registrant’s Registration Statement on [removed: form] [added: Form] S-1, file number 333-166092, filed [added: with the SEC] on May 20, 2010) |
| 10.5* | | Third Amendment to FleetCor Technologies, Inc. Amended and Restated Stock Incentive Plan (incorporated by reference to Exhibit 10.5 to Amendment No. 1 to the registrant’s Registration Statement on [removed: form] [added: Form] S-1, file number 333-166092, filed [added: with the SEC] on May 20, 2010) |
| 10.6* | | Fourth Amendment to FleetCor Technologies, Inc. Amended and Restated Stock Incentive Plan (incorporated by reference to Exhibit 10.6 to Amendment No. 1 to the registrant’s Registration Statement on [removed: form] [added: Form] S-1, file number 333-166092, filed [added: with the SEC] on May 20, 2010) |
| 10.7* | | Form of Incentive Stock Option Award Agreement pursuant to the FleetCor Technologies, Inc. Amended and Restated Stock Incentive Plan (incorporated by reference to Exhibit 10.7 to Amendment No. 1 to the registrant’s Registration Statement on [removed: form] [added: Form] S-1, file number 333-166092, filed [added: with the SEC] on May 20, 2010) |
| 10.8* | | Form of Non-Qualified Stock Option Award Agreement pursuant to the FleetCor Technologies, Inc. Amended and Restated Stock Incentive Plan (incorporated by reference to Exhibit 10.8 to Amendment No. 1 to the registrant’s Registration Statement on [removed: form] [added: Form] S-1, file number 333-166092, filed [added: with the SEC] on May 20, 2010) |
| 10.9* | | Form of Performance Share Restricted Stock Agreement pursuant to the FleetCor Technologies, Inc. Amended and Restated Stock Incentive Plan (incorporated by reference to Exhibit 10.9 to Amendment No. 1 to the registrant’s Registration Statement on [removed: form] [added: Form] S-1, file number 333-166092, filed [added: with the SEC] on May 20, 2010) |
| 10.10* | | Form of FleetCor Technologies, Inc. 2010 Equity Compensation Plan (incorporated by reference to Exhibit 10.10 to Amendment No. 2 to the registrant’s Registration Statement on [removed: form] [added: Form] S-1, file number 333-166092, filed [added: with the SEC with the SEC] on June 8, 2010) |
| 10.11* | | FleetCor Technologies, Inc. Annual Executive Bonus Program (incorporated by reference to Exhibit 10.11 to Amendment No. 2 to the registrant’s Registration Statement on [removed: form] [added: Form] S-1, file number 333-166092, filed [added: with the SEC with the SEC] on June 8, 2010) |
| 10.12* | | Employee Noncompetition, Nondisclosure and Developments Agreement, dated September 25, 2000, between Fleetman, Inc. and Ronald F. Clarke (incorporated by reference to Exhibit 10.12 to Amendment No. 2 to the registrant’s Registration Statement on [removed: form] [added: Form] S-1, file number 333-166092, filed [added: with the SEC with the SEC] on June 8, 2010) |
| 10.13* | | Offer Letter, dated September 20, 2002, between FleetCor Technologies, Inc. and Eric R. Dey (incorporated by reference to Exhibit 10.13 to Amendment No. 2 to the registrant’s Registration Statement on [removed: form] [added: Form] S-1, file number 333-166092, filed [added: with the SEC with the SEC] on June 8, 2010) |
| 10.14* | | Offer Letter, dated March 17, 2009, between FleetCor Technologies, Inc. and Todd W. House (incorporated by reference to Exhibit 10.15 to Amendment No. 2 to the registrant’s Registration Statement on [removed: form] [added: Form] S-1, file number 333-166092, filed [added: with the SEC with the SEC] on June 8, 2010) |
| 10.15* | | Service Agreement, dated July 9, 2007, between FleetCor Technologies, Inc. and Andrew R. Blazye (incorporated by reference to Exhibit 10.16 to Amendment No. 2 to the registrant’s Registration Statement on [removed: form] [added: Form] S-1, file number 333-166092, filed [added: with the SEC with the SEC] on June 8, 2010) |
| 10.16 | | Sixth Amended and Restated Registration Rights Agreement, dated April 1, 2009, between FleetCor Technologies, Inc. and each of the stockholders party thereto (incorporated by reference to Exhibit 10.17 to Amendment No. 2 to the registrant’s Registration Statement on [removed: form] [added: Form] S-1, file number 333-166092, filed [added: with the SEC with the SEC] on June 8, 2010) |
| 10.17 | | First Amendment to Sixth Amended and Restated Registration Rights Agreement (incorporated by reference to Exhibit No. 10.17 to the registrant’s form 10-K, filed [added: with the SEC with the SEC] on March 25, 2011) |
| 10.18 | | Form of Indemnity Agreement to be entered into between FleetCor and representatives of its major stockholders (incorporated by reference to Exhibit 10.37 to Amendment No. 3 to the registrant’s Registration Statement on [removed: form] [added: Form] S-1, file number 333-166092, filed [added: with the SEC with the SEC] on June 29, 2010). |
| 10.19 | | Form of Director Restricted Stock Grant Agreement pursuant to the FleetCor Technologies, Inc. 2010 Equity Compensation Plan (incorporated by reference to Exhibit 10.38 to Amendment No. 6 to the registrant’s Registration Statement on [removed: form] [added: Form] S-1, file number 333-166092, filed [added: with the SEC with the SEC] on November 30, 2010). |
| 10.20* | | Form of Employee Performance Share Restricted Stock Agreement pursuant to the FleetCor Technologies, Inc. 2010 Equity Compensation Plan (incorporated by reference to Exhibit 10.39 to Amendment No. 6 to the registrant’s Registration Statement on [removed: form] [added: Form] S-1, file number 333-166092, filed [added: with the SEC with the SEC] on November 30, 2010). |
| 10.21* | | Form of Employee Incentive Stock Option Award Agreement pursuant to the FleetCor Technologies, Inc. 2010 Equity Compensation Plan (incorporated by reference to Exhibit 10.40 to Amendment No. 6 to the registrant’s Registration Statement on [removed: form] [added: Form] S-1, file number 333-166092, filed [added: with the SEC] on November 30, 2010). |
| 10.22* | | Form of Employee Non-Qualified Stock Option Award Agreement pursuant to the FleetCor Technologies, Inc. 2010 Equity Compensation Plan (incorporated by reference to Exhibit 10.41 to Amendment No. 6 to the registrant’s Registration Statement on [removed: form] [added: Form] S-1, file number 333-166092, filed [added: with the SEC with the SEC] on November 30, 2010). |
| 10.23 | | Form of Director Non-Qualified Stock Option Award Agreement pursuant to the FleetCor Technologies, Inc. 2010 Equity Compensation Plan (incorporated by reference to Exhibit 10.42 to Amendment No. 6 to the registrant’s Registration Statement on [removed: form] [added: Form] S-1, file number 333-166092, filed [added: with the SEC with the SEC] on November 30, 2010). |
| 10.24* | | Amended and Restated Employee Noncompetition, Nondisclosure and Developments Agreement, dated November 29, 2010, between FleetCor Technologies, Inc. and Ronald F. Clarke (incorporated by reference to Exhibit No. 10.43 to Amendment No. 6 to the registrant’s Registration Statement on [removed: form] [added: Form] S-1, file number 333-166092, filed [added: with the SEC with the SEC] on November 30, 2010). |
| [removed: 10.27] [added: 10.35*] | | Offer Letter, dated [removed: February 3, 2012,] [added: June 19, 2013,] between FleetCor Technologies, Inc. and [removed: Donovan H. Williams, Jr.] [added: John A. Reed] (incorporated by reference to Exhibit [added: No.] 10.3 to the [removed: Registrant’s Quarterly Report on] [added: registrant’s] Form 10-Q, filed with the SEC on [removed: May 10, 2013)] [added: March 12, 2014)] |
| [removed: 10.28] [added: 10.27*] | | FleetCor Technologies, Inc. 2010 Equity Compensation Plan, as amended and restated effective May 30, 2013 (incorporated by reference from Appendix A to the Proxy Statement, filed with the SEC on April 24, 2013) |
| 10.37 | | First Amendment to the Fifth Amended and Restated Receivables Purchase Agreement, dated as of November 5, 2015, by and among FleetCor Funding LLC, FleetCor Technologies Operating Company, LLC and PNC Bank, National Association, as administrator for a group of purchasers and purchaser agents, and certain other parties (incorporated by reference to Exhibit 10.2 to the registrant’s Form 10-Q, file number 001-35004, filed with the SEC on November 9, 2015) |
| Exhibit no. | | |
| 10.38* | | Employee agreement on confidentiality, work product, non-competition, and non-solicitation |
| 10.39 | | Second Amendment to the Fifth Amended and Restated Receivables Purchase Agreement, dated as of December 1, 2015, by and among FleetCor Funding LLC, FleetCor Technologies Operating Company, LLC and PNC Bank, National Association, as administrator for a group of purchasers and purchaser agents, and certain other parties |
##### [Table of Contents](#toc)
| --- | --- | --- |
| | | |
| | | |
| | | |
| | | |
| /S/ ANDREW B. BALSON Andrew B. Balson | | Director |
An excerpt. Shown here: 40 of 52 rewritten, all 10 added and all 1 removed. The counts are complete. For every sentence, read Item 15. EXHIBITS AND FINANCIAL STATEMENT SCHEDULES in the FY2015 filing and the FY2014 filing.