 filings.tools
Copart (CPRT) 10-K risk factor changes: FY2014 vs FY2013
The 2014-07-31 10-K against the 2013-07-31 one, compared heading by heading and sentence by sentence. One of these filings carries no fiscal year tag, so its year is the calendar year of the period end.
Item 1A58 rewritten72 added12 removed261 unchanged
All filing items876 rewritten561 added451 removed1,358 unchanged
Summary
counted, not written
- Item 1A lists 35 risk factor headings: 4 new, 0 reworded and 31 unchanged since FY2013. 1 heading from FY2013 no longer appears.
- Sentence by sentence, 561 added, 451 removed, 876 rewritten and 1,358 unchanged across 18 items that differ.
New Item 1A headings (4)
- We are transitioning various functionality of our third-party enterprise operating system to an internally developed proprietary system, and we may experience difficulties operating our business as we work to develop, design and stabilize this system.
- A failure or breach of our security systems or infrastructure as a result of cyber-attacks could disrupt our business, result in the disclosure or misuse of confidential or proprietary information, damage our reputation, increase our costs and cause losses.Cybersecurity
- Our business is exposed to risks associated with online commerce security and credit card fraud.
- Rapid technological changes may render our technology obsolete or decrease the competitiveness of our services.
Removed Item 1A headings (1)
- If the implementation of our new Enterprise Resource Planning (ERP) system is not executed efficiently and effectively, our business, financial position, and our consolidated operating results could be adversely affected.
A heading is new when no FY2013 heading matches it after ignoring case and punctuation, and reworded when it shares at least 60 percent of its words with one that went away. All current risk factor headings.
Sentences by item
21 items, with every count and a link to each item that changed
Underlined words on a shaded ground are new in FY2014; struck-through words were in FY2013. Sentences that are wholly new or wholly gone are labelled rather than marked.
Item 1A. Risk Factors
58 rewritten, 72 added, 12 removed, 261 unchanged
Our business could be harmed if any of these risks, as well as other risks not currently known to us or that we currently deem [removed: immaterial, materialized.][added: immaterial,_]
In assessing the risks described below, you should also refer to the other information contained in this Form 10-K, including our consolidated financial statements and the related notes and schedules, and other filings with the [removed: SEC._][added: SEC.]
No single customer accounted for more than 10% of our revenue [removed: during the] [added: for] fiscal [removed: year ended July 31, 2013.][added: 2014.]
Seller arrangements are either written or oral agreements typically subject to cancellation by either party upon 30 to 90 [removed: days] [added: days’] notice.
Our expansion into markets outside North America, including recent expansions in Europe, Brazil and the Middle [removed: East,] [added: East] expose us to risks arising from operating in international markets.
In August 2012, we announced our acquisition of a company in the United Arab Emirates (the U.A.E.), in November 2012, we announced our acquisitions of companies in Brazil and [removed: Germany] [added: Germany,] and in June 2013, we announced our acquisition of a company in Spain.
Among other things, we will ultimately deploy our proprietary auction technologies at all of our foreign operations and we cannot predict whether this deployment will be successful [added: or will result in increases in the revenues or operating efficiencies of any acquired companies relative to their historic operating performance.]
Integration of our respective operations, including information technology [removed: integration] and [removed: integration of] financial and administrative functions, may not proceed as [removed: we anticipate] [added: anticipated] and could result in unanticipated costs or expenses [removed: (including unanticipated] [added: such as] capital [removed: expenditures)] [added: expenditures] that could have an adverse effect on our future operating results.
We cannot provide any [removed: assurances] [added: assurance] that we will achieve our business and financial objectives in connection with these acquisitions or our strategic decision to expand our operations internationally.
| • | | adapting to different business cultures and market structures, particularly where we seek to implement our auction model in markets where insurers have historically not played a substantial role in the disposition of salvage vehicles; [added: and] |
In addition, certain acquisitions in the U.K. may be reviewed by the [removed: Office of Fair Trade (OFT) and/or] Competition [removed: Commission] [added: and Markets Authority] (U.K. [removed: Regulators).][added: Regulator).]
If an inquiry is made by [added: the] U.K. [removed: Regulators,] [added: Regulator,] we may be required to demonstrate that our acquisitions will not result, or be expected to result, in a substantial lessening of competition in [removed: a] [added: the] U.K. market.
Although we believe that there will not be a substantial lessening of competition in [removed: a] [added: the] U.K. market, based on our analysis of the relevant U.K. markets, there can be no assurance that the U.K. [removed: Regulators] [added: Regulator] will agree with us if [removed: they decide] [added: it decides] to make an inquiry.
If the U.K. [removed: Regulators determine] [added: Regulator determines] that by our acquisitions of certain assets, there is or likely will be a substantial lessening of competition in [removed: a] [added: the] U.K. market, we could be required to divest some portion of our U.K. assets.
In the event of a divestiture order by the U.K. [removed: Regulators,] [added: Regulator,] the assets disposed may be sold for substantially less than their carrying value.
Our operations and acquisitions in certain foreign areas expose us to political, regulatory, [removed: economic] [added: economic,] and reputational risks.
In many countries outside of the United States, particularly in those with developing economies, it may be common for persons to engage in business practices prohibited by laws and regulations applicable to us, such as the U.S. Foreign Corrupt Practices Act [removed: (FCPA)] [added: (FCPA), U.K. Bribery Act, Brazil Clean Companies Act] or similar local anti-bribery laws.
In addition, our business in North America and the [removed: United Kingdom] [added: U.K.] has been established and grown based largely on our ability to build relationships with insurance carriers.
As we expand into markets outside North America and the U.K., we cannot predict whether markets will readily [removed: adopt] [added: adapt to] our strategy of online auctions of automobiles sourced principally through vehicle insurers.
This type of interruption could prevent us from processing vehicles for our sellers and may prevent us from selling vehicles through our Internet bidding platform, [removed: VB2,] [added: VB3,] which would adversely affect our consolidated results of operations and financial position.
Although we have not been the victim of [removed: cyber attacks] [added: cyber-attacks] or other cyber incidents that have had a material impact on our consolidated operating results or financial position, we have [removed: from time to time] experienced [removed: cyber security breaches such as computer viruses] [added: incidents relating to cyber-attacks in which unauthorized parties attempted to access] and [removed: similar][added: disrupt our online commerce.]
We implemented our online system across all of our North American and U.K. salvage yards beginning in fiscal 2004 and [removed: fiscal] 2008, respectively, and experienced increases in revenues and average selling [removed: prices] [added: prices,] as well as improved operating efficiencies in both markets.
[removed: In considering new markets, we consider the potential] synergies from the implementation of our model based in large part on our experience in North America and the U.K. We cannot predict whether these synergies will also be realized in new markets.
For example, Hurricanes Katrina, Rita and Sandy had, in certain quarters, an adverse effect on our operating results, in part because of yard capacity constraints in the [removed: Gulf Coast area and in the northeastern coast] [added: impacted areas] of the United [removed: States, respectively.][added: States.]
We regularly evaluate our capacity in all our markets [removed: and,] [added: and] where appropriate, seek to increase capacity through the acquisition of additional land and yards.
For example, in fiscal 2013, we acquired [removed: five] new facilities in Sao Paulo, [removed: Brazil, one facility in] [added: Brazil;] the [removed: U.A.E., one facility in] [added: U.A.E.;] Ettlingen, [removed: Germany, one facility in] [added: Germany;] Cordoba, [removed: Spain,] [added: Spain;] and [removed: 43 facilities] in North America.
| • | | maintain the historical revenue and earnings growth rates we have been able to obtain through facility openings and strategic acquisitions; [removed: or] |
| • | | create new vehicle storage facilities that meet our current revenue and profitability [removed: requirements.] [added: requirements; or] |
| • | | the introduction of a similar Internet product by a competitor; [added: and] |
| • | | the ability to obtain necessary permits to [removed: operate; and] [added: operate.] |
Our intellectual property rights include patents relating to our auction [removed: technologies] [added: technologies,] as well as trademarks, trade secrets, copyrights and other intellectual property rights.
As we face increasing competition, the possibility of intellectual property rights claims against us [removed: grows.][added: increases.]
In connection therewith, we are subject to the risks associated with providing trucking services, including inclement weather, disruptions in transportation [removed: infrastructure, availability and price of fuel, any of which could result in an increase in our operating expenses and reduction in our net income.]
Our executive officers, directors and their affiliates beneficially own, in the aggregate, [removed: 19%] [added: 19.2%] of our common stock as of July 31, [removed: 2013.][added: 2014.]
These provisions could also discourage proxy contests and make it more [added: difficult for stockholders to elect directors of their choosing and cause us to take other corporate actions the stockholders desire.]
Jayson Adair, our Chief Executive Officer; [removed: and] Vincent W.
[removed: Mitz,] [added: Franklin,] our [added: Executive Vice] President, [added: United States and Chief Financial Officer,] or if one or more of [removed: them decides] [added: these executives decide] to join a competitor or otherwise compete directly or indirectly with us, we may not be able to successfully manage our business or achieve our business objectives.
Factors such as mild weather conditions can have an adverse effect on our revenues and operating [removed: results] [added: results,] as well as our revenue and earnings growth [removed: rates] [added: rates,] by reducing the available supply of salvage vehicles.
During periods of mild weather conditions, our ability to increase our revenues and improve our operating results and related growth will be increasingly dependent on our ability to obtain additional vehicle sellers and to compete [added: more effectively in the market, each of which is subject to the other risks and uncertainties described in these]
For example, during [removed: the] fiscal [removed: year ended July 31,] 2006 and [removed: during] fiscal [removed: year] 2013, we recognized substantial additional costs associated with [removed: the impact of] Hurricanes [removed: Katrina and] [added: Katrina,] Rita [removed: in Gulf Coast states] and [removed: Hurricane Sandy in the northeastern coast of the United States, respectively.][added: Sandy.]
materialized.
In general, acquisitions increase our sales and profitability although, given the typical size of our acquisitions, most acquisitions will not individually have a material impact on consolidated results of operations and financial position.
We may not always be able to introduce our processes and selling platform to acquired companies due to different operating models in international jurisdictions or other facts.
As a result, the associated benefits of acquisitions may be delayed for years in some international situations.
During this period, the acquisitions may operate at a loss and certain acquisitions, while profitable, may operate at a margin percentage that is below our overall operating margin percentage and, accordingly, have an adverse impact on our consolidated results of operations and financial position.
Hence, the conversion periods vary from weeks to years and cannot be predicted.
We are transitioning various functionality of our third-party enterprise operating system to an internally developed proprietary system, and we may experience difficulties operating our business as we work to develop, design and stabilize this system.
During fiscal 2014, we terminated a contract with KPIT (formerly known as Sparta Consulting, Inc.), whereby KPIT was engaged to design and implement an SAP-based replacement for our existing business operating software that, among other things, would address our international expansion needs.
Following a review of KPIT’s work performed to date, and an assessment of the cost to complete, deployment risk, and other factors, we ceased development of KPIT’s software and are now pursuing an internally developed proprietary solution in its place.
The transition of our enterprise operating system carries certain risks, including the risk of significant design or deployment errors causing disruptions, delays or deficiencies, which may make our website and services unavailable.
We may also implement further and enhanced information systems in the future to accommodate our growth and to provide additional capabilities and functionality.
The implementation of new systems and enhancements is frequently disruptive to the underlying business of an enterprise and can be time-consuming and expensive, increase management responsibilities and divert management attention.
Any disruptions relating to our system enhancements or any problems with the implementation, particularly any disruptions impacting our operations or our ability to accurately report our financial performance on a timely basis during the implementation period, could materially and adversely affect our business.
Even if we do not encounter these material and adverse effects, the implementation of these enhancements may be much more costly than we anticipated.
If we are unable to successfully implement the information systems enhancements as planned, our financial position, results of operations and cash flows could be negatively impacted.
Our success depends on maintaining the integrity of our systems and infrastructure.
As our operations continue to grow in both size and scope, domestically and internationally, we must continue to provide reliable, real-time access to our systems by our customers through improving and upgrading our systems and infrastructure for enhanced products, services, features and functionality.
The transition to our new internal proprietary system will require us to commit substantial financial, operational and technical resources before the volume of business increases, without assurance that the volume of business will increase.
Consumers will not tolerate a service hampered by slow delivery times, unreliable service levels or insufficient capacity, any of which could have a material adverse effect on our business, consolidated financial position and results of operations.
During fiscal 2014, we recognized a $29.1 million impairment charge primarily related to capitalized software development costs, as we ceased development of a third-party enterprise operating system and decided to address our international technology needs through an internally developed proprietary solution.
A failure or breach of our security systems or infrastructure as a result of cyber-attacks could disrupt our business, result in the disclosure or misuse of confidential or proprietary information, damage our reputation, increase our costs and cause losses.
Information security risks for online commerce companies have significantly increased in recent years in part because of the proliferation of new technologies, the use of the Internet and telecommunications technologies to conduct financial transactions, and the increased sophistication and activities of organized crime, hackers, terrorists and other external parties.
These threats may derive from fraud or malice on the part of our employees or third parties, or may result from human error or accidental technological failure.
These threats include cyber-attacks such as computer viruses, malicious code, phishing attacks or information security breaches.
Our operations rely on the secure processing, transmission and storage of confidential, proprietary and other information in our computer systems and networks.
Our customers and other parties in the payments value chain rely on our digital technologies, computer and email systems, software and networks to conduct their operations.
In addition, to access our products and services, our customers and cardholders increasingly use personal smartphones, tablet PCs and other mobile devices that may be beyond our control.
We routinely are subject to cyber-threats and our technologies, systems and networks have been subject to cyber-attacks and we believe we are likely to continue to be a target of such threats and attacks.
These cyber-attacks have caused minor service interruptions, which were promptly addressed and resolved, and our online service was restored to normal business.
However, if one or more of these events continue to occur, it could lead to security breaches of the networks, systems or devices that our customers use to access our products and services, which could result in the unauthorized disclosure, release, gathering, monitoring, misuse, loss or destruction of confidential, proprietary and other information (including account data information) or data security compromises.
This could cause service interruptions, malfunctions or other failures in the physical infrastructure or operations systems that support our businesses and customers (such as
the lack of availability of our value-added systems), as well as the operations of our customers or other third parties.
Continuous cyber-attacks could lead to damage to our reputation with our customers and other parties and the market, additional costs (such as repairing systems, adding new personnel or protection technologies or compliance costs), regulatory penalties, financial losses to both us and our customers and partners and the loss of customers and business opportunities.
If such attacks are not detected immediately, their effect could be compounded.
We have implemented various measures to manage our risks related to system and network disruptions, including but not limited to usage errors by our employees, power outages and catastrophic events such as fires, tornadoes, floods, hurricanes and earthquakes.
In addition, as cyber-threats continue to evolve, we may be required to expend significant additional resources to continue to modify or enhance our protective measures or to investigate and remediate any information security vulnerabilities.
Any of the risks described above could materially adversely affect our consolidated financial position and results of operations.
Our business is exposed to risks associated with online commerce security and credit card fraud.
Consumer concerns over the security of transactions conducted on the Internet or the privacy of users may inhibit the growth of the Internet and online commerce.
To securely transmit confidential information such as customer credit card numbers, we rely on encryption and authentication technology.
or will result in increases in the revenues or operating efficiencies of any acquired companies relative to their historic operating performance.
Consequently, new acquisitions may have an adverse impact on our consolidated gross margin percentages.
If the implementation of our new Enterprise Resource Planning (ERP) system is not executed efficiently and effectively, our business, financial position, and our consolidated operating results could be adversely affected.
We are in the process of converting our primary management information system to a new standard ERP system, which will occur in phases through 2014 and 2015.
In the event this conversion of our primary management information system is not executed efficiently and effectively, the conversion may cause interruptions in our primary management information systems, which may make our website and services unavailable.
In addition, our information and technology systems are vulnerable to damage or interruption from computer viruses, network failures, computer and telecommunications failures, infiltration by unauthorized persons and security breaches, usage errors by our employees, power outages and catastrophic events such as fires, tornadoes, floods, hurricanes and earthquakes.
information technology violations in the ordinary course of business.
We have implemented various measures to manage our risks related to system and network disruptions.
| • | | the impact of our conversion to a new ERP system, if the conversion is not executed efficiently and effectively. |
difficult for stockholders to elect directors of their choosing and cause us to take other corporate actions the stockholders desire.
more effectively in the market, each of which is subject to the other risks and uncertainties described in these sections.
The adoption of similar laws or regulations in other jurisdictions that have the effect of reducing or curtailing our activities abroad could have a material adverse effect on our consolidated results of operations and financial position by reducing the demand for our products and services.
An excerpt. Shown here: 40 of 58 rewritten, 40 of 72 added and all 12 removed. The counts are complete. For every sentence, read Item 1A. Risk Factors in the FY2014 filing and the FY2013 filing.
Item 7. Management’s Discussion and Analysis of Financial Condition and Results of Operations
154 rewritten, 134 added, 122 removed, 165 unchanged
[removed: SPECIAL NOTE] [added: CAUTION] REGARDING FORWARD-LOOKING STATEMENTS
_This Annual Report on Form [added: 10-K for the fiscal year ended July 31, 2014, or this Form] 10-K, including the information incorporated by reference herein, contains forward-looking statements within the meaning of Section 27A of the Securities Act of 1933, as amended (the Securities Act), and Section 21E of the Securities Exchange Act of 1934, as amended (the Exchange Act).
These factors include those listed in Part I, Item [removed: 1A.—“Risk] [added: 1A under the caption entitled “Risk] Factors” [removed: of] [added: in] this Form 10-K and those discussed elsewhere in this Form 10-K.
[added: Unless the context otherwise requires, references in this Form 10-K to “Copart,” the “Company,” “we,” “us,” or “our” refer to Copart, Inc.] We encourage investors to review these factors carefully together with the other matters referred to herein, as well as in the other documents we file with the Securities and Exchange Commission [removed: or SEC.][added: (the SEC).]
We do not undertake to update any forward-looking statement that may be made from time to time by [removed: us] or on [removed: our behalf._][added: behalf of us._]
We are a leading provider of online auctions and vehicle remarketing services in the United States (U.S.), Canada, the United Kingdom [removed: (U.K.),] [added: (U.K.)] and Brazil.
We also provide vehicle remarketing [removed: service] [added: services] in the United Arab Emirates (U.A.E.), Germany and Spain.
We provide vehicle sellers with a full range of services to process and sell vehicles primarily over the Internet through our Virtual Bidding [removed: Second] [added: Third] Generation Internet auction-style sales technology, which we refer to as [removed: VB2.][added: VB3.]
Vehicle sellers consist primarily of insurance [removed: companies] [added: companies,] but also include banks and financial institutions, charities, car dealerships, fleet operators and vehicle rental companies.
The majority of the vehicles sold on behalf of insurance companies are either damaged vehicles deemed a total loss or not economically repairable by the insurance [removed: companies] [added: companies,] or are recovered stolen vehicles for which an insurance settlement with the vehicle owner has already been made.
We offer vehicle sellers a full range of services that expedite each stage of the vehicle sales process, minimize administrative and processing [removed: costs] [added: costs,] and maximize the ultimate sales price.
In the U.S. and Canada (North America), [removed: the U.A.E. and] Brazil [added: and the U.A.E.,] we sell vehicles primarily as an agent and derive revenue primarily from fees paid by vehicle sellers and vehicle [removed: buyers] [added: buyers,] as well as related fees for services such as towing and storage.
[added: _Service and Vehicle Sales Revenue:_] Our [removed: revenues consist] [added: revenue consists] of sales transaction fees charged to vehicle sellers and vehicle buyers, transportation revenue, purchased vehicle revenues, and other remarketing services.
Revenues from sellers are generally generated either on a fixed fee contract [removed: basis] [added: basis,] where we collect a fixed amount for selling each vehicle [added: regardless of the selling price of the vehicle or under our Percentage Incentive Program (PIP), where our fees are generally based on a predetermined percentage of the vehicle sales price.]
Under the [removed: consignment,] [added: consignment] or fixed [removed: fee,] [added: fee] program, we generally charge an additional fee for title processing and special preparation.
[removed: Although sometimes included in the consignment fee, we] [added: We] may also charge additional fees for the cost of transporting the vehicle to our facility, storage of the vehicle, and other incidental [removed: costs.][added: costs included in the consignment fee.]
Under the consignment [removed: programs,] [added: program,] only the fees associated with vehicle processing are recorded in revenue, not the actual sales price (gross proceeds).
Sales transaction fees also include fees charged to vehicle buyers for purchasing vehicles, storage, [removed: loading] [added: loading,] and annual registration.
Purchased vehicle revenue includes the gross sales price of the [removed: vehicle] [added: vehicle,] which we have purchased or are otherwise considered to own and is primarily generated in the U.K. [added: We have certain contracts with insurance companies in which we act as a principal, purchasing vehicles and reselling them for our own account.]
[removed: Operating costs consist] [added: _Operating Costs and Expenses:_ Yard operations consists] primarily of operating personnel (which includes yard management, clerical and yard employees), rent, contract vehicle towing, insurance, fuel, equipment maintenance and repair, and costs of vehicles sold under [added: the] purchase contracts.
[removed: Costs associated with general] [added: General] and administrative expenses consist primarily of executive management, accounting, data processing, sales personnel, human resources, professional fees, research and [removed: development] [added: development,] and marketing expenses.
We believe that these acquisitions and openings strengthen our [removed: coverage] [added: coverage,] as we have facilities located in North America, the U.K., the U.A.E., Germany, [removed: Spain,] [added: Spain] and Brazil, and are able to provide national coverage for our sellers.
The following table sets forth facilities that we have acquired or opened from August 1, [removed: 2010] [added: 2011] through July 31, [removed: 2013:][added: 2014:]
| [removed: Webster,] [added: Webster] New Hampshire | | | | Greenfield | | | | September 2012 | | | | United States | | |
| Dubai, U.A.E. [removed: .] | | | | Acquisition | | | | August 2012 | | | | United Arab Emirates | | |
| * | | Salvage Parent, Inc. conducts business primarily as Quad City Salvage Auction, Crashed Toys, and Desert View Auto Auctions. [removed: Combined, these businesses operate at 39 locations in 14 states.] |
In addition to growth through business acquisitions, we seek to increase revenues and profitability by, among other things, (i) acquiring and developing additional vehicle storage facilities in key markets; [removed: (ii) pursuing national and regional vehicle seller agreements; (iii) expanding our service offerings to sellers and members; and (iv) expanding the application of VB2 into new markets.]
In addition, we implement our pricing structure and auction [removed: procedures] [added: procedures,] and attempt to introduce cost efficiencies at each of our acquired facilities by implementing our operational procedures, integrating our management information [removed: systems] [added: systems,] and redeploying personnel, when necessary.
[removed: Revenues][added: | Service revenues | | | | | 82 | % | | | 81 | % | | | 82 | % | |]
| Service revenues | | | | $ | [added: 958,413 | | | $ |] 849,667 | | | [added: $] | [removed: 81] [added: 757,272] | [added: | | $ | 108,746 | | | | 12.8 |] % | | $ | [removed: 757,272] [added: 92,395] | | | | [removed: 82] [added: 12.2] | % | [added: |]
| Vehicle sales | | | | | [added: 205,076 | | | |] 196,719 | | | | [removed: 19] [added: 166,919] | [added: | | | 8,357 | | | | 4.2 |] % | | | [removed: 166,919] [added: 29,800] | | | | [removed: 18] [added: 17.9] | % | [added: |]
The [removed: growth] [added: increase in service revenues for fiscal 2013 of $92.4 million, or 12.2% as compared to fiscal 2012] came from [added: growth from] (i) our international expansion during the year into Germany, Spain, the [removed: United Arab Emirates] [added: U.A.E.,] and [removed: Brazil] [added: Brazil,] which represented $10.1 million; (ii) the acquisition of Salvage Parent, Inc. which closed on May 30, 2013 and [removed: represents] [added: represented] $8.0 million; (iii) growth in the U.K. of $2.9 million driven by increased revenue per car; and, (iv) growth in North America of $71.4 million.
The increase in volume came from (i) Hurricane Sandy, as the major storm produced an extraordinary volume of flood damaged vehicles; (ii) [removed: market share gains as we saw] [added: increased volumes from] the full year impact of [removed: the] [added: an] exclusive provider contract entered into with a major insurance company at the end of fiscal 2012; and, (iii) what we believe to be a general increase in the overall salvage market as we believe there has been an increase in salvage frequency.
Salvage frequency is the percentage of cars involved in accidents which [removed: the] insurance companies salvage rather than [removed: repair.][added: repair and is driven by the relationship between repairs costs, used car values, and auction returns.]
The increase in salvage frequency [removed: was driven, we believe,] [added: may have been driven] by the decline in used [removed: cars] [added: car] values relative to repair costs.
Used car values are determined by many [removed: factors] [added: factors,] including the used car supply, which is tied directly to new car sales, and the [added: average age of cars on the road.]
New cars sales grew on a year over year basis increasing the supply of used [removed: cars and the average age of a car on the road continued to grow.][added: cars.]
The factors that influence repair costs, used car [removed: pricing] [added: pricing,] and auction returns are many and varied and we cannot predict their movements.
The increase [removed: came] [added: in vehicle sales for fiscal 2013 of $29.8 million, or 17.9% as compared to fiscal 2012 resulted] from (i) our international expansion during the year into Germany, Spain, the [removed: United Arab Emirates] [added: U.A.E.] and Brazil which represented $1.1 million; (ii) the acquisition of Salvage Parent, Inc. which represented $3.2 million; (iii) growth in the U.K. of $13.6 million [removed: and] driven primarily by increased volume from insurance sellers [removed: in the U.K.] and increased open market purchase activity from the general public; and (iv) growth in [added: the] North America of $11.9 million driven primarily by increased open market purchase activity.
The [added: increase in yard operations expense for fiscal 2013 of $80.6 million, or 21.4% as compared to fiscal 2012, was due to the] growth [removed: came] from (i) our international expansion during the year into Germany, Spain, the [removed: United Arab Emirates] [added: U.A.E.,] and Brazil which represented $5.4 million; (ii) the acquisition of Salvage Parent, Inc. which represented $6.4 million; (iii) growth in the U.K. of $1.6 million driven by increased volume associated with general salvage market growth; and (iv) growth in North America of $59.5 million.
_All references to numbered Notes are to specific Notes to our Consolidated Financial Statements included in this Annual Report on Form 10-K and which descriptions are incorporated into the applicable response by reference.
Capitalized terms used, but not defined, in this Management’s Discussion and Analysis of Financial Condition and Results of Operation (“MD&A”) have the same meanings as in such Notes._
We monitor and analyze a number of key financial performance indicators in order to manage our business and evaluate our financial and operating performance.
Such indicators include:
Our revenue is impacted by changes in salvage frequency.
Over the last several years, we believe there has been an increase in overall growth in the salvage market driven by an increase in salvage frequency.
Conversely, increases in used car prices, such as occurred during the most recent recession may decrease salvage frequency and adversely affect our growth rate.
Additionally, the average age of cars on the road continued to increase, growing from 9.6 years in 2002 to 11.4 years in 2014.
These factors, among others, have led to a general decline in used car values while repair costs are generally trending upward.
_Other Income and Expense:_ Other income primarily includes income from the rental of certain real property, foreign exchange rate gains and losses, and gains and losses from the disposal of assets, which will fluctuate based on the nature of these activities each period.
Other expense consists primarily of interest expense on long-term debt.
See Notes to Consolidated Financial Statements, _Note 8 — Long-Term Debt._
_Liquidity and Cash Flows:_ Our primary source of working capital is cash operating results.
The primary source of our liquidity is our cash and cash equivalents.
These factors are further discussed in the Results of Operations and Risk Factors sections of this Annual Report on Form 10-K.
| Seaford, Delaware | | | | Greenfield | | | | July 2014 | | | | United States | | |
| Montreal, Canada | | | | Acquisition | | | | November 2013 | | | | Canada | | |
| Itaquaquecetuba, Brazil | | | | Greenfield | | | | January 2014 | | | | Brazil | | |
(ii) pursuing national and regional vehicle seller agreements; (iii) increasing our service offerings to sellers and members; and (iv) expanding the application of VB3 into new markets.
The following table shows certain data from our consolidated statements of income expressed as a percentage of total service revenues and vehicle sales for fiscal 2014, 2013 and 2012:
| Service revenues and vehicle sales: | | | | | | | | | | | | | | | |
| Vehicle sales | | | | | 18 | % | | | 19 | % | | | 18 | % | |
| Total service revenues and vehicle sales | | | | | 100 | % | | | 100 | % | | | 100 | % | |
| | | | | | | | | | | | | | | | |
| Operating expenses: | | | | | | | | | | | | | | | |
| Yard operations | | | | | 45 | % | | | 44 | % | | | 41 | % | |
| Cost of vehicle sales | | | | | 15 | % | | | 16 | % | | | 15 | % | |
| General and administrative | | | | | 14 | % | | | 13 | % | | | 12 | % | |
| Impairment of long-lived assets | | | | | 3 | % | | | 0 | % | | | 1 | % | |
| Total operating expenses | | | | | 77 | % | | | 73 | % | | | 69 | % | |
| Operating income | | | | | 23 | % | | | 27 | % | | | 31 | % | |
| Other (expense) income: | | | | | 0 | % | | | –1 | % | | | –1 | % | |
| Income before income taxes | | | | | 23 | % | | | 26 | % | | | 30 | % | |
| Income taxes | | | | | 8 | % | | | 9 | % | | | 10 | % | |
| Net income | | | | | 15 | % | | | 17 | % | | | 20 | % | |
Comparison of Fiscal Years ended July 31, 2014, 2013 and 2012
The following table presents a comparison of service revenues and vehicle sales for fiscal 2014, 2013 and 2012:
| | | | | Year Ended July 31, | | | | | | | | | | | | 2014 vs. 2013 | | | | | | | | 2013 vs. 2012 | | | | | | | |
| --- | --- | --- | --- | --- | --- | --- | --- | --- | --- | --- | --- | --- | --- | --- | --- | --- | --- | --- | --- | --- | --- | --- | --- | --- | --- | --- | --- | --- | --- | --- | --- |
| (In thousands) | | | | 2014 | | | | 2013 | | | | 2012 | | | | Change | | | | % Change | | | | Change | | | | % Change | | | |
| --- | --- | --- |
All statements other than statements of historical facts are statements that could be deemed forward-looking statements.
_Although we believe that, based on information currently available to us and our management, the expectations reflected in the forward-looking statements are reasonable, we cannot guarantee future results, levels of activity, performance or achievements.
You should not place undue reliance on these forward-looking statements.
In addition, historical information should not be considered an indicator of future performance._
regardless of the selling price of the vehicle or, under our Percentage Incentive Program, or PIP, where our fees are generally based on a predetermined percentage of the vehicle sales price.
We have experienced significant growth in facilities as we have acquired 55 facilities and established four new facilities since the beginning of fiscal 2011 through July 31, 2013.
| Locations | | | | Acquisition or Greenfield | | | | Date | | | | Geographic Service Area | | |
| --- | --- | --- | --- | --- | --- | --- | --- | --- | --- | --- | --- | --- | --- | --- |
| Homestead, Florida | | | | Greenfield | | | | September 2010 | | | | United States | | |
| Hartford City, Indiana | | | | Acquisition | | | | March 2011 | | | | United States | | |
| Birmingham, England | | | | Acquisition | | | | March 2011 | | | | United Kingdom | | |
_Fiscal 2013 Compared to Fiscal 2012_
The following table sets forth information on revenue by class (in thousands, except percentages):
| | | | | 2013 | | | | Percentage of Revenue | | | | 2012 | | | | Percentage of Revenue | | |
| --- | --- | --- | --- | --- | --- | --- | --- | --- | --- | --- | --- | --- | --- | --- | --- | --- | --- | --- |
| | | | | $ | 1,046,386 | | | | 100 | % | | $ | 924,191 | | | | 100 | % |
Service Revenues. Service revenues were $849.7 million during fiscal 2013 compared to $757.3 million for fiscal 2012, an increase of $92.4 million, or 12.2%, above fiscal 2012.
Trends in salvage frequency are driven by the relationship between repairs costs, used car values and auction returns.
average age of cars on the road.
These factors, among others, lead to a decline in used car values on a year over year basis.
During the same period the average cost to repair a car increased.
Vehicle Sales. We have certain contracts with insurance companies in which we act as a principal, purchasing vehicles and reselling them for our own account.
Vehicle sales revenues were $196.7 million during fiscal 2013 compared to $166.9 million for fiscal 2012, an increase of $29.8 million, or 17.9%, above fiscal 2012.
Yard Operation Expenses. Yard operation expenses, excluding depreciation and amortization and impairment, were $417.5 million during fiscal 2013 compared to $344.6 million for fiscal 2012, an increase of $72.9 million, or 21.2%, above fiscal 2012.
Cost of Vehicle Sales. The cost of vehicles sold was $167.2 million during fiscal 2013 compared to $137.0 million for fiscal 2012, an increase of $30.2 million, or 22.0%.
Included in general and administrative costs were depreciation and amortization expenses which were $16.0 million and $15.1 million for the fiscal years ended July 31, 2013 and 2012, respectively.
Other (Expense) Income. Total other expense was $6.1 million during fiscal 2013 compared to $8.3 million during fiscal 2012, a decrease of $2.2 million, or 26.5%.
Interest expense decreased $1.1 million as a result of principal payments of long-term debt, which is further described in the Notes to Consolidated Financial Statements — _Note 9.
Long-Term Debt_, which is incorporated herein by reference.
Other income, net, increased $0.8 million due primarily to the gain on sale of assets.
_Fiscal 2012 Compared to Fiscal 2011_
| | | | | 2012 | | | | Percentage of Revenue | | | | 2011 | | | | Percentage of Revenue | | |
| Service revenues | | | | $ | 757,272 | | | | 82 | % | | $ | 713,093 | | | | 82 | % |
| Vehicle sales | | | | | 166,919 | | | | 18 | % | | | 159,153 | | | | 18 | % |
| | | | | $ | 924,191 | | | | 100 | % | | $ | 872,246 | | | | 100 | % |
Service Revenues. Service revenues were $757.3 million during fiscal 2012 compared to $713.1 million for fiscal 2011, an increase of $44.2 million, or 6.2%, above fiscal 2011.
Growth in unit volume generated $33.5 million in additional service revenue relative to last year and was driven primarily by growth in the number of units sold on behalf of franchise and independent car dealerships, new and expanded contracts with insurance companies and the migration from the principal model to the agency model in the U.K. Growth in the average revenue per car sold generated $11.5 million in additional revenue over last year and was driven by an increase in the average vehicle auction selling price as over 50% of our service revenue is tied in some manner to the ultimate selling price of the vehicle.
We believe the increase in the average vehicle auction selling price was driven primarily by: (i) the year over year increase in commodity pricing as we believe that commodity pricing, particularly the per ton price for crushed car bodies, has an impact on the ultimate selling price of vehicles sold for scrap and vehicles sold for dismantling; (ii) the general increase in used car pricing, which we believe has an impact on the average selling price of vehicles which are repaired and retailed or purchased by the end user; (iii) the mix of cars sold as the insurance company cars, which on average command a lower average selling price than non-insurance cars, represented a lower portion of all cars sold; and (iv) in the U.K., the beneficial impact of VB2 which we introduced in 2008 and which expands our buyer base by opening vehicle sales to buyers worldwide.
We cannot determine the impact of the movement of these influences as we cannot determine which vehicles are sold to the end user or for scrap, dismantling, retailing or export.
An excerpt. Shown here: 40 of 154 rewritten, 40 of 134 added and 40 of 122 removed. The counts are complete. For every sentence, read Item 7. Management’s Discussion and Analysis of Financial Condition and Results of Operations in the FY2014 filing and the FY2013 filing.
Item 7A. Quantitative and Qualitative Disclosures About Market Risk
14 rewritten, 2 added, 3 removed, 11 unchanged
To achieve this objective in the current uncertain global financial markets, [removed: as of July 31, 2013,] all [removed: of our total] cash and cash equivalents were held in bank deposits and money market [removed: funds.][added: funds as of July 31, 2014.]
As the interest rates on a material portion of our cash and cash equivalents are variable, a change in interest rates earned on our investment portfolio would impact interest income along with cash [removed: flows,] [added: flows] but would not materially impact the fair market value of the related underlying instruments.
As of July 31, [removed: 2013,] [added: 2014,] we held no direct investments in auction rate securities, collateralized debt obligations, structured investment vehicles or mortgaged-backed securities.
Based on the average cash balance held [removed: during the twelve months ended July 31, 2013,] [added: for fiscal 2014,] a [added: hypothetical] 10% [added: adverse] change in our interest yield would not [added: have] materially [removed: affect] [added: affected] our operating results.
Our total borrowings under the Credit Facility were [removed: $368.8] [added: $293.8] million as of July 31, [removed: 2013.][added: 2014.]
A default interest rate applies on all obligations during an event of default under the Credit [removed: Facility,] [added: Facility] at a rate per annum equal to 2.0% above the otherwise applicable interest rate.
International net revenues [removed: result from transactions by our Canadian, U.K., U.A.E., Brazilian, Spain and German operations and] are typically denominated in the local currency of each [removed: country.][added: country and result from transactions by our operations in Canada, the U.K., the U.A.E., Brazil, Spain, and Germany.]
These operations also incur a majority of their expenses in the local currency, the Canadian dollar, the British pound, the U.A.E. dirham, the Brazilian [removed: real] [added: real,] and the Euro.
Our international operations are subject to risks associated with foreign exchange rate [removed: volatility.][added: volatility, which could have a material and adverse impact on our future results.]
[added: A hypothetical 10% adverse change in the value of the] U.S. dollar relative to the Canadian dollar, British pound, U.A.E. dirham, Brazilian real [removed: or Euro in which our revenues] and [removed: profits are denominated] [added: Euro] would [removed: result] [added: have resulted] in [removed: a decrease/increase] [added: an increase] to revenue of [removed: $22.8] [added: $26.3] million for [removed: the twelve months ended July 31, 2013.][added: fiscal 2014.]
Fluctuations in foreign currencies [added: also] create volatility in our [removed: reported] consolidated financial [removed: position] [added: position,] because we are required to remeasure substantially all assets and liabilities held by our foreign subsidiaries at the current exchange rate at the close of the accounting period.
At July 31, [removed: 2013,] [added: 2014,] the cumulative effect of foreign exchange rate fluctuations on our consolidated financial position was a net translation loss of [removed: $45.4] [added: $19.0] million.
This loss [removed: is] [added: was] recognized as an adjustment to stockholders’ equity through accumulated other comprehensive income.
[removed: A 10% strengthening or weakening in the value of the U.S. dollar relative to the Canadian dollar,] British pound, U.A.E. dirham, Brazilian real [removed: or] [added: and] Euro [removed: will] [added: would] not have [removed: a material effect on] [added: materially affected] our consolidated financial position.
If interest rates were to increase by 10%, our interest expense would increase but by an insignificant amount due to the fixed interest rate swaps.
A hypothetical 10% adverse change in the value of the U.S. dollar relative to the Canadian dollar,
Based on the average Credit Facility balance held during the year ended July 31, 2013, a 10% change in our interest rate would not materially affect our operating results.
Accordingly, our future results could be materially adversely impacted by changes in these or other factors.
A hypothetical uniform 10% strengthening or weakening in the value of the
Item 1. Business
61 rewritten, 23 added, 45 removed, 263 unchanged
CopartTM, VB2TM, CopartDirectTM, BID4UTM, [removed: CoPartfinderTM, OutbidTM,] CI & DesignTM, Cars with HeartTM, [added: 1-800 CAR BUYERTM, VB3TM] and [removed: Crashedtoys.comTM,] [added: CrashedToys.comTM,] are trademarks of Copart, Inc. This Form 10-K also includes other trademarks of Copart and of other companies.
We also provide vehicle remarketing services in the United Arab Emirates (U.A.E.), [removed: Germany] [added: Germany,] and Spain.
We provide vehicle sellers with a full range of services to process and sell vehicles primarily over the Internet through our Virtual Bidding [removed: Second] [added: Third] Generation Internet auction-style sales technology, which we refer to as [removed: VB2.][added: VB3.]
Vehicle sellers consist primarily of insurance companies, but also include banks and financial [removed: institutions, charities, car dealerships, fleet operators and vehicle rental companies.]
[added: We sell the vehicles] principally to licensed vehicle dismantlers, rebuilders, repair licensees, used vehicle dealers and exporters and, at certain locations, to the general public.
The majority of the vehicles sold on behalf of insurance companies are either damaged vehicles deemed a total loss or not economically repairable by the insurance [removed: companies] [added: companies,] or are recovered stolen vehicles for which an insurance settlement with the vehicle owner has already been made.
We offer vehicle sellers a full range of services that expedite each stage of the vehicle sales process, minimize administrative and processing [removed: costs] [added: costs,] and maximize the ultimate sales price.
In the U.S. and Canada (North America), [removed: Brazil] [added: Brazil,] and the [removed: U.A.E.] [added: U.A.E.,] we sell vehicles primarily as an agent and derive revenue primarily from fees paid by vehicle sellers and vehicle [removed: buyers] [added: buyers,] as well as related fees for services such as towing and storage.
VB2 [removed: opens] [added: opened] our sales process to registered buyers (whom we refer to as members) anywhere in the world who have Internet access.
We believe the implementation of VB2 [removed: has] increased the pool of available buyers for each sale, which [removed: has] resulted in added competition and an increase in the amount buyers are willing to pay for vehicles.
We also believe that it [removed: has] improved the efficiency of our operations by eliminating the expense and capital requirements associated with live auctions.
For fiscal [removed: 2013,] [added: 2014,] sales of North American vehicles, on a unit basis, to members registered outside the state where the vehicle [removed: is] [added: was] located accounted for [removed: 52.6%] [added: 51.3%] of total vehicles sold; [removed: 29.0%] [added: 28.7%] of vehicles were sold to out of state members and [removed: 23.6%] [added: 22.6%] were sold to out of country members, based on registration.
For fiscal [removed: 2013,] [added: 2014,] sales of U.K. vehicles, on a unit basis, to members registered outside the country where the vehicle [removed: is] [added: was] located accounted for [removed: 19.0%] [added: 18.6%] of total vehicles sold.
For fiscal [removed: 2013, which ended July 31, 2013,] [added: 2014,] our revenues were [removed: $1,046.4 million] [added: $1.2 billion] and our operating income was [removed: $283.0] [added: $274.9] million.
In fiscal 2012, [removed: in North America,] we acquired two new facilities located in Calgary and Edmonton, Canada and we opened two new facilities in Atlanta, Georgia and Burlington, North Carolina.
In fiscal 2013, we acquired five new facilities in Sao Paulo, [removed: Brazil,] [added: Brazil;] one facility in Dubai, United Arab Emirates [removed: (U.A.E.),] [added: (U.A.E.);] one facility in Ettlingen, [removed: Germany,] [added: Germany;] one facility in Cordoba, [removed: Spain,] [added: Spain;] and 43 facilities in North [removed: America] [added: America;] and we opened a new facility in Webster, New Hampshire.
[removed: In North America, sellers] [added: Sellers] generally auction or sell their vehicles on [added: a] consignment [added: basis] either for a fixed fee or a percentage of the sales price.
On [removed: occasion in North America and on a primary basis in the U.K.,] [added: occasion,] companies in our industry will purchase vehicles from the largest segment of sellers, insurance companies, and resell the vehicles for their own account.
While most companies in this industry remarket vehicles through a physical auction, we sell all of our vehicles on our Internet selling [removed: platform, VB2,] [added: platform VB3,] thus eliminating the requirement for buyers to travel to an auction location to participate in the sales process.
The primary buyers of the vehicles are vehicle dismantlers, rebuilders, repair licensees, used vehicle dealers, [removed: exporters] [added: exporters,] and in some states, the general public.
[removed: Typically] [added: Typically,] the damaged vehicle is towed to a storage facility or a vehicle repair facility for temporary storage pending insurance company examination.
The vehicle is then sold either at a live auction or, in our case, on [removed: VB2] [added: VB3] typically within seven days.
Our growth strategy is to increase our revenues and profitability by, among other things, (i) acquiring and developing new facilities in key markets including foreign markets, (ii) pursuing national and regional vehicle supply agreements, (iii) expanding our online auctions and vehicle remarketing service offerings to sellers and members, and (iv) expanding the application of [removed: VB2] [added: VB3] into new markets and to new sellers within the vehicle market.
[removed: By utilizing our existing insurance] company seller relationships, we are able to build new seller relationships and pursue additional supply agreements in existing and new markets.
This includes, for our sellers, real-time access to sales data over the Internet, national coverage, the ability to respond on a national scale and, for our members, the implementation of [removed: VB2] [added: VB3] real-time bidding at all of our facilities, permitting members at any location worldwide to participate in the sales at all of our yards.
Since our inception in 1982, we have expanded from a single facility in Vallejo, California to an integrated network of facilities located in [removed: the United States, Canada,] [added: North America,] the U.K., the U.A.E., Brazil, [removed: Germany] [added: Germany,] and Spain.
| • | | Internet bidding, Internet proxy bidding, and virtual sales powered by [removed: VB2,] [added: VB3,] which enhance the competitive bidding process; |
| • | | [removed: A] [added: a] mobile application, which allows members to search, bid, create [removed: watchlists,] [added: watch lists,] join auctions and bid from anywhere; |
| • | | sophisticated vehicle processing at storage sites, including [removed: ten-view] digital imaging of each vehicle and the scanning of each vehicle’s title and other significant documents such as body shop invoices, all of which are available from us over the Internet; |
| • | | [removed: 2nd] [added: second] chance bidding, which allows the second highest bidder the opportunity to purchase the vehicle for the seller’s current minimum bid after the high bidder declines; and |
| • | | Night Cap sales, which provides an additional opportunity for bidding on vehicles that did not achieve their minimum bid during the virtual sale, counter bidding, or [removed: 2nd] [added: second] chance bidding. |
Since becoming a public company in 1994, we have completed acquisitions of facilities in North America, [added: the] U.K., the U.A.E., Brazil, Germany and Spain.
Our full range of Internet services allows us to expedite each stage of the vehicle sales process and minimizes the administrative and processing costs for [removed: us] [added: us,] as well as our sellers.
In the U.K., we are an authorized treatment [removed: facility, or ATF,] [added: facility] for the disposal of End-of-Life [removed: vehicles, or ELVs.][added: vehicles.]
In the U.K., we perform transportation services through a combination of our fleet of over [removed: 100] [added: 150] vehicles and third-party vehicle transport companies.
An on-site vehicle inspection station provides our insurance company sellers with a central location to inspect potential total loss vehicles, which reduces storage charges that [removed: otherwise] [added: otherwise,] may be incurred at the initial storage or repair facility.
We provide the vehicle seller, at our expense, with transport of the vehicle to our nearest facility, [removed: and] [added: as well as] DMV document and title processing.
We maintain a database of thousands of members in the vehicle dismantling, rebuilding, repair licensee, used vehicle dealer and export industries, as well as the general [removed: public] [added: public,] as we sell directly to the general public at certain locations.
This data enables us to notify [removed: via e-mail] prospective buyers throughout the world [added: via e-mail] of vehicles available for bidding that match their vehicle preferences.
We offer a flexible and unique sales process designed to maximize the sale prices of the vehicles utilizing [removed: VB2.][added: VB3.]
institutions, charities, car dealerships, fleet operators and vehicle rental companies.
In August 2013, we launched our Virtual Bidding Third Generation (VB3), an Internet auction-style sales technology that was built on VB2.
VB3 adds several enhancements which focuses on expanding auction attendance and increasing bidding volume.
VB3 allows non-registered members to view auctions via our website and our mobile application, to attract non-members and grow our membership base.
In addition, VB3 includes a complete, redesigned auction interface, enabling members to fit multiple auction windows on their screen, while simultaneously viewing more vehicle photos and information at the time of live Internet bidding.
In fiscal 2014, we acquired one facility in Montreal, Canada; a salvage vehicle auction business in Brazil, which did not include any facilities; as well as the assets of an online marketing company, which included the rights to hundreds of web domains including www.cashforcars.com and www.cash4cars.com and opened facilities in Seaford, Delaware and Itaquaquecetuba, Brazil.
Our revenues consist of sales transaction fees charged to vehicle sellers and vehicle buyers, transportation revenue, purchased vehicle revenues, and other remarketing services.
Revenues from sellers are generally generated either on a fixed fee contract basis, where we collect a fixed amount for selling each vehicle regardless of the selling price of the vehicle or under our Percentage Incentive Program (PIP), where our fees are generally based on a predetermined percentage of the vehicle sales price.
Under the consignment or fixed fee program, we generally charge an additional fee for title processing and special preparation.
We may also charge additional fees for the cost of transporting the vehicle to our facility, storage of the vehicle, and other incidental costs included in the consignment fee.
Under the consignment program, only the fees associated with vehicle processing are recorded in revenue, not the actual sales price (gross proceeds).
Sales transaction fees also include fees charged to vehicle buyers for purchasing vehicles, storage, loading, and annual registration.
Transportation revenue includes charges to sellers for towing vehicles under certain contracts and towing charges assessed to buyers for delivering vehicles.
Purchased vehicle revenue includes the gross sales price of the vehicle, which we have purchased or are otherwise considered to own and is primarily generated in the U.K.
Operating costs consist primarily of operating personnel (which includes yard management, clerical and yard employees), rent, contract vehicle towing, insurance, fuel, equipment maintenance and repair, and costs of vehicles sold under the purchase contracts.
Costs associated with general and administrative expenses consist primarily of executive management, accounting, data processing, sales personnel, human resources, professional fees, research and development, and marketing expenses.
By utilizing our existing insurance
registered broker who meets the local licensing and permitting requirements.
During fiscal 2014, we terminated a contract with KPIT (formerly known as Sparta Consulting, Inc.), whereby KPIT was engaged to design and implement an SAP-based replacement for our existing business operating software that, among other things, would address our international expansion needs.
Following a review of KPIT’s work performed to date, and an assessment of the cost to complete, deployment risk and other factors, we ceased development of KPIT’s software and are now pursuing an internally developed proprietary solution in its place.
As a result, we recognized a charge of $29.1 million resulting primarily from the impairment of costs previously capitalized in connection with the development of the software.
See Notes to Consolidated Financial Statements, _Capitalized Software Costs_ in _Note 1 — Summary of Significant Accounting Policies._
| 3,250 | | | | 724 | | | | 205 | | | | 4,179 | | |
| --- | --- | --- |
We sell the vehicles
In fiscal 2011, in North America, we acquired one new facility located in Hartford City, Indiana, and we opened a new facility in Homestead, Florida.
In the U.K. we acquired one facility located in Birmingham, England.
The following table sets forth facilities that we have acquired or opened from August 1, 2010 through July 31, 2013:
| Locations | | | | Acquisition or Greenfield | | | | Date | | | | Geographic Service Area | | |
| --- | --- | --- | --- | --- | --- | --- | --- | --- | --- | --- | --- | --- | --- | --- |
| Homestead, Florida | | | | Greenfield | | | | September 2010 | | | | United States | | |
| Hartford City, Indiana | | | | Acquisition | | | | March 2011 | | | | United States | | |
| Atlanta, Georgia | | | | Greenfield | | | | August 2011 | | | | United States | | |
| Burlington, North Carolina | | | | Greenfield | | | | July 2012 | | | | United States | | |
| Webster, New Hampshire | | | | Greenfield | | | | September 2012 | | | | United States | | |
| Gainesville, Georgia | | | | Acquisition | | | | May 2013 | | | | United States | | |
| Davison, Michigan | | | | Acquisition | | | | May 2013 | | | | United States | | |
| Ionia, Michigan | | | | Acquisition | | | | May 2013 | | | | United States | | |
| Kincheloe, Michigan | | | | Acquisition | | | | May 2013 | | | | United States | | |
| Salvage Parent, Inc.* | | | | Acquisition | | | | May 2013 | | | | United States | | |
| Birmingham, England | | | | Acquisition | | | | March 2011 | | | | United Kingdom | | |
| Edmonton, Canada | | | | Acquisition | | | | May 2012 | | | | Canada | | |
| Calgary, Canada | | | | Acquisition | | | | May 2012 | | | | Canada | | |
| Dubai, U.A.E. | | | | Acquisition | | | | August 2012 | | | | United Arab Emirates | | |
| Embu, Brazil | | | | Acquisition | | | | November 2012 | | | | Brazil | | |
| Pirapora, Brazil | | | | Acquisition | | | | November 2012 | | | | Brazil | | |
| Osasco, Brazil | | | | Acquisition | | | | November 2012 | | | | Brazil | | |
| Castelo Branco, Brazil | | | | Acquisition | | | | November 2012 | | | | Brazil | | |
| Vila Jaguara, Brazil | | | | Acquisition | | | | November 2012 | | | | Brazil | | |
| Ettlingen, Germany | | | | Acquisition | | | | November 2012 | | | | Germany | | |
| Cordoba, Spain | | | | Acquisition | | | | June 2013 | | | | Spain | | |
| * | | Salvage Parent, Inc. conducts business primarily as Quad City Salvage Auction, Crashed Toys, and Desert View Auto Auctions. Combined, these businesses operate at 39 locations in 14 states. |
| • | | CoPartfinder, our Internet-based used vehicle parts locator that provides vehicle dismantlers with greater resale opportunities for their purchases; |
Preliminary bidding
_CoPartfinder_
CoPartfinder is our unique Internet “search engine” that enables users to locate used vehicle parts quickly and efficiently.
CoPartfinder is accessible by the public through a Copart-sponsored website.
CoPartfinder lists vehicles recently sold through VB2 and identifies certain purchasers.
This allows vehicle dismantlers and other resellers to streamline their parts sale process and access a large pool of potential buyers.
Parts buyers can use CoPartfinder to search for specific vehicle makes and models and view digital images of vehicles that meet their requirements.
Once a specific parts seller is identified for a specific part requirement, buyers have the option to call, fax, or e-mail the dismantler/seller.
We believe that CoPartfinder provides an incentive for vehicle dismantlers to purchase their salvage vehicles through our sales process.
We may, when appropriate, provide
An excerpt. Shown here: 40 of 61 rewritten, all 23 added and 40 of 45 removed. The counts are complete. For every sentence, read Item 1. Business in the FY2014 filing and the FY2013 filing.
Item 3. Legal Proceedings
0 rewritten, 38 added, 7 removed, 2 unchanged
We are subject to threats of litigation and are involved in actual litigation and damage claims arising in the ordinary course of business, such as actions related to injuries, property damage, and handling or disposal of vehicles.
The material pending legal proceedings to which we are party to, or of which our property is subject to include the following matters.
On November 1, 2013, we filed suit against Sparta Consulting, Inc. (now known as “KPIT”) in the 44th Judicial District Court of Dallas County, Texas, alleging fraud, fraudulent inducement, and/or promissory fraud, negligent misrepresentation, unfair business practices pursuant to California Business and Professions Code § 17200, breach of contract, declaratory judgment, and attorney’s fees.
We seek compensatory and exemplary damages, disgorgement of amounts paid, attorney’s fees, pre- and post-judgment interest, costs of suit, and a judicial declaration of the parties’ rights, duties, and obligations under the Implementation Services Agreement dated October 6, 2011.
The suit arises out of our September 17, 2013 decision to terminate the Implementation Services Agreement, under which KPIT was to design, implement, and deliver a customized replacement enterprise resource planning system for us.
On January 2, 2014, KPIT removed this suit to the United States District Court for the Northern District of Texas.
On August 11, 2014, the Northern District of Texas transferred the suit to the United States District Court for the Eastern District of California for convenience.
On January 8, 2014, KPIT filed suit against us in the United States District Court for the Eastern District of California, alleging breach of contract, promissory estoppel, breach of the implied covenant of good faith and fair dealing, account stated, quantum meruit, unjust enrichment, and declaratory relief.
KPIT
seeks compensatory and exemplary damages, prejudgment interest, costs of suit, and a judicial declaration of the parties’ rights, duties, and obligations under the Implementation Services Agreement.
We are zealously pursuing our claim for damages, and vigorously defending KPIT’s claim for damages.
In connection with our response to Hurricane Sandy, we entered into various short-term lease/license agreements with certain land owners in New York and New Jersey to marshal and store storm damaged vehicles until they were sold.
In November and December 2012, various actions were commenced against us and land owners.
In New York, actions were brought by the Town of Southampton, the County of Suffolk, the Town of Brookhaven, and the New York State Department of Environmental Conservation (the DEC), seeking declaratory and injunctive relief as well as civil penalties, in connection with alleged violations of local zoning, land use and environmental regulations.
The claims by the various plaintiffs have been mitigated with the removal of vehicles from the various short-term storage locations in New York.
The claims brought by the DEC have all been resolved through entering into consent orders, which included administrative payments in amounts that are not material to us, and restoration of premises, which we are undertaking.
We are defending the remaining New York claim and believe we have bona fide legal defenses.
We have provided for costs relating to these matters when a loss is probable and the amount can be reasonably estimated.
The effect of the outcome of these matters on our future consolidated results of operations and cash flows cannot be predicted because any such effect depends on future results of operations and the amount and timing of the resolution of such matters.
We believe that any ultimate liability will not have a material effect on our consolidated results of operations, financial position or cash flows.
However, the amount of the liabilities associated with these claims, if any, cannot be determined with certainty.
We maintain insurance which may or may not provide coverage for claims made against us.
There is no assurance that there will be insurance coverage available when and if needed.
Additionally, the insurance that we carry requires that we pay for costs and/or claims exposure up to the amount of the insurance deductibles negotiated when the insurance is purchased.
_Governmental Proceedings_
The Georgia Department of Revenue, or DOR, conducted a sales and use tax audit of our operations in Georgia for the period from January 1, 2007 through June 30, 2011.
As a result of the audit, the DOR issued a notice of proposed assessment for uncollected sales taxes in which it asserted that we failed to remit sales taxes totaling $73.8 million, including penalties and interest.
In issuing the notice of proposed assessment, the DOR stated its policy position that sales for resale to non-U.S. registered resellers are subject to Georgia sales and use tax.
We have engaged a Georgia law firm and outside tax advisors to review the conduct of our business operations in Georgia, the notice of assessment, and the DOR’s policy position.
In particular, our outside legal counsel has provided us an opinion that the sales for resale to non-U.S. registered resellers should not be subject to Georgia sales and use tax.
In rendering its opinion, our counsel noted that non-U.S. registered resellers are unable to comply strictly with technical requirements for a Georgia certificate of exemption but concluded that our sales for resale to non-U.S. registered resellers should not be subject to Georgia sales and use tax notwithstanding this technical inability to comply.
Based on the opinion from our outside law firm and advice from outside tax advisors, we have adequately provided for the payment of a possible assessment in our consolidated financial statements.
We believe we have strong defenses to the DOR’s notice of proposed assessment and intend to defend this matter.
We have filed a request for protest or administrative appeal with the State of Georgia.
There can be no assurance that this matter will be resolved in our favor or that we will not ultimately be required to make a substantial payment to the Georgia DOR.
We understand that Georgia law and DOR regulations are ambiguous on many of the points at issue in the audit, and litigating and defending the matter in Georgia could be expensive and time-consuming and result in substantial management distraction.
If the matter were to
be resolved in a manner adverse to us, it could have a material adverse effect on our consolidated results of operations, financial position, and cash flows.
| --- | --- | --- |
Information with respect to this item may be found in the Notes to Consolidated Financial Statements — _Note 15.
Commitments and Contingencies_, which is incorporated herein by reference.
Item 4.
_Mine Safety Disclosure_
Not applicable.
PART II
Cover and table of contents
23 rewritten, 52 added, 2 removed, 48 unchanged
| [removed: \[X\]] [added: x] | | ANNUAL REPORT PURSUANT TO SECTION 13 OR 15(d) OF THE SECURITIES EXCHANGE ACT OF 1934 For the fiscal year [removed: ended:] [added: ended] July 31, [removed: 2013] [added: 2014] |
Commission file [removed: number 0-23255][added: number: 0-23255]
| [removed: (Exact] [added: (Exact] name of registrant as specified in its [removed: charter)] [added: charter)] | | | | | | | |
| 14185 Dallas Parkway, Suite 300, Dallas, Texas _(Address of principal executive [removed: offices)_] [added: offices_)] | | | | 75254 _(Zip code)_ | | | |
| Registrant’s telephone number, including area [removed: code:] [added: code] (972) 391-5000 Securities registered pursuant to Section 12(b) of the Act: | | | | | | | |
Yes [removed: \[X\]] [added: x] No o
Yes o No [removed: \[X\]][added: x]
| Large Accelerated Filer [removed: \[X\]] [added: x] | | | | Accelerated Filer o | | | | Non-Accelerated Filer o | | | | Smaller Reporting Company o | | |
Yes [removed: o] [added: x] No [removed: þ][added: o]
The aggregate market value of the voting and non-voting Common Stock held by non-affiliates of the registrant as of January 31, [removed: 2013] [added: 2014] (the last business day of the registrant’s most recently completed second fiscal quarter) was [removed: $3,808,774,974] [added: $3,208,078,100] based upon the closing sales price reported for such date on the NASDAQ Global Select Market (formerly the NASDAQ National Market).
Portions of our definitive Proxy Statement for the [removed: 2013] [added: 2014] Annual Meeting of Stockholders, also referred to in this Annual Report on Form 10-K as our Proxy Statement, which will be filed with the Securities and Exchange Commission, or SEC, pursuant to Regulation 14A within 120 days after the registrant’s fiscal year end of July 31, [removed: 2013,] [added: 2014,] have been incorporated by reference in Part III hereof.
[removed: Annual] [added: Index to the Annual] Report on Form 10-K
[removed: for] [added: For] the Fiscal Year Ended July 31, [removed: 2013][added: 2014]
| | | | | | | | | Page [added: Number] | | |
| | | | | Industry Overview | | | | | [removed: 3] [added: 4] | |
| | | | | Our Service [removed: Offerings] [added: Offerings.] | | | | | 7 | |
| | | | | Members | | | | | [removed: 11] [added: 10] | |
| | | | | Employees | | | | | [removed: 12] [added: 11] | |
| | | | | Seasonality | | | | | [removed: 13] [added: 12] | |
Risk Factors [removed: 13][added: 12]
Unresolved Staff Comments [removed: 25][added: 27]
Properties [removed: 25][added: 27]
Legal Proceedings [removed: 25][added: 27]
10-K 1 d31671.htm 10-K
Yes x No o
Yes o No x
As of September 29, 2014, 126,244,452 shares of the registrant’s common stock were outstanding.
Copart, Inc.
Item 4.
Mine Safety Disclosures 29
| PART II | | | | | | | | | 30 | |
Item 5.
Market for Registrant’s Common Equity, Related Stockholder Matters and Issuer Purchases of Equity Securities 30
Item 6.
Selected Financial Data 33
Item 7.
Management’s Discussion and Analysis of Financial Condition and Results of Operations 34
Item 7A.
Quantitative and Qualitative Disclosures About Market Risk 50
Item 8.
Financial Statements and Supplementary Data 51
Item 9.
Changes in and Disagreements with Accountants on Accounting and Financial Disclosure 51
Item 9A.
Controls and Procedures 51
Item 9B.
Other Information 54
| PART III | | | | | | | | | 55 | |
Item 10.
Directors, Executive Officers of the Registrant and Corporate Governance 55
Item 11.
Executive Compensation 55
Item 12.
Security Ownership of Certain Beneficial Owners and Management and Related Stockholder Matters 55
Item 13.
Certain Relationships and Related Transactions, and Director Independence 55
Item 14.
Principal Accountant Fees and Services 55
| PART IV | | | | | | | | | 56 | |
Item 15.
Exhibits and Financial Statement Schedules 56
| Signatures | | | | | | | | | 57 | |
10-K 1 d30512.htm 10-K
At September 30, 2013, registrant had 125,515,179 outstanding shares of Common Stock.
An excerpt. Shown here: all 23 rewritten, 40 of 52 added and all 2 removed. The counts are complete. For every sentence, read Cover and table of contents in the FY2014 filing and the FY2013 filing.
Item 2. Properties
3 rewritten, 0 added, 0 removed, 7 unchanged
This facility consists of approximately [removed: 53,000] [added: 70,000] square feet of office space under a lease which expires in fiscal 2024.
In the U.S., we [removed: have] [added: own or lease] facilities in every state except [removed: Delaware,] North Dakota, Rhode Island, South Dakota, Vermont and Wyoming.
In Canada, we [removed: have] [added: own or lease] facilities in the provinces of [removed: Ontario] [added: Ontario, Quebec] and Alberta.
Item 4. Mine Safety Disclosure
1 rewritten, 2 added, 43 removed, 0 unchanged
[removed: | PART II | | | | | | | | | 26 | |][added: PART II]
| --- | --- | --- |
Not applicable.
| | | | | | | | | | | |
Item 5.
Market for Registrant’s Common Equity, Related Stockholder Matters and Issuer Purchases of Equity Securities 26
Item 6.
Selected Financial Data 29
Item 7.
Management’s Discussion and Analysis of Financial Condition and Results of Operations 30
Item 7A.
Quantitative and Qualitative Disclosures About Market Risk 45
Item 8.
Financial Statements and Supplementary Data 46
Item 9.
Changes in and Disagreements With Accountants on Accounting and Financial Disclosure 46
Item 9A.
Controls and Procedures 46
Item 9B.
Other Information 49
| PART III | | | | | | | | | 50 | |
Item 10.
Directors, Executive Officers of the Registrant and Corporate Governance 50
Item 11.
Executive Compensation 50
Item 12.
Security Ownership of Certain Beneficial Owners and Management and Related Stockholder Matters 51
Item 13.
Certain Relationships and Related Transactions, and Director Independence 51
Item 14.
Principal Accountant Fees and Services 51
| PART IV | | | | | | | | | 52 | |
Item 15.
Exhibits and Financial Statement Schedules 52
PART I
SPECIAL NOTE REGARDING FORWARD-LOOKING STATEMENTS
_This Annual Report on Form 10-K for the fiscal year ended July 31, 2013, or this Form 10-K, including the information incorporated by reference herein, contains forward-looking statements within the meaning of Section 27A of the Securities Act of 1933, as amended (the Securities Act), and Section 21E of the Securities Exchange Act of 1934, as amended (the Exchange Act).
In some cases, you can identify forward-looking statements by terms such as “may,” “will,” “should,” “expect,” “plan,” “intend,” “forecast,” “anticipate,” “believe,” “estimate,” “predict,” “potential,” “continue” or the negative of these terms or other comparable terminology.
The forward-looking statements contained in this Form 10-K involve known and unknown risks, uncertainties and situations that may cause our or our industry’s actual results, level of activity, performance or achievements to be materially different from any future results, levels of activity, performance or achievements expressed or implied by these statements.
These forward-looking statements are made in reliance upon the safe harbor provision of the Private Securities Litigation Reform Act of 1995.
These factors include those listed in Part I, Item 1A under the caption entitled “Risk Factors” in this Form 10-K and those discussed elsewhere in this Form 10-K.
Unless the context otherwise requires, references in this Form 10-K to “Copart,” the “Company,” “we,” “us,” or “our” refer to Copart, Inc. We encourage investors to review these factors carefully together with the other matters referred to herein, as well as in the other documents we file with the Securities and Exchange Commission (the SEC).
We may from time to time make additional written and oral forward-looking statements, including statements contained in our filings with the SEC.
An excerpt. Shown here: all 1 rewritten, all 2 added and 40 of 43 removed. The counts are complete. For every sentence, read Item 4. Mine Safety Disclosure in the FY2014 filing and the FY2013 filing.
Item 5. Market for Registrant’s Common Equity, Related Stockholder Matters and Issuer Purchases of Equity Securities
32 rewritten, 14 added, 23 removed, 40 unchanged
As of July 31, [removed: 2013,] [added: 2014,] we had [removed: 1,415] [added: 1,225] stockholders of record.
On July 31, [removed: 2013,] [added: 2014,] the last reported sale price of our common stock on the NASDAQ Global Select Market was [removed: $32.51] [added: $33.38] per share.
| [removed: Fiscal Year] [added: _Fiscal] 2013 [added: _] | | | | [removed: High] | | | | [removed: Low] | | | [added: | | | | | | | |]
| Fourth Quarter | | | | [added: $] | [added: 37.15 | | | $ | 33.37 | | | $ |] 38.26 | | | [added: $] | 30.11 | | [added: |]
| Third Quarter | | | | [added: $] | [added: 37.54 | | | $ | 32.59 | | | $ |] 36.93 | | | [added: $] | 31.30 | | [added: |]
| Second Quarter | | | | [added: $] | [added: 36.93 | | | $ | 31.08 | | | $ |] 37.47 | | | [added: $] | 28.39 | | [added: |]
| First Quarter | | | | [added: $] | [added: 34.71 | | | $ | 30.38 | | | $ |] 28.98 | | | [added: $] | 23.28 | | [added: |]
| [removed: Fiscal Year 2012] | | | | High | | | | Low | | | [added: | High | | | | Low | | | |]
For [removed: the] fiscal [removed: year ended July 31,] 2013, we repurchased 500,000 shares of our common stock at a weighted average price of $27.77.
For [removed: the] fiscal [removed: year ended July 31,] 2012, we repurchased 8,880,708 shares of our common stock at a weighted average price of $22.51.
As of July 31, [removed: 2013,] [added: 2014,] the total number of shares repurchased under the program was 50,286,782 and 47,713,218 shares were available for repurchase under our program.
[added: The] shares accepted for purchase are comprised of the 21,052,630 shares we offered to purchase and an additional 3,291,546 shares purchased pursuant to our right to purchase additional shares up to 2% of our outstanding shares.
The dilutive earnings per share impact of all repurchased shares on the weighted average number of common shares outstanding for [removed: the year ended July 31, 2013] [added: fiscal 2014] is less than $0.01.
| Period | | | | Total Number of Shares [removed: Purchased] | | | | Average Price Paid Per Share | | | | Total Number of Shares Purchased as Part of Publicly Announced Program | | | | Maximum Number of Shares That May Yet [removed: Be] [added: be] Purchased Under the Program | | |
| Third Quarter | | | | | — | | | [added: $] | — | | | | — | | | | 51,013,218 | |
| Second Quarter | | | | | — | | | [added: $] | — | | | | — | | | | 47,713,218 | |
| Third Quarter | | | | | — | | | [added: $] | — | | | | — | | | | 47,713,218 | |
| May 1, [removed: 2013] [added: 2014] through May 31, [removed: 2013] [added: 2014] | | | | | — | | | [added: $] | — | | | | — | | | | 47,713,218 | |
| June 1, [removed: 2013] [added: 2014] through June 30, [removed: 2013] [added: 2014] | | | | | — | | | [added: $] | — | | | | — | | | | 47,713,218 | |
| July 1, [removed: 2013] [added: 2014] through July 31, [removed: 2013] [added: 2014] | | | | | — | | | [added: $] | — | | | | — | | | | 47,713,218 | |
In the [removed: second, third] [added: first, second] and [removed: fourth] [added: third] quarters of fiscal [removed: year 2011] [added: 2012 and the second quarter of fiscal 2013] certain executive officers exercised stock options through cashless exercises.
In the [removed: first, second and third quarters of fiscal year 2012 and the second] [added: first] quarter of fiscal [removed: year 2013] [added: 2014,] certain [removed: executive officers] [added: employees] exercised stock options through cashless exercises.
We remitted [added: $0.1 million,] $0.6 million, [added: and] $2.6 million [removed: and $4.2 million, in fiscal 2013, 2012] [added: as of July 31, 2014, 2013] and [removed: 2011,] [added: 2012,] respectively, to the proper taxing authorities in satisfaction of the employees’ minimum statutory withholding requirements.
The [removed: exercises] [added: exercised stock options] are summarized in the following table:
| Period | | | | Options Exercised | | | | Exercise Price | | | | Shares Net Settled for Exercise | | | | Shares Withheld for Taxes(1) | | | | Net Shares to Employee | | | | Share Price for Withholding | | | | Tax Withholding (in [removed: 000’s)] [added: 000s)] | | |
| FY 2012—Q2 | | | | | 20,000 | | | [removed: $] | 9.00 | | | | 7,506 | | | | 4,584 | | | | 7,910 | | | [removed: $] | 23.98 | | | [removed: $] | 110 | |
| FY 2012—Q3 | | | | | 322,520 | | | [removed: $] | 10.74 | | | | 131,299 | | | | 85,683 | | | | 105,538 | | | [removed: $] | 26.38 | | | [removed: $] | 2,260 | |
| FY 2013—Q2 | | | | | 73,228 | | | [removed: $] | 8.89 | | | | 18,127 | | | | 17,461 | | | | 37,640 | | | [removed: $] | 35.91 | | | [removed: $] | 627 | |
There were no issuances of unregistered securities in the [removed: quarter] [added: year] ended July 31, [removed: 2013.][added: 2014.]
The following is a line graph comparing the cumulative total return to stockholders of our common stock at July 31, [removed: 2013] [added: 2014] since July 31, [removed: 2008,] [added: 2009,] to the cumulative total return over such period of (i) the NASDAQ Composite Index, (ii) the NASDAQ Industrial Index, and (iii) the NASDAQ Q-50 (NXTQ).
[removed: 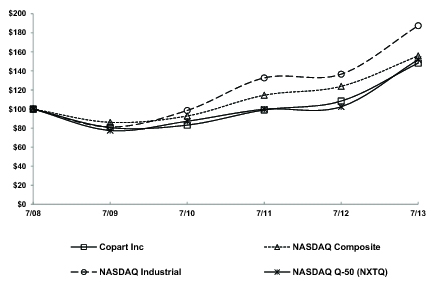][added: 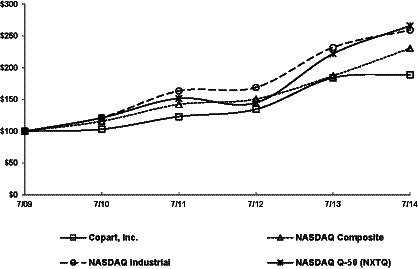]
| * | | Assumes that $100.00 was invested on July 31, [removed: 2008] [added: 2009] in our common stock, in the NASDAQ Composite Index, the NASDAQ Industrial Index and the NASDAQ Q-50 (NXTQ), and that all dividends were reinvested. No dividends have been declared on our common stock. Stockholder returns over the indicated period should not be considered indicative of future stockholder returns. |
As of July 31, 2014, there were 126,143,366 shares outstanding.
| | | | | 2014 | | | | | | | | 2013 | | | | | | | |
| --- | --- | --- | --- | --- | --- | --- | --- | --- | --- | --- | --- | --- | --- | --- | --- | --- | --- | --- | --- |
For fiscal 2014, we did not repurchase any shares of our common stock.
| Fourth Quarter | | | | | — | | | $ | — | | | | — | | | | 47,713,218 | |
| _Fiscal 2014 _ | | | | | | | | | | | | | | | | | | |
| FY 2014—Q1 | | | | | 14,000 | | | | 16.43 | | | | 7,241 | | | | 2,519 | | | | 4,240 | | | | 31.77 | | | | 80 | |
| | | | | Fiscal Year Ended July 31, | | | | | | | | | | | | | | | | | | | | | | | |
| --- | --- | --- | --- | --- | --- | --- | --- | --- | --- | --- | --- | --- | --- | --- | --- | --- | --- | --- | --- | --- | --- | --- | --- | --- | --- | --- | --- |
| | | | | 2009 | | | | 2010 | | | | 2011 | | | | 2012 | | | | 2013 | | | | 2014 | | | |
| Copart, Inc. | | | | $ | 100.00 | | | $ | 103.20 | | | $ | 123.05 | | | $ | 134.58 | | | $ | 184.14 | | | $ | 189.07 | | |
| NASDAQ Composite | | | | $ | 100.00 | | | $ | 115.74 | | | $ | 142.18 | | | $ | 150.64 | | | $ | 187.27 | | | $ | 230.59 | | |
| NASDAQ Industrial | | | | $ | 100.00 | | | $ | 121.57 | | | $ | 163.50 | | | $ | 169.08 | | | $ | 231.92 | | | $ | 259.26 | | |
| NASDAQ Q-50 (NXTQ) | | | | $ | 100.00 | | | $ | 121.12 | | | $ | 151.75 | | | $ | 144.97 | | | $ | 221.92 | | | $ | 266.02 | | |
As of July 31, 2013, there were 125,494,995 shares outstanding.
| --- | --- | --- | --- | --- | --- | --- | --- | --- | --- | --- |
| Fourth Quarter | | | | | 27.88 | | | | 22.59 | |
| Third Quarter | | | | | 26.84 | | | | 22.58 | |
| Second Quarter | | | | | 24.55 | | | | 20.82 | |
| First Quarter | | | | | 22.55 | | | | 17.88 | |
For the fiscal year ended July 31, 2011, we repurchased 13,364,634 shares of our common stock at a weighted average price of $20.42.
The
| _Fiscal 2011 _ | | | | | | | | | | | | | | | | | | |
| First Quarter | | | | | 4,499,652 | | | $ | 16.83 | | | | 4,499,652 | | | | 25,958,908 | |
| Second Quarter | | | | | 24,344,176 | | | $ | 19.00 | | | | — | | | | 25,958,908 | |
| Third Quarter | | | | | 2,883,084 | | | $ | 21.52 | | | | 2,883,084 | | | | 23,075,824 | |
| Fourth Quarter | | | | | 5,981,898 | | | $ | 22.59 | | | | 5,981,898 | | | | 17,093,926 | |
| _Fiscal 2013_ | | | | | | | | | | | | | | | | | | |
| FY 2011—Q2 | | | | | 177,500 | | | $ | 8.47 | | | | 76,050 | | | | 37,834 | | | | 63,616 | | | $ | 19.76 | | | $ | 748 | |
| FY 2011—Q3 | | | | | 548,334 | | | $ | 11.02 | | | | 295,496 | | | | 118,032 | | | | 134,806 | | | $ | 20.40 | | | $ | 2,408 | |
| FY 2011—Q4 | | | | | 180,000 | | | $ | 9.48 | | | | 76,396 | | | | 48,366 | | | | 55,238 | | | $ | 22.33 | | | $ | 1,080 | |
| | | | | 7/08 | | | | 7/09 | | | | 7/10 | | | | 7/11 | | | | 7/12 | | | | 7/13 | | |
| --- | --- | --- | --- | --- | --- | --- | --- | --- | --- | --- | --- | --- | --- | --- | --- | --- | --- | --- | --- | --- | --- | --- | --- | --- | --- | --- |
| Copart, Inc. | | | | $ | 100.00 | | | $ | 80.51 | | | $ | 83.08 | | | $ | 99.07 | | | $ | 108.34 | | | $ | 148.24 | |
| NASDAQ Composite | | | | $ | 100.00 | | | $ | 86.02 | | | $ | 92.70 | | | $ | 114.49 | | | $ | 123.84 | | | $ | 155.80 | |
| NASDAQ Industrial | | | | $ | 100.00 | | | $ | 81.18 | | | $ | 98.49 | | | $ | 132.68 | | | $ | 136.59 | | | $ | 187.49 | |
| NASDAQ Q-50 (NXTQ) | | | | $ | 100.00 | | | $ | 77.47 | | | $ | 87.18 | | | $ | 99.77 | | | $ | 102.40 | | | $ | 151.88 | |
Item 6. Selected Financial Data
19 rewritten, 1 added, 10 removed, 5 unchanged
[removed: You should read the] [added: The] following selected consolidated financial data [added: should be read] in conjunction with [added: our] “Management’s Discussion and Analysis of Financial Condition and Results of Operations” [added: in Item 7.,] and [removed: the Company’s consolidated financial statements] [added: “Financial Statements] and [removed: the related notes appearing elsewhere] [added: Supplementary Data”] in [removed: this Annual Report on Form 10-K.][added: Item 8.]
[removed: The] [added: Our] historical results [added: of operations] are not necessarily indicative of [removed: the] results [added: of operations] to be expected [removed: in] [added: for] any future period.
| | | | | [removed: 2013] [added: 2014] | | | | [removed: 2012] [added: 2013] | | | | [removed: 2011*] [added: 2012] | | | | [removed: 2010] [added: 2011*] | | | | [removed: 2009] [added: 2010] | | | |
| [removed: | | | | (in] [added: (In] thousands, except per share) | | | | | | | | | | | | | | | | | | | | [added: | | | |]
| Revenues | | | | $ | [removed: 1,046,386] [added: 1,163,489] | | | $ | [removed: 924,191] [added: 1,046,386] | | | $ | [removed: 872,246] [added: 924,191] | | | $ | [removed: 772,879] [added: 872,246] | | | $ | [removed: 743,082] [added: 772,879] | | |
| Operating income | | | | | [removed: 282,992] [added: 274,934] | | | | [removed: 286,353] [added: 282,992] | | | | [removed: 265,290] [added: 286,353] | | | | [removed: 239,070] [added: 265,290] | | | | [removed: 225,325] [added: 239,070] | | |
| Income from continuing operations before income taxes | | | | | [removed: 276,872] [added: 270,035] | | | | [removed: 278,056] [added: 276,872] | | | | [removed: 263,877] [added: 278,056] | | | | [removed: 239,495] [added: 263,877] | | | | [removed: 227,732] [added: 239,495] | | |
| Income tax expense | | | | | [removed: (96,847] [added: (91,348] | ) | | | [removed: (95,937] [added: (96,847] | ) | | | [removed: (97,502] [added: (95,937] | ) | | | [removed: (87,868] [added: (97,502] | ) | | | [removed: (88,186] [added: (87,868] | ) | |
| [removed: Income from continuing operations] [added: Net income] | | | | [added: $] | [removed: 180,025] [added: 178,687] | | | [added: $] | [removed: 182,119] [added: 180,025] | | | [added: $] | [removed: 166,375] [added: 182,119] | | | [added: $] | [removed: 151,627] [added: 166,375] | | | [added: $] | [removed: 139,546] [added: 151,627] | | |
| [removed: Net] [added: Basic net] income per [added: common] share | | | | $ | [removed: 1.44] [added: 1.42] | | | $ | [removed: 1.42] [added: 1.44] | | | $ | [removed: 1.10] [added: 1.42] | | | $ | [removed: 0.90] [added: 1.10] | | | $ | [removed: 0.85] [added: 0.90] | | |
| Weighted average shares | | | | | [removed: 124,912] [added: 125,693] | | | | [removed: 128,120] [added: 124,912] | | | | [removed: 151,298] [added: 128,120] | | | | [removed: 168,330] [added: 151,298] | | | | [removed: 167,074] [added: 168,330] | | |
| [removed: Net] [added: Diluted net] income per [added: common] share | | | | $ | [removed: 1.39] [added: 1.36] | | | $ | 1.39 | | | $ | [removed: 1.08] [added: 1.39] | | | $ | [removed: 0.89] [added: 1.08] | | | $ | [removed: 0.83] [added: 0.89] | | |
| Weighted average shares | | | | | [removed: 129,781] [added: 131,230] | | | | [removed: 131,428] [added: 129,781] | | | | [removed: 153,352] [added: 131,428] | | | | [removed: 170,054] [added: 153,352] | | | | [removed: 169,860] [added: 170,054] | | |
| [removed: Cash,] [added: Cash and] cash equivalents [removed: and short-term investments] | | | | $ | [removed: 63,631] [added: 158,668] | | | $ | [removed: 140,112] [added: 63,631] | | | $ | [removed: 74,009] [added: 140,112] | | | $ | [removed: 268,188] [added: 74,009] | | | $ | [removed: 162,691] [added: 268,188] | | |
| Working capital | | | | | [removed: 67,893] [added: 168,007] | | | | [removed: 134,908] [added: 67,893] | | | | [removed: 75,242] [added: 134,908] | | | | [removed: 330,191] [added: 75,242] | | | | [removed: 212,349] [added: 330,191] | | |
| Total assets | | | | | [removed: 1,334,481] [added: 1,506,804] | | | | [removed: 1,154,000] [added: 1,334,481] | | | | [removed: 1,084,436] [added: 1,154,000] | | | | [removed: 1,228,812] [added: 1,084,436] | | | | [removed: 1,058,032] [added: 1,228,812] | | |
| Total debt | | | | | [removed: 372,457] [added: 302,901] | | | | [removed: 444,120] [added: 372,457] | | | | [removed: 375,756] [added: 444,120] | | | | [removed: 975] [added: 375,756] | | | | [removed: 1,457] [added: 975] | | |
| Stockholders’ equity | | | | | [removed: 762,401] [added: 1,003,499] | | | | [removed: 561,117] [added: 762,401] | | | | [removed: 555,172] [added: 561,117] | | | | [removed: 1,087,234] [added: 555,172] | | | | [removed: 921,459] [added: 1,087,234] | | |
| * | | As a result of the adoption of Accounting Standards Update 2009–13, _Revenue Arrangements with Multiple Deliverables_, for [removed: the year ended July 31,] [added: fiscal] 2011, we accelerated recognition of $14.4 million in service revenue and $13.5 million in related yard operation expenses. |
| | | | | Fiscal Year Ended July 31, | | | | | | | | | | | | | | | | | | | |
The following selected consolidated statements of income data for the years ended July 31, 2013, 2012 and 2011 and the consolidated balance data at July 31, 2013 and 2012, are derived from the audited consolidated financial statements appearing elsewhere in this Annual Report on Form 10-K.
The following selected consolidated statements of income data for the years ended July 31, 2010 and 2009 and the consolidated balance sheet data at July 31, 2011, 2010 and 2009, are derived from the audited consolidated financial statements that are not included in this Annual Report on Form 10-K.
| | | | | Fiscal Years Ending July 31, | | | | | | | | | | | | | | | | | | | |
| Income from discontinued operations, net of income tax effects | | | | | — | | | | — | | | | — | | | | — | | | | 1,557 | | |
| Net income | | | | | 180,025 | | | | 182,119 | | | | 166,375 | | | | 151,627 | | | | 141,103 | | |
| Basic per share amounts: | | | | | | | | | | | | | | | | | | | | | | | |
| Income from continuing operations | | | | $ | 1.44 | | | $ | 1.42 | | | $ | 1.10 | | | $ | 0.90 | | | $ | 0.84 | | |
| Discontinued operations | | | | | — | | | | — | | | | — | | | | — | | | | 0.01 | | |
| Diluted per share amounts: | | | | | | | | | | | | | | | | | | | | | | | |
| Income from continuing operations | | | | $ | 1.39 | | | $ | 1.39 | | | $ | 1.08 | | | $ | 0.89 | | | $ | 0.82 | | |
Item 9A. Controls and Procedures
8 rewritten, 1 added, 1 removed, 41 unchanged
We conducted an evaluation of the effectiveness of the design and operation of our disclosure controls and procedures [removed: _(_as] [added: (as] defined in Rules 13a-15(e) and 15d-15(e) under the Exchange Act), or Disclosure Controls, as of the end of the period covered by this Annual Report on Form 10-K.
This evaluation, or Controls Evaluation, was performed under the supervision and with the participation of management, including our Chief Executive Officer [removed: (our CEO)] [added: (CEO)] and our Chief Financial Officer [removed: (our CFO).][added: (CFO).]
Management assessed our internal control over financial reporting [removed: as of July 31, 2013,] [added: for] the [removed: end of our] fiscal [removed: year.][added: year ended July 31, 2014.]
Management based its assessment on criteria established in Internal [removed: Control—Integrated] [added: Control — Integrated] Framework issued by the Committee of Sponsoring Organizations of the Treadway Commission (1992 Framework).
Our independent registered public accounting firm, Ernst & Young LLP, independently assessed the effectiveness of our internal control over financial reporting as of July 31, [removed: 2013.][added: 2014.]
We have audited Copart, Inc.’s internal control over financial reporting as of July 31, [removed: 2013,] [added: 2014,] based on criteria established in Internal [removed: Control—Integrated] [added: Control — Integrated] Framework issued by the Committee of Sponsoring Organizations of the Treadway Commission (1992 Framework) (the COSO criteria).
In our opinion, Copart, Inc. maintained, in all material respects, effective internal control over financial reporting as of July 31, [removed: 2013,] [added: 2014,] based on the COSO criteria.
We also have audited, in accordance with the standards of the Public Company Accounting Oversight Board (United States), the consolidated balance sheets of Copart, Inc. as of July 31, [removed: 2013] [added: 2014] and [removed: 2012,] [added: 2013,] and the related consolidated statements of income, comprehensive income, stockholders’ equity, and cash flows for each of the three years in the period ended July 31, [removed: 2013] [added: 2014] of Copart, Inc. and our report dated September [removed: 30, 2013] [added: 29, 2014] expressed an unqualified opinion thereon.
September 29, 2014
September 30, 2013
Item 9B. Other Information
1 rewritten, 0 added, 0 removed, 3 unchanged
Certain information required by Part III is omitted from this Annual Report on Form 10-K because we intend to file a definitive proxy statement for our [removed: 2013] [added: 2014] Annual Meeting of Stockholders (the Proxy Statement) not later than 120 days after the end of the fiscal year covered by this Annual Report on Form 10-K, and certain information to be included therein is incorporated herein by reference.
Item 10. Directors, Executive Officers of the Registrant and Corporate Governance
2 rewritten, 0 added, 7 removed, 5 unchanged
Information required by this item [removed: concerning our Board of Directors, the members of our Audit Committee, our Audit Committee Financial Expert, and compliance with Section 16(a) of the Securities Exchange Act of 1934] is incorporated by reference to the sections entitled “Proposal Number One Election of Directors,” “Corporate Governance and Board of Directors” and “Related Person Transactions and Section 16(a) Beneficial Ownership Compliance” in our Proxy [removed: Statement (to be filed with the Securities and Exchange Commission within 120 days of our July 31, 2013 fiscal year end).][added: Statement.]
The Code of Ethics is available at our website, located at [removed: _http://www.copart.com_.][added: http://www.copart.com.]
| --- | --- | --- |
Information required by this item concerning our Executive Officers is incorporated by reference to the section entitled “Executive Officers” in our Proxy Statement (to be filed with the Securities and Exchange Commission within 120 days of our July 31, 2013 fiscal year end).
Information required by this item with respect to material changes to the procedures by which our stockholders may recommend nominees to our Board of Directors is incorporated herein by reference from the information provided under the heading “Corporate Governance and Board of Directors,” subheading “Director Nomination Process,” of our Proxy Statement (to be filed with the Securities and Exchange Commission within 120 days of our July 31, 2013 fiscal year end).
It may be found at our website as follows:
| 1. | | From our main web page, click on “Company Info.” |
| 2. | | Next, click on “Investor Relations.” |
| 3. | | Finally, click on “Code of Ethics for Principal Executive and Senior Financial Officers.” |
Item 11. Executive Compensation
1 rewritten, 0 added, 0 removed, 1 unchanged
The information required by this item is incorporated herein by reference from the Proxy Statement (to be filed with the Securities and Exchange Commission within 120 days of our July 31, [removed: 2013] [added: 2014] fiscal year end) under the heading “Executive Compensation,” “Compensation of Non-Employee Directors,” and “Corporate Governance and Board of Directors.”
Item 12. Security Ownership of Certain Beneficial Owners and Management and Related Stockholder Matters
1 rewritten, 0 added, 0 removed, 1 unchanged
The information required by this item is incorporated herein by reference from the Proxy Statement (to be filed with the Securities and Exchange Commission within 120 days of our July 31, [removed: 2013] [added: 2014] fiscal year end) under the headings “Security Ownership” and “Execution Compensation,” subheading “Equity Compensation Plan Information.”
Item 13. Certain Relationships and Related Transactions, and Director Independence
1 rewritten, 0 added, 0 removed, 1 unchanged
The information required by this item is incorporated herein by reference from the Proxy Statement (to be filed with the Securities and Exchange Commission within 120 days of our July 31, [removed: 2013] [added: 2014] fiscal year end) under the heading “Related Person Transactions and Section 16(a) Beneficial Ownership Compliance,” “Corporate Governance and Board of Directors,” and “Proposal Number One Election of Directors.”
Item 14. Principal Accountant Fees and Services
2 rewritten, 1 added, 0 removed, 1 unchanged
The information required by this item is incorporated herein by reference from the section captioned “Proposal [removed: Three] [added: Four] — Ratification of Appointment of Independent Registered Public Accounting Firm” in the Proxy Statement (to be filed with the Securities and Exchange Commission within 120 days of our July 31, [removed: 2013] [added: 2014] fiscal year end).
PART [removed: IV][added: IV]
Item 15. Exhibits and Financial Statement Schedules
495 rewritten, 221 added, 176 removed, 496 unchanged
[removed: | (a) 1. | | | | _Financial Statements:_] Index to Consolidated Financial Statements [removed: | | | | | | |]
| [removed: | | | |] Report of Independent Registered Public Accounting Firm | | | | | [removed: 58] [added: 60] | |
| [removed: | | | |] Consolidated Balance Sheets [removed: at] [added: as of] July 31, [removed: 2013] [added: 2014] and [removed: 2012] [added: 2013] | | | | | [removed: 59] [added: 61] | |
| [removed: | | | |] Consolidated Statements of Income for the years ended July 31, [removed: 2013, 2012] [added: 2014, 2013] and [removed: 2011] [added: 2012] | | | | | [removed: 60] [added: 62] | |
| [removed: | | | |] Consolidated Statements of Comprehensive Income for the years ended July 31, [removed: 2013, 2012] [added: 2014, 2013] and [removed: 2011] [added: 2012] | | | | | [removed: 61] [added: 63] | |
| [removed: | | | |] Consolidated [removed: Statements] [added: Statement] of [removed: Stockholders’] [added: Stockholder’s] Equity for the years ended July 31, [removed: 2013, 2012] [added: 2014, 2013] and [removed: 2011] [added: 2012] | | | | | [removed: 62] [added: 64] | |
| [removed: | | | |] Consolidated Statements of Cash Flows for the years ended July 31, [removed: 2013, 2012] [added: 2014, 2013] and [removed: 2011] [added: 2012] | | | | | [removed: 63] [added: 65] | |
| [removed: | | | |] Notes to Consolidated Financial Statements | | | | | [removed: 64] [added: 66] | |
[removed: | 2. | | | | _Financial Statement Schedules:_ All] [added: No financial statement] schedules are [removed: omitted because they are] [added: presented since the required information is] not [removed: applicable] [added: present] or [added: not present in amounts sufficient to require submission of] the [removed: required] [added: schedule, or because the] information [added: required] is [removed: shown] [added: included] in the consolidated financial statements [removed: or] [added: and] notes thereto. [removed: | | | | | | |]
[removed: | 3. | | | | _Exhibits:_] The following Exhibits are filed as part of, or incorporated by reference into this report. [removed: | | | | | | |]
| 4.1 | | | | Preferred Stock Rights Agreement, dated as of March 6, [removed: 2003, between] [added: 2003,between] Copart and Equiserve Trust Company N.A., including the Certificate of Determination, the form of Rights Certificate and the Summary of Rights attached thereto as Exhibits A, B and C, respectively | | | | 8/A-12/G (File No. 000-23255), Exhibit No. 4.1 | | | | March 11, 2003 | | | |
| [removed: 10.1*] [added: 10.1] | [added: *] | | | Copart Inc. 2001 Stock Option Plan | | | | Registration Statement on Form S-8 (File No. 333-90612), Exhibit No. 4.1 | | | | June 17, 2002 | | | |
| [removed: 10.2*] [added: 10.2] | [added: *] | | | Copart Inc. 2007 Equity Incentive Plan (2007 EIP) | | | | Current Report on Form 8-K (File No. 000-23255), Exhibit No. 10.1 | | | | December [removed: 12, 2007] [added: 16, 2013] | | | |
| [removed: 10.3*] [added: 10.3] | [added: *] | | | Form of Performance Share Award Agreement for use with 2007 EIP | | | | Current Report on Form 8-K (File No. 000-23255), Exhibit No. [removed: 10.2] [added: 10.1] | | | | December 12, 2007 | | | |
| [removed: 10.4*] [added: 10.4] | [added: *] | | | Form of Restricted Stock Unit Award Agreement for use with 2007 EIP | | | | Current Report on Form 8-K (File No. 000-23255), Exhibit No. 10.3 | | | | December 12, 2007 | | | |
| [removed: 10.5*] [added: 10.5] | [added: *] | | | Form of Stock Option Award Agreement for use with 2007 EIP | | | | Current Report on Form 8-K (File No. 000-23255), Exhibit No. 10.5 | | | | December 12, 2007 | | | |
| [removed: 10.6*] [added: 10.6] | [added: *] | | | Form of Restricted Stock Award Agreement for use with 2007 EIP | | | | Current Report on Form 8-K (File No. 000-23255), Exhibit No. 10.4 | | | | December 12, 2007 | | | |
| 10.7 | [added: *] | | | Credit Agreement dated as of December 14, 2010 by and between the Registrant and Bank of America, N.A. | | | | Current Report on Form 8-K (File No. 000-23255), Exhibit No. 10.1 | | | | December 15, 2010 | | | |
| 10.8 | [added: *] | | | Amendment to Credit Agreement between [removed: and between] the Registrant and Bank of America, N.A., dated as of September 29, 2011 | | | | Current Report on Form 8-K (File No. 000-23255), Exhibit No. 10.13b | | | | October 4, 2011 | | | |
| [removed: 10.9*] [added: 10.9] | [added: *] | | | Copart, Inc. Executive Bonus Plan | | | | Current Report on Form 8-K (File No. 000-23255), Exhibit No. 10.13 | | | | August 3, 2006 | | | |
| [removed: 10.10*] [added: 10.10] | [added: *] | | | Amended and Restated Executive Officer Employment Agreement between the Registrant and William E. Franklin, dated September 25, 2008 | | | | Quarterly Report on Form 10-Q (File No. 000-23255), Exhibit No. 10.1 | | | | December 10, 2008 | | | |
| [removed: 10.11*] [added: 10.11] | [added: *] | | | Form of Copart, Inc. Stand-Alone Stock Option Award Agreement for grant of options to purchase 2,000,000 shares of the Registrant’s common stock to each of Willis J. Johnson and A. Jayson Adair | | | | Registration Statement on Form S-8 (File No. 333-159946), Exhibit No. 4.1 | | | | June 12, 2009 | | | |
| [removed: 10.12*] [added: 10.12] | [added: *] | | | Amendment dated June 9, 2010 to Option Agreements dated June 6, 2001, October 21, 2002 and August 19, 2003 between the Registrant and Willis J. Johnson | | | | Annual Report on Form 10-K (File No. 000-23255), Exhibit No. 10-17 | | | | September 23, 2010 | | | |
| 10.14 | | | | Executive Officer Employment Agreement between the Registrant and Vincent [removed: Phillips,] [added: Philips,] dated April 12, 2010 | | | | Current Report on Form 8-K (File No. 000-23255), Exhibit No. 10.4 | | | | December 15, 2010 | | | |
| 10.15 | | | | Standard Industrial/Commercial single tenant lease-net dated January 3, 2011 between Partnership [removed: HealthPlan] [added: Health Plan] of California and the Registrant | | | | Annual Report on Form 10-K (File No. [removed: 000-23254),] [added: 000-23255),] Exhibit No. 10.21 | | | | September [removed: 28,] [added: 23,] 2011 | | | |
| [removed: 10.16*] [added: 10.16] | [added: *] | | | Form of Indemnification Agreement signed by executive officers and directors | | | | Annual Report on Form 10-K (File No. 000-23255), Exhibit No. 10.17 | | | | October 1, 2012 | | | |
| 10.18 | | | | Executive Officer Employment Agreement between the Registrant and John Lindle, dated June 1, 2013 | | | | [removed: —] [added: Annual Report on Form 10-K (File No. 000-23255), Exhibit No. 10.18] | | | | [removed: Filed herewith] [added: September 30, 2013] | | | |
| [removed: 31.1] [added: 32.1] | [added: (1)] | | | Certification of [removed: Principal] [added: Chief] Executive Officer pursuant to Section [removed: 302] [added: 906] of the Sarbanes-Oxley Act of 2002 | | | | — | | | | Filed herewith | | | |
| [removed: 31.2] [added: 32.2] | [added: (1)] | | | Certification of Chief Financial Officer pursuant to Section [removed: 302] [added: 906] of the Sarbanes-Oxley Act of 2002 | | | | — | | | | Filed herewith | | | |
Pursuant to the requirements of Section 13 or 15(d) of the Securities Exchange Act of 1934, the registrant has duly caused this report to be signed on its behalf by the [removed: undersigned] [added: undersigned,] thereunto duly authorized.
| | | | | | | | | A. Jayson Adair [removed: _Chief] [added: Chief] Executive [removed: Officer_] [added: Officer (Principal Executive Officer and Director)] | | |
| /s/ A. JAYSON ADAIRA. Jayson Adair | | | | Chief Executive Officer (Principal Executive Officer and Director) | | | | September [removed: 30, 2013] [added: 29, 2014] | | |
| /s/ WILLIAM E. FRANKLINWilliam E. Franklin | | | | [removed: Senior] [added: Executive] Vice [removed: President of Finance] [added: President, United States] and Chief Financial Officer (Principal Financial and Accounting Officer) | | | | September [removed: 30, 2013] [added: 29, 2014] | | |
| /s/ WILLIS J. JOHNSONWillis J. Johnson | | | | Chairman of the Board | | | | September [removed: 30, 2013] [added: 29, 2014] | | |
| /s/ JAMES E. MEEKSJames E. Meeks | | | | Director | | | | September [removed: 30, 2013] [added: 29, 2014] | | |
| /s/ STEVEN D. COHANSteven D. Cohan | | | | Director | | | | September [removed: 30, 2013] [added: 29, 2014] | | |
| /s/ DANIEL ENGLANDERDaniel Englander | | | | Director | | | | September [removed: 30, 2013] [added: 29, 2014] | | |
| /s/ THOMAS N. TRYFOROSThomas N. Tryforos | | | | Director | | | | September [removed: 30, 2013] [added: 29, 2014] | | |
| /s/ MATT BLUNTMatt Blunt | | | | Director | | | | September [removed: 30, 2013] [added: 29, 2014] | | |
| /s/ VINCENT W. MITZVincent W. Mitz | | | | President and Director | | | | September [removed: 30, 2013] [added: 29, 2014] | | |
| (a) | | _Financial statements:_ |
Our consolidated financial statements at July 31, 2014 and 2013 and for each of the three years in the period ended July 31, 2014 and the notes thereto, together with the report of the independent registered public accounting firm on those consolidated financial statements are hereby filed as part of this annual report on Form 10-K.
| (b) | | _Financial statement schedules:_ |
| (c) | | _Exhibits:_ |
Exhibits are filed as part of this Report and are hereby incorporated by reference.
Refer to Exhibit Index included herein.
Date: September 29, 2014
| | | | | | | | | William E. Franklin, Executive Vice President, United States and Chief Financial Officer (Principal Financial and Accounting Officer) | | |
Date: September 29, 2014
| | | | | | | | | | | |
and Financial Statement Schedule
| Consolidated Financial Statements | | | | Page Number | | |
September 29, 2014
| | | | | 2014 | | | | 2013 | | | |
| Cash and cash equivalents | | | | $ | 158,668 | | | $ | 63,631 | | |
| Goodwill | | | | | 283,780 | | | | 267,463 | | |
| Comprehensive income, net of tax: | | | | | | | | | | | | | | | |
| (a) | | Net of tax effect of $(1,125), $(1,647) and $1,045 for the years ended July 31, 2014, 2013 and 2012, respectively. |
| (b) | | Net of tax effect of $744, $874 and $717 for the years ended July 31, 2014, 2013 and 2012, respectively. |
| Net income | | | | | — | | | | — | | | | — | | | | — | | | | 178,687 | | | | 178,687 | |
| Interest rate swaps, net of tax effects | | | | | — | | | | — | | | | — | | | | 673 | | | | — | | | | 673 | |
| Exercise of stock options, net of repurchased shares | | | | | 566,404 | | | | — | | | | 10,349 | | | | — | | | | (463 | ) | | | 9,886 | |
| Balances at July 31, 2014 | | | | | 126,143,366 | | | $ | 13 | | | $ | 404,542 | | | $ | (20,060 | ) | | $ | 619,004 | | | $ | 1,003,499 | |
| | | | | Year Ended July 31, | | | | | | | | | | | |
| Net Income | | | | $ | 178,687 | | | $ | 180,025 | | | $ | 182,119 | | |
| Impairment of long-lived assets | | | | | 29,104 | | | | — | | | | 8,771 | | |
JULY 31, 2014
JULY 31, 2014
Given the fixed cost nature of the Company’s business, there is not a direct correlation for an increase in expenses or units processed on vehicle pooling costs.
JULY 31, 2014
JULY 31, 2014
JULY 31, 2014
JULY 31, 2014
_Capitalized Software Costs_
The Company capitalizes system development costs and website development costs related to the enterprise computing services during the application development stage.
Costs related to preliminary project activities and post implementation activities were expensed as incurred.
Internal-use software is amortized on a straight-line basis over its estimated useful life, generally three years.
The Company evaluates the useful lives of these assets on an annual basis and tests for impairment whenever events or changes in circumstances occur that impact the recoverability of these assets.
Total gross capitalized software as of July 31, 2014 and 2013 was $61.7 million and $74.3 million, respectively.
Accumulated amortization expense related to software as of July 31, 2014 and 2013 totaled $38.6 million and $28.6 million, respectively.
| --- | --- | --- |
| | | | | | | | | Page | | |
| --- | --- | --- | --- | --- | --- | --- | --- | --- | --- | --- |
| | | | | | | | | Incorporated by reference herein | | | | | | | |
| Exhibit Number | | | | Description | | | | Form | | | | Date | | | |
| 21.1 | | | | List of subsidiaries of Registrant | | | | — | | | | Filed herewith | | | |
| 23.1 | | | | Consent of Independent Registered Public Accounting Firm | | | | — | | | | Filed herewith | | | |
| 24.1 | | | | Power of Attorney (included on signature page) | | | | — | | | | Filed herewith | | | |
| 32.1(1) | | | | Certification of Chief Executive Officer pursuant to Section 906 of the Sarbanes-Oxley Act of 2002 | | | | — | | | | Filed herewith | | | |
| 32.2(1) | | | | Certification of Chief Financial Officer pursuant to Section 906 of the Sarbanes-Oxley Act of 2002 | | | | — | | | | Filed herewith | | | |
| 101.INS | | | | XBRL Instance Document | | | | | | | | | | | |
| 101.SCH | | | | XBRL Taxonomy Extension Schema Document | | | | | | | | | | | |
| 101.CAL | | | | XBRL Taxonomy Extension Calculation Linkbase Document | | | | | | | | | | | |
| 101.DEF | | | | XBRL Extension Definition | | | | | | | | | | | |
| 101.LAB | | | | XBRL Taxonomy Extension Label Linkbase Document | | | | | | | | | | | |
| 101.PRE | | | | XBRL Taxonomy Extension Presentation Linkbase Document | | | | | | | | | | | |
| (1) | | | | In accordance with Item 601(b)(32)(ii) of Regulation S-K and SEC Release No. 33-8238 and 34-47986, Final Rule: Management’s Reports on Internal Control Over Financial Reporting and Certification of Disclosure in Exchange Act Periodic Reports, the certifications furnished in Exhibits 32.1 and 32.2 hereto are deemed to accompany this Form 10-K and will not be deemed “filed” for purposes of Section 18 of the Exchange Act. Such certifications will not be deemed to be incorporated by reference into any filings under the Securities Act or the Exchange Act, except to the extent that the registrant specifically incorporates it by reference. | | | | | | | | | | |
| --- | --- | --- | --- | --- | --- | --- | --- | --- | --- | --- | --- | --- | --- | --- |
September 30, 2013
| | | | | | | | | William E. Franklin _Chief Financial Officer_ | | |
| Earnings per share — basic | | | | | | | | | | | | | | | |
| Earnings per share — diluted | | | | | | | | | | | | | | | |
| Balances at July 31, 2010 | | | | | 168,726,126 | | | | 17 | | | | 365,490 | | | | (32,741 | ) | | | 754,468 | | | | 1,087,234 | |
| Net income | | | | | — | | | | — | | | | — | | | | — | | | | 166,375 | | | | 166,375 | |
| Exercise of stock options, net of repurchased shares | | | | | 866,526 | | | | — | | | | 6,486 | | | | — | | | | (3,639 | ) | | | 2,847 | |
| Shares repurchased | | | | | (37,708,810 | ) | | | (4 | ) | | | (82,651 | ) | | | — | | | | (652,747 | ) | | | (735,402 | ) |
| Cash and cash equivalents at end of period | | | | $ | 63,631 | | | $ | 140,112 | | | $ | 74,009 | | |
JULY 31, 2013, 2012 AND 2011
| Cumulative loss on foreign currency translation as of July 31, 2013 | | | | $ | (45,420 | ) |
The Company’s cash and cash equivalents are placed with high credit quality financial institutions.
The Company generally classifies its investment portfolio not otherwise qualifying as cash and cash equivalents as available-for-sale securities.
Available-for-sale securities are reported at fair value, with unrealized gains and losses reported as a component of stockholders’ equity and comprehensive income.
Unrealized losses are charged against income when a decline in the fair market value of an individual security is determined to be other than temporary.
Realized gains and losses on investments are included in interest income.
transportation and other equipment; 3 to 10 years for office furniture and equipment; and 15 to 40 years or the lease term, whichever is shorter, for buildings and improvements.
The Company adopted ASC 718 using the modified-prospective transition method.
Under this transition method, stock-based compensation cost recognized in the fiscal years ended July 31, 2013, 2012 and 2011 includes stock-based compensation expense for all stock-based payment awards granted prior to, but not yet vested as of August 1, 2005, based on the measurement date (generally the grant date) fair value estimated in accordance with the original provisions of ASC 718, and stock-based compensation expense for all stock-based payment awards granted subsequent to August 1, 2005, based on the measurement date fair value estimated in accordance with the provisions of ASC 718.
For the year ended July 31, 2011 the only item in accumulated other comprehensive loss was the effect of foreign currency translation adjustments.
_Segment Reporting_
In May 2011, the FASB issued ASU 2011-04, _Fair Value Measurement (Topic 820): Amendments to Achieve Common Fair Value Measurement and Disclosure Requirements in U.S. GAAP and International Financial Reporting Standards (IFRS)._ Under ASU 2011-04 the guidance amends certain accounting and disclosure requirements to ensure that fair value has the same meaning in U.S. GAAP and in IFRS and that the respective fair value measurement and disclosure requirements are the same.
An excerpt. Shown here: 40 of 495 rewritten, 40 of 221 added and 40 of 176 removed. The counts are complete. For every sentence, read Item 15. Exhibits and Financial Statement Schedules in the FY2014 filing and the FY2013 filing.