 filings.tools
Item 5. MARKET FOR REGISTRANT’S COMMON EQUITY, RELATED STOCKHOLDER MATTERS AND ISSUER PURCHASES OF EQUITY SECURITIES
5K characters. Original on sec.gov ·
Item 5. MARKET FOR REGISTRANT’S COMMON EQUITY, RELATED STOCKHOLDER MATTERS AND ISSUER PURCHASES OF EQUITY SECURITIES
Our common stock is listed on the NYSE under the symbol “DHI.” As of November 13, 2023, the closing price of our common stock on the NYSE was $122.32, and there were approximately 265 holders of record.
In October 2023, our Board of Directors approved a quarterly cash dividend of $0.30 per common share, payable on November 28, 2023, to stockholders of record on November 21, 2023. The declaration of future cash dividends is at the discretion of our Board of Directors and will depend upon, among other things, our future earnings, cash flows, capital requirements, financial condition and general business conditions.
We may repurchase shares of our common stock from time to time pursuant to our $1.0 billion common stock repurchase authorization, which was approved by our Board of Directors effective April 18, 2023, and which replaced our prior $1.0 billion common stock repurchase authorization. During fiscal 2023, we purchased 11.1 million shares of our common stock at a total cost, including commissions and excise taxes, of $1.2 billion. At September 30, 2023, our remaining stock repurchase authorization was $234.0 million. The share repurchases may be effected through Rule 10b5-1 plans or open market purchases, each in compliance with Rule 10b-18 under the Securities Exchange Act of 1934, as amended (Exchange Act). Shares repurchased in July 2023 included 585,063 shares purchased pursuant to a trading plan under Rule 10b5-1 of the Exchange Act. The following table sets forth information concerning our common stock repurchases during the three months ended September 30, 2023.
| Period | Total Number of Shares Purchased (1) | Average Price Paid per Share | Total Number of Shares Purchased as Part of Publicly Announced Plans or Programs | Approximate Dollar Value of Shares that may yet be Purchased Under the Plans or Programs (1) (In millions) | ||||||||||||||||||||||
| July 2023 | 975,998 | $ | 123.21 | 975,998 | $ | 536.9 | ||||||||||||||||||||
| August 2023 | 2,066,704 | 122.12 | 2,066,704 | 284.5 | ||||||||||||||||||||||
| September 2023 | 429,116 | 117.66 | 429,116 | 234.0 | ||||||||||||||||||||||
| Total | 3,471,818 | $ | 121.88 | 3,471,818 | $ | 234.0 |
(1) In October 2023, our Board of Directors authorized the repurchase of up to $1.5 billion of our common stock, replacing the previous authorization, which at that time had only $32.8 million remaining due to repurchases made subsequent to our fiscal year end. The authorization has no expiration date.
During fiscal years 2023, 2022 and 2021, we did not sell any equity securities that were not registered under the Securities Act of 1933, as amended (Securities Act).
The information required by this item with respect to equity compensation plans is set forth under Item 12 of this annual report on Form 10-K and is incorporated herein by reference.
Stock Performance Graph
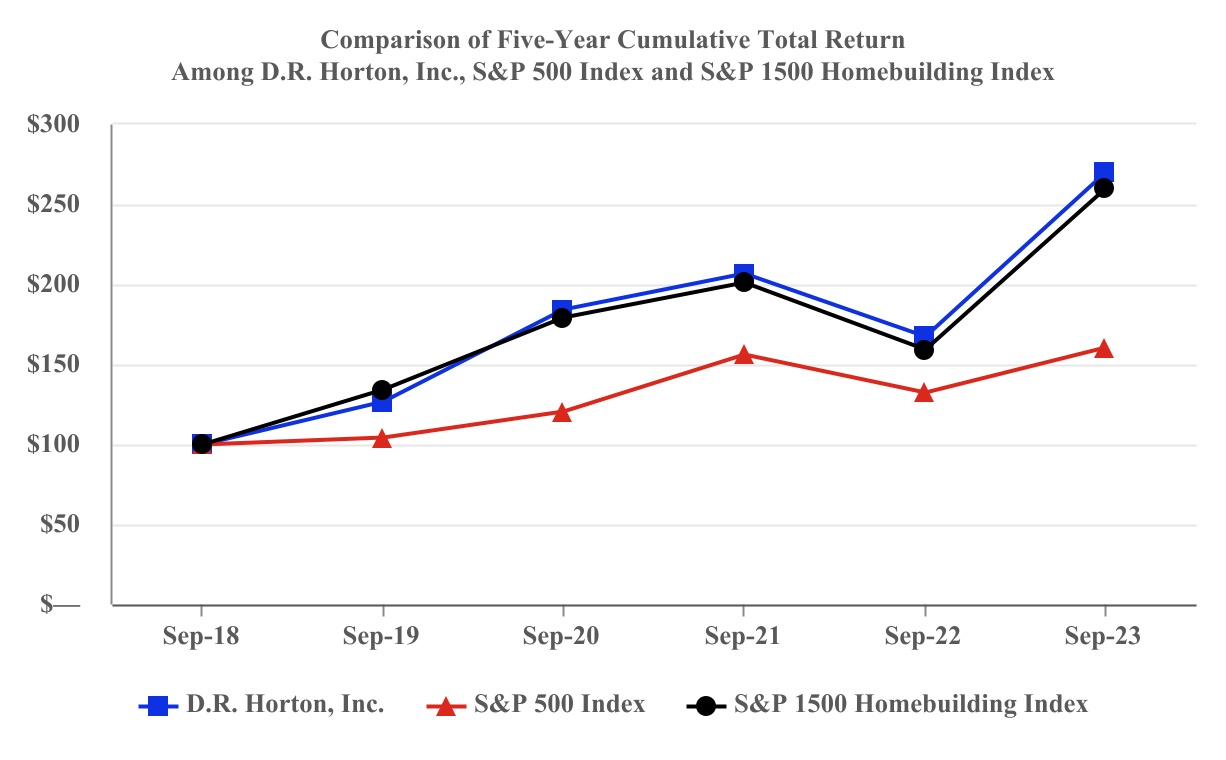
The following graph illustrates the cumulative total stockholder return on D.R. Horton common stock for the last five fiscal years through September 30, 2023, compared to the S&P 500 Index and the S&P 1500 Homebuilding Index. The comparison assumes a hypothetical investment in D.R. Horton common stock and in each of the foregoing indices of $100 at September 30, 2018 and assumes that all dividends were reinvested. Shareholder returns over the indicated period are based on historical data and should not be considered indicative of future shareholder returns. The graph and related disclosure in no way reflect our forecast of future financial performance.
| September 30, | |||||||||||||||||||||||||||||||||||
| 2018 | 2019 | 2020 | 2021 | 2022 | 2023 | ||||||||||||||||||||||||||||||
| D.R. Horton, Inc. | $ | 100.00 | $ | 126.81 | $ | 184.21 | $ | 206.46 | $ | 167.44 | $ | 269.80 | |||||||||||||||||||||||
| S&P 500 Index | 100.00 | 104.25 | 120.05 | 156.07 | 131.92 | 160.44 | |||||||||||||||||||||||||||||
| S&P 1500 Homebuilding Index | 100.00 | 134.28 | 178.85 | 200.85 | 159.09 | 259.68 |
This performance graph shall not be deemed to be incorporated by reference into our SEC filings and should not constitute soliciting material or otherwise be considered filed under the Securities Act or the Exchange Act.
Previous: Item 4. MINE SAFETY DISCLOSURES · Next: Item 6. [Reserved]