 filings.tools
Item 5. Market for Registrant’s Common Equity, Related Stockholder Matters and Issuer Purchases of Equity Securities
3K characters. Original on sec.gov · Markdown
Item 5. Market for Registrant’s Common Equity, Related Stockholder Matters and Issuer Purchases of Equity Securities
Our common stock is traded on The Nasdaq Global Select Market® under the symbol “DLTR.” As of March 18, 2024, we had 2,045 shareholders of record.
Issuer Purchases of Equity Securities
We periodically repurchase shares of our common stock under share repurchase programs authorized by our Board of Directors. Under the existing Board repurchase authorization, we may repurchase up to $2.5 billion of our common stock in open market or privately negotiated transactions with financial institutions. The repurchase authorization does not have an expiration date.
We repurchased 3,905,599, 4,613,696 and 9,156,898 shares of common stock on the open market at a cost of $504.3 million, $647.5 million and $950.0 million in fiscal 2023, fiscal 2022 and fiscal 2021, respectively. The fiscal 2023 share repurchases occurred prior to the fourth quarter and the cost incurred includes the applicable excise tax. As of February 3, 2024, we had $1.35 billion remaining under our existing $2.5 billion Board repurchase authorization.
Stockholder Matters
We anticipate that substantially all of our cash flow from operations in the foreseeable future will be retained for the development and expansion of our business, the repayment of indebtedness and, as authorized by our Board of Directors, the repurchase of stock. We do not anticipate paying cash dividends on our common stock in fiscal 2024.
Stock Performance Graph
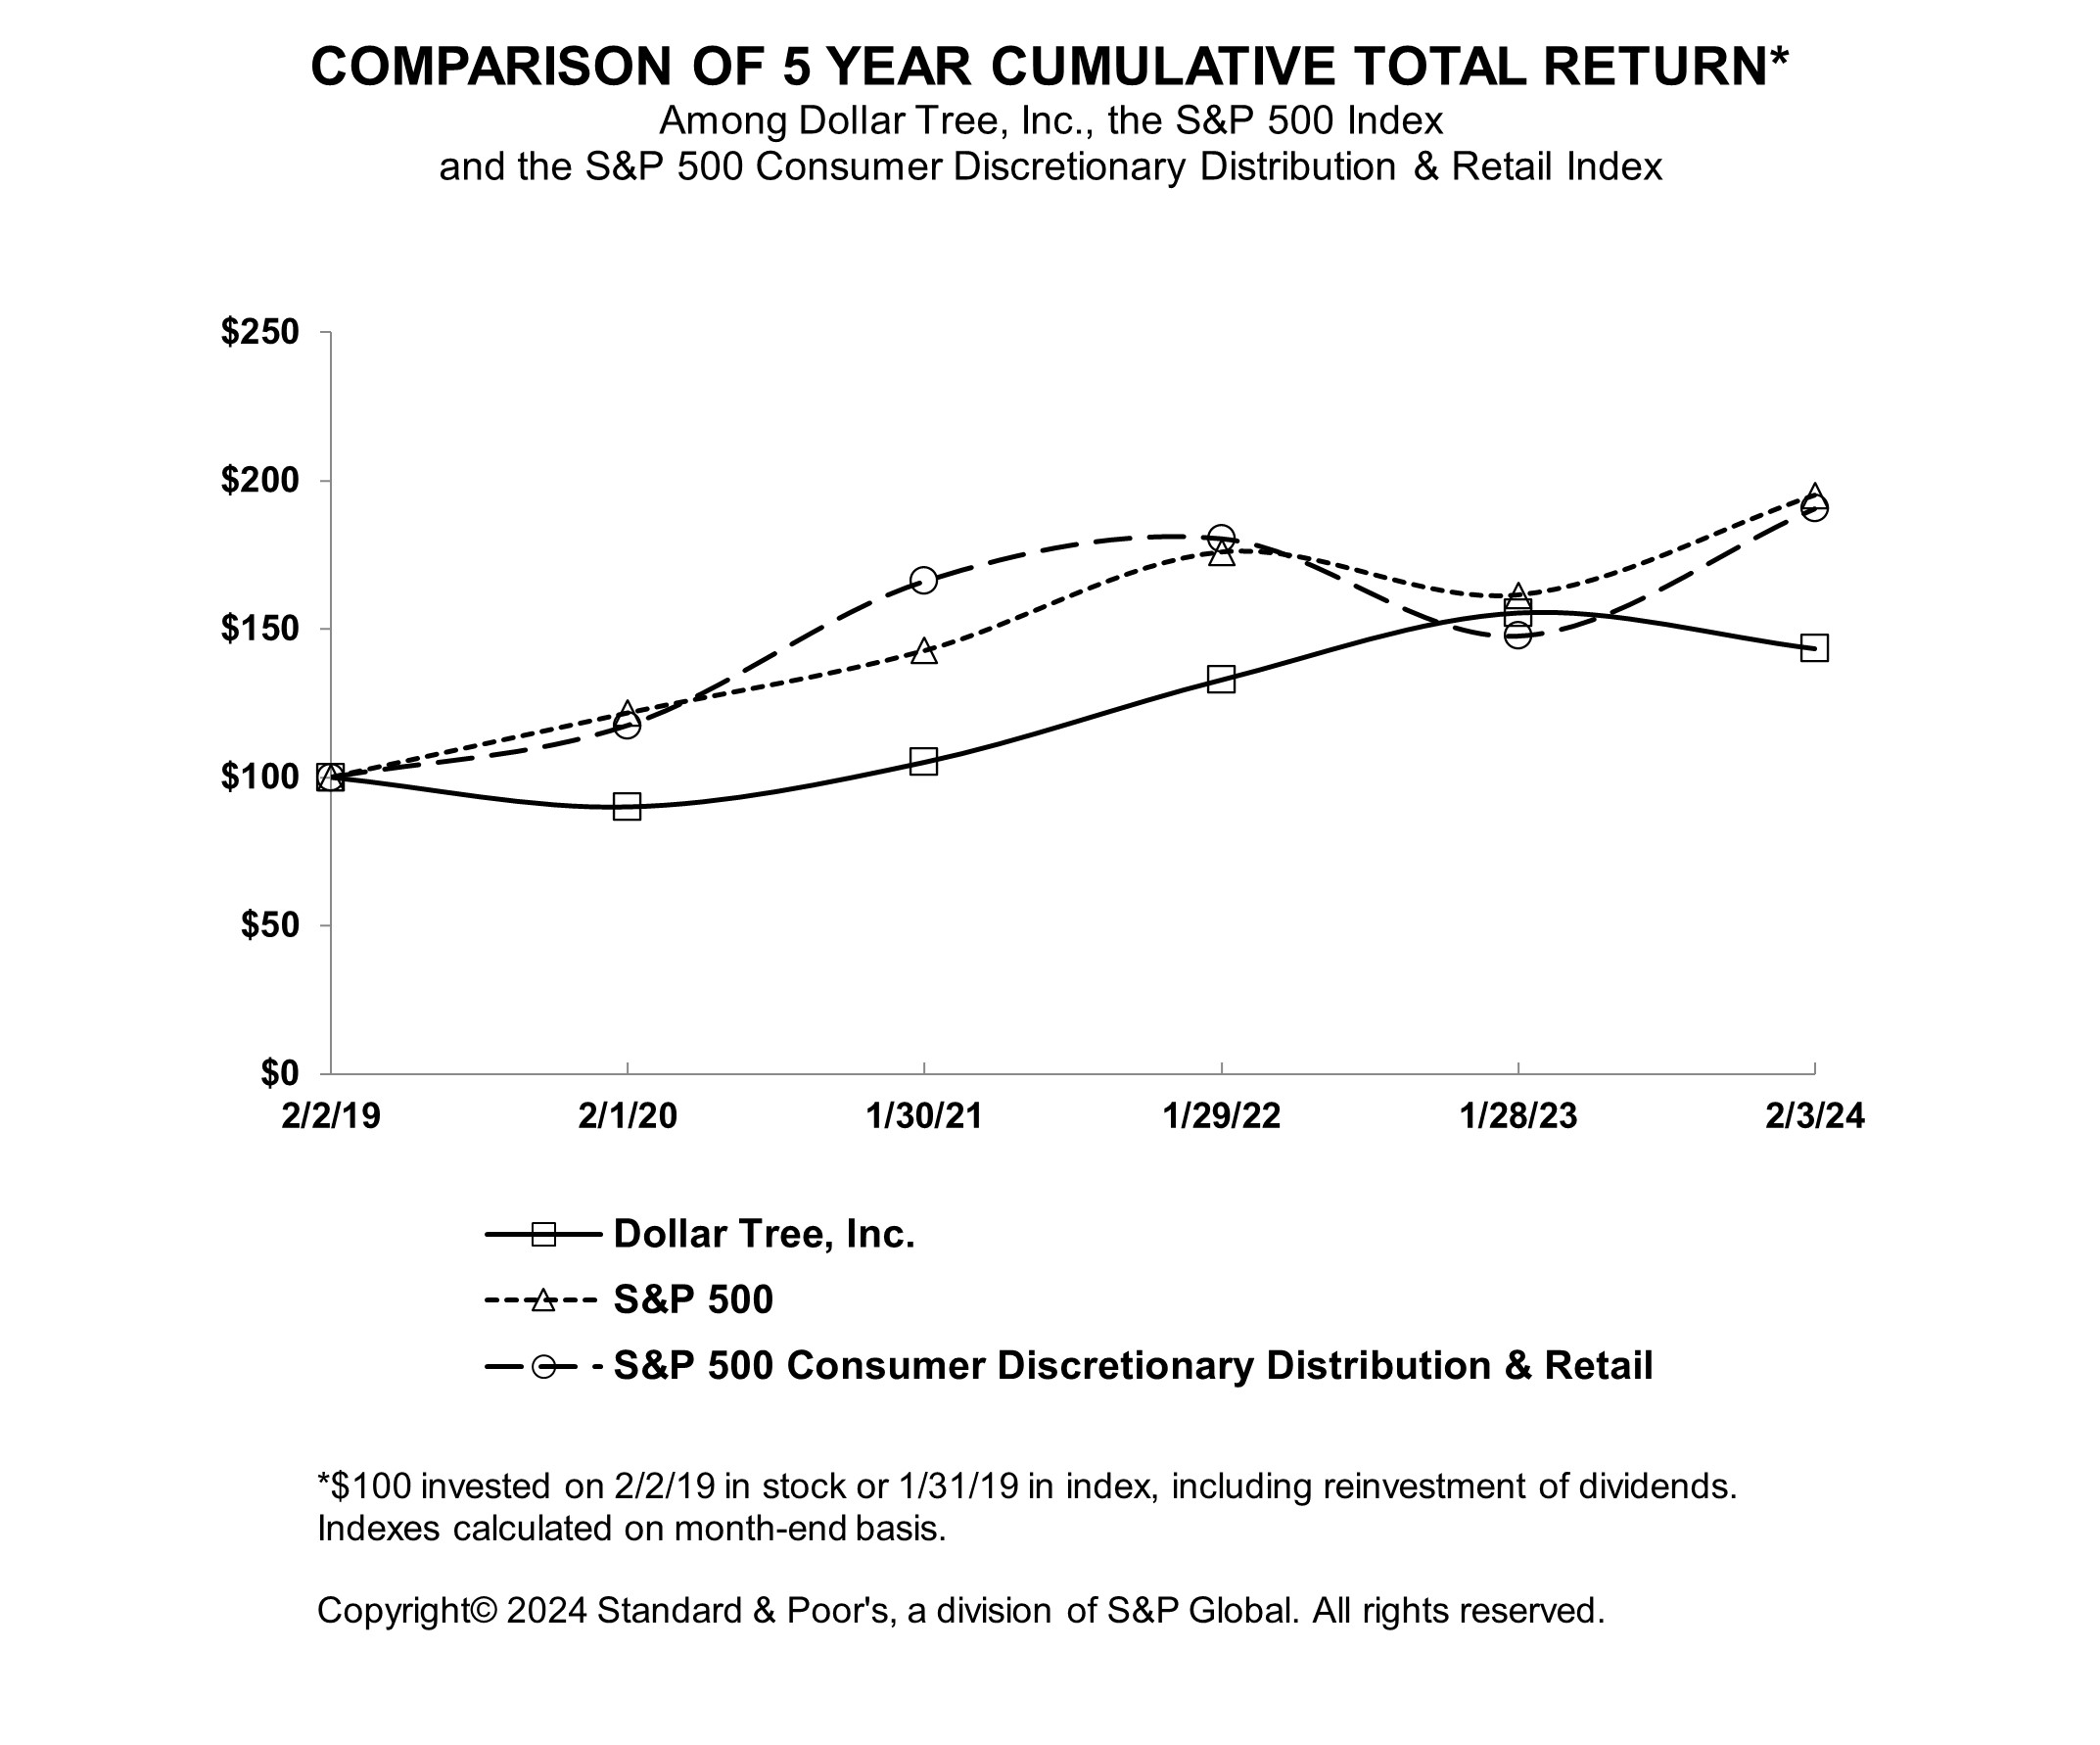
The following graph sets forth the yearly percentage change in the cumulative total shareholder return on our common stock during the five fiscal years ended February 3, 2024, compared with the cumulative total returns of the S&P 500 Index and the S&P 500 Consumer Discretionary Distribution & Retail Index. The comparison assumes that $100 was invested in our common stock and in each of the foregoing indices at the market close on the last trading day of the fiscal year ended February 2, 2019, and that dividends were reinvested. The stock price performance shown in the graph is not necessarily indicative of future price performance.
| Year Ended | ||||||||||||||||||||
| February 2, 2019 | February 1, 2020 | January 30, 2021 | January 29, 2022 | January 28, 2023 | February 3, 2024 | |||||||||||||||
| Dollar Tree, Inc. | $ | 100.00 | $ | 90.05 | $ | 105.14 | $ | 132.89 | $ | 155.52 | $ | 143.46 | ||||||||
| S&P 500 Index | 100.00 | 121.68 | 142.67 | 175.90 | 161.45 | 195.06 | ||||||||||||||
| S&P 500 Consumer Discretionary Distribution & Retail Index | 100.00 | 117.54 | 166.19 | 180.56 | 147.66 | 190.67 |
Previous: Item 4. Mine Safety Disclosures · Next: Item 6. Reserved