 filings.tools
Item 7. Management’s Discussion and Analysis of Financial Condition and Results of Operations
84K characters. Original on sec.gov · Markdown
Item 7. Management’s Discussion and Analysis of Financial Condition and Results of Operations
Introduction
The following discussion and analysis presents management’s perspective of our business, financial condition and overall performance. This information is intended to provide investors with an understanding of our past performance, current financial condition and outlook for the future and should be read in conjunction with “Item 8. Financial Statements and Supplementary Data” of this report.
The following discussion and analyses generally focus on 2020 and 2019 items and year-to-year comparisons between 2020 and 2019. Discussions of 2018 items and year-to-year comparisons between 2019 and 2018 that are not included in this report can be found in “Management’s Discussion and Analysis of Financial Condition and Results or Operations” in Part II, Item 7 of our 2019 Annual Report on Form 10-K.
COVID – 19
A novel strain of coronavirus, SARS-CoV-2, causing a disease referred to as COVID-19, was reported to have surfaced in China in late 2019 and has subsequently spread worldwide, resulting in a global pandemic and health crisis. Devon began actively monitoring COVID-19 in January 2020 and formally established a COVID-19 cross-functional planning team at the beginning of March. The COVID-19 team is focused on two key priorities: the health and safety of our employees and contractors and the uninterrupted operation of our business.
| • | Health and safety – The COVID-19 team has developed and implemented a number of safety measures, which have successfully kept our workforce healthy and safe. The COVID-19 team has established an informational campaign to provide employees an understanding of the virus risk factors and safety measures, as well as timely updates from governmental stay-at-home regulations. Expectations have also been set for employees to communicate immediately if they, or someone they have been in contact with, has experienced symptoms or tested positive for COVID-19. Other measures have included closing all of Devon’s office buildings and locations to the public, implementing social distancing and encouraging employees to work from home. Beginning in late March, more than 90% of the workforce assigned to Devon’s Oklahoma City Headquarters office were primarily working from home until the vast majority began a hybrid schedule of working from home and the office late in the second quarter. The COVID-19 team also strongly encourages employees to wear masks, reinforces social distancing measures and continues to perform targeted and routine intensive and deep cleaning of all Devon office locations. |
|---|
| • | Uninterrupted operation of our business – Beyond workforce safety measures, the COVID-19 team has worked with government officials to ensure our business continues to be deemed an essential business or infrastructure. The COVID-19 team has ensured technology and resources are available for employees to execute their job duties while working from home and implemented further social distancing and contactless initiatives in our oil and gas field operations. The collective efforts of our COVID-19 team and our entire workforce have enabled us to avoid the need to implement COVID-19 containment or mitigation measures, which would require closure or suspension of any of our operations. |
|---|
This outbreak and the related responses of governmental authorities and others to limit the spread of the virus have significantly reduced global economic activity, resulting in an unprecedented decline in the demand for oil and other commodities. This supply-and-demand imbalance was exacerbated by uncertainty regarding the future global supply of oil due to disputes between Russia and the members of OPEC in March 2020. These factors caused a swift and material deterioration in commodity prices in early 2020, with NYMEX WTI oil prices falling from a high of over $60/Bbl at the beginning of the year to below $20/Bbl in April 2020. By the end of 2020, NYMEX WTI oil prices recovered to approximately $50/Bbl, and we expect oil and other commodity prices to remain volatile for the foreseeable future.
Overview of 2020 Results
Driven by the coronavirus pandemic, 2020 was a challenging year for the oil and gas industry and our business. Social distancing restrictions, government lockdowns and individual behavior changes all reduced transportation needs, which negatively impacted the demand for oil. The resulting drop in oil prices and cash generated from our operations necessitated a change in our plans. We aggressively reduced our planned capital investment 45%, selectively curtailed production and initiated sustainable cost-reduction measures. Despite these challenges, we continued to improve our capital efficiency and controllable costs per unit of production. Importantly, we maintained competitive leverage and debt metrics.
These market forces led to opportunities for select companies in our industry to create shareholder value from mergers and acquisitions. And, on September 26, 2020, we entered into the Merger Agreement, providing for an all-stock merger of equals with WPX which successfully closed on January 7, 2021. The Merger has created a leading oil producer in the U.S., with an asset base underpinned by premium acreage in the economic core of the Delaware Basin. This strategic combination accelerates our transition to a cash-return business model, including the implementation of a fixed plus variable dividend strategy.
As evidenced by our recent performance highlights below, we remain focused on building economic value by executing on our strategic priorities of disciplined oil volume growth while cutting operational and corporate costs, reducing reinvestment rates to maximize free cash flow, maintaining low leverage, delivering cash returns to our shareholders and pursuing ESG excellence. As we capture synergies and other benefits from the Merger, we expect to improve across all these performance measures.
| • | 2020 oil production totaled 155 MBbls/d, exceeding our plan by 5%. |
|---|
| • | Operating costs continued to decline in 2020, led by a 29% and 6% decrease from 2019 for G&A and production expenses, respectively. |
|---|
| • | Reduced workforce to reflect lower and sustainable capital investment program. |
|---|
| • | Closed on the Barnett Shale transaction on October 1, 2020, receiving net proceeds of $490 million. |
|---|
| • | Paid a special dividend of $0.26 per share for approximately $100 million on October 1, 2020. |
|---|
| • | Remained focused on reducing methane emissions and greenhouse gas while also increasing water recycling. |
|---|
| • | Exited 2020 with $5.2 billion of liquidity, including $2.2 billion of cash, with no near-term debt maturities. |
|---|
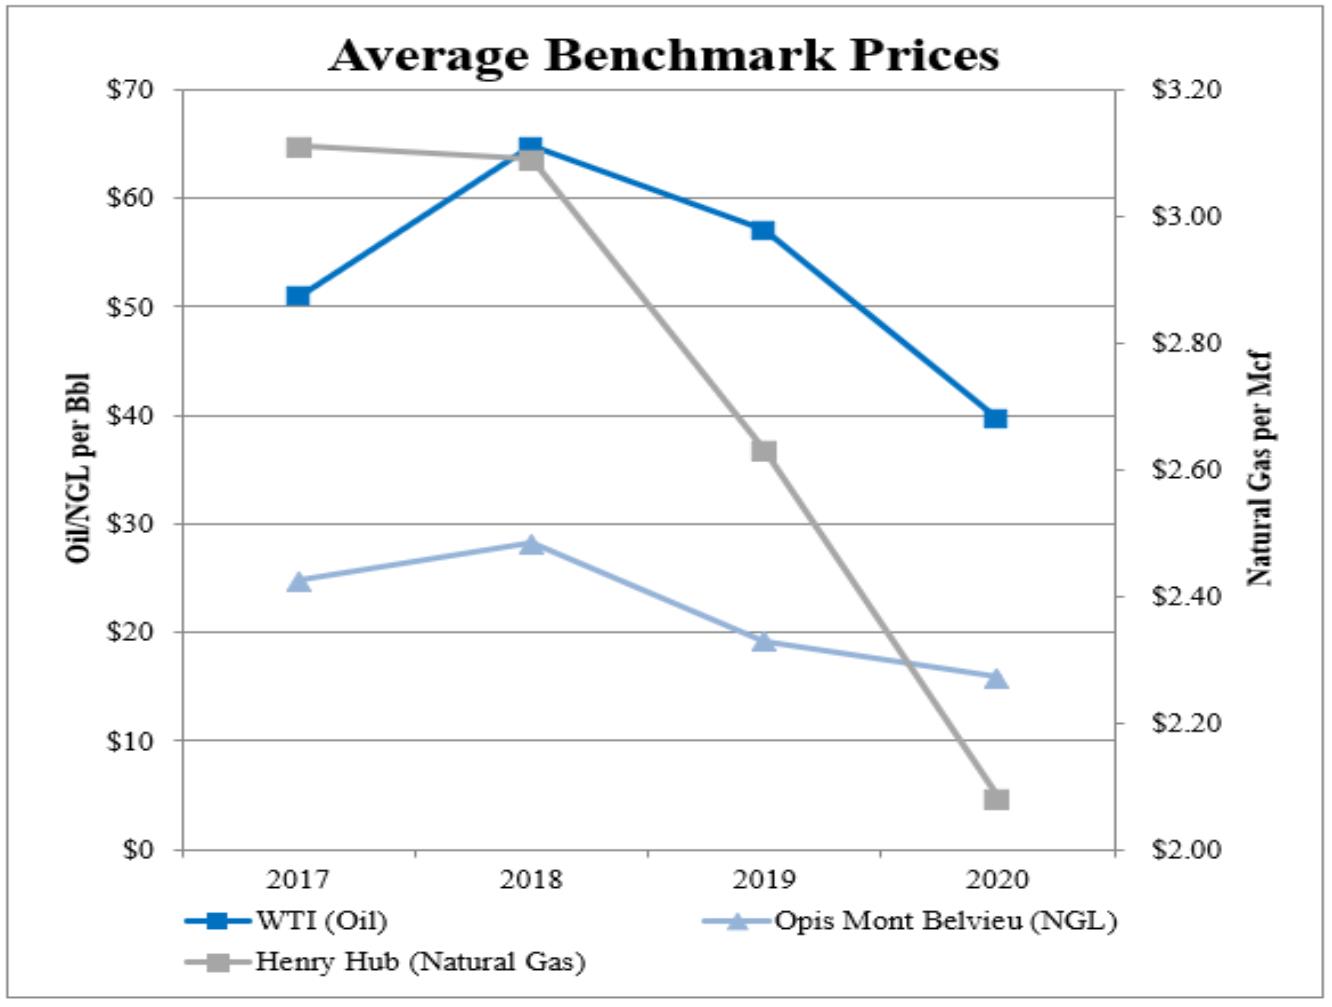 | As presented in the graph at the left, our operating achievements are subject to the volatility of commodity prices. Over the last four years, NYMEX WTI oil and NYMEX Henry Hub gas prices ranged from average highs of $64.79 per Bbl and $3.11 per MMBtu, respectively, to average lows of $39.59 per Bbl and $2.08 per MMBtu, respectively. | |
|---|---|---|
Trends of our annual earnings, operating cash flow, EBITDAX and capital expenditures are shown below. The annual earnings chart presents amounts pertaining to both Devon’s continuing and discontinued operations. The annual cash flow chart presents amounts pertaining to Devon’s continuing operations. “Core earnings” and “EBITDAX” are financial measures not prepared in accordance with GAAP. For a description of these measures, including reconciliations to the comparable GAAP measures, see “Non-GAAP Measures” in this Item 7.
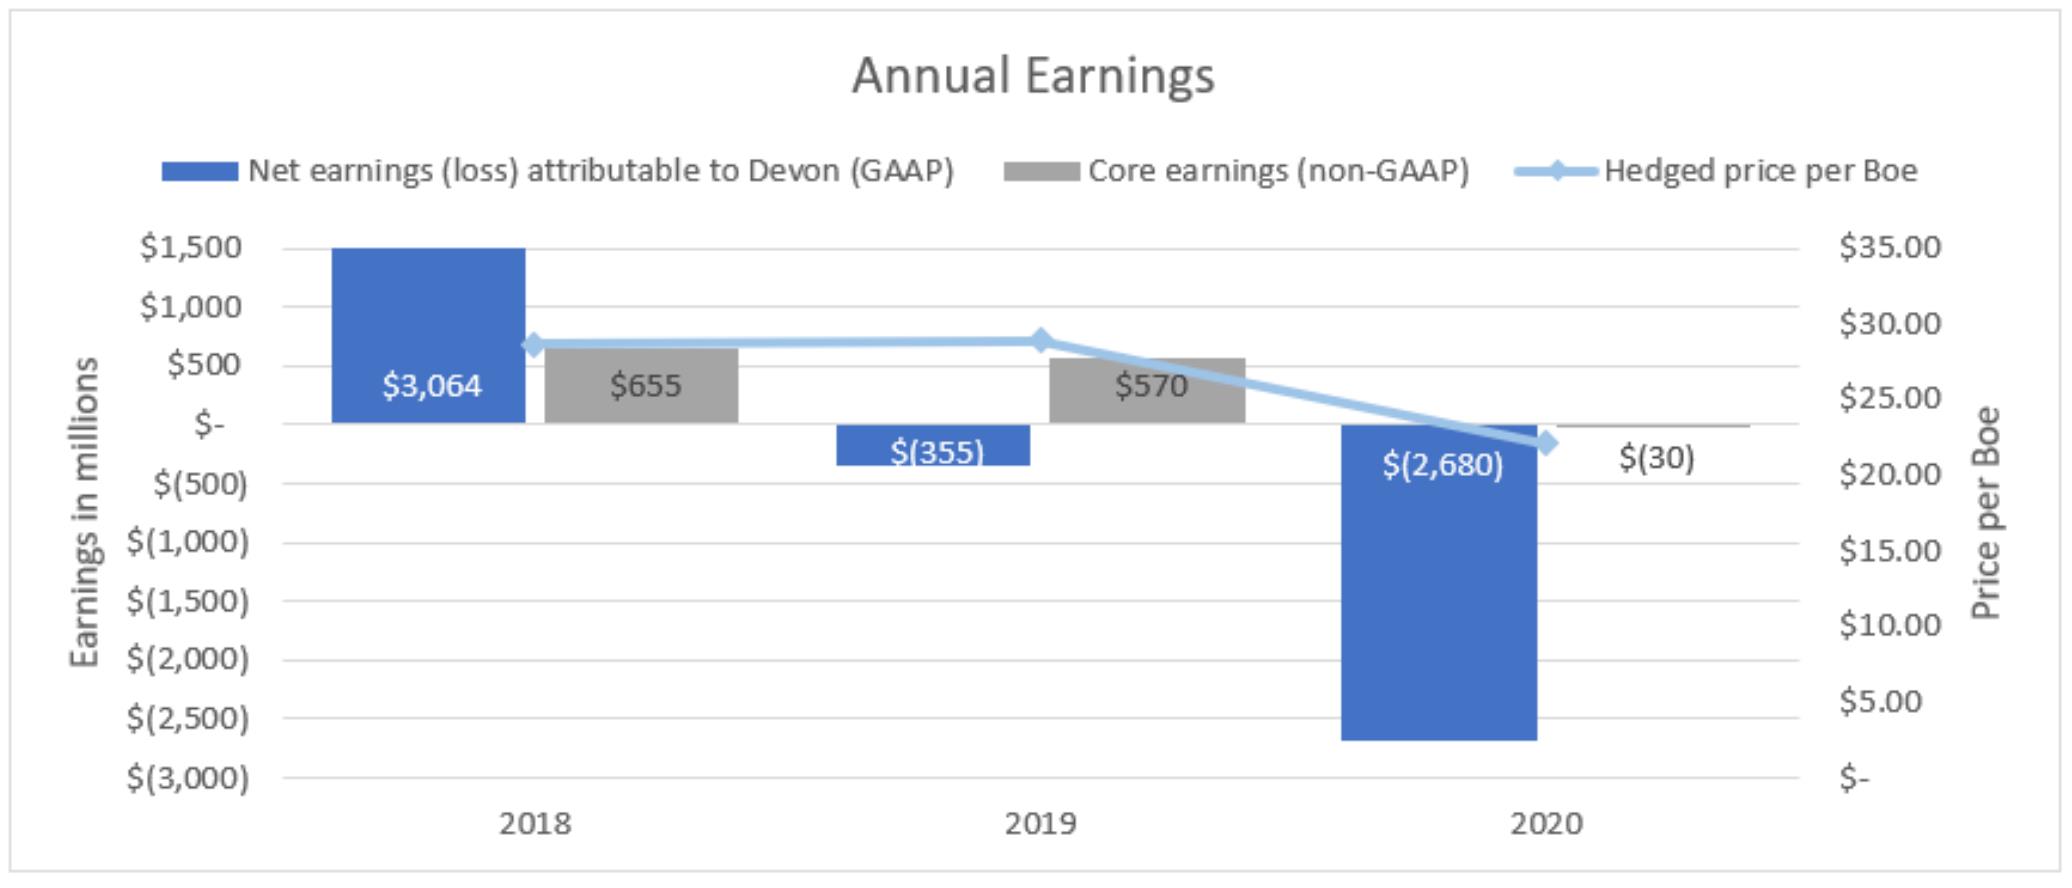
Our net earnings in recent years have been significantly impacted by divestiture transactions, asset impairments and temporary, noncash adjustments to the value of our commodity hedges. Net earnings in 2018 included a $2.2 billion gain on our EnLink disposition, a $0.5 billion hedge valuation gain and a $0.2 billion gain on asset dispositions from continuing operations, all net of taxes. Net earnings in 2019 included a $0.4 billion hedge valuation loss, $0.2 billion net gains and charges related to our Canadian disposition and a $0.6 billion asset impairment related to our Barnett Shale disposition, all net of taxes. Net earnings in 2020 included $2.3 billion of asset impairments on our proved and unproved properties and a $0.1 billion hedge valuation loss, both net of taxes. Excluding these amounts, our core earnings have been more stable over recent years but continue to be heavily influenced by commodity prices.
Despite our portfolio enhancements, aggressive cost reductions and operational advancements, our 2020 financial results were challenged by commodity prices and deterioration of the macro-economic environment resulting from the unprecedented COVID-19 pandemic. Our earnings decreased from 2019 to 2020 due to a decline in overall commodity prices. Led by a 31% decline in WTI from 2019 to 2020, our unhedged combined realized price decreased 31%, while our hedged price decreased 26%. In response to this commodity price environment, we reduced our aggregate production and G&A expenses 13% compared to 2019.
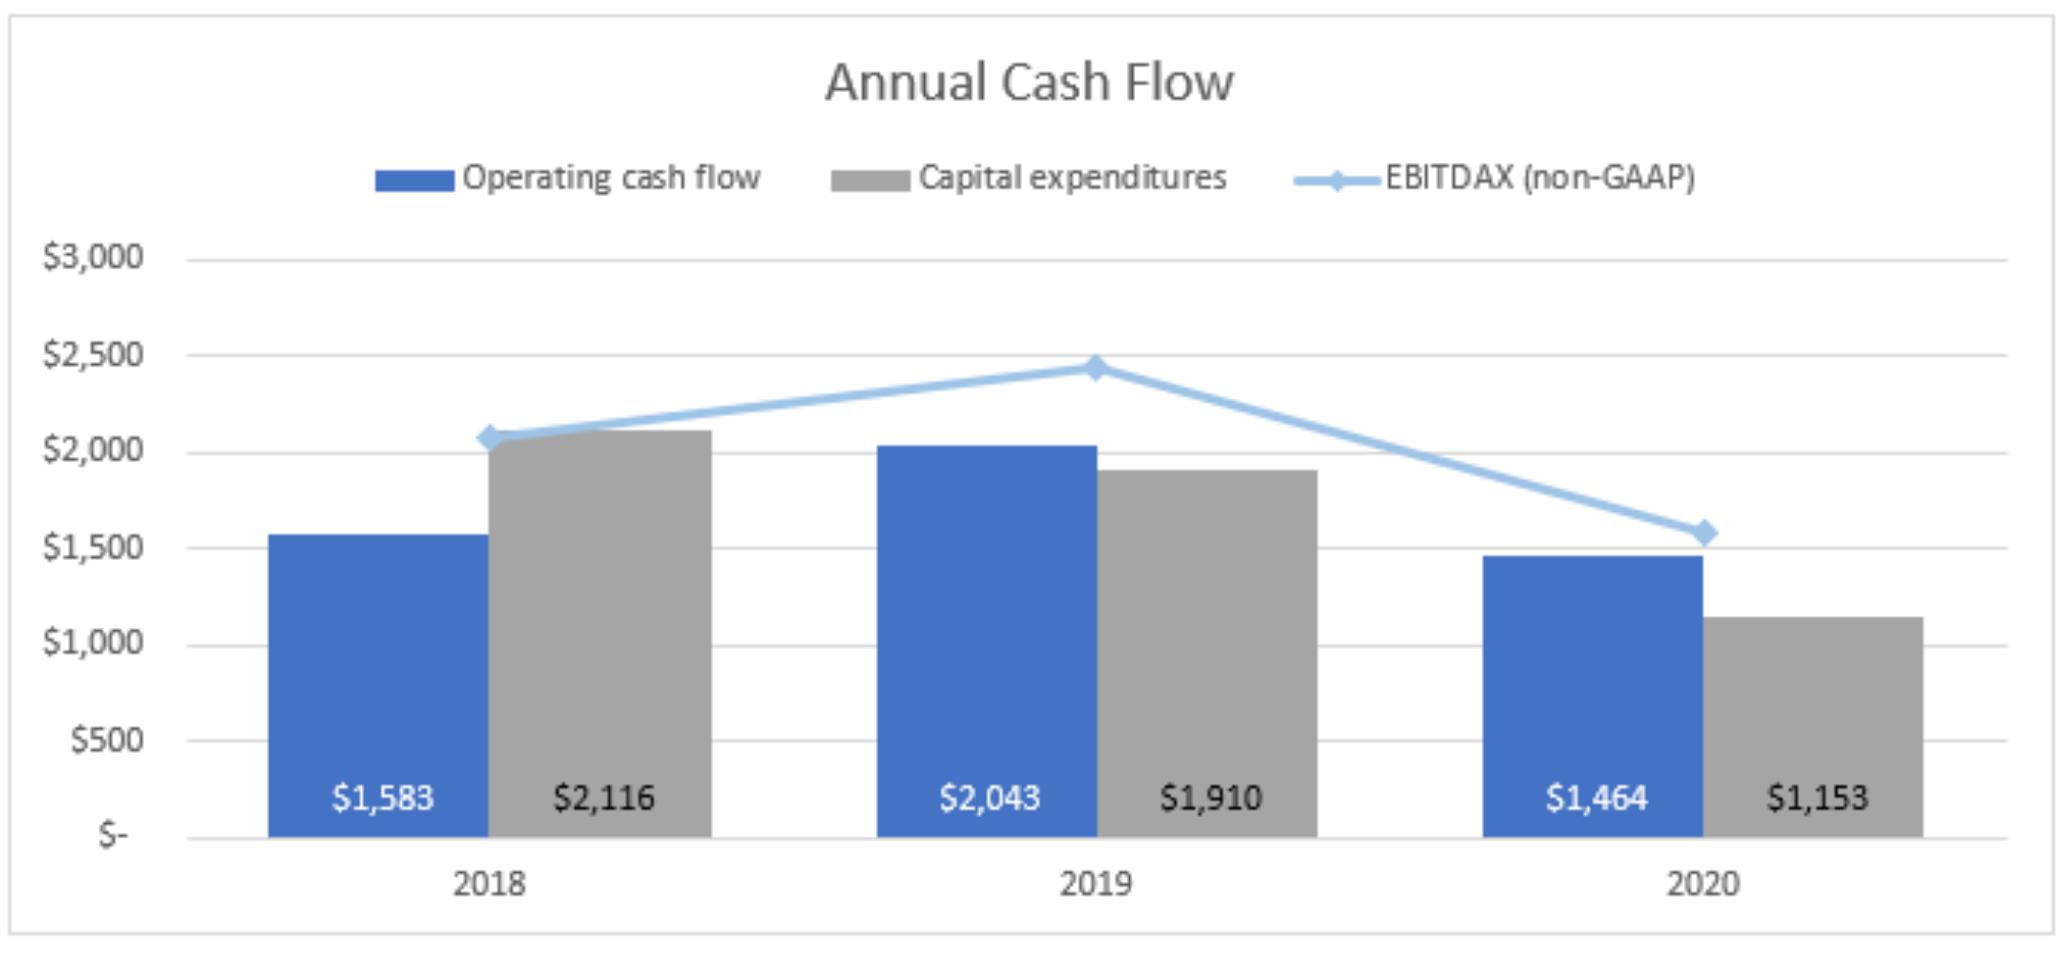
Like earnings, our operating cash flow is sensitive to volatile commodity prices. EBITDAX, which excludes financial amounts related to discontinued operations, and operating cash flow continue to be impacted from the COVID-19 pandemic and declines in commodity prices. As operating cash flow has declined, we reduced our 2020 capital expenditures by approximately $800 million, or 45% compared to the original capital budget.
As of December 31, 2020, we had $5.2 billion of liquidity comprised of $2.2 billion of cash and $3.0 billion of available credit under our Senior Credit Facility. We had $4.3 billion of debt outstanding with no maturities until the end of 2025. Post-merger, approximately 50% and 55% of our 2021 oil and gas production is hedged, respectively. These contracts consist of a variety of trade types based off the WTI oil benchmark and the Henry Hub natural gas index. Additionally, we have entered into regional basis swaps in an effort to protect price realizations across our portfolio.
Business and Industry Outlook
In 2020, Devon marked its 49th anniversary in the oil and gas business and its 32nd year as a public company. Due to our financial strength, our strong leadership team and our portfolio of quality assets, during 2020, we were able to successfully navigate through periods of commodity price volatility and economic uncertainty caused by the COVID-19 global pandemic. We also announced a transformational merger of equals with WPX that nearly doubles the size and scale of Devon’s oil production while further strengthening the quality of our portfolio of assets without deteriorating our balance sheet strength. The transaction was completed on January 7, 2021.
With the combination of the Devon and WPX leadership teams, and respective portfolios of quality assets, we expect to build on our successful track record of delivering value for our shareholders while remaining committed to safeguarding our long-term financial strength. With the transaction, Devon creates a leading position in the Delaware Basin while also adding the oily Williston Basin to our portfolio of assets. Looking forward, the strategic combination with WPX accelerates our planned cash return business model that includes targeted capital reinvestment rates of 70 to 80 percent of operating cash flow and a disciplined returns-driven strategy to generate higher free cash flow. Our strategy is underpinned by the maintenance of a disciplined oil growth target of up to 5 percent annually, while achieving margin growth through operational and corporate cost reductions. We expect to prioritize the deployment of our free cash flow toward maintaining a strong balance sheet through debt reduction and returning excess cash to shareholders through cash dividends using our innovative fixed plus variable dividend framework.
Our disciplined growth strategy is in response to current market fundamentals that indicate a slow recovery in global oil demand along with market prices for crude oil and natural gas that remain inherently volatile. In 2020, WTI oil prices averaged $39.59 per barrel versus $57.02 per barrel in 2019. Crude prices experienced tremendous volatility in 2020 with a geopolitical price war in March, followed by a steep decline in global oil demand related to the COVID-19 pandemic and associated lockdowns. Looking ahead, current market fundamentals indicate that 2021 crude pricing is expected to improve, supported by a slow recovery in demand with the easing of lockdown measures, the rollout of COVID-19 vaccines and declines in shale production. These factors indicate a balanced market by the second half of 2021. However, uncertainty still exists depending on actions taken by OPEC+ countries in supporting a balanced global crude supply. Natural gas and NGL prices also faced strong headwinds in early 2020 due to the COVID-19 pandemic as lockdowns negatively impacted demand. During the summer of 2020, U.S. gas prices were pressured by U.S. liquefied natural gas export cancellations from decreased global demand outlook. Looking forward, gas and NGL prices have improved due to declines in associated gas volumes, and strong recovery in global demand.
To mitigate our exposure to commodity market volatility and ensure our financial strength, we continue to execute a disciplined, risk-management hedging program. Our hedging program incorporates both systematic hedges added on a regular basis and discretionary hedges layered in on an opportunistic basis to take advantage of favorable market conditions. We are currently adding 2021 hedge positions at desirable prices where post-merger we currently have approximately 50% of our anticipated oil volumes and 55% of our anticipated gas volumes hedged. We are also actively adding attractive hedges for 2022. Further insulating our cash flow, we continue to examine and, when appropriate, execute attractive regional basis swap hedges to protect price realizations across our portfolio.
In connection with the Merger, we announced expected annual cost savings and margin improvements of $575 million, including legacy Devon cost reductions already underway and additional synergies expected through the integration of the WPX business with that of Devon. With our 2021 capital program, we expect to continue our capital-efficiency focus and our steadfast commitment to capital discipline. To achieve our 2021 capital program objectives that maximize free cash flow, over 70 percent of our 2021 spend will be focused on our highest margin U.S. oil play, the Delaware Basin. We expect to continue to leverage the strengths of our multi-basin strategy and deploy the remainder of our 2021 capital in our remaining core areas of the Eagle Ford, Anadarko Basin, Powder River Basin and Williston Basin. In total, our 2021 operating plan is expected to maintain our oil production at similar levels as 2020 on a pro forma combined basis.
Results of Operations
The following graph, discussion and analysis are intended to provide an understanding of our results of operations and current financial condition. To facilitate the review, these numbers are being presented before consideration of earnings attributable to noncontrolling interests. Analysis of the change in net earnings from continuing operations is shown below and analysis of the change in net earnings from discontinued operations is shown on page 35.
| Continuing Operations |
|---|
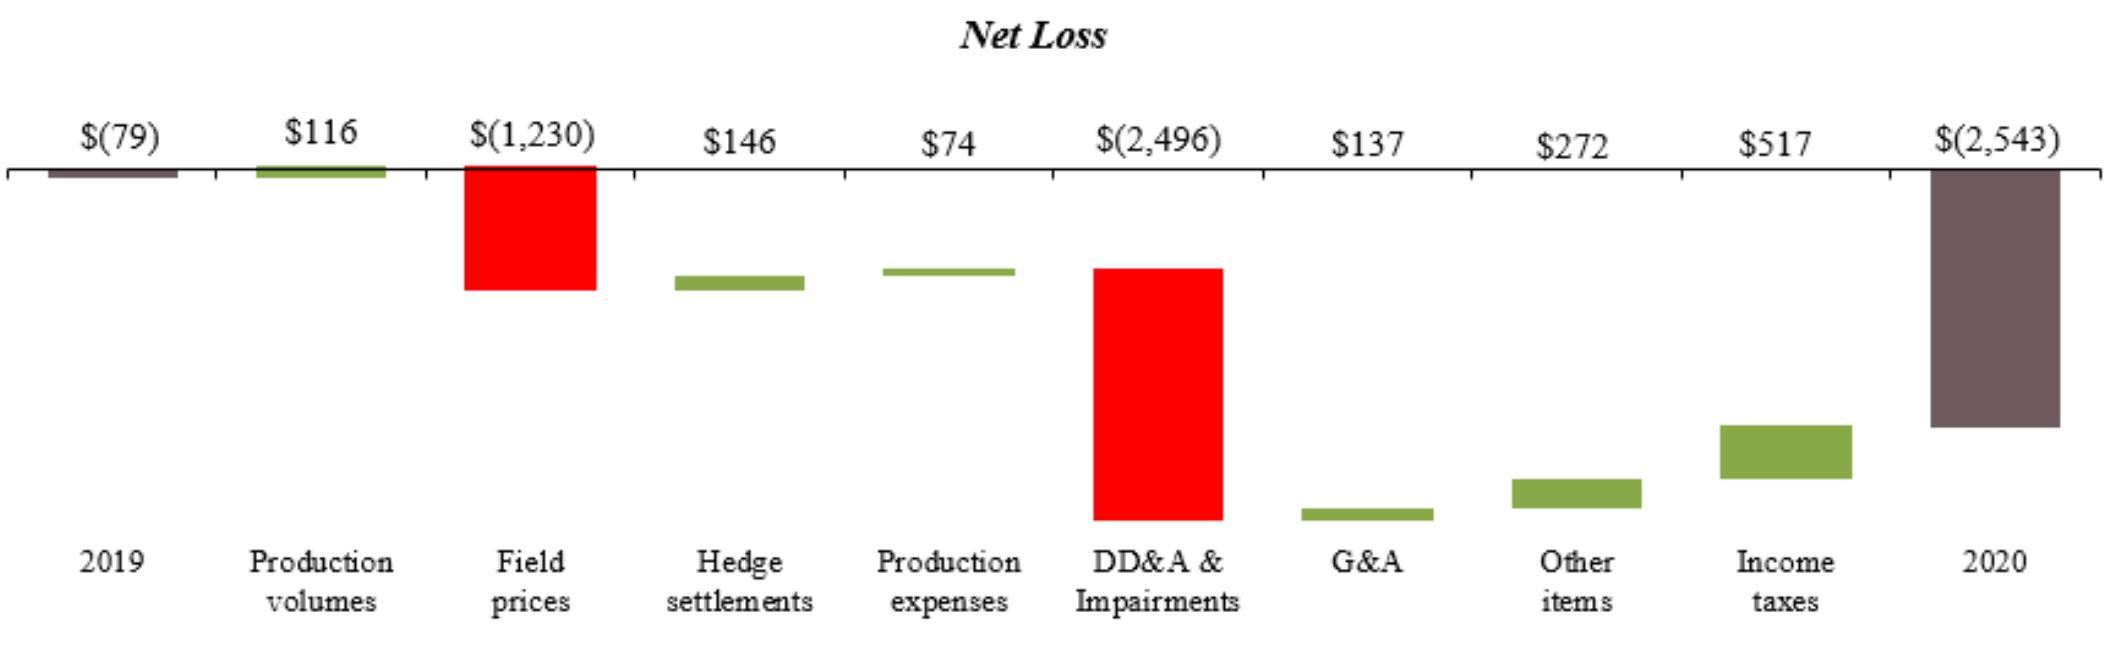
Our 2020 net loss from continuing operations was $2.5 billion, compared to a net loss from continuing operations of $79 million for 2019. The graph below shows the change in net loss from 2019 to 2020. The material changes are further discussed by category on the following pages. To facilitate the review, these numbers are being presented before consideration of earnings attributable to noncontrolling interests.
Production Volumes
| 2020 | % of Total | 2019 | Change | |||||||||||||
|---|---|---|---|---|---|---|---|---|---|---|---|---|---|---|---|---|
| Oil (MBbls/d) | ||||||||||||||||
| Delaware Basin | 85 | 55 | % | 70 | +21 | % | ||||||||||
| Powder River Basin | 19 | 12 | % | 17 | +11 | % | ||||||||||
| Eagle Ford | 24 | 15 | % | 23 | +1 | % | ||||||||||
| Anadarko Basin | 20 | 13 | % | 31 | - 35 | % | ||||||||||
| Other | 7 | 5 | % | 9 | - 25 | % | ||||||||||
| Total | 155 | 100 | % | 150 | +3 | % |
| 2020 | % of Total | 2019 | Change | |||||||||||||
|---|---|---|---|---|---|---|---|---|---|---|---|---|---|---|---|---|
| Gas (MMcf/d) | ||||||||||||||||
| Delaware Basin | 248 | 41 | % | 177 | +40 | % | ||||||||||
| Powder River Basin | 23 | 4 | % | 24 | - 3 | % | ||||||||||
| Eagle Ford | 77 | 13 | % | 79 | - 3 | % | ||||||||||
| Anadarko Basin | 252 | 42 | % | 314 | - 20 | % | ||||||||||
| Other | 3 | 0 | % | 5 | - 34 | % | ||||||||||
| Total | 603 | 100 | % | 599 | +1 | % |
| 2020 | % of Total | 2019 | Change | |||||||||||||
|---|---|---|---|---|---|---|---|---|---|---|---|---|---|---|---|---|
| NGLs (MBbls/d) | ||||||||||||||||
| Delaware Basin | 37 | 47 | % | 27 | +35 | % | ||||||||||
| Powder River Basin | 3 | 3 | % | 2 | +17 | % | ||||||||||
| Eagle Ford | 10 | 14 | % | 11 | - 5 | % | ||||||||||
| Anadarko Basin | 27 | 35 | % | 36 | - 23 | % | ||||||||||
| Other | 1 | 1 | % | 1 | - 40 | % | ||||||||||
| Total | 78 | 100 | % | 77 | +1 | % |
| 2020 | % of Total | 2019 | Change | |||||||||||||
|---|---|---|---|---|---|---|---|---|---|---|---|---|---|---|---|---|
| Combined (MBoe/d) | ||||||||||||||||
| Delaware Basin | 163 | 49 | % | 127 | +28 | % | ||||||||||
| Powder River Basin | 26 | 8 | % | 23 | +14 | % | ||||||||||
| Eagle Ford | 46 | 14 | % | 47 | - 2 | % | ||||||||||
| Anadarko Basin | 90 | 27 | % | 119 | - 24 | % | ||||||||||
| Other | 8 | 2 | % | 11 | - 26 | % | ||||||||||
| Total | 333 | 100 | % | 327 | +2 | % |
From 2019 to 2020, a 2% increase in production volumes contributed to a $116 million increase in earnings. Continued development in the Delaware Basin and Powder River Basin resulted in higher production volumes during 2020 compared to 2019. These increases were partially offset by significantly lower activity in the Anadarko Basin. Additionally, 2020 capital expenditures were reduced by 45% in response to the challenged macro-economic environment, negatively impacting volumes across the portfolio.
Due to the Merger and increased activity across our portfolio, we expect volumes to increase in 2021 and range from approximately 543 to 580 MBoe/d.
Field Prices
| 2020 | Realization | 2019 | Change | |||||||||||||
|---|---|---|---|---|---|---|---|---|---|---|---|---|---|---|---|---|
| Oil (per Bbl) | ||||||||||||||||
| WTI index | $ | 39.59 | $ | 57.02 | - 31 | % | ||||||||||
| Realized price, unhedged | $ | 35.95 | 91% | $ | 54.73 | - 34 | % | |||||||||
| Cash settlements | $ | 4.81 | $ | 1.71 | ||||||||||||
| Realized price, with hedges | $ | 40.76 | 103% | $ | 56.44 | - 28 | % |
| 2020 | Realization | 2019 | Change | |||||||||||||
|---|---|---|---|---|---|---|---|---|---|---|---|---|---|---|---|---|
| Gas (per Mcf) | ||||||||||||||||
| Henry Hub index | $ | 2.08 | $ | 2.63 | - 21 | % | ||||||||||
| Realized price, unhedged | $ | 1.48 | 71% | $ | 1.79 | - 17 | % | |||||||||
| Cash settlements | $ | 0.18 | $ | 0.14 | ||||||||||||
| Realized price, with hedges | $ | 1.66 | 80% | $ | 1.93 | - 14 | % |
| 2020 | Realization | 2019 | Change | |||||||||||||
|---|---|---|---|---|---|---|---|---|---|---|---|---|---|---|---|---|
| NGLs (per Bbl) | ||||||||||||||||
| Mont Belvieu blended index (1) | $ | 15.91 | $ | 19.22 | - 17 | % | ||||||||||
| Realized price, unhedged | $ | 11.72 | 74% | $ | 15.21 | - 23 | % | |||||||||
| Cash settlements | $ | 0.18 | $ | 1.61 | ||||||||||||
| Realized price, with hedges | $ | 11.90 | 75% | $ | 16.82 | - 29 | % |
| (1) | Based upon composition of our NGL barrel. |
|---|
| 2020 | 2019 | Change | ||||||||||
|---|---|---|---|---|---|---|---|---|---|---|---|---|
| Combined (per Boe) | ||||||||||||
| Realized price, unhedged | $ | 22.10 | $ | 31.93 | - 31 | % | ||||||
| Cash settlements | $ | 2.60 | $ | 1.43 | ||||||||
| Realized price, with hedges | $ | 24.70 | $ | 33.36 | - 26 | % |
From 2019 to 2020, field prices contributed to a $1.2 billion decrease in earnings. Unhedged realized oil, gas and NGL prices decreased primarily due to lower WTI, Henry Hub and Mont Belvieu index prices. These decreases were partially offset by favorable hedge cash settlements across each of our products.
Hedge Settlements
| 2020 | 2019 | Change | ||||||||||
|---|---|---|---|---|---|---|---|---|---|---|---|---|
| Q | ||||||||||||
| Oil | $ | 271 | $ | 93 | +191 | % | ||||||
| Natural gas | 40 | 31 | +29 | % | ||||||||
| NGL | 5 | 46 | - 89 | % | ||||||||
| Total cash settlements (1) | $ | 316 | $ | 170 | +86 | % |
| (1) | Included as a component of oil, gas and NGL derivatives on the consolidated statements of comprehensive earnings. |
|---|
Cash settlements as presented in the tables above represent realized gains or losses related to the instruments described in Note 3 in “Item 8. Financial Statements and Supplementary Data” of this report.
Production Expenses
| 2020 | 2019 | Change | ||||||||||
|---|---|---|---|---|---|---|---|---|---|---|---|---|
| LOE | $ | 425 | $ | 462 | - 8 | % | ||||||
| Gathering, processing & transportation | 508 | 463 | +10 | % | ||||||||
| Production taxes | 170 | 251 | - 32 | % | ||||||||
| Property taxes | 20 | 21 | - 5 | % | ||||||||
| Total | $ | 1,123 | $ | 1,197 | - 6 | % | ||||||
| Per Boe: | ||||||||||||
| LOE | $ | 3.49 | $ | 3.87 | - 10 | % | ||||||
| Gathering, processing & transportation | $ | 4.17 | $ | 3.88 | +7 | % | ||||||
| Percent of oil, gas and NGL sales: | ||||||||||||
| Production taxes | 6.3 | % | 6.6 | % | - 4 | % |
Gathering, processing and transportation costs increased in 2020 compared to 2019 due to higher volumes and Anadarko volume commitments which expired at the end of 2020. These increases were offset by lower production taxes resulting from lower oil, gas and NGL sales. Additionally, LOE costs decreased due to reduced activity levels and cost saving initiatives resulting from the challenged macro-economic environment.
Due to the Merger and increased activity across our portfolio, we expect 2021 production expenses to be approximately $2 billion.
Field-Level Cash Margin
The table below presents the field-level cash margin for each of our operating areas. Field-level cash margin is computed as oil, gas and NGL revenues less production expenses and is not prepared in accordance with GAAP. A reconciliation to the comparable GAAP measures is found in “Non-GAAP Measures” in this Item 7. The changes in production volumes, field prices and production expenses, shown above, had the following impacts on our field-level cash margins by asset.
| 2020 | $ per BOE | 2019 | $ per BOE | |||||||||||||
|---|---|---|---|---|---|---|---|---|---|---|---|---|---|---|---|---|
| Field-level cash margin (non-GAAP) | ||||||||||||||||
| Delaware Basin | $ | 946 | $ | 15.86 | $ | 1,157 | $ | 25.00 | ||||||||
| Powder River Basin | 159 | $ | 16.93 | 246 | $ | 28.64 | ||||||||||
| Eagle Ford | 229 | $ | 13.46 | 446 | $ | 25.80 | ||||||||||
| Anadarko Basin | 204 | $ | 6.22 | 685 | $ | 15.81 | ||||||||||
| Other | 34 | $ | 10.93 | 78 | $ | 20.56 | ||||||||||
| Total | $ | 1,572 | $ | 12.89 | $ | 2,612 | $ | 21.90 |
DD&A and Asset Impairments
| 2020 | 2019 | Change | |||||||||||
|---|---|---|---|---|---|---|---|---|---|---|---|---|---|
| Oil and gas per Boe | $ | 9.90 | $ | 11.72 | - 16 | % | |||||||
| Oil and gas | $ | 1,207 | $ | 1,398 | - 14 | % | |||||||
| Other property and equipment | 93 | 99 | - 6 | % | |||||||||
| Total | $ | 1,300 | $ | 1,497 | - 13 | % | |||||||
| Asset impairments | $ | 2,693 | $ | — | N/M |
Asset impairments were $2.7 billion in 2020 due to significant decreases in commodity prices since the end of 2019 resulting primarily from the COVID-19 pandemic. For additional information, see Note 5 in “Item 8. Financial Statements and Supplementary Data” of this report.
DD&A decreased in 2020 compared to 2019 due to lower rates resulting from impairments recorded in the first quarter of 2020.
General and Administrative Expense
| 2020 | 2019 | Change | ||||||||||
|---|---|---|---|---|---|---|---|---|---|---|---|---|
| Labor and benefits | $ | 206 | $ | 307 | - 33 | % | ||||||
| Non-labor | 132 | 168 | - 21 | % | ||||||||
| Total | $ | 338 | $ | 475 | - 29 | % |
Labor and benefits and non-labor expenses decreased $137 million primarily as a result of continued workforce reductions and cost savings initiatives. For additional information on the workforce reductions, see Note 6 in “Item 8. Financial Statements and Supplementary Data” of this report.
Subsequent to the Merger, we expect 2021 general and administrative expense to range from approximately $400 to $420 million.
Other Items
| 2020 | 2019 | Change in earnings | ||||||||||
|---|---|---|---|---|---|---|---|---|---|---|---|---|
| Commodity hedge valuation changes (1) | $ | (161 | ) | $ | (624 | ) | $ | 463 | ||||
| Marketing and midstream operations | (35 | ) | 53 | (88 | ) | |||||||
| Exploration expenses | 167 | 58 | (109 | ) | ||||||||
| Asset dispositions | (1 | ) | (48 | ) | (47 | ) | ||||||
| Net financing costs | 270 | 250 | (20 | ) | ||||||||
| Restructuring and transaction costs | 49 | 84 | 35 | |||||||||
| Other expenses | (34 | ) | 4 | 38 | ||||||||
| $ | 272 |
| (1) | Included as a component of oil, gas and NGL derivatives on the consolidated statements of comprehensive earnings. |
|---|
We recognize fair value changes on our oil, gas and NGL derivative instruments in each reporting period. The changes in fair value resulted from new positions and settlements that occurred during each period, as well as the relationship between contract prices and the associated forward curves.
Marketing and midstream operations decreased $88 million in 2020 compared to 2019 primarily due to lower commodity prices resulting from the challenged macro-economic environment, as well as downstream product inventory impairments of $17 million recognized in 2020.
Exploration expense increased $109 million in 2020 compared to 2019 primarily due to recognizing $152 million in unproved asset impairments in 2020 compared to $18 million in 2019.
Restructuring and transaction costs in 2020 and 2019 primarily relate to workforce reductions and the associated employee severance benefits related to announced cost reduction plans. Restructuring and transaction costs in 2020 also included approximately $8 million of transaction costs associated with the Merger. We expect to incur additional restructuring and transaction costs in 2021 related to the Merger of approximately $160 million to $200 million. These costs primarily relate to planned workforce reductions and the associated employee severance benefits, costs to modify or abandon vendor contracts and the acceleration of certain employee benefits triggered by the Merger.
Income Taxes
| 2020 | 2019 | |||||||
|---|---|---|---|---|---|---|---|---|
| Current benefit | $ | (219 | ) | $ | (5 | ) | ||
| Deferred benefit | (328 | ) | (25 | ) | ||||
| Total benefit | $ | (547 | ) | $ | (30 | ) | ||
| Effective income tax rate | 18 | % | 28 | % |
For discussion on income taxes, see Note 8 in “Item 8. Financial Statements and Supplementary Data” of this report.
| Discontinued Operations |
|---|
The table below presents key components from discontinued operations for the time periods presented. Discontinued operations include the Canadian business that Devon sold in June 2019 and also the Barnett Shale assets that Devon sold in October 2020. For additional information on discontinued operations, see Note 19 in “Part I. Financial Information – Item 1. Financial Statements” of this report.
| 2020 | 2019 | |||||||
| Oil, gas and NGL sales | $ | 263 | $ | 1,227 | ||||
| Oil, gas and NGL derivatives | $ | — | $ | (113 | ) | |||
| Production expenses | $ | 214 | $ | 599 | ||||
| Asset impairments | $ | 182 | $ | 785 | ||||
| Asset dispositions | $ | 1 | $ | (222 | ) | |||
| Financing costs, net | $ | (3 | ) | $ | 87 | |||
| Restructuring and transaction costs | $ | 9 | $ | 248 | ||||
| Loss from discontinued operations before income taxes | $ | (152 | ) | $ | (632 | ) | ||
| Income tax benefit | $ | (24 | ) | $ | (358 | ) | ||
| Loss from discontinued operations, net of tax | $ | (128 | ) | $ | (274 | ) | ||
| Production (MMBoe): | ||||||||
| Barnett Shale | 27 | 37 | ||||||
| Canada | — | 19 | ||||||
| Total production | 27 | 56 | ||||||
| Realized price, unhedged (per Boe) - Barnett Shale | $ | 9.89 | $ | 13.30 | ||||
| Realized price, unhedged (per Boe) - Canada | N/A | $ | 38.98 |
Net earnings (loss) from discontinued operations, net of tax increased approximately $146 million. This change is primarily due to the timing of Devon’s completion of its divestiture of its Canadian business in the second quarter of 2019 as well as the closing of the Barnett Shale divestiture in the fourth quarter of 2020. During 2019, Devon recognized a $223 million gain on the sale of its Canadian operations as well as income tax benefits of $216 million and $142 million related to its Canadian business and Barnett Shale properties, respectively. These increases were largely offset by a decrease attributable to a proved oil and gas property impairment of approximately $748 million related to the Barnett Shale in the fourth quarter of 2019. Due to the timing of the completion of these divestitures, there was minimal activity of a comparable nature during 2020.
Capital Resources, Uses and Liquidity
Sources and Uses of Cash
The following table presents the major changes in cash and cash equivalents for the time periods presented below.
| Year ended December 31, | ||||||||
|---|---|---|---|---|---|---|---|---|
| 2020 | 2019 | |||||||
| Operating cash flow from continuing operations | $ | 1,464 | $ | 2,043 | ||||
| Divestitures of property and equipment | 34 | 390 | ||||||
| Capital expenditures | (1,153 | ) | (1,910 | ) | ||||
| Acquisitions of property and equipment | (8 | ) | (31 | ) | ||||
| Debt activity, net | — | (162 | ) | |||||
| Repurchases of common stock | (38 | ) | (1,849 | ) | ||||
| Common stock dividends | (257 | ) | (140 | ) | ||||
| Contributions from noncontrolling interests | 21 | 116 | ||||||
| Distributions to noncontrolling interests | (14 | ) | — | |||||
| Other | (18 | ) | (26 | ) | ||||
| Net change in cash, cash equivalents and restricted cash from discontinued operations | 362 | 967 | ||||||
| Net change in cash, cash equivalents and restricted cash | $ | 393 | $ | (602 | ) | |||
| Cash, cash equivalents and restricted cash at end of period | $ | 2,237 | $ | 1,844 |
Operating Cash Flow – Continuing Operations
Our operating cash flow decreased $579 million, or 28%, to approximately $1.5 billion from 2019 to 2020. In 2020, our operating cash flow completely funded our capital expenditures program, dividend payments and repurchases of our common stock. This allowed us to use available cash balances to fund other capital uses.
Divestitures of Property and Investments – Continuing Operations
During 2020 and 2019, as part of our announced divestiture programs, we sold non-core U.S. upstream assets for $34 million and $390 million, respectively. For further discussion, see Note 2 in “Item 8. Financial Statements and Supplementary Data” of this report.
Capital Expenditures
The following table summarizes our capital expenditures and property acquisitions.
| Year ended December 31, | ||||||||
|---|---|---|---|---|---|---|---|---|
| 2020 | 2019 | |||||||
| Delaware Basin | $ | 734 | $ | 912 | ||||
| Powder River Basin | 172 | 308 | ||||||
| Eagle Ford | 172 | 194 | ||||||
| Anadarko Basin | 23 | 396 | ||||||
| Other | 8 | 36 | ||||||
| Total oil and gas | 1,109 | 1,846 | ||||||
| Midstream | 31 | 42 | ||||||
| Other | 13 | 22 | ||||||
| Total capital expenditures | $ | 1,153 | $ | 1,910 | ||||
| Acquisitions | $ | 8 | $ | 31 |
Capital expenditures consist primarily of amounts related to our oil and gas exploration and development operations, midstream operations and other corporate activities. The vast majority of our capital expenditures are for the acquisition, drilling and development of oil and gas properties. Our capital program is designed to operate within or near operating cash flow and may fluctuate with changes to commodity prices and other factors impacting cash flow. This is evidenced by our operating cash flow fully funding capital expenditures in 2020 and 2019. Our capital expenditures are lower in 2020 primarily due to a 45% reduction in capital spend in response to the COVID-19 pandemic and the associated macroeconomic implications.
Debt Activity, Net
During 2019, our debt decreased $162 million due to the repayment of our 6.30% senior notes at maturity.
Repurchases of Common Stock and Shareholder Distributions
We repurchased 2.2 million shares of common stock for $38 million in 2020 and 68.6 million shares of common stock for $1.8 billion in 2019 under a share repurchase program authorized by our Board of Directors. For additional information, see Note 18 in “Item 8. Financial Statements and Supplementary Data” in this report.
Devon paid common stock dividends of $257 million and $140 million during 2020 and 2019, respectively. Dividends paid on common stock during 2020 include a $0.26 special dividend paid to shareholders on October 1, 2020, which totaled $97 million. Beginning with the second quarter of 2020, we increased our quarterly dividend 22% to $0.11 per share. We previously increased our quarterly dividend to $0.09 per share commencing with the second quarter of 2019. For additional information, see Note 18 in “Item 8. Financial Statements and Supplementary Data” of this report.
Contributions from Noncontrolling Interests
During 2020 and 2019, we received approximately $21 million and $116 million, respectively, in cash contributions from our partner in CDM.
Distributions to Noncontrolling Interests
During 2020, we paid approximately $14 million in cash distributions to our partner in CDM.
Cash Flows from Discontinued Operations
All cash flows in the following table relate to activities from discontinued operations for the time periods presented. Discontinued operations include our Canadian business that Devon sold in June 2019 and the Barnett Shale assets that Devon divested in October 2020.
| Year ended December 31, | ||||||||
|---|---|---|---|---|---|---|---|---|
| 2020 | 2019 | |||||||
| Operating activities | $ | (110 | ) | $ | 28 | |||
| Divestitures of property and equipment - Canadian operations | 2 | 2,608 | ||||||
| Divestitures of property and equipment - Barnett Shale assets | 480 | — | ||||||
| Capital expenditures and other | (1 | ) | (136 | ) | ||||
| Investing activities | 481 | 2,472 | ||||||
| Debt activity, net | — | (1,552 | ) | |||||
| Other | — | (26 | ) | |||||
| Financing activities | — | (1,578 | ) | |||||
| Settlements of intercompany foreign denominated assets/liabilities | — | 32 | ||||||
| Other | (9 | ) | 13 | |||||
| Effect of exchange rate changes on cash | (9 | ) | 45 | |||||
| Net change in cash, cash equivalents and restricted cash of discontinued operations | $ | 362 | $ | 967 |
Operating cash flow in 2020 decreased $138 million as a result of the divestitures referenced above and cash taxes paid related to divested Canadian operations.
On October 1, 2020, Devon completed the sale of its Barnett Shale assets for proceeds, net of purchase price adjustments, of $490 million. On June 27, 2019, Devon completed the sale of substantially all its oil and gas assets and operations in Canada for proceeds of $2.6 billion.
Cash flows from financing activities includes the $1.5 billion of senior notes retired prior to maturity in 2019.
Liquidity
The business of exploring for, developing and producing oil and natural gas is capital intensive. Because oil, natural gas and NGL reserves are a depleting resource, we, like all upstream operators, must continually make capital investments to grow and even sustain production. Generally, our capital investments are focused on drilling and completing new wells and maintaining production from existing wells. At opportunistic times, we also acquire operations and properties from other operators or land owners to enhance our existing portfolio of assets.
On January 7, 2021, Devon and WPX completed an all-stock merger of equals. WPX is an oil and gas exploration and production company with assets in the Delaware Basin in Texas and New Mexico and the Williston Basin in North Dakota. On the closing date of the Merger, each share of WPX common stock was automatically converted into the right to receive 0.5165 of a share of Devon common stock. Based on the closing price of Devon’s common stock on January 7, 2021, the total value of the Devon common stock issued to holders of WPX common stock as part of this transaction was approximately $5.4 billion. For additional information, please see Note 2 in “Item 8. Financial Statements and Supplementary Data” of this report.
With this strategic merger, we are accelerating our transition to a cash-return business model, which moderates growth, emphasizes capital efficiencies and prioritizes cash returns to shareholders. These principles will position Devon to be a consistent builder of economic value through the cycle. The post-merger scalability is expected to enhance Devon’s free cash flow, credit profile and decrease the overall cost of capital.
Historically, our primary sources of capital funding and liquidity have been our operating cash flow, cash on hand and asset divestiture proceeds. Additionally, we maintain a commercial paper program, supported by our revolving line of credit, which can be accessed as needed to supplement operating cash flow and cash balances. If needed, we can also issue debt and equity securities, including through transactions under our shelf registration statement filed with the SEC. We estimate the combination of our sources of capital will continue to be adequate to fund our planned post-merger capital requirements as discussed in this section as well as accelerate our cash-return business model.
Operating Cash Flow
Key inputs into determining our planned capital investment is the amount of cash we hold and operating cash flow we expect to generate over the next one to three or more years. At the end of 2020, we held approximately $2.2 billion of cash, inclusive of $190 million of cash restricted for retained obligations related to divested assets. Our operating cash flow forecasts are sensitive to many variables and include a measure of uncertainty as these variables may differ from our expectations.
Commodity Prices – The most uncertain and volatile variables for our operating cash flow are the prices of the oil, gas and NGLs we produce and sell. Prices are determined primarily by prevailing market conditions. Regional and worldwide economic activity, weather and other highly variable factors influence market conditions for these products. These factors, which are difficult to predict, create volatility in prices and are beyond our control.
To mitigate some of the risk inherent in prices, we utilize various derivative financial instruments to protect a portion of our production against downside price risk. We hedge our production in a manner that systematically places hedges for several quarters in advance, allowing us to maintain a disciplined risk management program as it relates to commodity price volatility. We supplement the systematic hedging program with discretionary hedges that take advantage of favorable market conditions. The key terms to our oil, gas and NGL derivative financial instruments as of December 31, 2020 are presented in Note 3 in “Item 8. Financial Statements and Supplementary Data” of this report.
Further, when considering the current commodity price environment and our current hedge position, we expect to achieve our capital investment priorities. Additionally, as commodity prices begin to recover from the COVID-19 pandemic, we remain committed to a maintenance capital program for the foreseeable future. We do not intend to add any growth projects until market fundamentals recover, excess inventory clears up and OPEC+ curtailed volumes are effectively absorbed by the world markets.
Operating Expenses – Commodity prices can also affect our operating cash flow through an indirect effect on operating expenses. Significant commodity price decreases can lead to a decrease in drilling and development activities. As a result, the demand and cost for people, services, equipment and materials may also decrease, causing a positive impact on our cash flow as the prices paid for services and equipment decline. However, the inverse is also generally true during periods of rising commodity prices.
Cost savings from 2020 initiatives and synergies resulting from the Merger are expected to be attained through cost reductions and efficiencies related to our capital programs, G&A, financing costs and production expenses. We anticipate the planned $575 million reduction of annualized costs will occur by year-end 2021. Approximately 35% of the reduced costs are related to our capital programs and the remainder relate to our operating expenses, including G&A, interest expense and production expenses.
Restructuring and Transaction Related Costs – Merger-related restructuring and transaction costs cash outflows are expected to range from $220 million to $255 million. These payments will relate to workforce reductions and the associated employee severance benefits, costs to modify or abandon vendor contracts and the acceleration of certain employee benefits triggered by the Merger.
Credit Losses – Our operating cash flow is also exposed to credit risk in a variety of ways. This includes the credit risk related to customers who purchase our oil, gas and NGL production, the collection of receivables from our joint interest partners for their proportionate share of expenditures made on projects we operate and counterparties to our derivative financial contracts. We utilize a variety of mechanisms to limit our exposure to the credit risks of our customers, partners and counterparties. Such mechanisms include, under certain conditions, requiring letters of credit, prepayments or collateral postings.
Assumption and Repayment of WPX Debt
In February 2021, Devon redeemed bonds issued by WPX with a maturity date of 2022 pursuant to a make whole call provision in the related indenture. The total principal related to this redemption was approximately $43 million, with an additional $2 million cash premium paid to complete the make whole redemption.
In conjunction with the Merger closing on January 7, 2021, Devon is assuming a principal value of $3.3 billion of WPX debt.
Credit Availability
We have $3.0 billion of available borrowing capacity under our Senior Credit Facility at December 31, 2020. The Senior Credit Facility matures on October 5, 2024, with the option to extend the maturity date by two additional one-year periods subject to lender consent. Subsequent to October 5, 2023, the borrowing capacity decreases to $2.8 billion. The Senior Credit Facility supports our $3.0 billion of short-term credit under our commercial paper program. As of December 31, 2020, there were no borrowings under our commercial paper program. See Note 14 in “Item 8. Financial Statements and Supplementary Data” of this report for further discussion.
The Senior Credit Facility contains only one material financial covenant. This covenant requires us to maintain a ratio of total funded debt to total capitalization, as defined in the credit agreement, of no more than 65%. As of December 31, 2020, we were in compliance with this covenant with a 25% debt-to-capitalization ratio.
Our access to funds from the Senior Credit Facility is not restricted under any “material adverse effect” clauses. It is not uncommon for credit agreements to include such clauses. These clauses can remove the obligation of the banks to fund the credit line if any condition or event would reasonably be expected to have a material and adverse effect on the borrower’s financial condition, operations, properties or business considered as a whole, the borrower’s ability to make timely debt payments or the enforceability of material terms of the credit agreement. While our credit facility includes covenants that require us to report a condition or event having a material adverse effect, the obligation of the banks to fund the credit facility is not conditioned on the absence of a material adverse effect.
As market conditions warrant and subject to our contractual restrictions, liquidity position and other factors, we may from time to time seek to repurchase or retire our outstanding debt through cash purchases and/or exchanges for other debt or equity securities in open market transactions, privately negotiated transactions, by tender offer or otherwise. Any such cash repurchases by us may be funded by cash on hand or incurring new debt. The amounts involved in any such transactions, individually or in the aggregate, may be material. Furthermore, any such repurchases or exchanges may result in our acquiring and retiring a substantial amount of such indebtedness, which would impact the trading liquidity of such indebtedness.
Debt Ratings
We receive debt ratings from the major ratings agencies in the U.S. In determining our debt ratings, the agencies consider a number of qualitative and quantitative items including, but not limited to, commodity pricing levels, our liquidity, asset quality, reserve mix, debt levels, cost structure, planned asset sales and production growth opportunities. Our credit rating from Standard and Poor’s Financial Services is BBB- with a stable outlook. Our credit rating from Fitch is BBB with a positive outlook. Our credit rating from Moody’s Investor Service is Ba1 with a stable outlook. Any rating downgrades may result in additional letters of credit or cash collateral being posted under certain contractual arrangements.
There are no “rating triggers” in any of our contractual debt obligations that would accelerate scheduled maturities should our debt rating fall below a specified level. However, a downgrade could adversely impact our interest rate on any credit facility borrowings and the ability to economically access debt markets in the future.
Fixed Plus Variable Dividend
Following the closing of the Merger, Devon initiated a new “fixed plus variable” dividend strategy. The fixed dividend is currently paid quarterly at a rate of $0.11 per share, and the Board of Directors will consider a number of factors when setting the quarterly dividend, if any, including a general target of paying out approximately 10% of operating cash flow through the fixed dividend. In addition to the fixed quarterly dividend, Devon may pay a variable dividend up to 50 percent of its excess free cash flow, which is a non-GAAP measure. Each quarter’s excess free cash flow is computed as operating cash flow (a GAAP measure) before balance sheet changes, less capital expenditures and the fixed dividend. The declaration and payment of any future dividend, whether fixed or variable, will remain at the full discretion of our Board of Directors and will depend on Devon’s financial results, cash requirements, future prospects, COVID-19 impacts and other factors deemed relevant by the Board.
In February 2021, Devon announced an approximately $128 million variable cash dividend in the amount of $0.19 per share payable in the first quarter of 2021. The variable dividend is in addition to the fixed quarterly dividend of $0.11 per share.
Capital Expenditures
Our 2021 post-merger exploration and development budget is expected to be approximately $1.6 billion to $1.8 billion.
Contractual Obligations
As of December 31, 2020, our material contractual obligations include debt, interest expense, asset retirement obligations, lease obligations, retained obligations related to our Barnett Shale assets and Canadian business, operational agreements, drilling and facility obligations and various tax obligations. As discussed above, we estimate the combination of our sources of capital will continue to be adequate to fund our short- and long-term contractual obligations, including the obligations we assumed through the Merger. See Notes 6, 8, 14, 15, 16 and 20 in “Item 8. Financial Statements and Supplementary Data” of this report for further discussion.
Contingencies and Legal Matters
For a detailed discussion of contingencies and legal matters, see Note 20 in “Item 8. Financial Statements and Supplementary Data” of this report.
Critical Accounting Estimates
The preparation of financial statements in conformity with accounting principles generally accepted in the U.S. requires us to make estimates, judgments and assumptions that affect the reported amounts of assets and liabilities and disclosure of contingent assets and liabilities at the date of the financial statements and the reported amounts of revenues and expenses during the reporting period. Actual amounts could differ from these estimates, and changes in these estimates are recorded when known. We consider the following to be our most critical accounting estimates that involve judgment and have reviewed these critical accounting estimates with the Audit Committee of our Board of Directors.
Oil and Gas Assets Accounting, Classification, Reserves & Valuation
Successful Efforts Method of Accounting and Classification
We utilize the successful efforts method of accounting for our oil and natural gas exploration and development activities which requires management’s assessment of the proper designation of wells and associated costs as developmental or exploratory. This classification assessment is dependent on the determination and existence of proved reserves, which is a critical estimate discussed in the section below. The classification of developmental and exploratory costs has a direct impact on the amount of costs we initially recognize as exploration expense or capitalize, then subject to DD&A calculations and impairment assessments and valuations.
Once a well is drilled, the determination that proved reserves have been discovered may take considerable time and requires both judgment and application of industry experience. Development wells are always capitalized. Costs associated with drilling an exploratory well are initially capitalized, or suspended, pending a determination as to whether proved reserves have been found. At the end of each quarter, management reviews the status of all suspended exploratory drilling costs to determine whether the costs should continue to remain capitalized or shall be expensed. When making this determination, management considers current activities, near-term plans for additional exploratory or appraisal drilling and the likelihood of reaching a development program. If management determines future development activities and the determination of proved reserves are unlikely to occur, the associated suspended exploratory well costs are recorded as dry hole expense and reported in exploration expense in the consolidated statements of comprehensive earnings. Otherwise, the costs of exploratory wells remain capitalized. At December 31, 2020, all suspended well costs have been suspended for less than one year.
Similar to the evaluation of suspended exploratory well costs, costs for undeveloped leasehold, for which reserves have not been proven, must also be evaluated for continued capitalization or impairment. At the end of each quarter, management assesses undeveloped leasehold costs for impairment by considering future drilling plans, drilling activity results, commodity price outlooks, planned future sales or expiration of all or a portion of such projects. At December 31, 2020, Devon had approximately $82 million of undeveloped leasehold. Of the remaining undeveloped leasehold costs at December 31, 2020, approximately $1 million is scheduled to expire in 2021. The leasehold expiring in 2021 relates to areas in which Devon is actively drilling. If our drilling is not successful, this leasehold could become partially or entirely impaired.
Reserves
Our estimates of proved and proved developed reserves are a major component of DD&A calculations. Additionally, our proved reserves represent the element of these calculations that require the most subjective judgments. Estimates of reserves are forecasts based on engineering data, projected future rates of production and the timing of future expenditures. The process of estimating oil, gas and NGL reserves requires substantial judgment, resulting in imprecise determinations, particularly for new discoveries. Different reserve engineers may make different estimates of reserve quantities based on the same data. Our engineers prepare our reserve estimates. We then subject certain of our reserve estimates to audits performed by a third-party petroleum consulting firm. In 2020, 88% of our reserves were subjected to such an audit.
The passage of time provides more qualitative information regarding estimates of reserves, when revisions are made to prior estimates to reflect updated information. In the past five years, annual performance revisions to our reserve estimates, which have been both increases and decreases in individual years, have averaged less than 5% of the previous year’s estimate. However, there can be no assurance that more significant revisions will not be necessary in the future. The data for a given reservoir may also change substantially over time as a result of numerous factors, including, but not limited to, additional development activity, evolving production history and continual reassessment of the viability of production under varying economic conditions.
Valuation of Long-Lived Assets
Long-lived assets used in operations, including proved and unproved oil and gas properties, are depreciated and assessed for impairment annually or whenever changes in facts and circumstances indicate a possible significant deterioration in future cash flows is expected to be generated by an asset group. For DD&A calculations and impairment assessments, management groups individual assets based on a judgmental assessment of the lowest level (“common operating field”) for which there are identifiable cash flows that are largely independent of the cash flows of other groups of assets. The determination of common operating fields is largely based on geological structural features or stratigraphic condition, which requires judgment. Management also considers the nature of production, common infrastructure, common sales points, common processing plants, common regulation and management oversight to make common operating field determinations. These determinations impact the amount of DD&A recognized each period and could impact the determination and measurement of a potential asset impairment.
Management evaluates assets for impairment through an established process in which changes to significant assumptions such as prices, volumes and future development plans are reviewed. If, upon review, the sum of the undiscounted pre-tax cash flows is less than the carrying value of the asset group, the carrying value is written down to estimated fair value. Because there usually is a lack of quoted market prices for long-lived assets, the fair value of impaired assets is typically determined based on the present values of expected future cash flows using discount rates believed to be consistent with those used by principal market participants. The expected future cash flows used for impairment reviews and related fair value calculations are typically based on judgmental assessments of future production volumes, commodity prices, operating costs and capital investment plans, considering all available information at the date of review. The expected future cash flows used for impairment reviews include future production volumes associated with proved producing and risk-adjusted proved undeveloped, probable and possible reserves.
Besides the risk-adjusted estimates of reserves and future production volumes, future commodity prices are the largest driver in the variability of undiscounted pre-tax cash flows. For our impairment determinations, we historically have utilized NYMEX forward strip prices for the first five years and applied internally generated price forecasts for subsequent years. In response to the COVID-19 pandemic, the NYMEX forward market became highly illiquid as evidenced by materially reduced trading volumes for periods beyond 2021. Therefore, we altered our price forecast assumptions to perform our March 31, 2020 impairment computations. Specifically, we supplemented the NYMEX forward strip prices with price forecasts published by reputable investment banks and reservoir engineering firms to estimate our future revenues as of March 31, 2020.
We also estimate and escalate or de-escalate future capital and operating costs by using a method that correlates cost movements to price movements similar to recent history. To measure indicated impairments, we use a market-based weighted-average cost of capital to discount the future net cash flows. Changes to any of the reserves or market-based assumptions can significantly affect estimates of undiscounted and discounted pre-tax cash flows and impact the recognition and amount of impairments.
Reduced demand from the COVID-19 pandemic and management of production levels from OPEC caused WTI pricing to decrease more than 60% during the first quarter of 2020. As a result, we reduced our planned 2020 capital investment 45%. With materially lower commodity prices and reduced near-term investment, we assessed all our oil and gas fields for impairment as of March 31, 2020 and recognized proved and unproved impairments totaling $2.8 billion. The impairments relate to our Anadarko Basin and Rockies fields in which our basis included acquisitions completed in 2016 and 2015, respectively, when commodity prices were much higher than they are today.
We assessed our Eagle Ford asset for impairment as of June 30, 2020 and September 30, 2020 utilizing the same methodology we applied for the impairment assessments for all of our and oil and gas fields in the first quarter of 2020. Our Eagle Ford asset’s sum of undiscounted cash flows exceeded the carrying value indicating no impairment as of September 30, 2020. Further, as a result of improved oil pricing, the cushion increased significantly from March 31, 2020 to December 31, 2020. If prices significantly deteriorate and/or management lowers the planned capital investment in the Eagle Ford field, our Eagle Ford asset could be subject to a material impairment of capitalized costs.
Income Taxes
The amount of income taxes recorded requires interpretations of complex rules and regulations of federal, state, provincial and foreign tax jurisdictions. We recognize current tax expense based on estimated taxable income for the current period and the applicable statutory tax rates. We routinely assess potential uncertain tax positions and, if required, estimate and establish accruals for such amounts. The accruals for deferred tax assets and liabilities are often based on assumptions that are subject to a significant amount of judgment by management. These assumptions and judgments are reviewed and adjusted as facts and circumstances change. Material changes to our income tax accruals may occur in the future based on the progress of ongoing audits, changes in legislation or resolution of pending matters. We have recognized deferred tax assets and liabilities for temporary differences, operating losses and other tax carryforwards. We routinely assess our deferred tax assets and reduce such assets by a valuation allowance if we deem it is more likely than not that some portion or all of the deferred tax assets will not be realized. Due to an unprecedented downturn in the commodity price environment and the resulting asset impairments, Devon had significant deferred tax assets at March 31, 2020. Accordingly, we reassessed the realizability of our deferred tax assets in future periods and recorded a 100% valuation allowance against our net deferred tax assets during the first quarter of 2020. As of December 31, 2020, we remain in a full valuation allowance position.
Further, in the event we were to undergo an “ownership change” (as defined in Section 382 of the Internal Revenue Code of 1986, as amended), our ability to use net operating losses and tax credits generated prior to the ownership change may be limited. Generally, an “ownership change” occurs if one or more shareholders, each of whom owns five percent or more in value of a corporation’s stock, increase their aggregate percentage ownership by more than 50 percent over the lowest percentage of stock owned
by those shareholders at any time during the preceding three-year period. See Note 8 in “Item 8. Financial Statements and Supplementary Data” in this report for further discussion regarding our net operating losses and tax credits available to be carried forward and used in future years. No ownership change occurred during 2020 for Devon. The Merger did cause an ownership change for WPX and increased the likelihood Devon could experience an ownership change over the next three years.
Goodwill
We test goodwill for impairment annually at October 31, or more frequently if events or changes in circumstances dictate that the carrying value of goodwill may not be recoverable. We perform a qualitative assessment to determine whether it is more likely than not that the fair value of goodwill is less than its carrying amount. As part of our qualitative assessment, we considered the general macro-economic, industry and market conditions, changes in cost factors, actual and expected financial performance, significant changes in management, strategy or customers and stock performance. If the qualitative assessment determines that a quantitative goodwill impairment test is required, then the fair value is compared to the carrying value. If the fair value is less than the carrying value, an impairment charge will be recognized for the amount by which the carrying amount exceeds the fair value. Because quoted market prices are not available, the fair value is estimated based upon a valuation analyses including comparable companies and transactions and premiums paid.
Because the trading price of our common stock decreased 73% during the first quarter of 2020 in response to the COVID-19 pandemic, we performed a goodwill impairment test as of March 31, 2020. While the cushion narrowed significantly since the previous impairment evaluation, we concluded an impairment was not required as of March 31, 2020. The two most critical judgements included in the March 31, 2020, test were the period utilized to determine Devon’s market capitalization and the control premium. For the test performed as of March 31, 2020, we derived our market capitalization by using our average common stock price from the latter two thirds of March 2020, to align with the time in the quarter subsequent to a key OPEC+ meeting and the date COVID-19 was officially classified as a pandemic. We applied a control premium based on recent comparable market transactions.
Subsequent to the end of the first quarter of 2020, Devon’s common stock price increased approximately 129% during the remainder of 2020 but remains less than our average trading price before the events experienced in the first quarter of 2020. Although our common stock price and commodity prices are in a period of high volatility, a sustained period of depressed commodity prices would adversely affect our estimates of future operating results, which could result in future goodwill impairments due to the potential impact on the cash flows of our operations. The impairment of goodwill has no effect on liquidity or capital resources. However, it would adversely affect our results of operations in the period recognized.
Non-GAAP Measures
Core Earnings
We make reference to “core earnings (loss) attributable to Devon” and “core earnings (loss) per share attributable to Devon” in “Overview of 2020 Results” in this Item 7 that are not required by or presented in accordance with GAAP. These non-GAAP measures are not alternatives to GAAP measures and should not be considered in isolation or as a substitute for analysis of our results reported under GAAP. Core earnings (loss) attributable to Devon, as well as the per share amount, represent net earnings excluding certain noncash and other items that are typically excluded by securities analysts in their published estimates of our financial results. For more information on the results of discontinued operations for our Barnett Shale assets, Canadian operations and for EnLink and the General Partner, see Note 19 in “Item 8. Financial Statements and Supplementary Data” in this report. Our non-GAAP measures are typically used as a quarterly performance measure. Amounts excluded for 2020 relate to asset dispositions, noncash asset impairments (including unproved asset impairments), deferred tax asset valuation allowance, fair value changes in derivative financial instruments and foreign currency, change in tax legislation and restructuring and transaction costs associated with the workforce reductions in 2020.
Amounts excluded for 2019 relate to asset dispositions, the gain on the sale of Canadian operations, noncash asset impairments (including noncash Barnett Shale and unproved asset impairments), deferred tax asset valuation allowance, costs associated with early retirement of debt, fair value changes in derivative financial instruments and foreign currency, restructuring and transaction costs associated with the workforce reductions in 2019 and restructuring and transaction costs associated with the divestment of our Canadian operations in 2019.
Amounts excluded for 2018 relate to asset dispositions, the gain on the sale of Devon’s aggregate ownership interests in EnLink and the General Partner, noncash asset impairments (including noncash unproved asset impairments), deferred tax asset valuation allowance, costs associated with early retirement of debt, fair value changes in derivative financial instruments and foreign currency, restructuring and transaction costs associated with the workforce reductions in 2018.
We believe these non-GAAP measures facilitate comparisons of our performance to earnings estimates published by securities analysts. We also believe these non-GAAP measures can facilitate comparisons of our performance between periods and to the performance of our peers.
Below are reconciliations of our core earnings and earnings per share to their comparable GAAP measures.
| Year ended December 31, | |||||||||||||||
|---|---|---|---|---|---|---|---|---|---|---|---|---|---|---|---|
| Before tax | After tax | After Noncontrolling Interests | Per Diluted Share | ||||||||||||
| 2020 | |||||||||||||||
| Continuing Operations | |||||||||||||||
| Loss attributable to Devon (GAAP) | $ | (3,090 | ) | $ | (2,543 | ) | $ | (2,552 | ) | $ | (6.78 | ) | |||
| Adjustments: | |||||||||||||||
| Asset dispositions | (1 | ) | — | — | (0.00 | ) | |||||||||
| Asset and exploration impairments | 2,847 | 2,207 | 2,207 | 5.87 | |||||||||||
| Deferred tax asset valuation allowance | — | 230 | 230 | 0.60 | |||||||||||
| Fair value changes in financial instruments | 161 | 125 | 125 | 0.32 | |||||||||||
| Change in tax legislation | — | (113 | ) | (113 | ) | (0.29 | ) | ||||||||
| Restructuring and transaction costs | 49 | 38 | 38 | 0.10 | |||||||||||
| Core loss attributable to Devon (Non-GAAP) | $ | (34 | ) | $ | (56 | ) | $ | (65 | ) | $ | (0.18 | ) | |||
| Discontinued Operations | |||||||||||||||
| Loss attributable to Devon (GAAP) | $ | (152 | ) | $ | (128 | ) | $ | (128 | ) | $ | (0.34 | ) | |||
| Adjustments: | |||||||||||||||
| Asset dispositions | 1 | 19 | 19 | 0.05 | |||||||||||
| Asset impairments | 182 | 143 | 143 | 0.37 | |||||||||||
| Fair value changes in foreign currency and other | (8 | ) | (5 | ) | (5 | ) | (0.01 | ) | |||||||
| Restructuring and transaction costs | 9 | 6 | 6 | 0.02 | |||||||||||
| Core earnings attributable to Devon (Non-GAAP) | $ | 32 | $ | 35 | $ | 35 | $ | 0.09 | |||||||
| Total | |||||||||||||||
| Loss attributable to Devon (GAAP) | $ | (3,242 | ) | $ | (2,671 | ) | $ | (2,680 | ) | $ | (7.12 | ) | |||
| Adjustments: | |||||||||||||||
| Continuing Operations | 3,056 | 2,487 | 2,487 | 6.60 | |||||||||||
| Discontinued Operations | 184 | 163 | 163 | 0.43 | |||||||||||
| Core loss attributable to Devon (Non-GAAP) | $ | (2 | ) | $ | (21 | ) | $ | (30 | ) | $ | (0.09 | ) | |||
| 2019 | |||||||||||||||
| Continuing Operations | |||||||||||||||
| Loss attributable to Devon (GAAP) | $ | (109 | ) | $ | (79 | ) | $ | (81 | ) | $ | (0.21 | ) | |||
| Adjustments: | |||||||||||||||
| Asset dispositions | (48 | ) | (37 | ) | (37 | ) | (0.09 | ) | |||||||
| Asset and exploration impairments | 20 | 15 | 15 | 0.04 | |||||||||||
| Fair value changes in financial instruments | 623 | 480 | 480 | 1.19 | |||||||||||
| Restructuring and transaction costs | 84 | 64 | 64 | 0.15 | |||||||||||
| Core earnings attributable to Devon (Non-GAAP) | $ | 570 | $ | 443 | $ | 441 | $ | 1.08 | |||||||
| Discontinued Operations | |||||||||||||||
| Loss attributable to Devon (GAAP) | $ | (632 | ) | $ | (274 | ) | $ | (274 | ) | $ | (0.68 | ) | |||
| Adjustments: | |||||||||||||||
| Gain on sale of Canadian operations | (223 | ) | (425 | ) | (425 | ) | (1.05 | ) | |||||||
| Asset and exploration impairments | 785 | 613 | 613 | 1.52 | |||||||||||
| Deferred tax asset valuation allowance | — | 24 | 24 | 0.06 | |||||||||||
| Early retirement of debt | 58 | 45 | 45 | 0.11 | |||||||||||
| Fair value changes in financial instruments and foreign currency and other | (33 | ) | (37 | ) | (37 | ) | (0.10 | ) | |||||||
| Restructuring and transaction costs | 248 | 183 | 183 | 0.45 | |||||||||||
| Core earnings attributable to Devon (Non-GAAP) | $ | 203 | $ | 129 | $ | 129 | $ | 0.31 | |||||||
| Total | |||||||||||||||
| Loss attributable to Devon (GAAP) | $ | (741 | ) | $ | (353 | ) | $ | (355 | ) | $ | (0.89 | ) | |||
| Adjustments: | |||||||||||||||
| Continuing Operations | 679 | 522 | 522 | 1.29 | |||||||||||
| Discontinued Operations | 835 | 403 | 403 | 0.99 | |||||||||||
| Core earnings attributable to Devon (Non-GAAP) | $ | 773 | $ | 572 | $ | 570 | $ | 1.39 |
| Year ended December 31, | |||||||||||||||
|---|---|---|---|---|---|---|---|---|---|---|---|---|---|---|---|
| Before tax | After tax | After Noncontrolling Interests | Per Diluted Share | ||||||||||||
| 2018 | |||||||||||||||
| Continuing Operations | |||||||||||||||
| Earnings attributable to Devon (GAAP) | $ | 944 | $ | 714 | $ | 714 | $ | 1.42 | |||||||
| Adjustments: | |||||||||||||||
| Asset dispositions | (278 | ) | (214 | ) | (214 | ) | (0.42 | ) | |||||||
| Asset and exploration impairments | 257 | 198 | 198 | 0.40 | |||||||||||
| Deferred tax asset valuation allowance | — | (4 | ) | (4 | ) | (0.01 | ) | ||||||||
| Early retirement of debt | 312 | 240 | 240 | 0.48 | |||||||||||
| Fair value changes in financial instruments | (938 | ) | (723 | ) | (723 | ) | (1.45 | ) | |||||||
| Restructuring and transaction costs | 97 | 76 | 76 | 0.15 | |||||||||||
| Core earnings attributable to Devon (Non-GAAP) | $ | 394 | $ | 287 | $ | 287 | $ | 0.57 | |||||||
| Discontinued Operations | |||||||||||||||
| Earnings attributable to Devon (GAAP) | $ | 2,839 | $ | 2,510 | $ | 2,350 | $ | 4.68 | |||||||
| Adjustments: | |||||||||||||||
| Asset dispositions | (2,593 | ) | (2,250 | ) | (2,250 | ) | (4.49 | ) | |||||||
| Fair value changes in financial instruments and foreign currency | 339 | 277 | 270 | 0.54 | |||||||||||
| Minimum volume commitment and restructuring and transaction costs | (31 | ) | (27 | ) | (2 | ) | (0.00 | ) | |||||||
| Core earnings attributable to Devon (Non-GAAP) | $ | 554 | $ | 510 | $ | 368 | $ | 0.73 | |||||||
| Total | |||||||||||||||
| Earnings attributable to Devon (GAAP) | $ | 3,783 | $ | 3,224 | $ | 3,064 | $ | 6.10 | |||||||
| Adjustments: | |||||||||||||||
| Continuing Operations | (550 | ) | (427 | ) | (427 | ) | (0.85 | ) | |||||||
| Discontinued Operations | (2,285 | ) | (2,000 | ) | (1,982 | ) | (3.95 | ) | |||||||
| Core earnings attributable to Devon (Non-GAAP) | $ | 948 | $ | 797 | $ | 655 | $ | 1.30 |
EBITDAX and Field-Level Cash Margin
To assess the performance of our assets, we use EBITDAX and Field-Level Cash Margin. We compute EBITDAX as net earnings from continuing operations before income tax expense; financing costs, net; exploration expenses; DD&A; asset impairments; asset disposition gains and losses; non-cash share-based compensation; non-cash valuation changes for derivatives and financial instruments; restructuring and transaction costs; accretion on discounted liabilities; and other items not related to our normal operations. Field-Level Cash Margin is computed as oil, gas and NGL revenues less production expenses. Production expenses consist of lease operating, gathering, processing and transportation expenses, as well as production and property taxes.
We exclude financing costs from EBITDAX to assess our operating results without regard to our financing methods or capital structure. Exploration expenses and asset disposition gains and losses are excluded from EBITDAX because they generally are not indicators of operating efficiency for a given reporting period. DD&A and impairments are excluded from EBITDAX because capital expenditures are evaluated at the time capital costs are incurred. We exclude share-based compensation, valuation changes, restructuring and transaction costs, accretion on discounted liabilities and other items from EBITDAX because they are not considered a measure of asset operating performance.
We believe EBITDAX and Field-Level Cash Margin provide information useful in assessing our operating and financial performance across periods. EBITDAX and Field-Level Cash Margin as defined by Devon may not be comparable to similarly titled measures used by other companies and should be considered in conjunction with net earnings from continuing operations.
Below are reconciliations of net earnings to EBITDAX and a further reconciliation to Field-Level Cash Margin.
| Year ended December 31, | ||||||||||||
|---|---|---|---|---|---|---|---|---|---|---|---|---|
| 2020 | 2019 | 2018 | ||||||||||
| Net earnings (loss) (GAAP) | $ | (2,671 | ) | $ | (353 | ) | $ | 3,224 | ||||
| Net (earnings) loss from discontinued operations, net of tax | 128 | 274 | (2,510 | ) | ||||||||
| Financing costs, net | 270 | 250 | 580 | |||||||||
| Income tax expense (benefit) | (547 | ) | (30 | ) | 230 | |||||||
| Exploration expenses | 167 | 58 | 128 | |||||||||
| Depreciation, depletion and amortization | 1,300 | 1,497 | 1,228 | |||||||||
| Asset impairments | 2,693 | — | 156 | |||||||||
| Asset dispositions | (1 | ) | (48 | ) | (278 | ) | ||||||
| Share-based compensation | 76 | 83 | 104 | |||||||||
| Derivative and financial instrument non-cash valuation changes | 161 | 623 | (938 | ) | ||||||||
| Restructuring and transaction costs | 49 | 84 | 97 | |||||||||
| Accretion on discounted liabilities and other | (34 | ) | 5 | 54 | ||||||||
| EBITDAX (non-GAAP) | 1,591 | 2,443 | 2,075 | |||||||||
| Marketing and midstream revenues and expenses, net | 35 | (53 | ) | (33 | ) | |||||||
| Commodity derivative cash settlements | (316 | ) | (170 | ) | 420 | |||||||
| General and administrative expenses, cash-based | 262 | 392 | 470 | |||||||||
| Field-level cash margin (non-GAAP) | $ | 1,572 | $ | 2,612 | $ | 2,932 |
Previous: Item 6. Selected Financial Data · Next: Item 7A. Quantitative and Qualitative Disclosures about Market Risk