 filings.tools
Dexcom 10-K 2018-12-31
Filed 2019-02-21. 22 sections, 562K characters. Original on sec.gov · Markdown · JSON
Cover and table of contents
10-K 1 dxcm-12312018x10k.htm 10-K
UNITED STATES
SECURITIES AND EXCHANGE COMMISSION
Washington, DC 20549
FORM 10-K
| ý | ANNUAL REPORT PURSUANT TO SECTION 13 OR 15(d) OF THE SECURITIES EXCHANGE ACT OF 1934 |
For the fiscal year ended December 31, 2018
| ¨ | TRANSITION REPORT PURSUANT TO SECTION 13 OR 15(d) OF THE SECURITIES EXCHANGE ACT OF 1934 |
For the transition period from to
Commission file number 000-51222
DEXCOM, INC.
(Exact name of Registrant as specified in its charter)
| Delaware | 33-0857544 | |
| (State or Other Jurisdiction of Incorporation or Organization) | (I.R.S. Employer Identification No.) | |
| 6340 Sequence Drive San Diego, California | 92121 | |
| (Address of Principal Executive Offices) | (Zip Code) |
Registrant’s Telephone Number, including area code: (858) 200-0200
Securities registered pursuant to Section 12(b) of the Exchange Act:
| Title of Each Class | Name of Each Exchange on Which Registered | |
| Common Stock, $0.001 Par Value Per Share | The Nasdaq Stock Market LLC (Nasdaq Global Select Market) |
Securities registered pursuant to Section 12(g) of the Exchange Act: None
Indicate by check mark if the Registrant is a well-known seasoned issuer, as defined in Rule 405 of the Securities Act.
Yes ý No ¨
Indicate by check mark if the Registrant is not required to file reports pursuant to Section 13 or 15(d) of the Exchange Act.
Yes ¨ No ý
Indicate by check mark whether the Registrant (1) has filed all reports required to be filed by Section 13 or 15(d) of the Securities Exchange Act of 1934 during the preceding 12 months (or for such shorter period that the Registrant was required to file such reports), and (2) has been subject to such filing requirements for the past 90 days. Yes ý No ¨
Indicate by check mark whether the registrant has submitted electronically every Interactive Data File required to be submitted pursuant to Rule 405 of Regulation S-T (§232.405 of this chapter) during the preceding 12 months (or for such shorter period that the registrant was required to submit and post such files). Yes ý No ¨
Indicate by check mark if disclosure of delinquent filers pursuant to Rule 405 of Regulation S-K is not contained herein, and will not be contained, to the best of Registrant’s knowledge, in definite proxy or information statements incorporated by reference in Part III of this Form 10-K or any amendment to this Form 10-K. ý
Indicate by check mark whether the Registrant is a large accelerated filer, an accelerated filer, a non-accelerated filer, a smaller reporting company or an emerging growth company. See the definitions of “large accelerated filer,” “accelerated filer,” “smaller reporting company” and “emerging growth company” in Rule 12b-2 of the Exchange Act.
Large accelerated filer ý Accelerated filer ¨ Non-accelerated filer ¨ Smaller reporting company ¨ Emerging growth company ¨
If an emerging growth company, indicate by check mark if the registrant has elected not to use the extended transition period for complying with any new or revised financial accounting standards provided pursuant to Section 13(a) of the Exchange Act. ¨
Indicate by check mark whether the Registrant is a shell company (as defined in Rule 12b-2 of the Exchange Act). Yes ¨ No ý
As of June 29, 2018, the last business day of the Registrant’s most recently completed second fiscal quarter, the aggregate market value of the registrant’s common stock held by non-affiliates of the registrant was approximately $8.276 billion based on the closing sales price of $94.98 per share as reported on the Nasdaq Global Select Market.
Indicate the number of shares outstanding of each of the issuer’s classes of common stock, as of the latest practicable date.
| Class | Outstanding at February 15, 2019 | |
| Common stock, $0.001 par value per share | 90,001,767 |
DOCUMENTS INCORPORATED BY REFERENCE
Portions of the Registrant’s definitive proxy statement relating to its 2019 Annual Meeting of Stockholders (the Proxy Statement) are incorporated by reference in Part III, Items 10 through 14 of this Annual Report on Form 10-K, as specified in the responses to those item numbers. Except with respect to information specifically incorporated by reference in the Form 10-K, the Proxy Statement is not deemed to be filed as part hereof.
DexCom, Inc.
Table of Contents
| Page Number | ||
| PART I | ||
| ITEM 1. | Business | 3 |
| ITEM 1A. | Risk Factors | 26 |
| ITEM 1B. | Unresolved Staff Comments | 57 |
| ITEM 2. | Properties | 58 |
| ITEM 3. | Legal Proceedings | 58 |
| ITEM 4. | Mine Safety Disclosures | 59 |
| PART II | ||
| ITEM 5. | Market for Registrant’s Common Equity, Related Stockholder Matters and Issuer Purchases of Equity Securities | 60 |
| ITEM 6. | Selected Financial Data | 62 |
| ITEM 7. | Management’s Discussion and Analysis of Financial Condition and Results of Operations | 63 |
| ITEM 7A. | Quantitative and Qualitative Disclosures about Market Risk | 73 |
| ITEM 8. | Consolidated Financial Statements and Supplementary Data | 74 |
| ITEM 9. | Changes in and Disagreements with Accountants on Accounting and Financial Disclosure | 74 |
| ITEM 9A. | Controls and Procedures | 74 |
| ITEM 9B. | Other Information | 76 |
| PART III | ||
| ITEM 10. | Directors, Executive Officers and Corporate Governance | 76 |
| ITEM 11. | Executive Compensation | 76 |
| ITEM 12. | Security Ownership of Certain Beneficial Owners and Management and Related Stockholders Matters | 76 |
| ITEM 13. | Certain Relationships and Related Transactions, and Director Independence | 76 |
| ITEM 14. | Principal Accountant Fees and Services | 76 |
| PART IV | ||
| ITEM 15. | Exhibits, Financial Statement Schedules | 77 |
| ITEM 16. | Form 10-K Summary | 82 |
CAUTIONARY NOTE REGARDING FORWARD-LOOKING STATEMENTS
Except for historical financial information contained herein, the matters discussed in this Form 10-K may be considered forward-looking statements within the meaning of Section 27A of the Securities Act of 1933, as amended, and Section 21E of the Securities Exchange Act of 1934, as amended, and subject to the safe harbor created by the Securities Litigation Reform Act of 1995. Such statements include declarations regarding our intent, belief, or current expectations and those of our management. Prospective investors are cautioned that any such forward-looking statements are not guarantees of future performance and involve a number of risks, uncertainties and other factors, some of which are beyond our control; actual results could differ materially from those indicated by such forward-looking statements. Important factors that could cause actual results to differ materially from those indicated by such forward-looking statements include, but are not limited to: (i) that the information is of a preliminary nature and may be subject to further adjustment; (ii) those risks and uncertainties identified under “Risk Factors”; and (iii) the other risks detailed from time-to-time in our reports and registration statements filed with the Securities and Exchange Commission, or SEC. Except as required by law, we undertake no obligation to revise or update publicly any forward-looking statements, whether as a result of new information, future events or otherwise.
PART I
Item 1. BUSINESS
Overview
We are a medical device company primarily focused on the design, development and commercialization of continuous glucose monitoring, or CGM, systems for use by people with diabetes and by healthcare providers. We received approval from the United States (U.S.) Food and Drug Administration, or FDA, and commercialized our first product in 2006. We launched our latest generation system, the DexCom G6® integrated Continuous Glucose Monitoring System, or G6, in 2018. Unless the context requires otherwise, the terms “we,” “us,” “our,” the “company,” or “DexCom” refer to DexCom, Inc. and its subsidiaries.
Products
DexCom G6®
In March 2018, we obtained marketing authorization from the FDA for the G6 via the de novo process. The G6 is the first type of continuous glucose monitoring system permitted by the FDA to be used as part of an integrated system with other compatible medical devices and electronic interfaces, which may include automated insulin dosing systems, insulin pumps, blood glucose meters or other electronic devices used for diabetes management. G6 and substantially equivalent devices of this generic type that may later receive marketing authorization are referred to as integrated continuous glucose monitoring systems or iCGMs, and have been classified as Class II devices. Along with this classification, the FDA established criteria, called special controls, which outline requirements for assuring CGM accuracy, reliability and clinical relevance, and which also describe the type of studies and data required to demonstrate acceptable CGM performance.
The G6 is designed to allow our transmitter to run an algorithm to generate a glucose value and to communicate directly to a patient’s compatible mobile device, including iPhone®, iPod touch®, iPad®, and certain Android® mobile devices. A patient’s glucose data can also be displayed on wearable devices, like the Apple Watch® and Wear OS by Google devices. The G6 transmitter has a labeled useful life of three months. Data from the G6 can be integrated with DexCom CLARITY®, our cloud-based reporting software, for personalized, easy-to-understand analysis of trends that may improve diabetes management. In June 2018, we received Conformité Européenne Marking, or CE Mark, approval for the G6, which allows us to market the system in the European Union and the countries in Asia and Latin America that recognize the CE Mark, as well as New Zealand (subject to compliance with certain local administrative requirements) though certain countries may require additional marketing authorizations (for example, the inclusion of medical devices on the Australian Register of Therapeutic Goods in Australia).
The sensor is inserted by the user and is intended to be used continuously for up to ten days, after which it may be replaced with a new disposable sensor. Our transmitter is reusable until it reaches the end of its use life. Our receiver is also reusable. As we establish an installed base of customers using our products, we expect to generate an increasing portion of our revenues through recurring sales of our disposable sensors.
The G6 carries forward important features of prior generation DexCom CGM systems:
| • | Continuous glucose readings. Automatically sends glucose readings to a DexCom receiver or compatible mobile device every five minutes. |
| • | Mobile app and sharing. Compatibility with mobile device applications allows for sharing glucose information with up to five people for added support. |
| • | Customizable alarms and alerts. Personalized alert schedule immediately warns the user of pending dangerous high and low blood sugars. |
| • | Third-party reimbursement. In the United States, the G6 is covered by those commercial insurers that reimburse for the G5 Mobile, as well as Medicare. |
The G6 also has a number of new or improved features compared to our prior generation devices:
| • | Finger stick elimination. No finger sticks are needed for calibration or diabetes treatment decisions, consistent with the instructions for use. |
| • | Easy sensor application. Complete redesign of the sensor applicator allows for one-touch, simple insertion. |
| • | Discreet and low profile. A redesigned transmitter with a 28% lower profile than the previous generation DexCom CGM makes the device comfortable and easy to wear under clothing. |
| • | Medication blocking. New feature allows for more accurate glucose readings without interference from medications taken at typical indication doses, such as acetaminophen. |
| • | Predictive low alert. New alert feature intended to predict hypoglycemia before it hits to help avoid dangerous low blood sugar events. |
| • | Extended 10-day sensor. 10-day sensor allows for 43% longer wear than previous generation DexCom CGMs. |
Except with respect to the foregoing, the G6 is equivalent to our prior generation CGM systems in its technical capabilities and its indications, except that since the G6 is classified by the FDA as a Class II device, it is subject to special controls and modifications of or revisions to the device may be made under the 510(k) process.
DexCom G5® Mobile
In August 2015, we received approval from the FDA for the DexCom G5 Mobile Continuous Glucose Monitoring System, also referred to as the G5 Mobile. The G5 Mobile is designed to allow our transmitter to run the Software 505 algorithm, and to communicate directly to a patient’s compatible mobile device, including iPhone, iPod touch, iPad, and certain Android mobile devices. The G5 Mobile transmitter has a labeled useful life of three months. Data from the G5 Mobile can be integrated with DexCom CLARITY. In September 2015, we launched the G5 Mobile in certain countries in Europe.
Similar to the G6, the disposable sensor is inserted by the user and is intended to be used continuously for up to seven days, after which it may be replaced with a new sensor. The related transmitter is reusable until it reaches the end of its use life, and the related receiver is also reusable. In December 2016, the FDA approved the G5 Mobile as the first CGM system in the United States to have a non-adjunctive indication. The non-adjunctive indication expands the lawfully permitted use of the G5 Mobile as a replacement to finger stick glucose testing for diabetes treatment decisions. With the new label indication, the G5 Mobile only requires two finger sticks per day for calibration. In the countries and regions outside of the United States that recognize the CE Mark, as well as the United States and Canada, the G5 Mobile also does not require confirmatory finger sticks when making treatment decisions, although a minimum of two finger sticks a day remain necessary for calibration. Approval of the non-adjunctive indication also was an important and necessary step in enabling people with Medicare to access CGM.
Except with respect to the foregoing, the G5 Mobile is functionally equivalent to our earlier generation CGM systems in its technical capabilities and its regulatory requirements and indications.
DexCom G4® PLATINUM
The DexCom G4 PLATINUM CGM system, or G4 PLATINUM, replaced our DexCom SEVEN PLUS system beginning in 2012, when it was approved for up to seven days of continuous use by adults with diabetes. Since 2012, we have marketed the G4 PLATINUM under a CE Mark in the European Union, the countries in Asia and Latin America that recognize the CE Mark, New Zealand and Australia, and in the United States with approval from the FDA. We received approvals for a pediatric indication under the CE Mark in February 2013 and from the FDA in February 2014, enabling us to market and sell this system to persons two years old and older who have diabetes. In June 2014, we received app
Showing the first 8K of 113K characters. Open the full section
Item 1A. RISK FACTORS
Our short and long-term success is subject to numerous risks and uncertainties, many of which involve factors that are difficult to predict or beyond our control. Before making a decision to invest in, hold or sell our common stock, stockholders and potential stockholders should carefully consider the risks and uncertainties described below, in addition to the other information contained in or incorporated by reference into this Annual Report on Form 10-K, as well as the other information we file with the Securities and Exchange Commission. If any of the following risks are realized, our business, financial condition, results of operations and prospects could be materially and adversely affected. In that case, the value of our common stock could decline and stockholders may lose all or part of their investment. Furthermore, additional risks and uncertainties of which we are currently unaware, or which we currently consider to be immaterial, could have a material adverse effect on our business, financial condition or results of operations. Refer to our disclaimer regarding forward-looking statements at the beginning of our Management’s Discussion and Analysis of Financial Condition and Results of Operations.
Risks Related to Our Business
We have incurred losses since inception and anticipate that we will incur continued losses in the future.
We have incurred operating losses in each year since our inception in May 1999, including an operating loss of $186.3 million for the twelve months ended December 31, 2018. As of December 31, 2018, we had an accumulated deficit of $798.9 million. We have financed our operations primarily through private and public offerings of equity securities and debt and the sales of our products. We have devoted substantial resources to:
| • | research and development relating to our continuous glucose monitoring systems; |
| • | sales and marketing and manufacturing expenses associated with the commercialization of our G4 PLATINUM, G5 Mobile and G6 systems; and |
| • | expansion of our workforce. |
We expect our research and development expenses to increase in connection with our clinical trials and other development activities related to our products, including our next-generation sensors, transmitters and sensor-augmented insulin pumps, as well as other collaborations. We also expect that our general and administrative expenses will continue to increase due to the additional operational and regulatory burdens applicable to public healthcare and medical device companies. As a result, it is likely we will continue to incur operating losses in the future. These losses, among other things, have had and will continue to have an adverse effect on our stockholders’ equity.
If, in the future, we are unable to continue the development of an adequate sales and marketing organization, or if our direct sales organization is not successful, we may have difficulty achieving market awareness and selling our products.
To achieve commercial success for the G4 PLATINUM, G5 Mobile and G6 systems and any of our future products, we must either continue to develop and grow our sales and marketing organization and enter into partnerships or other arrangements to market and sell our products or collaborate with third parties to market and sell our products. Developing and managing a direct sales organization is a difficult, expensive and time-consuming process.
To be successful we must:
| • | recruit and retain adequate numbers of effective and experienced sales personnel; |
| • | effectively train our sales personnel in the benefits and risks of our products; |
| • | establish and maintain successful sales, marketing, training and education programs that educate endocrinologists, physicians and diabetes educators so they can appropriately inform their patients about our products; |
| • | manage geographically dispersed sales and marketing operations; and |
| • | effectively train our sales personnel on the applicable fraud and abuse laws that govern interactions with healthcare practitioners as well as current and prospective patients and maintain active oversight and auditing measures to ensure continued compliance. |
We currently employ a direct sales force to sell and market our products in the United States, Canada and certain countries in Europe. Our direct sales force calls directly on healthcare providers and people with diabetes throughout the applicable country to initiate sales of our products. Our sales organization competes with the experienced, larger and well-funded marketing and sales operations of our competitors. We may not be able to successfully manage our dispersed sales force or increase our product sales at acceptable rates.
We have also entered into distribution arrangements to leverage existing distributors already engaged in the diabetes marketplace. Our United States distribution partnerships are focused on accessing underrepresented regions and, in some instances, third-party payors that contract exclusively with distributors. Our European and other international distribution partners call directly on healthcare providers and patients to market and sell our products in Australia, New Zealand, and portions of Europe, Asia, Latin America, the Middle East and Africa. Because of the competition for their services, we may be unable to partner with or retain additional qualified distributors. Further, we may not be able to enter into agreements with distributors on commercially reasonable terms, if at all. Our distributors might not have the resources to continue to support our recent rapid growth.
If we are unable to establish adequate sales, marketing and distribution capabilities or enter into and maintain arrangements with third parties to sell, market and distribute our products, our business may be harmed.
We have entered into distribution arrangements to leverage established distributors already engaged in the diabetes marketplace. Our distribution agreements with Byram and affiliates and Cardinal Health and affiliates (including Edgepark Medical Supplies), our two most significant distributors, generated approximately 12% and 15%, respectively, of our total revenue during the twelve months ended December 31, 2018. We cannot guarantee that these relationships will continue or that we will be able to maintain this volume of sales from these relationships in the future. A substantial decrease or loss of these sales could have a material adverse effect on our operating performance. To the extent that we enter into additional arrangements with third parties to perform sales, marketing, distribution and billing services in the United States, Europe or other countries, our product margins could be lower than if we directly marketed and sold our products. To the extent that we enter into co-promotion or other marketing and sales arrangements with other companies, any revenue received will depend on the skills and efforts of others, and we cannot predict whether these efforts will be successful. In addition, market acceptance of our products by physicians and people with diabetes in Europe or other countries will largely depend on our ability to demonstrate their relative safety, effectiveness, reliability, cost-effectiveness and ease of use. If we are unable to do so, we may not be able to generate product revenue from our sales efforts in Europe or other countries. Finally, if we are unable to establish and maintain adequate sales, marketing and distribution capabilities, independently or with others, we may not be able to generate adequate product revenue and may not become profitable.
Although many third-party payors have adopted some form of coverage policy on continuous glucose monitoring devices, our products do not yet have
Showing the first 8K of 182K characters. Open the full section
Item 1B. UNRESOLVED STAFF COMMENTS
None.
Item 2. PROPERTIES
Our principal locations, their sizes and purposes, and the expiration dates for the leases on the facilities at those locations as of December 31, 2018 are shown in the table below.
| Location | Approximate Square Feet | Purpose | Lease Expiration Dates | ||||
| San Diego, CA | 470,900 | Laboratory, Manufacturing, Research and Development, Warehouse, General and Administrative, Sales and Marketing | 2022 (1) | ||||
| Mesa, AZ | 148,800 | General and Administrative, Laboratory, Manufacturing, Warehouse | 2028 (2) | ||||
| All international locations (3) | 122,800 | EMEA Headquarters, Clinical, Regulatory, Marketing, General and Administrative | 2026 |
(1) Excludes renewals that would be at our option to extend the term of leases for approximately 219,000 square feet of space for two additional five-year terms.
(2) Excludes renewals that would be at our option to extend the term of this lease for four additional five-year terms.
(3) International locations include Canada, the United Kingdom, Germany, Switzerland and the Philippines.
We also lease facilities in a number of smaller domestic locations. We believe our facilities are suitable and adequate for our current and near-term needs, and that we will be able to locate additional facilities as needed.
Item 3. LEGAL PROCEEDINGS
On March 28, 2016, AgaMatrix, Inc., or AgaMatrix, filed a patent infringement lawsuit against us in the United States District Court for the District of Oregon, asserting that certain of our products infringe certain patents held by AgaMatrix. On June 6, 2016, AgaMatrix filed a First Amended Complaint asserting the same three patents. On February 24, 2017, the Court granted AgaMatrix’s motion to substitute WaveForm Technologies, Inc., or WaveForm, as the new plaintiff following AgaMatrix’s transfer of the three patents to its newly formed entity. On August 25, 2016, we filed petitions for inter partes review with the Patent Trial and Appeal Board, or PTAB, of the U.S. Patent and Trademark Office seeking a determination that two of the three asserted patents are invalid under U.S. patent law and those petitions were granted on March 6, 2017. On March 8, 2017, we filed a petition for inter partes review with the PTAB seeking a determination that the third of the three asserted patents is invalid under U.S. patent law. This petition was granted on September 15, 2017. The PTAB issued a Final Written Decision for each of the first two patents on February 28, 2018, where the PTAB found the majority of asserted claims from the first patent unpatentable and the remaining claims under review not unpatentable. The PTAB found all claims under review from the second patent not unpatentable. We believe the PTAB erred in finding any claims of the first two patents not unpatentable, and appealed the PTAB’s decision to the United States Court of Appeals for the Federal Circuit, or Federal Circuit, on March 30, 2018. Briefing of the appeal is complete and we are currently awaiting the dates for oral argument from the Court of Appeals. The PTAB issued a Final Written Decision for the third patent on September 12, 2018, where the PTAB found all claims of the third patent asserted against us in the District of Oregon litigation unpatentable. WaveForm did not appeal this decision. On January 4, 2019, the parties stipulated to the dismissal of all claims and counterclaims regarding the third asserted patent. Most activity in the patent infringement lawsuit against us in the District of Oregon was stayed until the PTAB completed the inter partes review proceedings. That stay was lifted on October 10, 2018. The remaining claims and counterclaims will continue with an estimated date of trial in February 2020. It is our position that Waveform’s assertions of infringement have no merit.
We have also filed several lawsuits against AgaMatrix. We filed a patent infringement lawsuit against AgaMatrix in the United States District Court for the Central District of California, or C.D. Cal., which is currently on appeal to the Federal Circuit based on a Final Judgment of non-infringement entered by the C.D. Cal. judge on February 23, 2018. AgaMatrix sought attorneys’ fees for this lawsuit and as of December 31, 2018 we have accrued an immaterial amount for those fees. On September 15, 2017, we filed a patent infringement lawsuit against AgaMatrix in the United States District Court for the District of Delaware, asserting certain single-point blood glucose monitoring products of AgaMatrix infringe two patents held by us. In addition, on September 18, 2017, we filed a Complaint against AgaMatrix in the International Trade Commission, referred to as the ITC, requesting that the ITC institute an investigation and issue an order excluding certain products of AgaMatrix from importation into or sale in the United States based on AgaMatrix’s infringement of the same two patents asserted in the Delaware litigation. On September 14, 2018, AgaMatrix filed two petitions for inter partes review for each of the same two patents we asserted in the District of Delaware and the ITC. We filed a response to all four petitions on December
17, 2018. AgaMatrix had requested additional briefing on the matter and the PTAB has authorized both sides to do so. Briefing was completed in January 2019.
Neither the outcome of these lawsuits nor the amount and range of potential loss associated with the lawsuits can be assessed at this time. Other than the attorneys’ fees described above, as of December 31, 2018 we have accrued no amounts for contingent losses associated with these suits.
We are subject to various claims, complaints and legal actions that arise from time to time in the normal course of business, including commercial insurance, product liability and employment related matters. In addition, from time to time we may bring claims or initiate lawsuits against various third parties with respect to matters arising out of the ordinary course of our business, including commercial and employment related matters. We do not believe we are party to any currently pending legal proceedings, the outcome of which could have a material adverse effect on our business, financial condition or results of operations. There can be no assurance that existing or future legal proceedings arising in the ordinary course of business or otherwise will not have a material adverse effect on our business, financial condition or results of operations.
Item 4. MINE SAFETY DISCLOSURES
Not applicable.
PART II
Item 5. MARKET FOR REGISTRANT’S COMMON EQUITY, RELATED STOCKHOLDER MATTERS AND ISSUER PURCHASES OF EQUITY SECURITIES
Market Information for Common Stock
DexCom’s common stock is traded on the Nasdaq Global Select Market under the symbol “DXCM.” The following table sets forth the high and low intraday per share sales prices reported on Nasdaq for DexCom’s common stock for the periods indicated.
| High | Low | |||||||
| Year Ended December 31, 2018 | ||||||||
| First Quarter | $ | 75.30 | $ | 51.04 | ||||
| Second Quarter | $ | 102.10 | $ | 69.51 | ||||
| Third Quarter | $ | 148.56 | $ | 92.33 | ||||
| Fourth Quarter | $ | 152.14 | $ | 105.05 | ||||
| High | Low | |||||||
| Year Ended December 31, 2017 | ||||||||
| First Quarter | $ | 88.80 | $ | 57.68 | ||||
| Second Quarter | $ | 85.32 | $ | 66.16 | ||||
| Third Quarter | $ | 78.92 | $ | 42.62 | ||||
| Fourth Quarter | $ | 62.35 | $ | 43.74 |
Stockholders
We had approximately 30 stockholders of record as of February 19, 2019. The number of beneficial owners of our common stock at that date was substantially greater than the number of record holders because a large portion of our common stock is held of record through brokerage firms in “street name.”
Dividend Policy
We have never declared or paid any cash dividends on our capital stock. We currently intend to retain any future earnings to finance the operation and expansion of our business, and we do not expect to declare or pay any dividends in the foreseeable future.
Recent Sales of Unregistered Securities
There were no unregistered sales of equity securities which have not been previously disclosed in a quarterly report on Form 10-Q or a current report on Form 8-K during the year ended December 31, 2018.
Purchases of Equity Securities by the Issuer and Affiliated Purchasers
In November 2018 we repurchased 0.8 million shares of our common stock for $100.0 million, or an average per share price of $123.99. None of these shares were repurchased as part of a publicly announced share repurchase plan.
Company Stock Price Performance
The graph below compares the cumulative total stockholder return on our common stock with the cumulative total returns on the Nasdaq Composite Index and the Nasdaq Medical Equipment Index over the five-year period ending December 31, 2018. The graph assumes that $100 was invested in DexCom common stock and in each of the other indices on December 31, 2013 and that all dividends were reinvested. The comparisons in the graph below are based on historical data and are not intended to forecast the possible future performance of DexCom’s common stock.
The graph below and related information shall not be deemed “soliciting material” or be deemed to be “filed” with the SEC, nor shall such information be incorporated by reference into any future filing, except to the extent that we specifically incorporate it by reference into such filing.
COMPARISON OF FIVE-YEAR CUMULATIVE TOTAL RETURN*
AMONG DEXCOM, INC.
THE NASDAQ COMPOSITE INDEX
AND THE NASDAQ MEDICAL EQUIPMENT INDEX
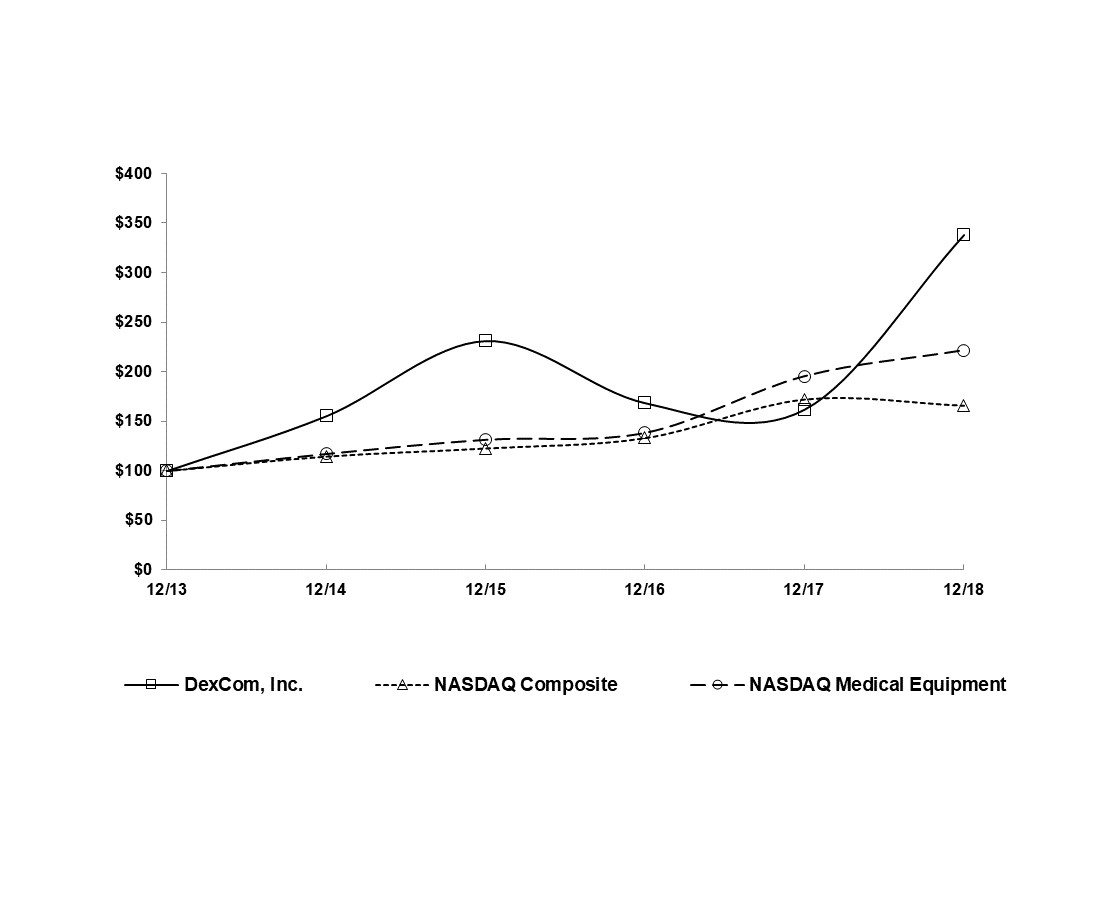
- $100 invested on December 31, 2013 in stock or index, including reinvestment of any dividends.
| December 31, 2013 | December 31, 2014 | December 31, 2015 | December 31, 2016 | December 31, 2017 | December 31, 2018 | ||||||||||||||||||
| DexCom, Inc. | $ | 100.00 | $ | 155.46 | $ | 231.29 | $ | 168.60 | $ | 162.07 | $ | 338.32 | |||||||||||
| Nasdaq Composite | $ | 100.00 | $ | 114.62 | $ | 122.81 | $ | 133.19 | $ | 172.11 | $ | 165.84 | |||||||||||
| Nasdaq Medical Equipment | $ | 100.00 | $ | 117.22 | $ | 131.48 | $ | 138.45 | $ | 195.37 | $ | 221.45 |
Item 6. SELECTED FINANCIAL DATA
The consolidated statements of operations data for the years ended December 31, 2018, 2017, and 2016 and the consolidated balance sheet data as of December 31, 2018 and 2017 have been derived from our audited consolidated financial statements included elsewhere in this Annual Report. The statements of operations data for the years ended December 31, 2015 and 2014 and the consolidated balance sheet data as of December 31, 2016, 2015 and 2014 have been derived from our audited financial statements not included in this Annual Report. The following selected financial data should be read in conjunction with our “Management’s Discussion and Analysis of Financial Condition and Results of Operations” in Part II, Item 7 and our financial statements and related notes in Part II, Item 8 of this Annual Report.
| Years Ended December 31, | ||||||||||||||||||||
| (In millions, except per share data) | 2018 | 2017 | 2016 | 2015 | 2014 | |||||||||||||||
| Consolidated Statements of Operations Data: | ||||||||||||||||||||
| Product revenue | $ | 1,031.6 | $ | 718.5 | $ | 573.3 | $ | 400.7 | $ | 257.1 | ||||||||||
| Development grant and other revenue | — | — | — | 1.3 | 2.1 | |||||||||||||||
| Total revenue | 1,031.6 | 718.5 | 573.3 | 402.0 | 259.2 | |||||||||||||||
| Product cost of sales | 367.7 | 226.4 | 194.9 | 123.6 | 82.3 | |||||||||||||||
| Development and other cost of sales | — | — | — | — | 0.6 | |||||||||||||||
| Total cost of sales | 367.7 | 226.4 | 194.9 | 123.6 | 82.9 | |||||||||||||||
| Gross profit | 663.9 | 492.1 | 378.4 | 278.4 | 176.3 | |||||||||||||||
| Operating expenses: | ||||||||||||||||||||
| Research and development | 199.7 | 185.4 | 156.1 | 101.0 | 69.4 | |||||||||||||||
| Collaborative research and development fees(1) | 217.7 | — | — | 36.5 | — | |||||||||||||||
| Selling, general and administrative | 432.8 | 349.2 | 286.2 | 198.0 | 128.4 | |||||||||||||||
| Total operating expenses | 850.2 | 534.6 | 442.3 | 335.5 | 197.8 | |||||||||||||||
| Operating loss | (186.3 | ) | (42.5 | ) | (63.9 | ) | (57.1 | ) | (21.5 | ) | ||||||||||
| Interest expense | (22.7 | ) | (12.8 | ) | (0.7 | ) | (0.4 | ) | (0.8 | ) | ||||||||||
| Income from equity investments | 80.1 | — | — | — | — | |||||||||||||||
| Interest and other income (expense), net | 2.4 | 6.7 | (0.3 | ) | — | — | ||||||||||||||
| Loss before income taxes | (126.5 | ) | (48.6 | ) | (64.9 | ) | (57.5 | ) | (22.3 | ) | ||||||||||
| Income tax expense | 0.6 | 1.6 | 0.7 | 0.1 | 0.1 | |||||||||||||||
| Net loss | $ | (127.1 | ) | $ | (50.2 | ) | $ | (65.6 | ) | $ | (57.6 | ) | $ | (22.4 | ) | |||||
| Basic and diluted net loss per share attributable to common stockholders(2) | $ | (1.44 | ) | $ | (0.58 | ) | $ | (0.78 | ) | $ | (0.72 | ) | $ | (0.30 | ) | |||||
| Shares used to compute basic and diluted net loss per share attributable to common stockholders(2) | 88.2 | 86.3 | 83.6 | 79.8 | 75.2 | |||||||||||||||
| As of December 31, | ||||||||||||||||||||
| (In millions) | 2018 | 2017 | 2016 | 2015 | 2014 | |||||||||||||||
| Consolidated Balance Sheet Data: | ||||||||||||||||||||
| Cash, cash equivalents, and short-term marketable securities | $ | 1,385.6 | $ | 548.6 | $ | 123.7 | $ | 115.2 | $ | 83.6 | ||||||||||
| Working capital | 1,477.1 | 605.8 | 177.6 | 164.4 | 105.3 | |||||||||||||||
| Total assets | 1,916.0 | 904.1 | 402.8 | 292.0 | 184.6 | |||||||||||||||
| Long-term obligations | 1,030.3 | 345.8 | 16.6 | 3.9 | 3.8 | |||||||||||||||
| Total stockholders’ equity | $ | 663.3 | $ | 419.4 | $ | 283.8 | $ | 221.2 | $ | 140.2 |
| (1) | See Note 2 to the financial statements in Part II, Item 8 of this Annual Report for a description of our Restated Collaboration Agreement with Verily Life Sciences LLC and Verily Ireland Limited. |
| (2) | See Note 1 to the financial statements in Part II, Item 8 of this Annual Report for a description of the method used to compute basic and diluted net loss per share attributable to common stockholders. |
Item 7. MANAGEMENT’S DISCUSSION AND ANALYSIS OF FINANCIAL CONDITION AND RESULTS OF OPERATIONS
This document, including the following Management’s Discussion and Analysis of Financial Condition and Results of Operations, contains forward-looking statements that are not purely historical regarding DexCom’s or its management’s intentions, beliefs, expectations and strategies for the future. These forward-looking statements fall within the meaning of the federal securities laws that relate to future events or our future financial performance. In some cases, you can identify forward-looking statements by terminology such as “may,” “will,” “expect,” “plan,” “anticipate,” “believe,” “estimate,” “intend,” “potential” or “continue” or the negative of these terms or other comparable terminology. Forward-looking statements are made as of the date of this report, deal with future events, are subject to various risks and uncertainties, and actual results could differ materially from those anticipated in those forward looking statements. The risks and uncertainties that could cause actual results to differ materially are more fully described under “Risk Factors” and elsewhere in this report and in our other reports filed with the SEC. We assume no obligation to update any of the forward-looking statements after the date of this report or to conform these forward-looking statements to actual results. You should read the following discussion and analysis together with “Selected Financial Data” in Part II, Item 6 and our financial statements and related notes in Part II, Item 8 of this Annual Report.
Overview
We are a medical device company primarily focused on the design, development and commercialization of continuous glucose monitoring, or CGM, systems for use by people with diabetes and by healthcare providers. We received approval from the Food and Drug Administration, or FDA, and commercialized our first product in 2006. We launched our latest generation system, the DexCom G6® integrated Continuous Glucose Monitoring System, or G6, in 2018. Unless the context requires otherwise, the terms “we,” “us,” “our,” the “company,” or “DexCom” refer to DexCom, Inc. and its subsidiaries.
We sell our durable CGM systems and disposable sensors through a direct sales force in the United States, Canada and some countries in Europe, and through distribution arrangements in the United States, Canada, Australia, New Zealand and some countries in Europe, Asia, Latin America, the Middle East and Africa.
We plan to develop future generations of technologies that are focused on improved performance and convenience and that will enable intelligent insulin administration. We also are aggressively exploring how to extend our offerings to other opportunities, including for people with Type 2 diabetes that are non-insulin using, people with pre-diabetes, people who are obese, people with gestational diabetes, and in the hospital setting. We will continue to develop a networked platform with open architecture, connectivity and transmitters capable of communicating with other devices and software systems. We also intend to expand our efforts to accumulate CGM patient data and metrics and apply predictive modeling and machine learning to generate interactive CGM insights that can inform patient behavior.
Critical Accounting Policies and Estimates
The discussion and analysis of our financial condition and results of operations are based on our financial statements, which we have prepared in accordance with U.S. GAAP. The preparation of these financial statements requires us to make estimates and assumptions that affect the reported amounts of assets and liabilities and the disclosure of contingent assets and liabilities at the date of the financial statements as well as the reported revenue and expenses during the reporting periods. On an ongoing basis, we evaluate our estimates and judgments. We base our estimates on historical experience and on various other factors that we believe are reasonable under the circumstances, the results of which form the basis for making judgments about the carrying value of assets and liabilities that are not readily apparent from other sources. Actual results may differ from these estimates under different assumptions or conditions.
While our significant accounting policies are more fully described in Note 1 to the financial statements in Part II, Item 8 of this Annual Report, we believe that the following accounting policies and estimates are most critical to a full understanding and evaluation of our reported financial results. Members of our senior management have discussed the development and selection of these critical accounting policies and their disclosure in this Annual Report with the Audit Committee of our Board of Directors.
Revenue Recognition
ASC Topic 606. We adopted ASC Topic 606 effective January 1, 2018 using the modified retrospective method. Results for reporting periods after January 1, 2018 are presented under ASC Topic 606, while prior period amounts are not adjusted and continue to be reported in accordance with legacy accounting guidance under ASC Topic 605. The discussion which follows describes the judgments and estimates we use in recognizing revenue under ASC Topic 606. Our adoption of ASC Topic 606 did not have a material impact on the measurement nor on the recognition of revenue from contracts, for which all revenue had
not been recognized as of January 1, 2018. Therefore, no cumulative adjustment has been made to the opening balance of retained earnings at the beginning of 2018. For more information, see “Revenue Recognition” in Note 1 to the financial statements in Part II, Item 8 of this Annual Report.
Revenue Recognition. We generate our revenue from the sale of our durable CGM systems and disposable sensors. Our durable systems include a reusable transmitter and receiver. Disposable sensors are sold separately. We also provide free-of-charge software and mobile applications for use with our durable systems and disposable sensors. The initial durable system price is generally not dependent upon the subsequent purchase of any amount of disposable sensors.
We generally recognize revenue when control is transferred to our customers in an amount that reflects the net consideration to which we expect to be entitled. Transaction price is typically based on contracted rates less any estimates of claim denials and historical reimbursement experience, which would include current and future expectations regarding reimbursement contracts, guidelines and payor mix, and less estimated variable consideration adjustments including rebates. The amount of variable consideration that is included in the transaction price is included in revenue only to the extent that it is probable that a significant reversal in the amount of the cumulative revenue recognized will not occur in a future period. We estimate reductions to our revenues for rebates paid to payors and healthcare providers in the United States. Rebates are based on contractual arrangements or statutory requirements, which may vary by product, payor and individual payor plans. Our estimates are based on products sold, historical payor mix and, as available, known market events or trends and channel inventory data. For more information, see “Revenue Recognition” in Note 1 to the financial statements in Part II, Item 8 of this Annual Report.
Recognizing revenue requires us to exercise judgment and use estimates that can have a significant impact on the amount and timing of revenue we report. We exercise significant judgment when we determine the transaction price, including variable consideration adjustments. If the actual amounts of consideration that we receive differ from our estimates, we would adjust our estimates and that would affect reported revenue in the period that such variances become known.
Disaggregation of Revenue. We disaggregate revenue by geographic region and by major sales channel. We have determined that disaggregating revenue into these categories achieves the ASC Topic 606 disclosure objectives of depicting how the nature, amount, timing and uncertainty of revenue and cash flows are affected by economic factors. Reconciliations of revenue disaggregated by geographic location and by major sales channel to total revenue are provided in Note 10 to the financial statements in Part II, Item 8 of this Annual Report.
Share-Based Compensation
Share-based compensation expense is measured at the grant date based on the estimated fair value of the award and is recognized straight-line over the requisite service period of the individual grants, which typically equals the vesting period. Shared-based compensation arrangements include time-based and performance/market-based Restricted Stock Units (“RSUs”) and purchases of common stock at a discount under our Employee Stock Purchase Plan, or ESPP.
We estimate the fair value of time-based RSUs based on the market price of our common stock on the date of grant (the intrinsic value method). We estimate the fair value of performance/market-based RSUs using a Monte Carlo simulation model. We adjust share-based compensation expense quarterly for performance/market-based RSUs based on the expected achievement of the related performance conditions, which requires significant judgment.
We estimate the fair value of ESPP purchase rights using the Black-Scholes option pricing model. The model requires us to make assumptions that include expected volatility, expected term, dividends, and the risk-free interest rate. We account for forfeitures as they occur by reversing any share-based compensation expense related to awards that will not vest.
We recorded $101.9 million, $106.2 million and $110.8 million in share-based compensation expense during the twelve months ended December 31, 2018, 2017 and 2016, respectively. At December 31, 2018, unrecognized estimated compensation costs related to unvested restricted stock units totaled $126.5 million and are expected to be recognized through 2021.
Fair Value of Financial Instruments
The authoritative guidance establishes a fair value hierarchy that is based on the extent and level of judgment used to estimate the fair value of assets and liabilities. In general, the authoritative guidance requires us to maximize the use of observable inputs and minimize the use of unobservable inputs when measuring fair value. An asset or liability’s categorization within the fair value hierarchy is based upon the lowest level of input that is significant to the measurement of its fair value. The three levels of input defined by the authoritative guidance are as follows:
Level 1—Unadjusted quoted prices that are available in active markets for identical assets or liabilities.
Level 2—Inputs other than quoted prices included in Level 1 that are observable, either directly or indirectly, through correlation with market data. These include quoted prices in active markets for similar assets or liabilities; quoted prices for identical or similar assets or liabilities in markets that are not active; and inputs to valuation models or other pricing
methodologies that do not require significant judgment because the inputs used in the model, such as interest rates and volatility, can be corroborated by readily observable market data for substantially the full term of the assets or liabilities.
Level 3—Unobservable inputs that are supported by little or no market activity and that are significant to the determination of fair value. Level 3 assets and liabilities include those whose fair values are determined using pricing models, discounted cash flow methodologies, or similar valuation techniques and significant judgment or estimation.
We estimate the fair value of most of our cash equivalents using Level 1 inputs. We estimate the fair value of our marketable equity securities using Level 1 inputs and we estimate the fair value of our marketable debt securities using Level 2 inputs. We carry our other financial instruments, such as cash, accounts receivable, prepaid expenses and other current assets, accounts payable and accrued liabilities, at cost, which approximates the related fair values due to the short-term maturities of these instruments. See Note 1 and Note 3 to the financial statements in Part II, Item 8 of this Annual Report for more information about fair value measurements.
Accounts Receivable and Related Valuation Accounts
We maintain an allowance for doubtful accounts for estimated losses resulting from the inability of our customers to make required payments. We evaluate the collectability of our accounts receivable based on a combination of factors. We regularly analyze customer accounts, review the length of time receivables are outstanding, review historical loss rates and assess current economic trends that may impact the level of credit losses in the future. Our allowance for doubtful accounts has generally been adequate to cover our actual credit losses. However, since we cannot reliably predict future changes in the financial stability of our customers, we may need to increase our reserves if the financial conditions of our customers deteriorate.
Excess and Obsolete Inventory
Inventory is valued at the lower of cost or net realizable value. We record adjustments to inventory for potentially excess, obsolete, or scrapped goods in order to state inventory at net realizable value. Factors influencing these adjustments include inventories on hand and on order compared to estimated future usage and sales for existing and new products, as well as judgments regarding quality control testing data and assumptions about the likelihood of scrap and obsolescence. Historically, our inventory reserves have been adequate to cover our actual losses. However, if actual product life cycles, product quality or market conditions differ from our assumptions, additional inventory adjustments that would increase cost of goods sold could be required.
Income Taxes
We estimate our income taxes based on the various jurisdictions where we conduct business. Significant judgment is required in determining our worldwide income tax provision. The calculation of our tax liabilities involves dealing with uncertainties in the application of complex tax laws and regulations and the potential for future adjustment of our uncertain tax positions by the Internal Revenue Service or other taxing jurisdictions. While we believe we have appropriate support for the positions taken on our tax returns, we regularly assess the potential outcomes of examinations by tax authorities in determining the adequacy of our provision for income taxes. We continually assess the likelihood and amount of potential adjustments and adjust the income tax provision, income taxes payable, and deferred taxes in the period in which the facts that give rise to a revision become known.
We use the asset and liability approach to recognize deferred tax assets and liabilities for the expected future tax consequences of temporary differences between the carrying amounts and the tax bases of assets and liabilities. Deferred tax assets and liabilities are determined using the enacted tax rates in effect for the years in which those tax assets are expected to be realized. Significant judgement is required to evaluate the need for a valuation allowance against deferred tax assets. We review all available positive and negative evidence, including projections of pre-tax book income, earnings history, and reliability of forecasting. A valuation allowance is established when it is more likely than not that some or all of the deferred tax assets will not be realized. As of December 31, 2018, we have maintained a full valuation allowance on our deferred tax assets since inception based on our historical losses and the uncertainty of generating future taxable income to utilize our loss and credit carryforwards. A future release of our valuation allowance will result in a material tax benefit recognized in the quarter of the release.
We recognize and measure benefits for uncertain tax positions using a two-step approach. The first step is to evaluate the tax position taken or expected to be taken in a tax return by determining if the weight of available evidence indicates that it is more likely than not that the tax position will be sustained upon audit, including resolution of any related appeals or litigation processes. For tax positions that are more likely than not of being sustained upon audit, the second step is to measure the tax benefit as the largest amount that is more than 50% likely of being realized upon settlement. Significant judgment is required to evaluate uncertain tax positions and is based upon a number of factors, including changes in facts or circumstances, changes in
tax law, correspondence with tax authorities during the course of audits and effective settlement of audit issues. Changes in the recognition or measurement of uncertain tax positions could result in material increases or decreases in our income tax expense in the period in which we make the change, which could have a material impact on our effective tax rate and operating results.
Loss Contingencies
We are subject to certain legal proceedings, as well as demands, claims and threatened litigation that arise in the normal course of our business. We review the status of each significant matter quarterly and assess our potential financial exposure. If the potential loss from a claim or legal proceeding is considered probable and the amount can be reasonably estimated, we record a liability and an expense for the estimated loss and disclose it in our financial statements if it is significant. If we determine that a loss is possible and the range of the loss can be reasonably determined, we do not record a liability or an expense but we disclose the range of the possible loss. Significant judgment is required in the determination of whether a potential loss is probable, reasonably possible, or remote as well as in the determination of whether a potential exposure is reasonably estimable. We base our judgments on the best information available at the time. As additional information becomes available, we reassess the potential liability related to our pending claims and litigation and may revise our estimates. Any revision of our estimates of potential liability could have a material impact on our financial position and operating results.
Results of Operations
Financial Overview
| Twelve Months Ended December 31, | 2018 - 2017 | 2017 - 2016 | |||||||||||||||||||||||
| (Dollars in millions) | 2018 | 2017 | 2016 | $ Change | % Change | $ Change | % Change | ||||||||||||||||||
| Total revenue | $ | 1,031.6 | $ | 718.5 | $ | 573.3 | $ | 313.1 | 44 | % | $ | 145.2 | 25 | % | |||||||||||
| Gross profit | 663.9 | 492.1 | 378.4 | $ | 171.8 | 35 | % | $ | 113.7 | 30 | % | ||||||||||||||
| Gross profit as a percent of total revenue | 64 | % | 68 | % | 66 | % | |||||||||||||||||||
| Operating loss | (186.3 | ) | (42.5 | ) | (63.9 | ) | $ | (143.8 | ) | 338 | % | $ | 21.4 | (33 | )% | ||||||||||
| Net loss | $ | (127.1 | ) | $ | (50.2 | ) | $ | (65.6 | ) | $ | (76.9 | ) | 153 | % | $ | 15.4 | (23 | )% | |||||||
| Basic and diluted net loss per share | $ | (1.44 | ) | $ | (0.58 | ) | $ | (0.78 | ) | $ | (0.86 | ) | 148 | % | $ | 0.20 | (26 | )% |
Revenue, Cost of Sales and Gross Profit
| Twelve Months Ended December 31, | 2018 - 2017 | 2017 - 2016 | |||||||||||||||||||||||
| (Dollars in millions) | 2018 | 2017 | 2016 | $ Change | % Change | $ Change | % Change | ||||||||||||||||||
| Total revenue | $ | 1,031.6 | $ | 718.5 | $ | 573.3 | $ | 313.1 | 44 | % | $ | 145.2 | 25 | % | |||||||||||
| Cost of sales | 367.7 | 226.4 | 194.9 | 141.3 | 62 | % | 31.5 | 16 | % | ||||||||||||||||
| Gross profit | $ | 663.9 | $ | 492.1 | $ | 378.4 | $ | 171.8 | 35 | % | $ | 113.7 | 30 | % | |||||||||||
| Gross profit as a percent of total revenue | 64 | % | 68 | % | 66 | % |
We sell our G4 PLATINUM, G5 Mobile and G6 durable CGM systems and disposable sensors through a direct sales force in the United States, Canada and some countries in Europe, and through distribution arrangements in the United States, Canada, Australia, New Zealand and some countries in Europe, Asia, Latin America, the Middle East and Africa. Most of our distributors stock our products and fulfill orders for our products from their inventory.
We expect that revenues we generate from the sales of our products will fluctuate from quarter to quarter. We typically experience seasonality, with lower sales in the first quarter of each year compared to the immediately preceding fourth quarter. This seasonal sales pattern relates to U.S. annual insurance deductible resets and unfunded flexible spending accounts.
Cost of sales includes direct labor and materials costs related to each product sold or produced, including assembly, test labor and scrap, as well as factory overhead supporting our manufacturing operations. Factory overhead includes facilities, material procurement and control, manufacturing engineering, quality assurance, supervision and management. These costs are primarily salary, fringe benefits, share-based compensation, facility expense, supplies and purchased services. A portion of our costs are currently fixed due to our moderate level of production volumes compared to our potential capacity. All of our manufacturing costs are included in cost of sales.
2018 Compared to 2017
Total revenue increased $313.1 million or 44% for the twelve months ended December 31, 2018 compared to the twelve months ended December 31, 2017. The 2018 revenue increase was primarily driven by increased sales volume of our disposable sensors and durable systems due to the continued growth of our installed base of customers, both in the United States and outside the United States. Disposable sensor and other revenue comprised approximately 75% of total revenue and durable systems revenue comprised approximately 25% of total revenue for the twelve months ended December 31, 2018. Disposable sensor and other revenue comprised approximately 70% of total revenue and durable systems revenue comprised approximately 30% of total revenue for the twelve months ended December 31, 2017. Total distributor revenue for the twelve months ended December 31, 2018 was approximately $652.9 million or 63% of our total revenue, compared to $538.0 million or 75% of our total revenue for the same period in 2017.
Cost of sales increased $141.3 million or 62% for the twelve months ended December 31, 2018 compared to the twelve months ended December 31, 2017 primarily due to increased sales volume. The gross profit of $663.9 million or 64% of total revenue for the twelve months ended December 31, 2018 increased $171.8 million compared to $492.1 million or 68% of total revenue for the same period in 2017. The 2018 increase in gross profit dollars was driven primarily by increased revenue and decreased warranty costs, partially offset by a $7.3 million excess and obsolete inventory charge that was related to the approval and launch of our G6 system and the continuous improvement and innovation of our products, as well as royalty-related cost of sales charges. The 2018 decrease in gross margin percentage is a function of channel strategy and product mix through our new product launches and international expansion.
2017 Compared to 2016
Total revenue increased $145.2 million or 25% for the twelve months ended December 31, 2017 compared to the twelve months ended December 31, 2016. The 2017 revenue increase was primarily driven by increased sales volume of our disposable sensors due to the continued growth of our installed base of customers using our durable systems and also by increased sales volume of our durable systems to both new and existing customers. Revenue attributable to our disposable sensors and durable systems was approximately 70% and 30%, respectively, of total revenue for each of the twelve months ended December 31, 2017 and 2016. Revenue from products shipped to our distributors for the twelve months ended December 31, 2017 was approximately $538.0 million or 75% of our total revenue compared to $411.8 million or 72% of our total revenue for the same period in 2016.
Cost of sales increased $31.5 million or 16% for the twelve months ended December 31, 2017 compared to the twelve months ended December 31, 2016 primarily due to increased sales volume. The gross profit of $492.1 million or 68% of total revenue for the twelve months ended December 31, 2017 increased $113.7 million compared to $378.4 million or 66% of total revenue for the same period in 2016. The increases in gross profit dollars and gross margin percentage were driven primarily by increased revenue and decreased warranty costs. Warranty costs were lower in 2017 than in 2016 primarily due to the February 2016 customer notification regarding the audible alarms and alerts associated with our receivers, which was classified as a voluntary Class 1 recall by the FDA and was closed by the FDA in August 2017.
Operating Expenses
| Twelve Months Ended December 31, | 2018 - 2017 | 2017 - 2016 | |||||||||||||||||||||||
| (Dollars in millions) | 2018 | 2017 | 2016 | $ Change | % Change | $ Change | % Change | ||||||||||||||||||
| Research and development | $ | 199.7 | $ | 185.4 | $ | 156.1 | $ | 14.3 | 8 | % | $ | 29.3 | 19 | % | |||||||||||
| as a % of total revenue | 19 | % | 26 | % | 27 | % | |||||||||||||||||||
| Collaborative research and development fee | 217.7 | — | — | 217.7 | NM | — | — | % | |||||||||||||||||
| as a % of total revenue | 21 | % | — | % | — | % | |||||||||||||||||||
| Selling, general and administrative | 432.8 | 349.2 | 286.2 | 83.6 | 24 | % | 63.0 | 22 | % | ||||||||||||||||
| as a % of total revenue | 42 | % | 48 | % | 50 | % | |||||||||||||||||||
| Total operating expenses | $ | 850.2 | $ | 534.6 | $ | 442.3 | $ | 315.6 | 59 | % | $ | 92.3 | 21 | % | |||||||||||
| as a % of total revenue | 82 | % | 74 | % | 77 | % |
NM = Not Meaningful
Our research and development expenses primarily consist of engineering and research expenses related to our continuous glucose monitoring technology, clinical trials, regulatory expenses, quality assurance programs, materials and products for
clinical trials. Research and development expenses are primarily related to employee compensation, including salary, fringe benefits, share-based compensation, and temporary employee expenses. We also incur significant expenses to operate our clinical trials including clinical site reimbursement, clinical trial product and associated travel expenses. Our research and development expenses also include fees for design services, contractors and development materials.
Our selling, general and administrative expenses primarily consist of salary, fringe benefits and share-based compensation for our executive, financial, sales, marketing, information technology and administrative functions. Other significant expenses include commissions, marketing and advertising, IT software license costs, insurance, professional fees for our outside legal counsel and independent auditors, litigation expenses, patent application expenses and consulting expenses.
2018 Compared to 2017
Research and Development Expense. Research and development expense increased $14.3 million or 8% for the twelve months ended December 31, 2018 compared to the same period of 2017. The increase was primarily due to $15.4 million in additional salaries, bonus and payroll-related costs, $4.6 million in additional facilities costs, and $2.9 million in additional software license costs, partially offset by $4.6 million in lower stock compensation costs, $4.0 million in lower expensed equipment costs, and a $2.5 million reduction in supplies costs.
Collaborative Research and Development Fee. We and Verily Life Sciences LLC (an Alphabet Company) (“Verily”) have been jointly developing certain next-generation CGM products since August 2015. In November 2018, we entered into an amended and restated collaboration and license agreement with Verily. Under the terms of that agreement, we made an initial payment of $250.0 million through the issuance of 1,840,943 shares of our common stock. We recorded a $217.7 million collaborative research and development charge in our statement of operations during 2018 relating to the issuance of this common stock. See Note 2 to the financial statements in Part II, Item 8 of this Annual Report for more information about this collaboration agreement.
Selling, General and Administrative Expense. Selling, general and administrative expense increased $83.6 million or 24% for the twelve months ended December 31, 2018 compared to the same period of 2017. The increase was primarily due to higher sales-related costs that were driven by increased headcount and marketing costs to support revenue growth and the continued commercialization of our products in both the United States and Europe. Significant elements of the increase in selling, general, and administrative expenses included $19.9 million in additional salaries, bonus and payroll-related costs, $12.3 million in additional consulting fees, $9.2 million in additional incentive compensation paid to our sales personnel, $8.6 million in additional temporary labor costs, $8.2 million in additional marketing costs, $5.4 million in additional legal fees, and $4.4 million in additional software license costs.
2017 Compared to 2016
Research and Development Expense. Research and development expense increased $29.3 million or 19% for the twelve months ended December 31, 2017 compared to the same period of 2016. The increase was primarily due to $18.3 million in additional salaries, bonus and payroll-related costs, $8.4 million in additional expensed equipment, and $2.4 million of additional clinical trial costs related to development of our future products.
Selling, General and Administrative Expense. Selling, general and administrative expense increased $63.0 million or 22% for the twelve months ended December 31, 2017 compared to the same period of 2016. The increase was primarily due to higher headcount-related selling, marketing and customer support costs to support revenue growth and the continued commercialization of our products. Significant elements of the increase in selling, general, and administrative expenses included $37.8 million in additional salaries, bonus, and payroll-related costs, $10.6 million in additional marketing costs, and $4.4 million in additional software license costs.
Non-Operating Income and Expenses
Interest Expense
Interest expense is $22.7 million for the twelve months ended December 31, 2018 compared to $12.8 million for the same period of 2017 and is related to our 2022 Notes, 2023 Notes and Revolving Credit Agreement. The 2018 increase is primarily due to an additional $6.9 million of interest expense for the 2022 Notes, which were issued in May and June 2017, and $3.3 million of interest expense for the 2023 Notes, which were issued in November 2018.
Interest expense is $12.8 million for the twelve months ended December 31, 2017 compared to $0.7 million for the same period of 2016 and is related to our 2022 Notes and Revolving Credit Agreement. The 2017 increase is primarily due to an additional $11.1 million of interest expense for the 2022 Notes.
Income from Equity Investments
Income from equity investments of $80.1 million for the twelve months ended December 31, 2018 consists solely of realized gains of $44.1 million and unrealized gains of $36.0 million on our equity investment in Tandem Diabetes Care, Inc.
Interest and Other Income (Expense), Net
Interest income is $10.5 million, $3.3 million and $0.4 million for the twelve months ended December 31, 2018, 2017 and 2016, respectively, and is related to our marketable debt securities portfolio. Average interest rates and average invested balances both increased during 2018 compared to 2017 and during 2017 compared to 2016.
Other income (expense) for the twelve months ended December 31, 2018, 2017 and 2016 consists primarily of foreign currency transaction gains and losses due to the effects of foreign currency fluctuations.
Income Tax Expense
We recorded pre-tax losses in the each of the twelve months ended December 31, 2018, 2017 and 2016. The nominal income tax expense we recorded for 2018 is primarily attributable to state and foreign income tax expense, partially offset by the release of a valuation allowance related to acquired intangible assets for which we have no tax basis. The nominal income tax expense we recorded for 2017 and 2016 is primarily due to withholding and other income tax expenses in profitable jurisdictions.
Liquidity and Capital Resources
Overview, Capital Resources, and Capital Requirements
Our principal sources of liquidity are our existing cash, cash equivalents and marketable securities, cash generated from operations, proceeds from our convertible notes issuances, and access to our revolving line of credit. Our primary uses of cash have been for research and development programs, selling and marketing activities, capital expenditures, acquisitions of businesses, and debt service costs.
We expect that cash provided by our operations may fluctuate in future periods as a result of a number of factors, including fluctuations in our operating results, working capital requirements and capital deployment decisions. We have historically invested our cash primarily in U.S. dollar-denominated, investment grade, highly liquid obligations of U.S. government-sponsored enterprises, commercial paper, corporate debt, and money market funds. Certain of these investments are subject to general credit, liquidity and other market risks. The general condition of the financial markets and the economy may increase those risks and may affect the value and liquidity of investments and restrict our ability to access the capital markets.
Our future capital requirements will depend on many factors, including but not limited to:
| • | the revenue generated by sales of our approved products and other future products; |
| • | the expenses we incur in manufacturing, developing, selling and marketing our products; |
| • | the quality levels of our products and services; |
| • | the third-party reimbursement of our products for our customers; |
| • | our ability to efficiently scale our operations to meet demand for our current and any future products; |
| • | the costs, timing and risks of delays of additional regulatory approvals; |
| • | the costs of filing, prosecuting, defending and enforcing any patent claims and other intellectual property rights; |
| • | the rate of progress and cost of our clinical trials and other development activities; |
| • | the success of our research and development efforts; |
| • | the emergence of competing or complementary technological developments; |
| • | the terms and timing of any collaborative, licensing and other arrangements that we may establish; |
| • | the acquisition of businesses, products and technologies and our ability to integrate and manage any acquired businesses, products and technologies; and |
| • | the evolution of the international expansion of our business. |
We expect that existing cash and cash flows from our future operations will generally be sufficient to fund our ongoing core business. As current borrowing sources become due, we may be required to access the capital markets for additional funding. As we assess inorganic growth strategies, we may need to supplement our internally generated cash flow with outside
sources. In the event that we are required to access the debt market, we believe that we will be able to secure reasonable borrowing rates. As part of our liquidity strategy, we will continue to monitor our current level of earnings and cash flow generation as well as our ability to access the market in light of those earning levels.
A substantial portion of our operations are located in the United States, and the majority of our sales since inception have been made in U.S. dollars. Accordingly, our assessment is that we have no material net exposure to foreign currency exchange rate fluctuations at this time. However, as our business in markets outside of the United States continues to increase, we will be exposed to foreign currency exchange risk related to our foreign operations. Fluctuations in the rate of exchange between the U.S. dollar and foreign currencies, primarily the British Pound, the Euro, and the Canadian Dollar, could adversely affect our financial results, including our revenues, revenue growth rates, gross margins, income and losses as well as assets and liabilities. We currently engage in limited hedging transactions to reduce foreign currency risks on certain intercompany balances. We will continue to monitor and manage our financial exposures due to exchange rate fluctuations as an integral part of our overall risk management program. As of December 31, 2018, the cash balance held by our foreign subsidiaries with currencies other than the U.S. dollar was approximately $18.0 million. We intend to reinvest a substantial portion of our foreign earnings in those businesses, and we currently do not anticipate that we will need funds generated by foreign operations to fund our domestic operations.
As of December 31, 2018, our cash, cash equivalents and marketable securities totaled $1.386 billion, an increase of $837.0 million from December 31, 2017 due to the factors described in “Cash Flows” below. We believe that our cash, cash equivalents, and marketable securities balances, projected cash contributions from our commercial operations, and our $200.0 million revolving line of credit, of which $195.6 million remains available, will be sufficient to meet our anticipated seasonal working capital needs, capital expenditure requirements, contractual obligations, commitments, debt service requirements, and other liquidity requirements associated with our operations for at least the next 12 months.
Revolving Credit Agreement
In December 2018, we entered into an amended and restated five-year $200.0 million revolving Credit Agreement, including a sub-facility of up to $10.0 million for letters of credit. Subject to customary conditions and the approval of any lender whose commitment would be increased, we have the option to increase the maximum principal amount available under the Credit Agreement by up to an additional $300.0 million, resulting in a maximum available principal amount of $500.0 million. However, at this time none of the lenders have committed to provide any such increase in their commitments. Revolving loans under the Credit Agreement will be available for general corporate purposes, including working capital and capital expenditures. In March 2017, we drew $75.0 million on the Credit Agreement under a six-month term and we repaid the entire principal balance in May 2017. As of December 31, 2018, we had no outstanding borrowings, $4.4 million in outstanding letters of credit, and a total available balance of $195.6 million under the Credit Agreement. We monitor counterparty risk associated with the institutional lenders that are providing the credit facility. We currently believe that the credit facility will be available to us should we choose to borrow under it.
See Note 5 to the financial statements in Part II, Item 8 of this Annual Report for more information about the terms of the Credit Agreement.
Senior Convertible Notes
In June 2017, we completed an offering of $400.0 million aggregate principal amount of unsecured senior convertible notes with a stated interest rate of 0.75% and a maturity date of May 15, 2022 (the 2022 Notes). Holders may elect to convert the 2022 Notes any time after February 15, 2022 for shares of our common stock. The 2022 Notes may be settled in cash, stock, or a combination thereof, solely at our discretion. Interest on the 2022 Notes began accruing upon issuance and payable semi-annually on May 15 and November 15 of each year.
In November 2018, we completed an offering of $850.0 million aggregate principal amount of unsecured senior convertible notes with a stated interest rate of 0.75% and a maturity date of December 1, 2023 (the 2023 Notes). Holders may elect to convert the 2023 Notes any time after September 1, 2023 for shares of our common stock. The 2023 Notes may be settled in cash, stock, or a combination thereof, solely at out discretion. Interest on the 2023 Notes began accruing upon issuance and payable semi-annually on June 1 and December 1 of each year.
We used a portion of the net proceeds from the offering of the 2022 Notes to repay $75.0 million of borrowings under our existing credit facility in 2017. We used a portion of the net proceeds from the offering of the 2023 Notes to repurchase 0.8 million shares of our common stock for $100.0 million in 2018. The remainder of the net proceeds from the 2022 Notes and the 2023 Notes offerings are available for general corporate purposes and capital expenditures, including working capital needs. We may also use the net proceeds to expand our current business through in-licensing or acquisitions of, or investments in, other businesses, products or technologies; however, we do not have any significant commitments with respect to any such acquisitions or investments at this time.
2023 Note Hedge
In connection with the offering of the 2023 Notes, in November 2018 we entered into convertible note hedge transactions (the 2023 Note Hedge) with two of the initial purchasers of the 2023 Notes (the 2023 Counterparties) entitling us to purchase up to 5.2 million shares of our common stock at an initial price of $164.29 per share, each of which is subject to adjustment. The cost of the 2023 Note Hedge was $218.9 million and it will expire on December 1, 2023. The 2023 Note Hedge is expected to reduce the potential equity dilution upon any conversion of the 2023 Notes and/or offset any cash payments we are required to make in excess of the principal amount of converted 2023 Notes if the daily volume-weighted average price per share of our common stock exceeds the strike price of the 2023 Note Hedge. The strike price of the 2023 Note Hedge initially corresponds to the conversion price of the 2023 Notes and is subject to certain adjustments under the terms of the 2023 Note Hedge.
2023 Warrants
In November 2018, we also sold warrants (the 2023 Warrants) to the 2023 Counterparties to acquire up to 5.2 million shares of our common stock for cash proceeds of $183.8 million. The 2023 Warrants require net share settlement and a pro-rated number of warrants will expire on each of the 60 scheduled trading days starting on March 1, 2024.
See Note 5 to the financial statements in Part II, Item 8 of this Annual Report for more information about the 2022 Notes and the 2023 Notes, the 2023 Note Hedge, and the 2023 Warrants.
Cash Flows
The following table sets forth a summary of our cash flows for the periods indicated. See the financial statements in Part II, Item 8 of this Annual Report for complete statements of cash flows for these periods.
| Twelve Months Ended December 31, | Change | ||||||||||||||||||
| (In millions) | 2018 | 2017 | 2016 | 2018-2017 | 2017-2016 | ||||||||||||||
| Net cash provided by operating activities | $ | 123.2 | $ | 92.0 | $ | 56.2 | $ | 31.2 | $ | 35.8 | |||||||||
| Net cash used in investing activities | (139.8 | ) | (144.4 | ) | (55.9 | ) | 4.6 | (88.5 | ) | ||||||||||
| Net cash provided by financing activities | 710.4 | 399.1 | 8.1 | 311.3 | 391.0 | ||||||||||||||
| Effect of exchange rates on cash, cash equivalents, and restricted cash | 1.8 | 0.3 | — | 1.5 | 0.3 | ||||||||||||||
| Net increase in cash, cash equivalents, and restricted cash | $ | 695.6 | $ | 347.0 | $ | 8.4 | $ | 348.6 | $ | 338.6 |
As of December 31, 2018, we had $1.386 billion in cash, cash equivalents and short-term marketable securities, which is an increase of $837.0 million compared to $548.6 million as of December 31, 2017. The primary cash flows during the twelve months ended December 31, 2018, 2017 and 2016 are described below.
Operating Cash Flows
Net cash provided by operating activities during 2018 was comprised of a net loss of $127.1 million and changes in working capital balances of $40.9 million, offset by $291.2 million of net non-cash expenses. Net non-cash expenses were primarily related to a $217.7 million non-cash collaborative research and development fee, share-based compensation, depreciation and amortization, non-cash interest expense for our senior convertible notes, and realized and unrealized gains on our equity investment in Tandem Diabetes Care, Inc.
Net cash provided by operating activities during 2017 was comprised of a net loss of $50.2 million, offset by $139.6 million of net non-cash expenses and $2.6 million of changes in working capital balances. Net non-cash expenses were primarily related to share-based compensation, depreciation and amortization, and non-cash interest expense for our senior convertible notes.
Net cash provided by operating activities during 2016 was comprised of a net loss of $65.6 million and changes in working capital balances of $6.3 million, offset by $128.1 million of net non-cash expenses. Net non-cash expenses were primarily related to share-based compensation and depreciation and amortization.
Investing Cash Flows
Net cash used in investing activities during 2018 was primarily comprised of $61.4 million for net purchases of marketable securities and $67.1 million for capital expenditures.
Net cash used in investing activities during 2017 was primarily comprised of $78.4 million for net purchases of marketable securities and $66.0 million for capital expenditures.
Net cash used in investing activities during 2016 was primarily comprised of $55.7 million for capital expenditures.
Financing Cash Flows
Net cash provided by financing activities during 2018 was primarily comprised of $836.6 million in net proceeds from the issuance of our 2023 Notes and $183.8 million in proceeds from the sale of the 2023 Warrants, partially offset by $218.9 million for the purchase of the 2023 Note Hedge and $100.0 million for the purchase of treasury shares.
Net cash provided by financing activities during 2017 was primarily comprised of $389.0 million in net proceeds from the issuance of our 2022 Notes.
Net cash provided by financing activities during 2016 was primarily comprised of $10.4 million from the issuance of common stock under our employee stock plans.
Contractual Obligations
We are party to various leasing arrangements, primarily for office, manufacturing and warehouse space that expire at various times through March 2028.
The following table summarizes our outstanding contractual obligations as of December 31, 2018 and the effect those obligations are expected to have on our liquidity and cash flows in future periods:
| (In millions) | Total(3) | Less than 1 Year(3) | 1-3 Years | 3-5 Years(1) | More than 5 Years | |||||||||||||||
| Senior convertible notes (1) | $ | 1,292.4 | $ | 9.4 | $ | 18.8 | $ | 1,264.2 | $ | — | ||||||||||
| Lease obligations (2) | 68.8 | 14.4 | 34.2 | 11.3 | 8.9 | |||||||||||||||
| Total | $ | 1,361.2 | $ | 23.8 | $ | 53.0 | $ | 1,275.5 | $ | 8.9 |
| (1) | We issued senior convertible notes in May and June 2017 that are due in May 2022 and we issued senior convertible notes in November 2018 that are due in December 2023. The obligations presented above include both principal and interest for these notes. Although these notes mature in 2022 and 2023, they may be converted into cash and shares of our common stock prior to maturity if certain conditions are met. Any conversion prior to maturity can result in repayment of the principal amounts sooner than the scheduled repayment as indicated in the table. See Note 5 to the financial statements in Part II, Item 8 of this Annual Report for further discussion of the terms of our senior convertible notes. |
| (2) | Includes a financing lease obligation related to our Mesa, Arizona facility. See Note 6 to the financial statements in Part II, Item 8 of this Annual Report for more information. |
| (3) | We are also party to various purchase arrangements related to components used in manufacturing and research and development activities. As of December 31, 2018, we had firm purchase commitments with vendors totaling approximately $204.0 million, most of which are due within one year. Firm purchase commitments represent agreements to purchase products and services that are enforceable, legally binding and specify terms, including: fixed or minimum quantities to be purchased; fixed, minimum or variable price provisions; and the approximate timing of the payments. |
Off-Balance Sheet Arrangements
As of December 31, 2018, we did not have any significant off-balance sheet arrangements, as defined in Item 303(a)(4)(ii) of Regulation S-K.
Recent Accounting Guidance
For a description of recently issued accounting guidance that is applicable to our financial statements, see Note 1 to the financial statements in Part II, Item 8 of this Annual Report.
Item 7A. QUANTITATIVE AND QUALITATIVE DISCLOSURES ABOUT MARKET RISK
Interest Rate Risk
The primary objective of our investment activities is to preserve our capital for the purpose of funding operations while at the same time maximizing the income we receive from our investments without significantly increasing risk. To achieve these objectives, our investment policy allows us to maintain a portfolio of cash equivalents and short-term investments in a variety of securities, including money market funds, U.S. Treasury debt and corporate debt securities. Due to the short-term nature of our investments, we believe that we have no material exposure to interest rate risk.
Market Price Sensitive Instruments
In order to reduce potential equity dilution, in connection with the issuance of the 2023 Notes we entered into the 2023 Hedge which entitles us to purchase shares of our common stock. Upon conversion of the 2023 Notes, the 2023 Hedge is expected to reduce the equity dilution if the daily volume-weighted average price per share of our common stock exceeds the strike price of the hedge. We also entered into warrant transactions with the counterparties of the 2023 Hedge entitling them to acquire shares of our common stock. The warrant transactions could have a dilutive effect on our earnings per share to the extent that the price of our common stock during a given quarterly or annual measurement period exceeds the strike price of the warrants. See Note 5 to the financial statements in Part II, Item 8 of this Annual Report for more information.
Foreign Currency Exchange Risk
A substantial portion of our operations are located in the United States, and the majority of our sales since inception have been made in U.S. dollars. Accordingly, our assessment is that we have no material net exposure to foreign currency exchange rate fluctuations at this time. However, as our business in markets outside of the United States continues to increase, we will be exposed to foreign currency exchange risk related to our foreign operations. Fluctuations in the rate of exchange between the U.S. dollar and foreign currencies, primarily the British Pound, the Euro, and the Canadian Dollar, could adversely affect our financial results, including our revenues, revenue growth rates, gross margins, income and losses as well as assets and liabilities.
We translate the financial statements of our foreign subsidiaries with functional currencies other than the U.S. dollar into the U.S. dollar for consolidation using end-of-period exchange rates for assets and liabilities and average exchange rates during each reporting period for results of operations. We record net gains or losses resulting from the translation of foreign financial statements and the effect of exchange rate changes on intercompany receivables and payables of a long-term nature as a separate component of stockholders’ equity. These adjustments will affect net income only upon sale or liquidation of the underlying investment in foreign subsidiaries.
We record exchange rate fluctuations resulting from the translation of the short-term intercompany balances between domestic entities and our foreign subsidiaries as foreign currency transaction gains or losses and include them in interest and other income (expense), net in our statement of operations. We enter into foreign currency forward contracts for certain intercompany balances in order to partially offset the impact from fluctuation of the foreign currency rates.
As of December 31, 2018, a notional amount of $60.0 million was outstanding to hedge currency risk relating to certain intercompany balances. Derivative instrument gains on forward exchange contracts were $0.4 million for the twelve months ended December 31, 2018 and are included in interest and other income (expense), net in our statement of operations. The fair value of the forward contract exchange derivative instrument liability was $0.2 million as of December 31, 2018. We record derivative instruments in other current assets or other current liabilities in our balance sheets consistent with the nature of the instrument at period end. We entered into no foreign currency forward contracts during 2017 or 2016.
Notional principal amounts provide one measure of the transaction volume outstanding as of period end, but they do not represent the amount of our exposure to market loss. Estimates of fair value are based on applicable and commonly used pricing models using prevailing financial market information. The amounts ultimately realized upon settlement of these financial instruments, together with the gains and losses on the underlying exposures, will depend on actual market conditions during the remaining life of the instruments. We monitor and manage our financial exposures due to exchange rate fluctuations as an integral part of our overall risk management program, which recognizes the unpredictability of financial markets and seeks to reduce potentially adverse effects on our financial results.
Item 8. CONSOLIDATED FINANCIAL STATEMENTS AND SUPPLEMENTARY DATA
The information required is set forth under “Report of Independent Registered Public Accounting Firm,” “Consolidated Balance Sheets,” “Consolidated Statements of Operations,” “Consolidated Statements of Comprehensive Loss,” “Consolidated Statements of Stockholders’ Equity,” “Consolidated Statements of Cash Flows” and “Notes to Consolidated Financial Statements” on pages F-2 to F-37 of this Annual Report.
Item 9. CHANGES IN AND DISAGREEMENTS WITH ACCOUNTANTS ON ACCOUNTING AND FINANCIAL DISCLOSURE
Not applicable.
Item 9A. CONTROLS AND PROCEDURES
Evaluation of Disclosure Controls and Procedures
Regulations under the Securities Exchange Act of 1934 require public companies to maintain “disclosure controls and procedures,” which are defined to mean a company’s controls and other procedures that are designed to ensure that information required to be disclosed in the reports that it files or submits under the Securities Exchange Act of 1934 is accumulated and timely communicated to management, including our Chief Executive Officer and Chief Financial Officer, recorded, processed, summarized, and reported within the time periods specified in the Securities and Exchange Commission’s rules and forms. Our management, including our Chief Executive Officer and our Chief Financial Officer, conducted an evaluation as of the end of the period covered by this report of the effectiveness of our disclosure controls and procedures. Based on their evaluation as of December 31, 2018, our Chief Executive Officer and our Chief Financial Officer concluded that our disclosure controls and procedures were effective as of such date for this purpose.
Changes in Internal Control over Financial Reporting
There were no changes in our internal control over financial reporting during our last fiscal quarter that have materially affected, or are reasonably likely to materially affect our internal control over financial reporting.
Management’s Report on Internal Control over Financial Reporting
Our management is responsible for establishing and maintaining adequate internal control over financial reporting as defined in Rule 13a-15(f) under the Securities Exchange Act of 1934. Our internal control over financial reporting is designed to provide reasonable assurance to our management and Board of Directors regarding the preparation and fair presentation of published financial statements.
Our management, with the participation of the Chief Executive and Chief Financial Officers, assessed the effectiveness of our internal control over financial reporting as of December 31, 2018. In making this assessment, our management used the criteria set forth by the 2013 Committee of Sponsoring Organizations of the Treadway Commission (COSO) in Internal Control—Integrated Framework. Based on this assessment, our management, with the participation of the Chief Executive and Chief Financial Officers, believes that, as of December 31, 2018, our internal control over financial reporting is effective based on those criteria. The effectiveness of our internal control over financial reporting as of December 31, 2018 has been audited by Ernst & Young LLP an Independent Public Registered Accounting Firm, as stated in their report which is included herein.
The certifications of our Chief Executive Officer and Chief Financial Officer required under Section 302 of the Sarbanes-Oxley Act have been filed as Exhibits 31.01 and 31.02 to this report.
Because of its inherent limitations, internal control over financial reporting may not prevent or detect misstatements. Therefore, even those systems determined to be effective can provide only reasonable assurance with respect to financial statement preparation and presentation.
Limitation on Effectiveness of Controls
It should be noted that any system of controls, however well designed and operated, can provide only reasonable, and not absolute, assurance that the objectives of the system are met. The design of any control system is based, in part, upon the benefits of the control system relative to its costs. Control systems can be circumvented by the individual acts of some persons, by collusion of two or more people, or by management override of the control. In addition, over time, controls may become inadequate because of changes in conditions, or the degree of compliance with the policies or procedures may deteriorate. Because of these and other inherent limitations of control systems, we cannot guaranty that any design will succeed in achieving its stated goals under all potential future conditions, regardless of how remote.
REPORT OF INDEPENDENT REGISTERED PUBLIC ACCOUNTING FIRM
The Board of Directors and Stockholders of DexCom, Inc.
Opinion on Internal Control over Financial Reporting
We have audited DexCom, Inc.’s internal control over financial reporting as of December 31, 2018, based on criteria established in Internal Control-Integrated Framework issued by the Committee of Sponsoring Organizations of the Treadway Commission (2013 Framework) (the COSO criteria). In our opinion, DexCom, Inc. (the Company) maintained, in all material respects, effective internal control over financial reporting as of December 31, 2018, based on the COSO criteria.
We also have audited, in accordance with the standards of the Public Company Accounting Oversight Board (United States) (PCAOB), the consolidated balance sheets of DexCom, Inc. as of December 31, 2018 and 2017, the related consolidated statements of operations, comprehensive loss, stockholders’ equity and cash flows for each of the three years in the period ended December 31, 2018, and the related notes and financial statement schedule listed in the Index at Item 15(a) and our report dated February 21, 2019 expressed an unqualified opinion thereon.
Basis for Opinion
The Company’s management is responsible for maintaining effective internal control over financial reporting and for its assessment of the effectiveness of internal control over financial reporting included in the accompanying Management’s Report on Internal Control over Financial Reporting. Our responsibility is to express an opinion on the Company’s internal control over financial reporting based on our audit. We are a public accounting firm registered with the PCAOB and are required to be independent with respect to the Company in accordance with the U.S. federal securities laws and the applicable rules and regulations of the Securities and Exchange Commission and the PCAOB.
We conducted our audit in accordance with the standards of the PCAOB. Those standards require that we plan and perform the audit to obtain reasonable assurance about whether effective internal control over financial reporting was maintained in all material respects.
Our audit included obtaining an understanding of internal control over financial reporting, assessing the risk that a material weakness exists, testing and evaluating the design and operating effectiveness of internal control based on the assessed risk, and performing such other procedures as we considered necessary in the circumstances. We believe that our audit provides a reasonable basis for our opinion.
Definition and Limitations of Internal Control Over Financial Reporting
A company’s internal control over financial reporting is a process designed to provide reasonable assurance regarding the reliability of financial reporting and the preparation of financial statements for external purposes in accordance with generally accepted accounting principles. A company’s internal control over financial reporting includes those policies and procedures that (1) pertain to the maintenance of records that, in reasonable detail, accurately and fairly reflect the transactions and dispositions of the assets of the company; (2) provide reasonable assurance that transactions are recorded as necessary to permit preparation of financial statements in accordance with generally accepted accounting principles, and that receipts and expenditures of the company are being made only in accordance with authorizations of management and directors of the company; and (3) provide reasonable assurance regarding prevention or timely detection of unauthorized acquisition, use, or disposition of the company’s assets that could have a material effect on the financial statements.
Because of its inherent limitations, internal control over financial reporting may not prevent or detect misstatements. Also, projections of any evaluation of effectiveness to future periods are subject to the risk that controls may become inadequate because of changes in conditions, or that the degree of compliance with the policies or procedures may deteriorate.
/s/ Ernst & Young LLP
San Diego, California
February 21, 2019
Item 9B. OTHER INFORMATION
None.
PART III
Item 10. DIRECTORS, EXECUTIVE OFFICERS AND CORPORATE GOVERNANCE
The information concerning our directors required by this Item is incorporated by reference to the section in our Proxy Statement entitled “Proposal No. 1 – Election of Directors.”
The information concerning our executive officers required by this Item is incorporated by reference to the section in our Proxy Statement entitled “Executive Officers.”
The information concerning compliance with Section 16(a) of the Securities Exchange Act of 1934 required by this Item is incorporated by reference to the section in our Proxy Statement entitled “Section 16(a) Beneficial Ownership Reporting Compliance.”
We have adopted a written code of ethics for financial employees that applies to our principal executive officer, principal financial officer, principal accounting officer, controller and other employees of the finance department designated by our Chief Financial Officer. This code of ethics, titled the “Code of Conduct and Ethics for Chief Executive Officer and Senior Finance Personnel,” is publicly available on our Internet website at https://dexcom.gcs-web.com/corporate-governance. The information contained on our Internet website is not incorporated by reference into this Annual Report on Form 10-K.
The information concerning the audit committee of the Board of Directors required by this Item is incorporated by reference to information set forth in the Proxy Statement.
The information concerning material changes to the procedures by which stockholders may recommend nominees to the Board of Directors required by this Item is incorporated by reference to information set forth in the Proxy Statement.
Item 11. EXECUTIVE COMPENSATION
The information required by this Item concerning executive compensation and our Compensation Committee is incorporated by reference to information set forth in the Proxy Statement under the heading “Executive Compensation.”
Item 12. SECURITY OWNERSHIP OF CERTAIN BENEFICIAL OWNERS AND MANAGEMENT AND RELATED STOCKHOLDER MATTERS
The information required by this Item is incorporated by reference to information set forth in the Proxy Statement under the headings “Principal Stockholders and Stock Ownership by Management” and “Equity Compensation Plan Information.”
Item 13. CERTAIN RELATIONSHIPS AND RELATED TRANSACTIONS, AND DIRECTOR INDEPENDENCE
The information required by this Item with respect to director independence is incorporated by reference to information set forth in the Proxy Statement.
The information concerning certain relationships and related transactions required by the Item is incorporated by reference to the section in our Proxy Statement entitled “Certain Transactions.”
Item 14. PRINCIPAL ACCOUNTANT FEES AND SERVICES
The information concerning principal accountant fees and services required by this Item is incorporated by reference to the section in our Proxy Statement entitled “Ratification of Selection of Independent Registered Public Accounting Firm.”
PART IV
Item 15. EXHIBITS, FINANCIAL STATEMENT SCHEDULES
| (a) | The following documents are filed as part of this Annual Report: |
- Financial Statements.
The financial statements listed in Part II, Item 8 of this Annual Report.
- Financial Statement Schedules.
For the three fiscal years ended December 31, 2018, Schedule II – Valuation and Qualifying Accounts.
Financial statement schedules not listed above have been omitted because information required to be set forth therein is not applicable, not required, or the information required by such schedules is shown in the financial statements or the notes thereto.
- Exhibits.
| Exhibit Number | Exhibit Description | Incorporated by Reference | Provided Herewith | ||||||||||||
| Form | File No. | Date of First Filing | Exhibit Number | ||||||||||||
| 32.02 | Certification of Chief Financial Officer Pursuant to 18 U.S.C. Section 1350 and Securities Exchange Act Rule 13a-14(b)*** | X | |||||||||||||
| 101.INS | XBRL Instance Document | X | |||||||||||||
| 101.SCH | XBRL Taxonomy Extension Schema Document | X | |||||||||||||
| 101.CAL | XBRL Taxonomy Extension Calculation Linkbase Document | X | |||||||||||||
| 101.DEF | XBRL Taxonomy Extension Definition Linkbase Document | X | |||||||||||||
| 101.LAB | XBRL Taxonomy Extension Label Linkbase Document | X | |||||||||||||
| 101.PRE | XBRL Taxonomy Extension Presentation Linkbase Document | X |
| * | Represents a management contract or compensatory plan. |
| ** | Confidential treatment has been requested for certain portions of this document pursuant to an application for confidential treatment sent to the Securities and Exchange Commission. Such portions are omitted from this filing and were filed separately with the Securities and Exchange Commission. |
| *** | This certification is not deemed “filed” for purposes of Section 18 of the Securities Exchange Act, or otherwise subject to the liability of that section. Such certification will not be deemed to be incorporated by reference into any filing under the Securities Act of 1933 or the Securities Exchange Act of 1934, except to the extent that DexCom specifically incorporates it by reference. |
Item 16. FORM 10-K SUMMARY
None
SIGNATURES
Pursuant to the requirements of Section 13 or 15(d) of the Securities Exchange Act of 1934, the registrant has duly caused this report to be signed on its behalf by the undersigned thereunto duly authorized.
| DEXCOM, INC. (Registrant) | ||||||
| Dated: February 21, 2019 | By: | /S/ QUENTIN S. BLACKFORD | ||||
| Quentin S. Blackford, Executive Vice President and Chief Financial Officer (Principal Financial and Accounting Officer) |
POWER OF ATTORNEY
KNOW ALL PERSONS BY THESE PRESENTS, that each person whose signature appears below constitutes and appoints Kevin Sayer and Quentin Blackford, jointly and severally, his attorneys-in-fact, each with the power of substitution, for him in any and all capacities, to sign any amendments to this Report on Form 10-K and to file same, with exhibits thereto and other documents in connection therewith, with the Securities and Exchange Commission, hereby ratifying and confirming all that each of said attorneys-in-fact, or his substitutes, may do or cause to be done by virtue hereof.
Pursuant to the requirements of the Securities Exchange Act of 1934, this Report has been signed below by the following persons on behalf of the Registrant and in the capacities and on the dates indicated.
| Signature | Title | Date | ||
| /S/ KEVIN R. SAYER | Chairman of the Board of Directors, President and Chief Executive Officer (Principal Executive Officer) | February 21, 2019 | ||
| Kevin R. Sayer | ||||
| /S/ QUENTIN S. BLACKFORD | Executive Vice President and Chief Financial Officer (Principal Financial and Accounting Officer) | February 21, 2019 | ||
| Quentin S. Blackford | ||||
| /S/ MARK FOLETTA | Lead Independent Director | February 21, 2019 | ||
| Mark Foletta | ||||
| /S/ STEVE ALTMAN | Director | February 21, 2019 | ||
| Steve Altman | ||||
| /S/ NICHOLAS AUGUSTINOS | Director | February 21, 2019 | ||
| Nicholas Augustinos | ||||
| /S/ RICHARD COLLINS | Director | February 21, 2019 | ||
| Richard Collins | ||||
| /S/ BARBARA KAHN | Director | February 21, 2019 | ||
| Barbara Kahn | ||||
| /S/ JAY SKYLER | Director | February 21, 2019 | ||
| Jay Skyler, M.D. | ||||
| /S/ ERIC TOPOL | Director | February 21, 2019 | ||
| Eric Topol, M.D. |
DEXCOM, INC.
INDEX TO CONSOLIDATED FINANCIAL STATEMENTS
| Report of Independent Registered Public Accounting Firm | F-2 | |
| Consolidated Balance Sheets | F-3 | |
| Consolidated Statements of Operations | F-4 | |
| Consolidated Statements of Comprehensive Loss | F-5 | |
| Consolidated Statements of Stockholders’ Equity | F-6 | |
| Consolidated Statements of Cash Flows | F-7 | |
| Notes to Consolidated Financial Statements | F-9 |
F-1
REPORT OF INDEPENDENT REGISTERED PUBLIC ACCOUNTING FIRM
The Board of Directors and Stockholders of DexCom, Inc.
Opinion on the Financial Statements
We have audited the accompanying consolidated balance sheets of DexCom, Inc. (the Company) as of December 31, 2018 and 2017, the related consolidated statements of operations, comprehensive loss, stockholders’ equity and cash flows for each of the three years in the period ended December 31, 2018, and the related notes and financial statement schedule listed in the Index at Item 15(a) (collectively referred to as the “consolidated financial statements”). In our opinion, the consolidated financial statements present fairly, in all material respects, the financial position of the Company at December 31, 2018 and 2017, and the results of its operations and its cash flows for each of the three years in the period ended December 31, 2018, in conformity with U.S. generally accepted accounting principles.
We also have audited, in accordance with the standards of the Public Company Accounting Oversight Board (United States) (PCAOB), the Company’s internal control over financial reporting as of December 31, 2018, based on criteria established in Internal Control-Integrated Framework issued by the Committee of Sponsoring Organizations of the Treadway Commission (2013 Framework) and our report dated February 21, 2019 expressed an unqualified opinion thereon.
Basis for Opinion
These financial statements are the responsibility of the Company’s management. Our responsibility is to express an opinion on the Company’s financial statements based on our audits. We are a public accounting firm registered with the PCAOB and are required to be independent with respect to the Company in accordance with the U.S. federal securities laws and the applicable rules and regulations of the Securities and Exchange Commission and the PCAOB.
We conducted our audits in accordance with the standards of the PCAOB. Those standards require that we plan and perform the audit to obtain reasonable assurance about whether the financial statements are free of material misstatement, whether due to error or fraud. Our audits included performing procedures to assess the risks of material misstatement of the financial statements, whether due to error or fraud, and performing procedures that respond to those risks. Such procedures included examining, on a test basis, evidence regarding the amounts and disclosures in the financial statements. Our audits also included evaluating the accounting principles used and significant estimates made by management, as well as evaluating the overall presentation of the financial statements. We believe that our audits provide a reasonable basis for our opinion.
/s/ Ernst & Young LLP
We have served as the Company’s auditor since 2000
San Diego, California
February 21, 2019
F-2
DexCom, Inc.
Consolidated Balance Sheets
(In millions—except share and par value data)
| December 31, | |||||||
| 2018 | 2017 | ||||||
| Assets | |||||||
| Current assets: | |||||||
| Cash and cash equivalents | $ | 1,137.0 | $ | 441.5 | |||
| Short-term marketable securities | 248.6 | 107.1 | |||||
| Accounts receivable, net | 226.7 | 134.3 | |||||
| Inventory | 70.7 | 45.2 | |||||
| Prepaid and other current assets | 16.5 | 16.6 | |||||
| Total current assets | 1,699.5 | 744.7 | |||||
| Property and equipment, net | 183.1 | 145.6 | |||||
| Goodwill | 18.7 | 12.1 | |||||
| Other assets | 14.7 | 1.7 | |||||
| Total assets | $ | 1,916.0 | $ | 904.1 | |||
| Liabilities and Stockholders’ Equity | |||||||
| Current liabilities: | |||||||
| Accounts payable and accrued liabilities | $ | 147.1 | $ | 87.2 | |||
| Accrued payroll and related expenses | 72.4 | 48.5 | |||||
| Deferred revenue | 2.9 | 3.2 | |||||
| Total current liabilities | 222.4 | 138.9 | |||||
| Other liabilities | 20.0 | 18.2 | |||||
| Long-term senior convertible notes | 1,010.3 | 327.6 | |||||
| Total liabilities | 1,252.7 | 484.7 | |||||
| Commitments and contingencies | |||||||
| Stockholders’ equity: | |||||||
| Preferred stock, $0.001 par value, 5.0 million shares authorized; no shares issued and outstanding at December 31, 2018 and December 31, 2017, respectively | — | — | |||||
| Common stock, $0.001 par value, 200.0 million shares authorized; 91.1 million and 90.0 million shares issued and outstanding, respectively, at December 31, 2018; 87.3 million and 87.0 million shares |
Showing the first 8K of 144K characters. Open the full section