 filings.tools
Item 5. MARKET FOR REGISTRANT’S COMMON EQUITY, RELATED STOCKHOLDER MATTERS AND ISSUER PURCHASES OF EQUITY SECURITIES
4K characters. Original on sec.gov · Markdown
Item 5. MARKET FOR REGISTRANT’S COMMON EQUITY, RELATED STOCKHOLDER MATTERS AND ISSUER PURCHASES OF EQUITY SECURITIES
Market Information for Common Stock
DexCom’s common stock is traded on the Nasdaq Global Select Market under the symbol “DXCM.” The following table sets forth the high and low intraday per share sales prices reported on Nasdaq for DexCom’s common stock for the periods indicated.
| High | Low | |||||||
| Year Ended December 31, 2018 | ||||||||
| First Quarter | $ | 75.30 | $ | 51.04 | ||||
| Second Quarter | $ | 102.10 | $ | 69.51 | ||||
| Third Quarter | $ | 148.56 | $ | 92.33 | ||||
| Fourth Quarter | $ | 152.14 | $ | 105.05 | ||||
| High | Low | |||||||
| Year Ended December 31, 2017 | ||||||||
| First Quarter | $ | 88.80 | $ | 57.68 | ||||
| Second Quarter | $ | 85.32 | $ | 66.16 | ||||
| Third Quarter | $ | 78.92 | $ | 42.62 | ||||
| Fourth Quarter | $ | 62.35 | $ | 43.74 |
Stockholders
We had approximately 30 stockholders of record as of February 19, 2019. The number of beneficial owners of our common stock at that date was substantially greater than the number of record holders because a large portion of our common stock is held of record through brokerage firms in “street name.”
Dividend Policy
We have never declared or paid any cash dividends on our capital stock. We currently intend to retain any future earnings to finance the operation and expansion of our business, and we do not expect to declare or pay any dividends in the foreseeable future.
Recent Sales of Unregistered Securities
There were no unregistered sales of equity securities which have not been previously disclosed in a quarterly report on Form 10-Q or a current report on Form 8-K during the year ended December 31, 2018.
Purchases of Equity Securities by the Issuer and Affiliated Purchasers
In November 2018 we repurchased 0.8 million shares of our common stock for $100.0 million, or an average per share price of $123.99. None of these shares were repurchased as part of a publicly announced share repurchase plan.
Company Stock Price Performance
The graph below compares the cumulative total stockholder return on our common stock with the cumulative total returns on the Nasdaq Composite Index and the Nasdaq Medical Equipment Index over the five-year period ending December 31, 2018. The graph assumes that $100 was invested in DexCom common stock and in each of the other indices on December 31, 2013 and that all dividends were reinvested. The comparisons in the graph below are based on historical data and are not intended to forecast the possible future performance of DexCom’s common stock.
The graph below and related information shall not be deemed “soliciting material” or be deemed to be “filed” with the SEC, nor shall such information be incorporated by reference into any future filing, except to the extent that we specifically incorporate it by reference into such filing.
COMPARISON OF FIVE-YEAR CUMULATIVE TOTAL RETURN*
AMONG DEXCOM, INC.
THE NASDAQ COMPOSITE INDEX
AND THE NASDAQ MEDICAL EQUIPMENT INDEX
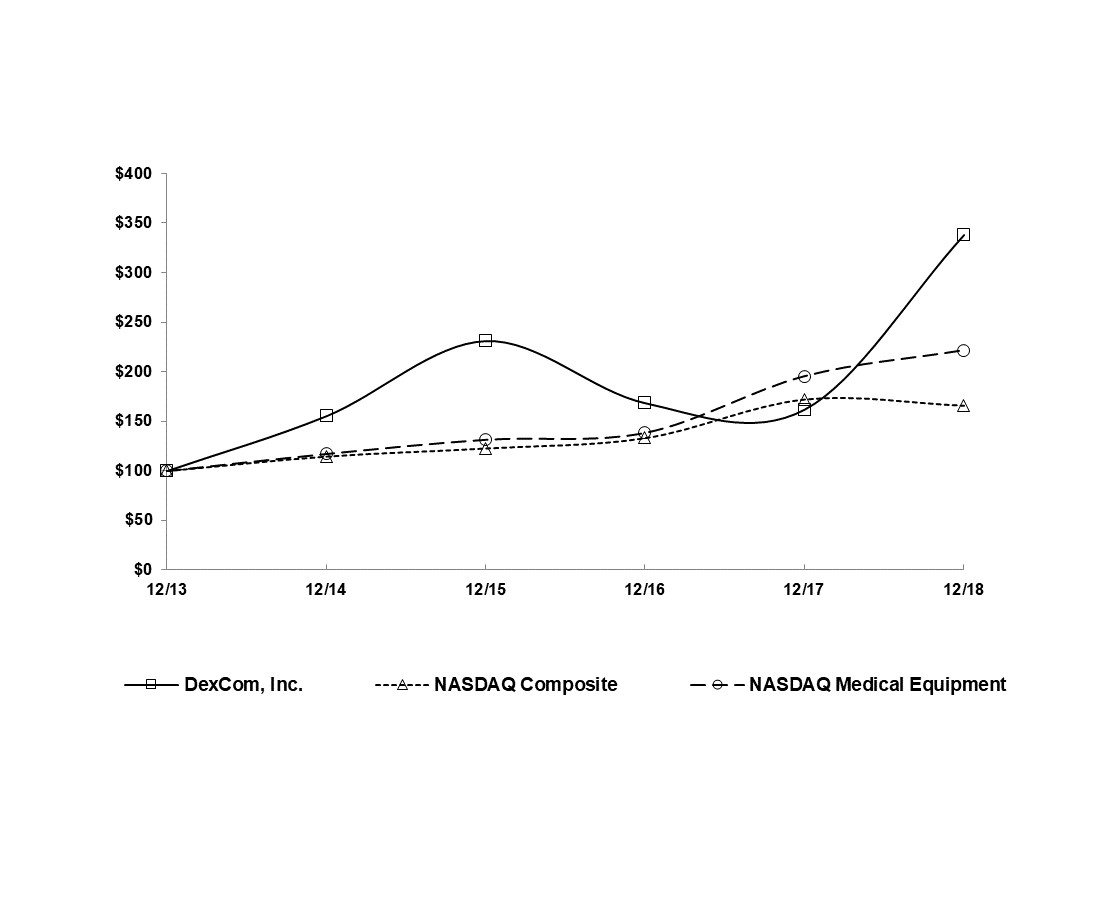
- $100 invested on December 31, 2013 in stock or index, including reinvestment of any dividends.
| December 31, 2013 | December 31, 2014 | December 31, 2015 | December 31, 2016 | December 31, 2017 | December 31, 2018 | ||||||||||||||||||
| DexCom, Inc. | $ | 100.00 | $ | 155.46 | $ | 231.29 | $ | 168.60 | $ | 162.07 | $ | 338.32 | |||||||||||
| Nasdaq Composite | $ | 100.00 | $ | 114.62 | $ | 122.81 | $ | 133.19 | $ | 172.11 | $ | 165.84 | |||||||||||
| Nasdaq Medical Equipment | $ | 100.00 | $ | 117.22 | $ | 131.48 | $ | 138.45 | $ | 195.37 | $ | 221.45 |
Previous: Item 4. MINE SAFETY DISCLOSURES · Next: Item 6. SELECTED FINANCIAL DATA