 filings.tools
Item 5. MARKET FOR THE REGISTRANT’S COMMON EQUITY, RELATED STOCKHOLDER MATTERS AND ISSUER PURCHASES OF EQUITY SECURITIES
5K characters. Original on sec.gov · Markdown
Item 5. MARKET FOR THE REGISTRANT’S COMMON EQUITY, RELATED STOCKHOLDER MATTERS AND ISSUER PURCHASES OF EQUITY SECURITIES
Equifax’s common stock is traded on the New York Stock Exchange under the symbol “EFX.” As of January 31, 2017, Equifax had approximately 3,819 holders of record; however, Equifax believes the number of beneficial owners of common stock exceeds this number.
The table below sets forth the high and low sales prices per share of Equifax common stock, as reported on the New York Stock Exchange, for each quarter in the last two fiscal years and dividends declared per share:
| High Sales Price | Low Sales Price | Dividends (1) | |||||||||
| 2016 | |||||||||||
| First Quarter | $ | 113.39 | $ | 92.19 | $ | 0.33 | |||||
| Second Quarter | $ | 127.73 | $ | 112.58 | $ | 0.33 | |||||
| Third Quarter | $ | 135.72 | $ | 127.80 | $ | 0.33 | |||||
| Fourth Quarter | $ | 133.61 | $ | 111.54 | $ | 0.33 | |||||
| 2015 | |||||||||||
| First Quarter | $ | 94.90 | $ | 79.62 | $ | 0.29 | |||||
| Second Quarter | $ | 101.13 | $ | 91.61 | $ | 0.29 | |||||
| Third Quarter | $ | 105.86 | $ | 90.94 | $ | 0.29 | |||||
| Fourth Quarter | $ | 114.46 | $ | 96.22 | $ | 0.29 |
| (1) | Equifax’s Senior Credit Facilities, as defined in Item 7 of this Form 10-K, restricts our ability to pay cash dividends on our capital stock or repurchase capital stock if a default exists or would result according to the terms of the credit agreement. |
Shareholder Return Performance Graph
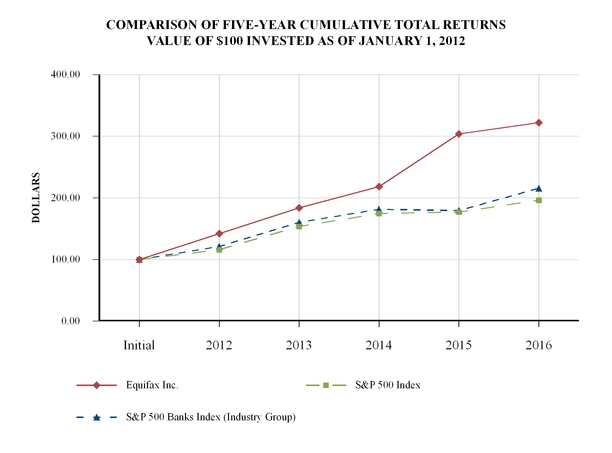
The graph on the below compares Equifax’s five-year cumulative total shareholder return with that of the Standard & Poor’s Composite Stock Index (S&P 500) and a peer group index, the S&P 500 Banks Index (Industry Group). The graph assumes that value of the investment in our Common Stock and each index was $100 on the last trading day of 2011 and that all quarterly dividends were reinvested without commissions. Our past performance may not be indicative of future performance.
COMPARATIVE FIVE-YEAR CUMULATIVE TOTAL RETURN AMONG EQUIFAX INC., S&P 500 INDEX, AND DOW JONES U.S. GENERAL FINANCIAL INDEX
| Fiscal Year Ended December 31, | |||||||||||||||||
| Initial | 2012 | 2013 | 2014 | 2015 | 2016 | ||||||||||||
| Equifax Inc. | 100.00 | 141.91 | 183.80 | 218.08 | 303.76 | 321.99 | |||||||||||
| S&P 500 Index | 100.00 | 116.00 | 153.57 | 174.59 | 177.00 | 196.31 | |||||||||||
| S&P 500 Banks Index (Industry Group) | 100.00 | 121.19 | 160.27 | 181.52 | 179.45 | 215.65 |
The table below contains information with respect to purchases made by or on behalf of Equifax of its common stock during the fourth quarter ended December 31, 2016:
Issuer Purchases of Equity Securities
| Period | Total Number of Shares Purchased (1) | Average Price Paid Per Share (2) | Total Number of Shares Purchased as Part of Publicly-Announced Plans or Programs | Maximum Number (or Approximate Dollar Value) of Shares that May Yet Be Purchased Under the Plans or Programs (3) | ||||||||||
| October 1 - October 31, 2016 | 54,455 | $ | — | — | $ | 667,199,250 | ||||||||
| November 1 - November 30, 2016 | 1,159 | $ | — | — | $ | 667,199,250 | ||||||||
| December 1 - December 31, 2016 | 807 | $ | — | — | $ | 667,199,250 | ||||||||
| Total | 56,421 | $ | — | — | $ | 667,199,250 |
| (1) | The total number of shares purchased includes: (a) shares purchased pursuant to our publicly-announced share repurchase program, or Program; and (b) shares surrendered, or deemed surrendered, in satisfaction of the exercise price and/or to satisfy tax withholding obligations in connection with the exercise of employee stock options and vesting of restricted stock, totaling 54,455 shares for the month of October 2016, 1,159 shares for the month of November 2016 and 807 shares for the month of December 2016. |
| (2) | Average price paid per share for shares purchased as part of our Program (includes brokerage commissions). |
| (3) | Under the Program, we did not repurchase any common shares during the twelve months ended December 31, 2016. At December 31, 2016, the amount authorized for future share repurchases under the Program was $667.2 million. |
Information relating to compensation plans under which the Company’s equity securities are authorized for issuance is included in the section captioned “Equity Compensation Plan Information” in our 2017 Proxy Statement and is incorporated herein by reference.
Previous: Item 4. MINE SAFETY DISCLOSURES · Next: Item 6. SELECTED FINANCIAL DATA