 filings.tools
Item 5. Market for Registrant’s Common Equity, Related Stockholder Matters and Issuer Purchases of Equity Securities
11K characters. Original on sec.gov · Markdown
Item 5. Market for Registrant’s Common Equity, Related Stockholder Matters and Issuer Purchases of Equity Securities
Market Information
The shares of the Company’s common stock are traded on the New York Stock Exchange (“NYSE”) under the symbol ESS. ESS common stock has been traded on the NYSE since June 13, 1994. The high, low and closing price per share of common stock reported on the NYSE for the quarters indicated are as follows:
| Quarter Ended | High | Low | Close | |||||||||
| December 31, 2015 | $ | 244.71 | $ | 214.29 | $ | 239.41 | ||||||
| September 30, 2015 | $ | 232.20 | $ | 205.72 | $ | 223.42 | ||||||
| June 30, 2015 | $ | 231.90 | $ | 208.85 | $ | 212.50 | ||||||
| March 31, 2015 | $ | 243.17 | $ | 207.26 | $ | 229.90 | ||||||
| December 31, 2014 | $ | 214.43 | $ | 176.70 | $ | 206.60 | ||||||
| September 30, 2014 | $ | 196.08 | $ | 177.68 | $ | 178.75 | ||||||
| June 30, 2014 | $ | 185.99 | $ | 164.76 | $ | 184.91 | ||||||
| March 31, 2014 | $ | 173.01 | $ | 141.79 | $ | 170.05 |
The closing price of ESS stock as of February 22, 2016 was $209.53.
There is no established public trading market for Essex Portfolio, L.P.’s OP Units.
Holders
The approximate number of holders of record of the shares of ESS common stock was 1,395 as of February 22, 2016. This number does not include stockholders whose shares are held in investment accounts by other entities. ESS believes the actual number of stockholders is greater than the number of holders of record.
As of February 22, 2016, there were 172 holders of record of Essex Portfolio, L.P.’s OP Units, including ESS.
Return of Capital
Under provisions of the Internal Revenue Code of 1986, as amended, the portion of the cash dividend, if any, that exceeds earnings and profits is considered a return of capital. The return of capital is generated due to a variety of factors, including the deduction of non-cash expenses, primarily depreciation, in the determination of earnings and profits.
The status of the cash dividends distributed for the years ended December 31, 2015, 2014, and 2013 related to common stock, and Series G and H preferred stock for tax purposes are as follows:
| 2015 | 2014 | 2013 | |||||||
| Common Stock | |||||||||
| Ordinary income | 99.28 | % | 70.03 | % | 77.34 | % | |||
| Capital gain | 0.72 | % | 21.95 | % | 17.64 | % | |||
| Unrecaptured section 1250 capital gain | — | % | 8.02 | % | 5.02 | % | |||
| 100.00 | % | 100.00 | % | 100.00 | % | ||||
| 2015 | 2014 | 2013 | |||||||
| Series G, and H Preferred stock | |||||||||
| Ordinary income | 99.28 | % | 70.03 | % | 77.34 | % | |||
| Capital gains | 0.72 | % | 21.95 | % | 17.64 | % | |||
| Unrecaptured section 1250 capital gain | — | % | 8.02 | % | 5.02 | % | |||
| 100.00 | % | 100.00 | % | 100.00 | % |
Dividends and Distributions
Since ESS’s initial public offering on June 13, 1994, ESS and the Operating Partnership have paid regular quarterly dividends/distributions to its stockholders and unitholders. ESS paid the following dividends per share of common stock and the Operating Partnership paid the following distributions per limited partner OP unit:
| Year Ended | Annual Dividend/Distribution | Quarter Ended | 2015 | 2014 | 2013 | |||||||
| 1995 | $ | 1.69 | March 31, | $1.44 | $1.21 | $1.21 | ||||||
| 1996 | $ | 1.72 | June 30, | $1.44 | $1.30 | $1.21 | ||||||
| 1997 | $ | 1.77 | September 30, | $1.44 | $1.30 | $1.21 | ||||||
| 1998 | $ | 1.95 | December 31, | $1.44 | $1.30 | $1.21 | ||||||
| 1999 | $ | 2.15 | ||||||||||
| 2000 | $ | 2.38 | Annual Dividend/Distribution | $5.76 | $5.11 | $4.84 | ||||||
| 2001 | $ | 2.80 | ||||||||||
| 2002 | $ | 3.08 | ||||||||||
| 2003 | $ | 3.12 | ||||||||||
| 2004 | $ | 3.16 | ||||||||||
| 2005 | $ | 3.24 | ||||||||||
| 2006 | $ | 3.36 | ||||||||||
| 2007 | $ | 3.72 | ||||||||||
| 2008 | $ | 4.08 | ||||||||||
| 2009 | $ | 4.12 | ||||||||||
| 2010 | $ | 4.13 | ||||||||||
| 2011 | $ | 4.16 | ||||||||||
| 2012 | $ | 4.40 |
Future dividends/distributions by ESS and the Operating Partnership will be at the discretion of the Board of Directors of ESS and will depend on the actual cash flows from operations of the Company, its financial condition, capital requirements, the annual distribution requirements under the REIT provisions of the Internal Revenue Code, applicable legal restrictions and such other factors as the Board of Directors deem relevant. There are currently no contractual restrictions on ESS and the Operating Partnership present or future ability to pay dividends and distributions.
The Board of Directors has declared a dividend/distribution for the first quarter of 2016 of $1.60 per share. The dividend/distribution will be payable on April 15, 2016 to shareholders/unitholders of record as of March 31, 2016.
Dividend Reinvestment and Share Purchase Plan
ESS has adopted a dividend reinvestment and share purchase plan designed to provide holders of common stock with a convenient and economical means to reinvest all or a portion of their cash dividends in shares of common stock and to acquire additional shares of common stock through voluntary purchases. Computershare, LLC, which serves as ESS transfer agent, administers the dividend reinvestment and share purchase plan. For a copy of the plan, contact Computershare, LLC at (312) 360-5354.
Securities Authorized for Issuance under Equity Compensation Plans
See the Company’s disclosure in the 2016 Proxy Statement under the heading “Equity Compensation Plan Information”, which disclosure is incorporated herein by reference.
Issuance of Registered Equity Securities
During 2015, ESS sold 1,481,737 shares of common stock for proceeds of $332.3 million, net of commissions, at an average price of $226.46. Common stock sales were made pursuant to a registration statement and ESS used the net proceeds from the stock offerings to pay down debt, fund redevelopment and development pipelines, fund acquisitions, and for general corporate purposes. During the first quarter of 2016 through February 22, 2016, ESS has not issued any shares of common stock.
Issuer Purchases of Equity Securities
In December 2015, ESS Board of Directors authorized a stock repurchase plan to allow ESS to acquire shares in an aggregate of up to $250 million. The program supersedes the common stock repurchase plan that Essex announced on August 30, 2007. Under the previous stock repurchase plan, ESS repurchased and retired 816,659 shares totaling $66.6 million at an average stock price of $81.56 per share, including commissions.
Performance Graph
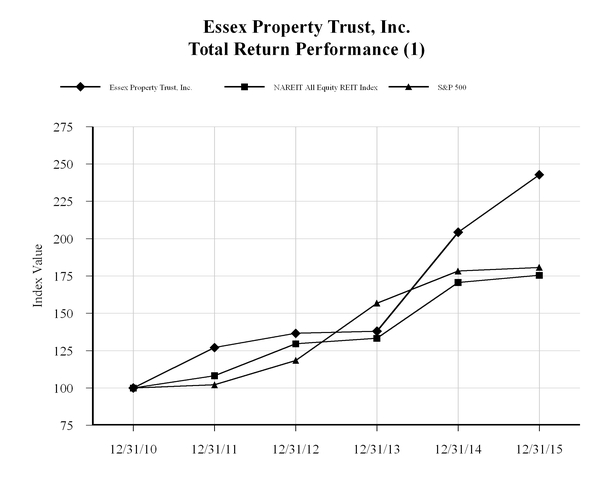
The line graph below compares the cumulative total stockholder return on ESS common stock for the last five years with the cumulative total return on the S&P 500 and the NAREIT All Equity REIT index over the same period. This comparison assumes that the value of the investment in the common stock and each index was $100 on December 31, 2010 and that all dividends were reinvested (1).
| Period Ending | ||||||||||||||||||
| Index | 12/31/2010 | 12/31/2011 | 12/31/2012 | 12/31/2013 | 12/31/2014 | 12/31/2015 | ||||||||||||
| Essex Property Trust, Inc. | 100.00 | 127.06 | 136.59 | 138.04 | 204.30 | 242.85 | ||||||||||||
| NAREIT All Equity REIT Index | 100.00 | 108.28 | 129.62 | 133.32 | 170.68 | 175.51 | ||||||||||||
| S&P 500 | 100.00 | 102.11 | 118.45 | 156.82 | 178.28 | 180.75 |
| (1) | Common stock performance data is provided by SNL Financial. |
The graph and other information furnished under the above caption “Performance Graph” in this Part II Item 5 of this Form 10-K shall not deemed to be “soliciting material” or to be “filed” with the SEC or subject to Regulation 14A or 14C, or to the liabilities of the Exchange Act, as amended.
Unregistered Sales of Equity Securities
During the years ended December 31, 2015 and 2014, the Operating Partnership issued partnership units in private placements in reliance on the exemption from registration provided by Section 4(2) of the Securities Act, in the amounts and for the consideration set forth below:
During the year ended December 31, 2015 and 2014, ESS issued an aggregate of 203,556 and 185,387 shares of its common stock upon the exercise of stock options, respectively. ESS contributed the proceeds from the option exercises of $26.5 million and $11.0 million to our Operating Partnership in exchange for an aggregate of 203,556 and 185,387 common OP Units, as required by the Operating Partnership’s partnership agreement, respectively.
During the year ended December 31, 2015 and 2014, ESS issued an aggregate of 22,939 and 126,931 shares of its common stock in connection with restricted stock awards for no cash consideration, respectively. For each share of common stock issued
by ESS in connection with such awards, our Operating Partnership issued common OP units to ESS as required by the partnership agreement, for an aggregate of 22,939 and 126,931 units during the year ended December 31, 2015 and 2014, respectively.
During the years ended December 31, 2015 and 2014, ESS issued and sold an aggregate of 1,481,737 and 2,964,315 shares of its common stock, respectively, pursuant to a registration statement and its equity distribution program. ESS contributed the net proceeds from these share issuances of $332.3 million and $534.0 million in exchange for an aggregate of 1,481,737 and 2,964,315 common OP Units, respectively, as required by the Operating Partnership's partnership agreement.
Previous: Item 4. Mine Safety Disclosures · Next: Item 6. Selected Financial Data