 filings.tools
Fastenal (FAST) 10-K risk factor changes: FY2015 vs FY2014
The 2015-12-31 10-K against the 2014-12-31 one, compared heading by heading and sentence by sentence. One of these filings carries no fiscal year tag, so its year is the calendar year of the period end.
Item 1A20 rewritten41 added16 removed139 unchanged
All filing items690 rewritten483 added385 removed1,240 unchanged
Summary
counted, not written
- Item 1A headings could not be compared: only 0 carried over between the two years, which usually means one filing was read wrongly, so none is reported as new or removed.
- Sentence by sentence, 483 added, 385 removed, 690 rewritten and 1,240 unchanged across 14 items that differ.
Sentences by item
21 items, with every count and a link to each item that changed
Underlined words on a shaded ground are new in FY2015; struck-through words were in FY2014. Sentences that are wholly new or wholly gone are labelled rather than marked.
Item 1A. RISK FACTORS
20 rewritten, 41 added, 16 removed, 139 unchanged
The [removed: material] [added: most significant] risks and uncertainties known to us which may cause the operating results to vary from anticipated results or which may negatively affect our operating results and profitability are as follows:
A downturn in either the national or local economy where our stores operate, or in the principal markets served by us, or changes in any of the other factors described above, could negatively impact sales at our [removed: stores] [added: stores, sales through our other selling channels,] and [removed: their] [added: the] level of [removed: profitability.][added: profitability of those stores and other selling channels.]
This risk was demonstrated during [removed: the last several] [added: recent] years.
A lag in these sectors, even as the general economy [removed: improves, could] [added: improved, has continued to] adversely impact our business.
If critical information systems fail or [added: these systems or related software or services] are otherwise unavailable, our ability to process orders, maintain proper levels of inventories, collect accounts receivable, pay expenses, and maintain the security of [removed: the] Company and customer data could be adversely affected.
While we have taken and continue to undertake significant steps to protect our customer and confidential information and the functioning of our computer systems and website, a compromise of our data security systems or those of businesses we interact [removed: with] [added: with,] could result in information related to our customers or business being obtained by unauthorized persons or other operational problems or interruptions.
[added: We] develop and update processes and maintain systems in an effort to try to prevent this from occurring, but the development and maintenance of these processes and systems [removed: is] [added: are] costly and [removed: requires] [added: require] ongoing monitoring and updating as technologies change and efforts to overcome security measures become more sophisticated.
If a compromise of our data security or [added: in the] function of our computer systems or website were to occur, it could have a material adverse effect on our operating results and financial [removed: condition and, possibly,] [added: condition,] subject us to additional legal, regulatory, and operating costs, and damage our reputation in the marketplace.
We may be unable to meet our goals regarding new store [removed: openings.][added: openings and other growth drivers of our business.]
We expect to open new stores at the rate of approximately [removed: 1%] [added: 2% to 3%] in [removed: 2015;] [added: 2016;] however, we cannot assure you that we can open stores at this [removed: rate,] [added: rate] and [removed: failure] [added: we may continue] to [removed: do so could negatively impact our long-term growth.][added: close or consolidate stores as the need arises.]
The latter was evidenced in [added: 2015 and] 2014, when the improvement in our operating and administrative expenses as a percentage of net sales was not sufficient to counterbalance the decrease in our gross profit margin, due in part to our push to add more personnel and labor hours in our stores [added: (2015] and [added: 2014) and] more district and regional leaders to better serve our [removed: stores,] [added: stores (2014),] and in part to rising miscellaneous expenses.
We can experience downward pressure on sales prices as a result of deflation, pressure from customers to [added: reduce costs, or increased competition, as was the case in 2009 and the latter half of 2013.]
While increases in the cost of fuel or raw materials could be damaging to us, decreases in those costs, particularly if severe, could also adversely impact us by creating deflation in selling prices, which could cause our gross profit margin to deteriorate, or by negatively impacting customers in certain [removed: industries (such as oil exploration, production, and refinement companies),] [added: industries,] which could cause our sales to those customers to decline.
Our ability to successfully attract and retain qualified personnel to staff our stores could impact labor costs, sales at existing stores, and the rate of new store [removed: openings.][added: openings, and our ability to transition and retain key senior management may impact our business and financial results.]
An inability to recruit and retain a sufficient number of qualified individuals in the future may also delay the planned openings of new [removed: stores.][added: stores and planned expansion of our other selling channels.]
Any such delays, material increases in employee turnover [removed: rates at existing stores,] [added: rates,] or increases in labor costs, could have a material adverse effect on our business, financial condition, or operating results.
Fluctuations in the relative strength of foreign economies and their related currencies could impact our ability to [added: procure products overseas at competitive prices and our foreign sales.]
Our suppliers could discontinue selling products manufactured in foreign countries at any time for reasons that may or may not be in our control or our suppliers' control, including foreign government [removed: regulations, domestic government regulations, political unrest, war, disruption or delays in shipments, changes in local economic conditions, or trade issues.]
During [removed: the last several] [added: recent] years there has been significant fiscal uncertainty in the country, the resolution of which has been impeded by political gridlock.
Furthermore, as our industrial [removed: and construction] customers face increased foreign competition, and potentially lose business to foreign competitors or shift their operations overseas in an effort to reduce expenses, we may face increased difficulty in growing and maintaining our market share.
Company Risks
In addition, certain software used by us is licensed from, and certain services related to our information systems are provided by, third parties who could choose to discontinue their relationship with us.
In recent years we have devoted increased resources to other growth drivers, including our industrial vending and Onsite businesses, and our
national accounts team.
We have targeted the signing of 200 additional Onsite locations in 2016.
While we believe this is achievable with some additional focus from our district managers and our national accounts team, this goal is aggressive and we cannot assure you that we can achieve it.
Similarly, while we have taken steps to build momentum in our industrial vending business, we cannot assure you that those steps will lead to additional growth in that business.
Failure to achieve any of our goals regarding new store openings, our industrial vending and Onsite businesses, or national accounts signings, could negatively impact our long-term sales growth.
During 2015, our gross profit continued to be impacted by changes in customer and product mix, the latter of which was amplified by a reduction in our customers' discretionary spending in the fourth quarter.
Our success also depends on the efforts and abilities of certain key senior management and we have had some transition in our executive officers over the last couple of years.
Difficulties in smoothly implementing that transition or the loss of the services of one or more of such key personnel could have a material adverse effect on our business, financial condition, or operating results.
Our competitive advantage in our industrial vending business could be eliminated and the loss of key suppliers of equipment and services for that business could be disruptive.
In addition, we currently rely on a limited number of suppliers for the vending machines used in, and certain software and services needed to operate, our industrial vending business.
While these machines, software, and services can be obtained from other sources, loss of our current suppliers could be disruptive.
We may not be successful in integrating acquisitions and achieving intended benefits and synergies.
We have completed several acquisitions of businesses, including, in 2015, our acquisition of certain assets of Fasteners, Inc., a regional industrial construction supply distributor with store locations in the states of Washington, Idaho, Oregon, and Montana.
We expect to continue to pursue strategic acquisitions that we believe will either expand or complement our business in new or existing markets or further enhance the value and offerings we are able to provide to our existing or future potential customers.
Acquisitions involve numerous risks and challenges, including, among others, a risk of potential loss of key employees of an acquired business, and inability to achieve identified operating and financial synergies anticipated to result from an acquisition, diversion of our capital and our management's attention from other business issues, and risks related to the integration of the acquired business including unanticipated changes in our business, our industry, or general economic conditions that affect the assumptions underlying the acquisition.
Any one or more of these factors could cause us to not realize the benefits anticipated to result from the acquisitions.
Industry and General Economic Risks
In a more recent example, 2015 saw a collapse in the price of oil.
When oil companies make less money, they also spend less money.
This cut-back had a ripple effect throughout not just the oil and gas industry, but also businesses catering to that industry, and resulted in a slowdown of our business with customers in those markets.
This was evidenced in 2015, when our operating results were negatively impacted by a slow down in our business with customers associated with oil exploration, production, and refinement.
regulations, domestic government regulations, political unrest, war, disruption or delays in shipments, changes in local economic conditions, or trade issues.
Tight credit markets could impact our ability to obtain financing on reasonable terms or increase the cost of existing or future financing.
As of December 31, 2015, we had loans outstanding under our revolving credit facility of $350,000.
Loans under the credit facility bear interest at a floating rate based on LIBOR.
During periods of volatility and disruption in the U.S. credit markets, financing may become more costly and more difficult to obtain.
Although the credit market turmoil of several years ago did not have a significant adverse impact on our liquidity or borrowing costs given that we had not entered into our current credit facility or started borrowing material amounts until after that time, the availability of funds tightened and credit spreads on corporate debt increased.
If credit market volatility were to return, then obtaining additional or replacement financing could be more difficult and the cost of doing so could be higher than under our current facility.
In addition, due to the floating interest rate provided for under our current credit facility, the cost of servicing loans under that facility could increase.
Tight credit conditions could limit our ability to finance stock purchases, dividends, capital expenditures, and other liquidity needs on terms acceptable to us.
For more information relating to borrowing and interest rates, see the following sections below: Liquidity and Capital Resources under the heading 'Item 7.
Management's Discussion and Analysis of Financial Condition and Results of Operations', 'Item 7A.
Quantitative and Qualitative Disclosures about Market Risk', and Note 9 of the Notes to Consolidated Financial Statements.
Investment Risk
We cannot provide any guaranty of future dividend payments or that we will continue to purchase shares of our common stock pursuant to our stock purchase program.
Although our board of directors has historically authorized the payment of quarterly cash dividends on our common stock and indicated an intention to do so in the future, there are no assurances that we will continue to pay dividends in the future or continue to increase dividends at historic rates.
In addition, although our board of directors has authorized share purchase programs and we have purchased shares in 2016, 2015, and in prior years through these programs, we may discontinue doing so at any time.
We
We opened stores at the rate of approximately 1%, 2%, and 3% in 2014, 2013, and 2012, respectively.
reduce costs, or increased competition, as was the case in 2009 and the latter half of 2013.
Opening stores in new markets presents increased risks that may prevent us from being profitable in these new locations.
We intend to open stores in new markets pursuant to our growth strategy.
New stores do not typically achieve operating results comparable to our existing stores until after several years of operation, and stores in new markets face additional challenges to achieving profitability.
A new store generates its sales from direct sales calls, a slow process involving repeated contacts.
In new markets, we have less familiarity with local customer preferences and customers in these markets are less familiar with our name and capabilities.
In addition, entry into new markets may bring us into competition with new, unfamiliar competitors.
We cannot assure success in operating our stores on a profitable basis in new markets.
New store openings may negatively impact our operating results.
While new stores build the infrastructure for future growth, the first year sales in new stores are low, and the added expenses relating to payroll, occupancy, and transportation costs can impact our ability to leverage earnings.
It has been our experience that new stores take at least ten to twelve months to achieve profitability.
We cannot assure you that we will be successful in operating our new stores on a profitable basis.
procure products overseas at competitive prices and our foreign sales.
Our FAST Solutions® (industrial vending) business is relatively new, and our competitive advantage could be eliminated.
An excerpt. Shown here: all 20 rewritten, 40 of 41 added and all 16 removed. The counts are complete. For every sentence, read Item 1A. RISK FACTORS in the FY2015 filing and the FY2014 filing.
Item 7. MANAGEMENT’S DISCUSSION AND ANALYSIS OF FINANCIAL CONDITION AND RESULTS OF OPERATIONS
202 rewritten, 223 added, 201 removed, 305 unchanged
We distribute these supplies through a network of approximately [removed: 2,700] [added: 2,600] company owned stores.
The manufacturing market includes both original equipment manufacturers (OEM) and [removed: maintenance] [added: maintenance, repair,] and [removed: repair] operations (MRO).
The non-residential construction market includes general, electrical, plumbing, [added: sheet metal, and road contractors.]
Other users of our product include farmers, truckers, railroads, oil exploration, [removed: production,] [added: production] and refinement companies, mining companies, federal, state, and local governmental entities, schools, and certain retail trades.
| 1. | [removed: Monthly sales changes, sequential trends,] [added: Sales] and [removed: end market performance] [added: sales trends] – a recap of our recent sales trends and some insight into the activities with different end markets. |
| 5. | [removed: Operational working capital, balance sheet, and cash] [added: Cash] flow [added: impact items] – a recap of the operational working capital utilized in our business, and the related cash flow. |
While reading these items, it is helpful to appreciate several aspects of our marketplace: (1) it's big, the North American marketplace for industrial supplies is estimated to be in excess of $160 billion per year (and we have expanded beyond North America), (2) no company has a significant portion of this market, (3) many of the products we sell are individually inexpensive, (4) when our customer needs something quickly or unexpectedly our local store is a quick source, (5) the cost and time to manage and procure [removed: the] [added: these] products [removed: we sell] is meaningful, (6) the cost to move these products, many of which are bulky, can be significant, (7) many customers would prefer to reduce their number of suppliers to simplify their business, and (8) many customers would prefer to utilize various technologies to improve availability and reduce waste.
The concept of growth is simple, find more customers every day and increase [removed: your] [added: our] activity with them.
First, we recruit [removed: service minded] [added: service-minded] individuals to support our customers and their business.
Third, we [removed: build] [added: have] a great [removed: machine] [added: team] behind the store to operate efficiently and to help identify new business solutions.
Net sales and [removed: growth rates in net] [added: daily] sales were as follows:
| | [removed: 2014] [added: 2015] | | | | [removed: 2013] [added: 2014] | | | [removed: 2012] [added: 2013] | |
| Net sales | $ | [removed: 3,733,507] [added: 3,869,187] | | | [removed: 3,326,106] [added: 3,733,507] | | | [removed: 3,133,577] [added: 3,326,106] | |
| Percentage change | [removed: 12.2] [added: 3.6] | | % | | [removed: 6.1] [added: 12.2] | % | | [removed: 13.3] [added: 6.1] | % |
The increase in net sales in [removed: both 2014] [added: 2015, 2014,] and 2013 came primarily from higher unit sales.
Over the last several years, our [removed: FAST Solutions® (industrial vending)] [added: industrial vending] initiative has stimulated faster growth with a subset of our customers (discussed later in this document).
The change in currencies in foreign countries (primarily Canada) relative to the United States dollar [removed: lowered] [added: impacted] our [removed: daily] [added: net] sales growth [removed: rate by 0.5% and 0.2% in 2014 and 2013, respectively.][added: over the last several years.]
The added growth in 2014 was largely related to two things – the expansion, which began in the latter half of 2013, in the number of our store employees and the number of district and regional leaders supporting our stores, all in [removed: an] effort to generate more selling energy within our stores, and a stabilization in our OEM fastener business.
The [added: rate of] growth in net sales [removed: at the older store locations] [added: in 2015] was hindered by weakness in the industrial production and non-residential construction industries served by [removed: our Company.][added: us.]
The impact of the economy is best reflected in the growth performance of our stores opened greater than ten years ago (store sites opened as follows: [removed: 2014] [added: 2015] group – opened [removed: 2004] [added: 2005] and earlier, [removed: 2013] [added: 2014] group – opened [removed: 2003] [added: 2004] and earlier, and [removed: 2012] [added: 2013] group – opened [removed: 2002] [added: 2003] and earlier) and opened greater than five years ago (store sites opened as follows: [removed: 2014] [added: 2015] group – opened [removed: 2009] [added: 2010] and earlier, [removed: 2013] [added: 2014] group – opened [removed: 2008] [added: 2009] and earlier, and [removed: 2012] [added: 2013] group – opened [removed: 2007] [added: 2008] and earlier).
The stores opened greater than two years ago represent a consistent ‘same store’ view of our business (store sites opened as follows: [removed: 2014] [added: 2015] group – opened [removed: 2012] [added: 2013] and earlier, [removed: 2013] [added: 2014] group – opened [removed: 2011] [added: 2012] and earlier, and [removed: 2012] [added: 2013] group – opened [removed: 2010] [added: 2011] and earlier).
| Store Age | [removed: 2014] [added: 2015] | | [removed: 2013] [added: 2014] | | [removed: 2012] [added: 2013] |
| Opened greater than 10 years | [removed: 10.5%] [added: 2.7%] | | [removed: 2.1%] [added: 10.5%] | | [removed: 8.1%] [added: 2.1%] |
| Opened greater than 5 years | [removed: 10.9%] [added: 2.5%] | | [removed: 3.6%] [added: 10.9%] | | [removed: 9.8%] [added: 3.6%] |
| Opened greater than 2 years | [removed: 11.5%] [added: 2.5%] | | [removed: 4.4%] [added: 11.5%] | | [removed: 10.8%] [added: 4.4%] |
Stores opened in 2014 contributed approximately [added: $28,028 (or 0.7%) to 2015 net sales and approximately] $9,762 (or 0.3%) to 2014 net sales.
| | [removed: 2014] [added: 2015] | | [removed: 2013] [added: 2014] | | [removed: 2012] [added: 2013] |
| Fastener product line | [removed: 40%] [added: 38%] | | [removed: 42%] [added: 40%] | | [removed: 44%] [added: 42%] |
| Other product lines | [removed: 60%] [added: 62%] | | [removed: 58%] [added: 60%] | | [removed: 56%] [added: 58%] |
The decrease in our fastener sales as a percentage of total sales has been driven by the continued success of our non-fastener product lines, which we began to add in the [removed: 1990s,] [added: 1990's,] and by the growth of our [removed: FAST Solutions® (industrial vending)] [added: industrial vending] program.
Stores opened greater than two years – Our stores opened greater than two years (store sites opened as follows: [removed: 2014] [added: 2015] group – opened [removed: 2012] [added: 2013] and earlier, [removed: 2013] [added: 2014] group – opened [removed: 2011] [added: 2012] and earlier, and [removed: 2012] [added: 2013] group – opened [removed: 2010] [added: 2011] and earlier) represent a consistent 'same-store' view of our business.
Stores opened greater than five years – The impact of the economy, over time, is best reflected in the growth performance of our stores opened greater than five years (store sites opened as follows: [removed: 2014] [added: 2015] group – opened [removed: 2009] [added: 2010] and earlier, [removed: 2013] [added: 2014] group – opened [removed: 2008] [added: 2009] and earlier, and [removed: 2012] [added: 2013] group – opened [removed: 2007] [added: 2008] and earlier).
This group, which represented about 90% of our total sales in [removed: 2014,] [added: 2015,] is more cyclical due to the increased market share they enjoy in their local markets.
During the years [removed: 2014,] 2013, [added: 2014,] and [removed: 2012,] [added: 2015,] it lowered our [added: net sales] growth by [removed: 0.5%,] 0.2%, [added: 0.5%,] and [removed: 0.1%,] [added: 1.2%,] respectively.
[removed: The] [added: During the first half of 2013, the] fastener [removed: piece] [added: product line] was heavily impacted by our industrial production business.
The daily sales growth in July 2013 and December 2013 were negatively impacted by the timing of the July 4th holiday (Thursday in [removed: 2013,] [added: 2013 versus] Wednesday in [removed: 2012, Monday in 2011)] [added: 2012)] and the Christmas/New Year holiday (Wednesday in [removed: 2013,] [added: 2013 versus] Tuesday in [removed: 2012, and Sunday in 2011).][added: 2012).]
Our sales to customers engaged in light and medium duty manufacturing (largely related to consumer products) [removed: have improved since] [added: began to improve] late [removed: 2013; this makes sense given the trends] in [removed: the PMI Index since that time.][added: 2013 and into 2014.]
This double digit growth in March was helped by the Easter timing (April in [removed: 2014), but the real story is good people, good execution, and minimal negative weather impacts.][added: 2014).]
Our sales to customers engaged in heavy machinery manufacturing (primarily serving the mining, military, agricultural, and [added: construction end markets), which represents approximately one fifth of our business, had a very weak 2013, but stabilized late in 2013 and improved in 2014.]
The first landing centers on Easter, which alternates between March and April (Easter occurred in April [added: 2015, in April] 2014, [removed: March 2013,] and [removed: April 2012 –] in [removed: 2015, Easter will occur in April),] [added: March 2013),] the second landing centers on July 4th, and the third landing centers on the approach of winter with its seasonal impact on primarily our construction business and with the Christmas/New Year holidays.
We are a growth focused organization and we constantly strive to make investments into the growth drivers of our business.
These investments typically center on people.
By adding more people we add to our ability to interact with and to serve our customers from our local store and to back them up in some type of support role.
In recent years this investment has also centered on more industrial vending devices to serve our customers’ needs on a 24 hours a day, 7 days a week basis.
The table below summarizes our store employee count and our total employee count at the end of the periods presented.
This is intended to demonstrate the energy (or capacity) added.
Later in this document we discuss the average full-time equivalent employee count to help explain the expense trends in more detail.
The final two items below summarize our investments in industrial vending devices and in store locations.
| | Q4 2014 | | | Q4 2015 | | | Twelve-month % Change | |
| End of period total store employee count | 12,293 | | | 13,961 | | | 13.6 | % |
| Change in total store employee count | | | | 1,668 | | | | |
| End of period total employee count | 18,417 | | | 20,746 | | | 12.6 | % |
| Change in total employee count | | | | 2,329 | | | | |
| Industrial vending machines (installed device count) | 46,855 | | | 55,510 | | | 18.5 | % |
| Number of store locations | 2,637 | | | 2,622 | | | \-0.6 | % |
For a quick recap of some positive and negative aspects of our business, we would note the following:
Positive –
| (1) | During 2015, we added 1,668 people into our stores. We stated in January 2015 we would add people in an aggressive fashion during 2015. This is the result. |
| (2) | After several years of holding back on store openings and even contracting our total store base, we plan to expand our pace of store openings in 2016 with a goal of opening 60 to 75 new stores (an increase of approximately 2% to 3% over our number of stores as of December 31, 2015). We opened 41 and 24 stores in 2015 and 2014, respectively, and we closed or consolidated 50 and 73 stores in 2015 and 2014, respectively. |
| (3) | We are seeing a very strong pace of national account signings. During 2015, we signed more new contracts (defined as new customer accounts with a multi-site contract) with national account customers than in 2014. This increase reversed the declining trend in the previous year. Similar to the third quarter of 2015, the business with our top 100 national account customers (representing approximately 25% of sales) experienced poor sales results in the fourth quarter of 2015, with net sales contraction of approximately 4.3%, while sales to our remaining national account customers (representing approximately 22% of sales) grew approximately 8.1%. |
| (4) | We have also seen an expansion of our Onsite business (defined as dedicated sales and service provided from within the customer's facility) during 2015. During the year we signed 82 new Onsite customer locations. |
| (5) | We converted approximately 800 stores to the CSP 16 (Customer Service Project 2016) format in the fourth quarter of 2015. This merchandising footprint, disclosed at our November 2015 Investor Day, involves expanded inventory placement at our store locations to enhance same-day capabilities. |
Negative –
| (1) | 2015 was hit hard by a slowdown in our business with customers connected to the oil and gas industry. Those customers include direct industry participants as well as other customers serving those participants. |
| (2) | 2015 was negatively affected by a strong U.S. dollar, relative to other currencies, which hurts our U.S. customer base (which accounts for approximately 89% of sales). |
| | |
| --- | --- |
| (3) | The net sales of our Canadian business, which grew about 4% in 'local currency' during the fourth quarter of 2015, slowed from 6% growth in the third quarter of 2015. |
| | |
| --- | --- |
| (4) | During the fourth quarter of 2015 we decided to terminate our manufacturing joint venture in Brazil and settled several unrelated disputes. These items resulted in approximately $4 million of additional expense in the quarter. We listed these as negative due to the immediate financial impact, but consider these to be positive developments allowing us to focus on growth. |
| | |
| --- | --- |
| (5) | In late November 2015, and even more so in late December 2015, we experienced a greater number and longer duration of customer plant shutdowns related to the holiday season. |
The following sections contain an overview of the following:
| | |
| --- | --- |
| | |
| --- | --- |
| | |
sheet metal, and road contractors.
The following pages contain a marketplace overview, and a general sales growth and product line mix discussion, for each of the last three years.
This is followed by a more in depth discussion of the following:
The higher unit sales resulted primarily from increases in sales at older store locations (discussed below and again later in this document) and to a lesser degree the opening of new store locations in the last several years.
The increase in net sales in 2012 came primarily from higher unit sales.
Our growth in net sales was impacted by price changes in our products, but the impact was limited.
Our growth in net sales was not meaningfully impacted by the introduction of new
products or services, but was helped by initiatives such as FAST Solutions® (industrial vending).
The change in currencies in foreign countries (primarily Canada) relative to the United States dollar lowered our daily sales growth rate by 0.1% in 2012.
Stores opened in 2013 contributed approximately $52,033 (or 1.4%) to 2014 net sales and approximately $18,620 (or 0.6%) to 2013 net sales.
| 2012 | 21.3 | % | | 20.0 | % | | 19.3 | % | | 17.3 | % | | 13.1 | % | | 14.0 | % | | 12.1 | % | | 12.0 | % | | 12.9 | % | | 6.8 | % | | 8.2 | % | | 9.7 | % |
| 2012 | 18.8 | % | | 17.1 | % | | 16.8 | % | | 14.5 | % | | 10.1 | % | | 11.1 | % | | 9.1 | % | | 8.6 | % | | 9.8 | % | | 3.8 | % | | 5.1 | % | | 6.6 | % |
| 2012 | 17.4 | % | | 15.8 | % | | 15.7 | % | | 13.7 | % | | 9.0 | % | | 10.2 | % | | 8.3 | % | | 7.9 | % | | 8.5 | % | | 2.6 | % | | 4.6 | % | | 5.6 | % |
The change in currencies in foreign countries (primarily Canada) relative to the United States dollar impacted our growth over the last several years.
During 2012, the growth in the first three and a half months generally continued the relative strength we saw in 2011.
Then we began to experience several distinct economic slowdowns.
The first occurred in the late April/May time frame, and then moderated until September 2012.
The second occurred in the October/November time frame.
This was exaggerated by the impact of Hurricane Sandy and an unusual business day comparison in October (23 days in 2012 versus 21 days in 2011 - the maintenance portion of our business is often linked to monthly spend patterns of our customers, which are not as business day dependent, this can dilute the daily growth picture given the change in business day divisor).
The third occurred in the spring of 2013.
This involved our fastener product line and our construction business (primarily non-residential construction).
This third slowdown, similar to the first two listed, mirrored or slightly led some softening in the PMI Index.
The PMI Index is a composite index of economic activity in the United States manufacturing sector.
It is published by the Institute for Supply Management and is available at http://www.ism.ws/.
The fourth and fifth occurred in July 2013 and December 2013.
Our daily sales growth trends have generally improved since September 2013.
This was largely related to changing comparisons to the prior year and to the improving sequential patterns noted in the next discussion.
Since March 2014, our double digit growth has continued.
construction end markets), which represents approximately one fifth of our business, had a very weak 2013, but stabilized late in 2013 and has improved in 2014.
Since May 2014, our stores opened greater than five years have enjoyed double digit growth in every month.
This is a strong indicator of the strength of the marketplace.
| 2012 | \-0.3 | % | | 0.5 | % | | 6.4 | % | | \-0.8 | % | | 0.5 | % | | 2.5 | % | | \-2.7 | % | | 1.3 | % | | 4.3 | % | | \-4.8 | % | | 7.1% |
| 12Delta | \-1.1 | % | | \-1.7 | % | | 2.6 | % | | \-1.2 | % | | \-2.6 | % | | \-0.2 | % | | \-0.6 | % | | \-1.2 | % | | 0.6 | % | | \-3.6 | % | | \-8.8% |
| 2012 | 20.3 | % | | 15.8 | % | | 14.0 | % | | 9.7 | % | | 14.9 | % |
| 2012 | 15.4 | % | | 8.0 | % | | 6.0 | % | | 2.6 | % | | 7.8 | % |
| 2012 | 25.1 | % | | 21.1 | % | | 18.0 | % | | 13.6 | % | | 19.2 | % |
| 2012 | 17.1 | % | | 12.7 | % | | 8.2 | % | | 4.2 | % | | 10.3 | % |
We believe the weakness in the economy in the fourth quarter of 2012, throughout 2013, and during early 2014, particularly in the non-residential construction market, was amplified by global economic uncertainty combined with economic policy uncertainty in the United States.
This weakness was amplified by severe winter weather conditions in January and February 2014.
$20 million.
An excerpt. Shown here: 40 of 202 rewritten, 40 of 223 added and 40 of 201 removed. The counts are complete. For every sentence, read Item 7. MANAGEMENT’S DISCUSSION AND ANALYSIS OF FINANCIAL CONDITION AND RESULTS OF OPERATIONS in the FY2015 filing and the FY2014 filing.
Item 7A. QUANTITATIVE AND QUALITATIVE DISCLOSURES ABOUT MARKET RISKS
4 rewritten, 9 added, 3 removed, 4 unchanged
We are exposed to certain market risks from changes in foreign currency exchange rates, commodity steel pricing, [removed: and] commodity energy [removed: prices.][added: prices, and interest rates.]
[removed: | (1) | Foreign currency exchange rates – Foreign currency fluctuations can affect our net investments and earnings denominated in foreign currencies.] Our [removed: primary exchange rate exposure is with the Canadian dollar against the United States dollar. Our] estimated net earnings exposure for foreign currency exchange rates was not material at year end. [removed: |]
[removed: | (3) |] Commodity energy prices – We have market risk for changes in prices of gasoline, diesel fuel, natural gas, and electricity; however, this risk is mitigated in part by our ability to pass freight costs to our customers, the efficiency of our trucking distribution network, and the ability, over time, to manage our occupancy costs related to the heating and cooling of our facilities through better efficiency. [removed: |]
[removed: | (4) | Interest rates - A description] [added: However, due to the relatively small size] of our [removed: unsecured revolving credit facility is contained in Note 10 of the ‘Notes to Consolidated Financial Statements’ and is incorporated herein by reference. We] [added: debt, we] do not believe our operations are currently subject to significant market risk for interest rate exposure under the credit facility. [removed: |]
Foreign currency exchange rates – Foreign currency fluctuations can affect our net investments and earnings denominated in foreign currencies.
Our primary exchange rate exposure is with the Canadian dollar against the United States dollar.
Commodity steel pricing – We buy and sell various types of steel products; these products consist primarily of different types of threaded fasteners.
In 2013, 2014, and 2015, we noted some deflation in overall steel pricing.
We are exposed to the impacts of commodity steel pricing and our related ability to pass through the impacts to our end customers.
Interest rates - Loans under our credit facility bear interest at floating rates tied to LIBOR.
As a result, changes in LIBOR can affect our operating results and liquidity to the extent we do not have effective interest rate swap arrangements in place.
We have not historically used interest rate swap arrangements to hedge the variable interest rates under our credit facility.
A description of our credit facility is contained in Note 9 of the Notes to Consolidated Financial Statements.
| | |
| --- | --- |
| (2) | Commodity steel pricing – We buy and sell various types of steel products; these products consist primarily of different types of threaded fasteners. In 2012, we noted nominal price increases in steel products. In 2013 and 2014, we noted some deflation in overall steel pricing. We are exposed to the impacts of commodity steel pricing and our related ability to pass through the impacts to our end customers. |
Item 1. BUSINESS
87 rewritten, 27 added, 33 removed, 122 unchanged
The year end is typically December 31, [removed: 2014] [added: 2015] unless additional years are included or noted.
We have [removed: 2,637] [added: 2,622] store locations.
We employ [removed: 18,417] [added: 20,746] people.
| | [added: | 2015 | | |] 2014 | | [added: |] 2013 | | [added: | 2012 | | | 2011 | |]
| Store and [removed: in-plant] [added: Onsite] | [removed: 12,293] [added: 13,961] | | [removed: 11,550] [added: 12,293] | |
| Non-store selling | [removed: 1,349] [added: 1,566] | | [removed: 1,242] [added: 1,349] | |
| Selling subtotal | [removed: 13,642] [added: 15,527] | | [removed: 12,792] [added: 13,642] | |
| Distribution | [removed: 3,120] [added: 3,459] | | [removed: 2,931] [added: 3,120] | |
| Manufacturing | [removed: 630] [added: 662] | | [removed: 603] [added: 630] | |
| Administrative | [removed: 1,025] [added: 1,098] | | [removed: 951] [added: 1,025] | |
| Non-selling subtotal | [removed: 4,775] [added: 5,219] | | [removed: 4,485] [added: 4,775] | |
| Total | [removed: 18,417] [added: 20,746] | | [removed: 17,277] [added: 18,417] | |
We operate 14 distribution centers in North America from which we distribute products to our store and [removed: in-plant] [added: Onsite] locations.
We opened our first store in Winona, Minnesota, a city with a population [added: today] of approximately 27,000.
| | [added: 2015 | |] 2014 | | 2013 | | 2012 | | 2011 | | 2010 | | 2009 | | 2008 | | 2007 | | 2006 | [removed: | 2005 |]
| Net sales (in millions) | [removed: $3,733.5] [added: $3,869.2] | | [added: 3,733.5 | |] 3,326.1 | | 3,133.6 | | 2,766.9 | | 2,269.5 | | 1,930.3 | | 2,340.4 | | 2,061.8 | | 1,809.3 | [removed: | 1,523.3 |]
| Number of stores | [added: 2,622 | |] 2,637 | | 2,687 | | 2,652 | | 2,585 | | 2,490 | | 2,369 | | 2,311 | | 2,160 | | 2,000 | [removed: | 1,755 |]
| North America | United States | | [removed: 2,336] [added: 2,320] | | | [removed: 2,394] [added: 2,336] | |
| | Canada | | [removed: 202] [added: 200] | | | [removed: 204] [added: 202] | |
| | Mexico | | [removed: 44] [added: 47] | | | [removed: 41] [added: 44] | |
| | Subtotal | | [removed: 2,590] [added: 2,575] | | | [removed: 2,647] [added: 2,590] | |
| Central & South America | Panama, Brazil, Colombia, and Chile | | 9 | | | [removed: 8] [added: 9] | |
| Asia | China and India | | 10 | | | [removed: 8] [added: 10] | |
| Europe | The Netherlands, Hungary, United Kingdom, Germany, Czech Republic, Italy, Romania, Poland, and Sweden | | 20 | | | [removed: 17] [added: 20] | |
| Africa | South Africa | | 1 | | | [removed: —] [added: 1] | |
| Total | | | [removed: 2,637] [added: 2,622] | | | [removed: 2,687] [added: 2,637] | |
In [added: 2015,] 2014, [removed: 2013,] and [removed: 2012,] [added: 2013,] we opened new stores at a rate of approximately [removed: 1%,] 2%, [added: 1%,] and [removed: 3%,] [added: 2%,] respectively.
In addition to the Fastenal store type discussed above, we also operate strategic account stores, strategic account sites, and [removed: ‘in-plant’ sites.][added: Onsite locations.]
An [removed: ‘in-plant’ site] [added: Onsite location] is a selling unit located in or near a customer’s facility that sells product solely to that customer.
[removed: ‘In-plant’ sites] [added: Onsite locations] are not included in our store count numbers as they represent a customer subset of an existing store.
While we believe there is sufficient potential in North America for 3,500 total stores, or approximately 900 more than today, we have slowed our store openings in recent years and instead have increased our investments in other growth drivers such as people (both inside and outside our stores), [removed: FAST Solutions® (industrial vending),] [added: industrial vending,] and end-market growth investments.
| North America | United States | [added: 32 | | |] 10 | | | 30 | | | 58 | | | 101 | | [removed: | 111 | |]
| | Canada | 4 | | | [removed: 10] [added: 4] | | | [removed: 13] [added: 10] | | | [removed: 11] [added: 13] | | | [removed: 7] [added: 11] | |
| | Mexico | 3 | | | [removed: 5] [added: 3] | | | [removed: 2] [added: 5] | | | [removed: 1] [added: 2] | | | 1 | |
| | Subtotal | [added: 39 | | |] 17 | | | 45 | | | 73 | | | 113 | | [removed: | 119 | |]
| Central & South America | Panama, Brazil, Colombia, and Chile | 1 | | | [removed: 4] [added: 1] | | | [removed: 1] [added: 4] | | | 1 | | | [removed: 2] [added: 1] | |
| Asia | China and India | [removed: 2] [added: 1] | | | [removed: —] [added: 2] | | | — | | | [removed: 3] [added: —] | | | 3 | |
| Southeast Asia | Singapore, Malaysia, and Thailand | — | | | — | | | [removed: 2] [added: —] | | | [removed: —] [added: 2] | | | [removed: 2] [added: —] | |
| Europe | The Netherlands, Hungary, United Kingdom, Germany, Czech Republic, Italy, Romania, Poland, and Sweden | [removed: 3] [added: —] | | | [removed: 4] [added: 3] | | | 4 | | | [removed: 5] [added: 4] | | | [removed: 1] [added: 5] | |
| Africa | South Africa | [removed: 1] [added: —] | | | [removed: —] [added: 1] | | | — | | | — | | | — | |
| | 2015 | | 2014 | |
| | | | 2015 | | | 2014 | |
We also closed or consolidated certain stores in 2015, 2014, and 2013, which resulted in a net decrease in store locations in the last two years.
We expect to open 60 to 75 stores in 2016, which is an annual rate of 2% to 3%, and to continue to close or consolidate stores as the need arises.
| | | | | | | | | | | | | | | | | | | | |
| --- | --- | --- | --- | --- | --- | --- | --- | --- | --- | --- | --- | --- | --- | --- | --- | --- | --- | --- | --- |
| | | | | | | | | | | | | | | | | | | | |
| 1-2 years old | 2014 | | 22 | | 2/0 | | 0/0 | | 106 | | | | | 37 | | (4) | | 186.5 | % |
| 5-6 years old | 2010 | | 108 | | 7/7 | | \-1/0 | | 104 | | | | | 96 | | | | 8.3 | % |
| 6-7 years old | 2009 | | 57 | | 4/4 | | \-1/0 | | 149 | | | | | 146 | | | | 2.1 | % |
| 8-9 years old | 2007 | | 141 | | 3/8 | | 0/0 | | 104 | | | | | 104 | | | | 0.0 | % |
| 11-12 years old | 2004 | | 205 | | 3/4 | | 0/0 | | 110 | | | | | 109 | | | | 0.9 | % |
| 12-16 years old | 2000-2003 | | 483 | | 2/6 | | 0/-1 | | 119 | | | | | 115 | | | | 3.5 | % |
| 16+ years old | 1967-1999 | | 787 | | 6/6 | | 0/1 | | 163 | | | | | 158 | | | | 3.2 | % |
(1) We closed 50 stores and 73 stores in 2015 and 2014, respectively.
(2) We converted six store locations to non-store selling locations in 2015.
We converted two store locations to non-store selling locations, and one non-store selling location to a store in 2014.
Detailed information about our sales by product line is provided later in this document in Note 10 of the Notes to Consolidated Financial Statements included later in this Form 10-K.
Beyond inventory, we have some concentration of purchasing activity.
For example, we utilize a limited number of suppliers for distribution equipment, two main suppliers for our vehicle fleet, and primarily one supplier for our industrial vending equipment.
However, we believe there are viable alternatives to each of these, if necessary.
However, slumps in one industry served by us can rapidly spread to other interrelated industries, which can mute the benefit of this protection.
Examples include the collapse of oil and other commodity prices, which has had a detrimental impact not only on customers in the oil and gas, agriculture, and mining industries, but also other industries, such as heavy equipment manufacturers, servicing these customers.
This impact is compounded if it is a global rather than a regional issue.
and cost saving solutions using a business model not easily replicated by our competitors.
Our Onsite service model provides a strategic advantage with our larger customers.
Building on our core business strategy of the local store, the Onsite model provides customer value through a customized service model while giving us a stronger competitive advantage and customer relationship, all with a relatively low investment given the existing store and distribution structure.
| | | | 2014 | | | 2013 | |
We expect to open 20 to 30 stores in 2015, which is an annual rate similar to 2014.
| | | 2014 | | | 2013 | | | 2012 | | | 2011 | | | 2010 | |
| | | | | | | | | | | | | | | | | | | | | | | |
| --- | --- | --- | --- | --- | --- | --- | --- | --- | --- | --- | --- | --- | --- | --- | --- | --- | --- | --- | --- | --- | --- | --- |
| 4-5 years old | 2010 | | 116 | | | 7/4 | | | 0/0 | | | 90 | | | | | 79 | | | | 13.9 | % |
| 5-6 years old | 2009 | | 62 | | | 4/1 | | | 0/0 | | | 134 | | | | | 125 | | | | 7.2 | % |
| 7-8 years old | 2007 | | 144 | | | 8/0 | | | 0/0 | | | 102 | | | | | 90 | | | | 13.3 | % |
| 10-11 years old | 2004 | | 208 | | | 4/1 | | | 0/0 | | | 107 | | | | | 95 | | | | 12.6 | % |
| 11-12 years old | 2003 | | 141 | | | 3/0 | | | 0/0 | | | 98 | | | | | 88 | | | | 11.4 | % |
| 12-16 years old | 1999-2002 | | 387 | | | 4/3 | | | \-1/0 | | | 124 | | | | | 111 | | | | 11.7 | % |
| 16+ years old | 1967-1998 | | 750 | | | 5/2 | | | 1/0 | | | 158 | | | | | 145 | | | | 9.0 | % |
| | |
| --- | --- |
Our product lines include the following:
| Product Line: | Year Introduced |
| Fasteners | 1967 |
| Tools | 1993 |
| Cutting tools | 1996 |
| Hydraulics & pneumatics | 1996 |
| Material handling | 1996 |
| Janitorial supplies | 1996 |
| Electrical supplies | 1997 |
| Welding supplies1 | 1997 |
| Safety supplies | 1999 |
| Metals | 2001 |
| Direct Ship | 2004 |
| Office supplies | 2010 |
| 1 | We do not sell welding gases. |
Inventories in
Financial Statements and Supplementary Data’.
In addition to our NASCAR® sponsorship, we do limited print and online advertising through a variety of publications and outlets.
These institutes provide a focused educational experience to enhance employee performance in relevant business areas such as leadership, effective store best practices, sales and marketing, product education, and distribution.
An excerpt. Shown here: 40 of 87 rewritten, all 27 added and all 33 removed. The counts are complete. For every sentence, read Item 1. BUSINESS in the FY2015 filing and the FY2014 filing.
Item 3. LEGAL PROCEEDINGS
1 rewritten, 0 added, 1 removed, 2 unchanged
A description of our legal proceedings, if any, is contained in Note [removed: 10] [added: 9] of the [removed: 'Notes] [added: Notes] to Consolidated Financial [removed: Statements'.][added: Statements.]
The description of our legal proceedings, if any, in Note 10 is incorporated herein by reference.
Cover and table of contents
35 rewritten, 6 added, 5 removed, 78 unchanged
| | For the fiscal year ended December 31, [removed: 2014,] [added: 2015,] |
[removed: ][added: ]
Indicate by check mark if disclosure of delinquent filers pursuant to Item 405 of Regulation S-K is not contained herein, and will not be contained, to the best of the registrant’s knowledge, in definitive proxy or information statements incorporated by reference in Part III of this Form 10-K or any amendment to this Form 10-K. [removed: x][added: o]
The aggregate market value of the Common Stock held by non-affiliates of the registrant as of June 30, [removed: 2014,] [added: 2015,] the last business day of the registrant’s most recently completed second fiscal quarter, was [removed: $14,587,577,033,] [added: $12,195,658,299,] based on the closing sale price of the Common Stock on that date.
For purposes of determining this number, all executive officers and directors of the registrant as of June 30, [removed: 2014] [added: 2015] are considered to be affiliates of the registrant.
As of January [removed: 23, 2015,] [added: 22, 2016,] the registrant had [removed: 295,880,219] [added: 288,403,782] shares of Common Stock issued and outstanding.
| Item 1. | | [removed: [Business](#s5165F76A85793553AB9E57292177E7EB)] [added: [Business](#s11A4E897A9B6EEF8DA0A8FD5C802D2E4)] | [removed: [3](#s5165F76A85793553AB9E57292177E7EB)] [added: [3](#s11A4E897A9B6EEF8DA0A8FD5C802D2E4)] |
| Item 1A. | | [Risk [removed: Factors](#s47A6C61A893F0DAF083A572922337460)] [added: Factors](#sDE01BF809C42F2DE41258FD5C8BB6FD6)] | [removed: [10](#s47A6C61A893F0DAF083A572922337460)] [added: [10](#sDE01BF809C42F2DE41258FD5C8BB6FD6)] |
| Item 1B. | | [Unresolved Staff [removed: Comments](#s5612FF5279C97FC7655E572922523D58)] [added: Comments](#s0E69AA136A80DC1916258FD5C8BDA085)] | [removed: [14](#s5612FF5279C97FC7655E572922523D58)] [added: [15](#s0E69AA136A80DC1916258FD5C8BDA085)] |
| Item 2. | | [removed: [Properties](#sC40A90109CEE70FC9F205729227115B9)] [added: [Properties](#sCA8F6598F37D2A81A8A98FD5C8C2B5E0)] | [removed: [14](#sC40A90109CEE70FC9F205729227115B9)] [added: [15](#sCA8F6598F37D2A81A8A98FD5C8C2B5E0)] |
| Item 3. | | [Legal [removed: Proceedings](#s5390A4A4F9B0BF2F2030572922A0796C)] [added: Proceedings](#s52EAEBBFD0D95F353D268FD5C8E44F76)] | [removed: [15](#s5390A4A4F9B0BF2F2030572922A0796C)] [added: [16](#s52EAEBBFD0D95F353D268FD5C8E44F76)] |
| Item 4. | | [Mine Safety [removed: Disclosures](#s99EAD95E220ADEB71673572922CF0B3E)] [added: Disclosures](#s9646BF06D8BEF2671EE98FD5C8EEED84)] | [removed: [15](#s99EAD95E220ADEB71673572922CF0B3E)] [added: [16](#s9646BF06D8BEF2671EE98FD5C8EEED84)] |
| Item X. | | [Executive Officers of the [removed: Registrant](#sBAC6D45D8E87ED512635572922FEAD21)] [added: Registrant](#s0A42B4CA493B19BE647F8FD5C8F90977)] | [removed: [16](#sBAC6D45D8E87ED512635572922FEAD21)] [added: [17](#s0A42B4CA493B19BE647F8FD5C8F90977)] |
| Item 5. | | [Market for Registrant’s Common Equity, Related Stockholder Matters, and Issuer Purchases of Equity [removed: Securities](#sD5EC028C1306EF05465057290A17A785)] [added: Securities](#sC068D06C68EBF4B965D98FD5BAB98B5D)] | [removed: [18](#sD5EC028C1306EF05465057290A17A785)] [added: [19](#sC068D06C68EBF4B965D98FD5BAB98B5D)] |
| Item 6. | | [Selected Financial [removed: Data](#sAE44A6EC27E48B375FA45729236BA155)] [added: Data](#s76BE82CEACD2E6EF8A348FD5C99972A7)] | [removed: [19](#sAE44A6EC27E48B375FA45729236BA155)] [added: [20](#s76BE82CEACD2E6EF8A348FD5C99972A7)] |
| Item 7. | | [Management’s Discussion and Analysis of Financial Condition and Results of [removed: Operations](#s03D4B126D0F148996FB85729239AC2E0)] [added: Operations](#sB53EE1DFDD5BCC6C54238FD5C9A176C6)] | [removed: [19](#s03D4B126D0F148996FB85729239AC2E0)] [added: [21](#sB53EE1DFDD5BCC6C54238FD5C9A176C6)] |
| Item 7A. | | [Quantitative and Qualitative Disclosures About Market [removed: Risks](#sA5D6C2B91846827FD23B572924F2F060)] [added: Risks](#s1F9276152061A9B38F778FD5CBCEC7FB)] | [removed: [38](#sA5D6C2B91846827FD23B572924F2F060)] [added: [39](#s1F9276152061A9B38F778FD5CBCEC7FB)] |
| Item 8. | | [Financial Statements and Supplementary [removed: Data](#sF1A23E7855ABB4F7426F5729251110D4)] [added: Data](#s1474191E8763F48795E18FD5CBE60087)] | [removed: [39](#sF1A23E7855ABB4F7426F5729251110D4)] [added: [40](#s1474191E8763F48795E18FD5CBE60087)] |
| Item 9. | | [Changes in and Disagreements with Accountants on Accounting and Financial [removed: Disclosure](#s594FF18456692AA6AB49572929D48AE3)] [added: Disclosure](#s0D5B14E03592EDA273D38FD5D0798EEC)] | [removed: [57](#s594FF18456692AA6AB49572929D48AE3)] [added: [58](#s0D5B14E03592EDA273D38FD5D0798EEC)] |
| Item 9A. | | [Controls and [removed: Procedures](#sCA8D44D6FC86993BF4E1572929F33C81)] [added: Procedures](#s4F3473B274D34C4D842A8FD5D07C65A3)] | [removed: [57](#sCA8D44D6FC86993BF4E1572929F33C81)] [added: [58](#s4F3473B274D34C4D842A8FD5D07C65A3)] |
| Item 9B. | | [Other [removed: Information](#s70A4E7BC19C4E813111357292A22C302)] [added: Information](#sAC872D3A5E43B36F5F898FD5D0CA3CDD)] | [removed: [58](#s70A4E7BC19C4E813111357292A22C302)] [added: [59](#sAC872D3A5E43B36F5F898FD5D0CA3CDD)] |
| | | [PART [removed: III](#s1F7E5B3627BE9A999F4D57292A41FB10)] [added: III](#s59049104E5F98CE7BA648FD5D0CE9392)] | |
| Item 10. | | [Directors, Executive Officers, and Corporate [removed: Governance](#s3389EB69DDC68CECABBE57292A70BDEF)] [added: Governance](#sD5BEFF73B18B2C5119CB8FD5D0FCDA11)] | [removed: [59](#s3389EB69DDC68CECABBE57292A70BDEF)] [added: [60](#sD5BEFF73B18B2C5119CB8FD5D0FCDA11)] |
| Item 11. | | [Executive [removed: Compensation](#s406986FA5ECE97A01D6357292A9FA19B)] [added: Compensation](#s978689D27FF052D0868A8FD5D1238CB3)] | [removed: [59](#s406986FA5ECE97A01D6357292A9FA19B)] [added: [60](#s978689D27FF052D0868A8FD5D1238CB3)] |
| Item 12. | | [Security Ownership of Certain Beneficial Owners and Management and Related Stockholder [removed: Matters](#sC21AD4DCA78621FAB9C157292ACE471D)] [added: Matters](#sC9A399F6C244D50EF34F8FD5D14FBCEB)] | [removed: [60](#sC21AD4DCA78621FAB9C157292ACE471D)] [added: [60](#sC9A399F6C244D50EF34F8FD5D14FBCEB)] |
| Item 13. | | [Certain Relationships and Related Transactions, and Director [removed: Independence](#s1F297D29510B8218F4EC57292AED5885)] [added: Independence](#s31DA65A1B0EC0033E98E8FD5D1740C6E)] | [removed: [60](#s1F297D29510B8218F4EC57292AED5885)] [added: [60](#s31DA65A1B0EC0033E98E8FD5D1740C6E)] |
| Item 14. | | [Principal Accountant Fees and [removed: Services](#s1A0A76AD89D53B5A625857292B1C93A3)] [added: Services](#s8043CAB55CDF2071E73B8FD5D1A3B2E9)] | [removed: [60](#s1A0A76AD89D53B5A625857292B1C93A3)] [added: [60](#s8043CAB55CDF2071E73B8FD5D1A3B2E9)] |
| Item 15. | | [Exhibits and Financial Statement [removed: Schedules](#sC4E13D1B7EF680798D3D57292B6AACFD)] [added: Schedules](#sC99F31D925A5B45AD3F18FD5BF1C21A2)] | [removed: [61](#sC4E13D1B7EF680798D3D57292B6AACFD)] [added: [61](#sC99F31D925A5B45AD3F18FD5BF1C21A2)] |
| | | [Index to [removed: Exhibits](#sD5646B8E639DED8090E957292BE7E165)] [added: Exhibits](#sF53B11848266F23F19948FD5D26A9608)] | [removed: [64](#sD5646B8E639DED8090E957292BE7E165)] [added: [64](#sF53B11848266F23F19948FD5D26A9608)] |
Portions of our Proxy Statement for the annual meeting of shareholders to be held Tuesday, April [removed: 21, 2015] [added: 19, 2016] (‘Proxy Statement’) are incorporated by reference in Part III.
Portions of our [removed: 2014] [added: 2015] Annual Report to Shareholders are incorporated by reference in Part II.
Such statements can be identified by the use of terminology such as anticipate, believe, should, estimate, expect, intend, may, [added: will,] plan, goal, project, [removed: will, potential, momentum,] [added: hope,] trend, target, [removed: generally, typically, experience, strive,] [added: opportunity,] and similar words or [removed: expressions.][added: expressions, or by references to typical outcomes.]
Any statement that is not a [added: purely] historical fact, including estimates, projections, [removed: future] trends, and the outcome of events that have not yet occurred, is a forward-looking statement.
Factors that could cause our actual results to differ from those discussed in the forward-looking statements include, but are not limited to, economic downturns, weakness in the manufacturing or commercial construction industries, competitive pressure on selling prices, changes in our current mix of products, customers or geographic locations, [removed: change] [added: changes] in our average store size, changes in our purchasing patterns, changes in customer needs, changes in fuel or commodity prices, inclement weather, changes in foreign currency exchange rates, difficulty in adapting our business model to different foreign business environments, weak acceptance or adoption of vending technology or increased competition in [added: industrial] vending, difficulty in maintaining installation quality as our [added: industrial] vending business expands, difficulty in hiring, relocating, [removed: training,] [added: training] or retaining qualified personnel, failure to accurately predict the number of North American markets able to support stores or to meet store opening goals, difficulty in controlling operating expenses, difficulty in collecting receivables or accurately predicting future inventory needs, dramatic changes in sales trends, changes in supplier production lead times, changes in our cash [removed: position,] [added: position or our need to make capital expenditures, credit market volatility,] changes in tax law, changes in the availability or price of commercial real estate, changes in the [removed: nature or] [added: nature,] price [added: or availability] of [removed: distribution and] [added: distribution, supply chain, or] other [added: technology (including software licensed from third parties) and services related to that] technology, cyber-security incidents, potential liability and reputational damage that can arise if our products are defective, and other risks and uncertainties detailed in this Form 10-K under the heading [removed: ‘Item] [added: 'Item] 1A.
All information contained in this Form 10-K reflects the two-for-one stock [removed: splits] [added: split] in [removed: 2011 and 2005.][added: 2011.]
10-K 1 fast1231201510-k.htm 10-K
UNITED STATES
| | | [PART I](#sBCB6C13C680909189F508FD5C7FD398F) | |
| | | [PART II](#s09A57B96F30DEF2442B08FD5C92BBFC8) | |
| | | [PART IV](#s6AF6C933FBD4AFC44E168FD5D1E5A899) | |
| | | [Signatures](#s5E392255BC01C0BB10BC8FD5D2487670) | [63](#s5E392255BC01C0BB10BC8FD5D2487670) |
10-K 1 fast1231201410-k.htm 10-K
| | | [PART I](#s9F44D0A005EA435DB44157292158DF7C) | |
| | | [PART II](#s528B331987DD2E49ABE45729231D0D46) | |
| | | [PART IV](#s4295C1D4C85EDFB5624357292B3BACBB) | |
| | | [Signatures](#s40CE5C80B4C3C8782FCD57292BC8C71A) | [63](#s40CE5C80B4C3C8782FCD57292BC8C71A) |
Item 2. PROPERTIES
17 rewritten, 6 added, 7 removed, 36 unchanged
| Purpose | | Tote Locations [removed: (ASRS)1] [added: (ASRS)(1)] | | | Approximate Square Feet | |
[removed: | 1 |] [added: (1)] Total number of tote locations for small parts storage included in facilities with an automated storage and retrieval system [removed: (ASRS). |][added: ('ASRS').]
| Purpose | Location | Tote Locations [removed: (ASRS)1 |] [added: (ASRS)(1)] | | | Approximate Square Feet | | [removed: | |]
| Distribution center [removed: and manufacturing facility] | Indianapolis, Indiana | 539,000 | | [removed: 2 | | 525,000 |] [added: (2)] | [added: 1,039,000] | |
| Distribution center | Atlanta, Georgia | 78,000 | | | [removed: |] 198,000 | | [removed: | |]
| Distribution center | Dallas, Texas | 41,000 | | [removed: 3 |] [added: (3)] | 176,000 | | [removed: | |]
| Distribution center | Scranton, Pennsylvania | 87,000 | | | [removed: |] 189,000 | | [removed: | |]
| Distribution center | Akron, Ohio | 74,000 | | | [removed: |] 152,000 | | [removed: | |]
| Distribution center | Kansas City, Kansas | [removed: |] [added: —] | | | 300,000 | | [removed: | |]
| Distribution center | Kitchener, Ontario, Canada | 105,000 | | | [removed: |] 142,000 | | [removed: 4 | |]
| Distribution center | High Point, North Carolina | [removed: |] [added: —] | | [added: (4)] | 256,000 | | [removed: | |]
| Distribution center and manufacturing facility | Modesto, California | 83,000 | | | [removed: |] 328,000 | | [removed: | |]
| Manufacturing facility | Rockford, Illinois | | | | [removed: |] 100,000 | | [removed: | |]
| Local re-distribution center and manufacturing facility | Johor, Malaysia | | | | [removed: |] 27,000 | | [removed: | |]
| Manufacturing facility | Wallingford, Connecticut | | | | [removed: |] 187,000 | | [removed: | |]
[removed: | 2 |] [added: (2)] This property contains an ASRS with capacity of 52,000 pallet locations, in addition to the 539,000 tote locations for small parts noted above; 185,000 of these small part tote locations are located in the [removed: FAST Solutions® (industrial vending)] [added: industrial vending] automated replenishment facility ('T-Hub'), which is also located on this property. [removed: |]
[removed: | 3 |] [added: (3)] This facility contains an ASRS with capacity of 14,000 pallet locations, in addition to the 41,000 tote locations for small parts noted above. [removed: |]
| | | | | | | |
| --- | --- | --- | --- | --- | --- | --- |
| | | | | | | |
| Manufacturing facility | Indianapolis, Indiana | | | | 220,000 | |
(1) Total number of tote locations for small parts storage included in facilities with an ASRS.
| (4) | This facility is currently under construction to add an ASRS with capacity of approximately 112,000 tote locations for small parts. |
| | |
| --- | --- |
| | | | | | | | | | |
| --- | --- | --- | --- | --- | --- | --- | --- | --- | --- |
| Storage facilities | Indianapolis, Indiana | | | | | 569,000 | | | |
| Distribution center | Kitchener, Ontario, Canada | | | | | 62,000 | | 4 | |
| 4 | Our distribution center in Kitchener, Ontario, Canada moved to a new 142,000 square foot facility in 2014. The 62,000 square foot facility is being vacated and is currently for sale. |
Item 4. MINE SAFETY DISCLOSURES
30 rewritten, 12 added, 11 removed, 33 unchanged
| Leland J. Hein | 1985 | | [removed: 54] [added: 55] | | [removed: President, Chief] [added: Senior] Executive [removed: Officer,] [added: Vice President – Sales] and Director |
| Daniel L. Florness | 1996 | | [removed: 51] [added: 52] | | [added: President, Chief] Executive [removed: Vice President] [added: Officer,] and [removed: Chief Financial Officer] [added: Director] |
| James C. Jansen | 1992 | | [removed: 44] [added: 45] | | Executive Vice President – [removed: Operations] [added: Manufacturing] |
| Sheryl A. Lisowski | 1994 | | [removed: 47] [added: 48] | | [removed: Controller] [added: Interim Chief Financial Officer, Controller,] and Chief Accounting Officer |
| Nicholas J. Lundquist | 1979 | | [removed: 57] [added: 58] | | Executive Vice President – Operations |
| [removed: Kenneth R. Nance] [added: Charles S. Miller] | [removed: 1992] [added: 1999] | | [removed: 50] [added: 41] | | Executive Vice President – Sales |
| Terry M. Owen | 1999 | | [removed: 46] [added: 47] | | [added: Senior] Executive Vice President – [removed: E-Business] [added: Sales Operations] |
| Gary A. Polipnick | 1983 | | [removed: 52] [added: 53] | | Executive Vice President – [removed: Sales] [added: FAST Solutions®] |
| Ashok Singh | 2001 | | [removed: 52] [added: 53] | | Executive Vice President – Information Technology |
| John L. Soderberg | 1993 | | [removed: 43] [added: 44] | | Executive Vice President – Sales Operations [removed: &] [added: and] Support |
| Reyne K. Wisecup | 1988 | | [removed: 51] [added: 52] | | Executive Vice President – Human Resources and Director |
Mr. [removed: Hein] [added: Florness] has been our [added: president and] chief executive officer since January [removed: 2015 and our president since July 2012.][added: 2016.]
Mr. [removed: Hein’s] [added: Hein's] responsibilities [removed: as an executive vice president – sales included] [added: include] sales and operational oversight [removed: over a substantial portion] of our [added: western United States] business.
Prior to November 2007, Mr. Hein served in various sales leadership [removed: roles, most recently as leader of] [added: roles at] our [removed: Winona and Kansas City based regions.][added: Company.]
[added: From December 2002 to December 2015,] Mr. Florness [removed: has been our] [added: was an] executive vice president and [added: our] chief financial [removed: officer since December 2002.][added: officer.]
Mr. Jansen has been [removed: an] [added: our] executive vice president – [removed: operations] [added: manufacturing] since [removed: December 2010.][added: January 2016.]
From April 2000 to April 2005, Mr. Jansen served [removed: in the] [added: as] sales [removed: leadership role] [added: leader] of our Texas based region.
Ms. Lisowski has been our [added: interim chief financial officer since January 2016, and our] controller and chief accounting officer since October 2013.
Mr. Lundquist has been [removed: an] [added: our] executive vice president – operations since July 2012.
Mr. [removed: Nance] [added: Miller] has been [removed: an] [added: our] executive vice president [removed: –] [added: -] sales since [removed: July 2012.][added: November 2015.]
Mr. [removed: Nance's] [added: Miller’s] responsibilities include sales and operational oversight of our [removed: business in the] eastern United States [removed: and Canada.][added: business.]
From [removed: June 2005] [added: November 2007] to July 2012, Mr. [removed: Nance served as] [added: Polipnick was] regional vice president of our [removed: Texas] [added: Winona] based region.
Prior to [removed: June] [added: April] 2005, Mr. [removed: Nance] [added: Soderberg] served in various sales leadership [removed: roles.][added: roles at our Company.]
Mr. [removed: Owen] [added: Soderberg] has been our executive vice president – [removed: e-business] [added: sales operations and support] since May 2014.
From [added: May 2014 to June 2015, Mr. Owen served as our executive vice president – e-business, and from] December 2007 to May 2014, Mr. Owen [removed: served as] [added: was] regional vice president of our Texas based and Mexico regions.
Mr. [removed: Polipnick] [added: Hein] has been [removed: an] [added: our senior] executive vice president – sales since [removed: July 2012.][added: January 2016.]
From [removed: November 2007 to] July [removed: 2012,] [added: 2012 to June 2015,] Mr. Polipnick served as [removed: regional vice president] [added: one] of our [removed: Winona based region.][added: executive vice president – sales.]
Prior to November 2007, Mr. Polipnick served in various sales leadership [removed: roles.][added: roles at our Company.]
Mr. [removed: Rucinski] [added: Owen] has been [removed: an] [added: our senior] executive vice president – sales [added: operations] since [removed: November 2007.][added: January 2016.]
Mr. [removed: Soderberg] [added: Polipnick] has been our executive vice president – [removed: sales operations & support] [added: FAST Solutions®] since [removed: May 2014.][added: January 2016.]
During his time as chief financial officer, Mr. Florness' responsibilities expanded beyond finance, including leadership of product development and procurement and the company's national accounts business.
Mr. Florness has served as one our directors since January 2016.
From July 2015 to December 2015, Mr. Hein was our chief operating officer.
Mr. Hein was our president and chief executive officer from January 2015 to July 2015, and our president from July 2012 to December 2014.
Mr. Jansen's responsibilities include oversight of our manufacturing operations.
From December 2010 to December 2015, Mr. Jansen was our executive vice president - operations.
From January 2009 to October 2015, Mr. Miller served as regional vice president of our southeast central region based primarily in Tennessee and Kentucky.
Prior to January 2009, Mr. Miller served in various sales leadership roles at our Company.
Mr. Owen's responsibilities include oversight of our information technology, sales operations and support, international sales, national accounts, FAST Solutions®, and manufacturing operations.
From July 2015 to December 2015, Mr. Owen was one of our executive vice president – sales.
Mr. Polipnick's responsibilities include our FAST Solutions® programs, e-commerce sales, and store inventory modeling and merchandising programs.
From July 2015 to December 2015, Mr. Polipnick was our executive vice president – e-business.
| Steven A. Rucinski | 1980 | | 57 | | Executive Vice President – Sales |
In addition to his financial role, Mr. Florness' responsibilities also include oversight over our national accounts business.
Since July 2012, Mr. Jansen's responsibilities have included oversight of our manufacturing.
Prior to July 2012, Mr. Jansen's responsibilities also included distribution development.
Mr. Lundquist’s responsibilities as an executive vice president – sales included sales and operational oversight over a substantial portion of our business.
Mr. Owen’s responsibilities include FAST Solutions® (industrial vending) and e-commerce sales.
Mr. Polipnick's responsibilities include sales and operational oversight of our business in the western United States.
Mr. Rucinski’s responsibilities include sales and operational oversight over our international business (other than Canada).
Prior to November 2007, Mr. Rucinski served in various sales leadership roles, most recently as leader of national accounts.
Mr. Rucinski has indicated his intention to retire during 2015.
Prior to April 2005, Mr. Soderberg served in various sales leadership roles.
Item 5. MARKET FOR REGISTRANT’S COMMON EQUITY, RELATED STOCKHOLDER MATTERS, AND ISSUER PURCHASES OF EQUITY SECURITIES
18 rewritten, 26 added, 20 removed, 14 unchanged
As of January [removed: 23, 2015,] [added: 22, 2016,] there were approximately 1,200 record holders of our common stock, which includes nominees or broker dealers holding stock on behalf of an estimated [removed: 173,000] [added: 185,000] beneficial owners.
The following table sets forth, by quarter, the high and low closing sale [removed: price1] [added: price(1)] of our shares on The NASDAQ Stock Market for [removed: 2014] [added: 2015] and [removed: 2013.][added: 2014.]
| [removed: 2014:] [added: 2015] | High | | [added: | |] Low | | [removed: 2013:] | | [added: 2014 | |] High | | [added: | |] Low | [added: | |]
[removed: 1] [added: (1)] The closing sale price was obtained from Shareholder.com, a division of Nasdaq OMX.
The following table sets forth our dividend payout [removed: (per] [added: (on a per] share basis) in each of the last [removed: three] [added: two] years:
| | [removed: 2014] | [added: 2010] | | [added: 2011] | [removed: 2013] | [added: 2012] | | [added: 2013] | [removed: 2012] | [added: 2014] | | [added: 2015 |]
| First quarter | $ | [removed: 0.25 | | | $ | 0.10] [added: 0.28] | | | $ | [removed: 0.17] [added: 0.25] | |
| Second quarter | [removed: 0.25 | | | | 0.20] [added: 0.28] | | | | [removed: 0.17] [added: 0.25] | | |
| Third quarter | [removed: 0.25] [added: 0.28] | | | | 0.25 | | | [removed: | 0.19 | | |]
| Fourth quarter | [removed: 0.25] [added: 0.28] | | | | 0.25 | | | [removed: | 0.21 | | |]
| Total | $ | [removed: 1.00 | | | $ | 0.80] [added: 1.12] | | | $ | [removed: 1.24] [added: 1.00] | |
On January 14, [removed: 2015,] [added: 2016,] we announced a quarterly dividend of [removed: $0.28] [added: $0.30] per share to be paid on February [removed: 27, 2015] [added: 26, 2016] to shareholders of record at the close of business on January [removed: 30, 2015.][added: 29, 2016.]
The table below sets forth information regarding purchases of our common stock during each of the last three months of [removed: 2014:][added: 2015:]
| Period | Total Number of Shares Purchased | | Average Price Paid per Share | | | Total Number of Shares Purchased as Part of Publicly Announced Plans or Programs [added: (1)] | | Maximum Number (or Approximate Dollar Value) of Shares that May Yet Be Purchased Under the Plans or Programs [added: (1)] |
Purchases of shares of our common stock earlier in [removed: 2014] [added: 2015] are described later in this Form 10-K under the heading ‘Item 7.
Set forth below is a graph comparing, for the five years ended December 31, [removed: 2014,] [added: 2015,] the yearly cumulative total shareholder return on our common stock with the yearly cumulative total shareholder return of the S&P 500 Index and the Dow Jones US Industrial Suppliers Index.
The comparison of total shareholder returns in the performance graph assumes that $100 was invested on December 31, [removed: 2009] [added: 2010] in Fastenal Company, the S&P 500 Index, and the Dow Jones US Industrial Suppliers Index, and that dividends were reinvested when and as paid.
[removed: ][added: 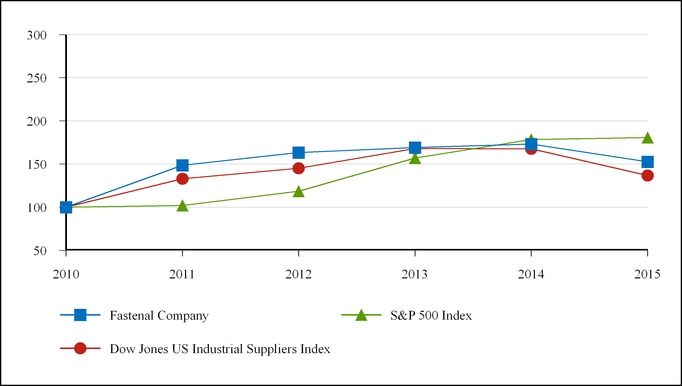]
Dollar amounts in this section are stated in whole numbers.
| | | | | | | | | | | | | | | | | | |
| --- | --- | --- | --- | --- | --- | --- | --- | --- | --- | --- | --- | --- | --- | --- | --- | --- | --- |
| | | | | | | | | | | | | | | | | | |
| First quarter | $ | 47.40 | | | $ | 39.82 | | | First quarter | | $ | 50.43 | | | $ | 42.70 | |
| Second quarter | 43.41 | | | | 40.01 | | | | Second quarter | | 51.20 | | | | 47.80 | | |
| Third quarter | 42.82 | | | | 36.13 | | | | Third quarter | | 50.08 | | | | 43.74 | | |
| Fourth quarter | 41.64 | | | | 35.50 | | | | Fourth quarter | | 48.21 | | | | 40.78 | | |
| | | | | | | | |
| --- | --- | --- | --- | --- | --- | --- | --- |
| | | | | | | | |
| | 2015 | | | | 2014 | | |
| October 1-31, 2015 | 200,000 | | $38.55 | | | 200,000 | | 3,200,000 |
| November 1-30, 2015 | 200,000 | | $38.77 | | | 200,000 | | 3,000,000 |
| December 1-31, 2015 | 100,000 | | $39.97 | | | 100,000 | | 2,900,000 |
| Total | 500,000 | | $38.92 | | | 500,000 | | 2,900,000 |
(1) On May 1, 2015, our board of directors authorized the purchase by us of an additional 4,000,000 shares of our common stock.
The reported purchases were made under this authorization, which does not have an expiration date.
As of December 31, 2015, we had remaining authority to purchase 2,900,000 shares under this authorization.
See Note 4 of the Notes to Consolidated Financial Statements for a description of certain additional purchases by us of shares of our common stock effected after December 31, 2015.
| | | | | | | | | | | | | |
| --- | --- | --- | --- | --- | --- | --- | --- | --- | --- | --- | --- | --- |
| | | | | | | | | | | | | |
| Fastenal Company | $ | 100.00 | | 148.43 | | 163.37 | | 169.18 | | 173.16 | | 152.71 |
| S&P 500 Index | | 100.00 | | 102.11 | | 118.45 | | 156.82 | | 178.28 | | 180.75 |
| Dow Jones US Industrial Suppliers Index | | 100.00 | | 132.98 | | 145.02 | | 167.88 | | 167.78 | | 136.77 |
| | | | | | | | | | |
| --- | --- | --- | --- | --- | --- | --- | --- | --- | --- |
| First quarter | $50.43 | | 42.70 | | First quarter | | $53.18 | | 46.47 |
| Second quarter | $51.20 | | 47.80 | | Second quarter | | $52.18 | | 44.95 |
| Third quarter | $50.08 | | 43.74 | | Third quarter | | $50.98 | | 43.99 |
| Fourth quarter | $48.21 | | 40.78 | | Fourth quarter | | $51.89 | | 45.62 |
| | | | | | | | | | | | |
| --- | --- | --- | --- | --- | --- | --- | --- | --- | --- | --- | --- |
| Total regular dividend | 1.00 | | | | 0.80 | | | | 0.74 | | |
| Supplemental* | — | | | | — | | | | 0.50 | | |
*Due to income tax rate uncertainties in the United States, we paid a supplemental dividend in December 2012.
| October 1-31, 2014 | 300,000 | | $42.73 | | | 300,000 | | 700,000 |
| November 1-30, 2014 | 300,000 | | $44.76 | | | 300,000 | | 400,000 |
| December 1-31, 2014 | 0 | | $0.00 | | | 0 | | 400,000 |
| Total | 600,000 | | $43.74 | | | 600,000 | | 400,000 |
On January 14, 2015, our board of directors increased the maximum number of shares that may yet be purchased from 400,000 shares to 2,000,000 shares.
| | 2009 | | 2010 | | 2011 | | 2012 | | 2013 | | 2014 |
| Fastenal Company | 100.00 | | 147.68 | | 219.19 | | 241.26 | | 249.84 | | 255.72 |
| S&P 500 Index | 100.00 | | 115.06 | | 117.49 | | 136.30 | | 180.44 | | 205.14 |
| Dow Jones US Industrial Suppliers Index | 100.00 | | 142.09 | | 188.95 | | 206.06 | | 238.54 | | 238.41 |
Item 6. SELECTED FINANCIAL DATA
1 rewritten, 0 added, 0 removed, 2 unchanged
Incorporated herein by reference is Ten-Year Selected Financial Data on pages 4 and 5 of Fastenal’s [removed: 2014] [added: 2015] Annual Report to Shareholders of which this Form 10-K forms a part, a portion of which is filed as Exhibit 13 to this Form 10-K.
Item 8. FINANCIAL STATEMENTS AND SUPPLEMENTARY DATA
242 rewritten, 119 added, 73 removed, 353 unchanged
We have audited the accompanying consolidated balance sheets of Fastenal Company and subsidiaries as of December 31, [removed: 2014] [added: 2015] and [removed: 2013,] [added: 2014,] and the related consolidated statements of earnings, comprehensive income, stockholders’ equity, and cash flows for each of the years in the three-year period ended December 31, [removed: 2014.][added: 2015.]
We also have audited the Company’s internal control over financial reporting as of December 31, [removed: 2014,] [added: 2015,] based on criteria established in Internal Control – Integrated Framework [removed: (1992)] [added: (2013)] issued by the Committee of Sponsoring Organizations of the Treadway [removed: Commission.][added: Commission (COSO).]
In our opinion, the consolidated financial statements referred to above present fairly, in all material respects, the financial position of Fastenal Company and subsidiaries as of December 31, [removed: 2014] [added: 2015] and [removed: 2013,] [added: 2014,] and the results of their operations and their cash flows for each of the years in the three-year period ended December 31, [removed: 2014,] [added: 2015,] in conformity with U.S. generally accepted accounting principles.
[removed: Furthermore,] [added: Also] in our opinion, Fastenal Company and subsidiaries maintained, in all material respects, effective internal control over financial reporting as of December 31, [removed: 2014,] [added: 2015,] based on criteria established in Internal Control – Integrated Framework [removed: (1992)] [added: (2013)] issued by [removed: the Committee of Sponsoring Organizations of the Treadway Commission.][added: COSO.]
| | [removed: 2014] [added: 2015] | | | | [added: 2014 | | |] 2013 | |
| Cash and cash equivalents [removed: | $] [added: at beginning of year] | 114,496 | | | [added: |] 58,506 | | [added: | 79,611 | |]
| [removed: Marketable] [added: Net decrease (increase) in marketable] securities | — | | | | 451 | | [added: | (97 | ) |]
| Trade accounts receivable, net of allowance for doubtful accounts of [removed: $12,619] [added: $11,729] and [removed: $9,248,] [added: $12,619,] respectively | [removed: 462,077] [added: 468,375] | | | | [removed: 414,331] [added: 462,077] | |
| Inventories | [removed: 869,224] [added: 913,263] | | | | [removed: 784,068] [added: 869,224] | |
| Deferred income tax assets | [removed: 21,765] [added: —] | | | | [removed: 18,248] [added: 21,765] | |
| Prepaid income taxes | [removed: —] [added: 22,558] | | | | [removed: 24,869] [added: —] | |
| Other current assets | [removed: 115,703] [added: 131,561] | | | | [removed: 107,988] [added: 115,703] | |
| Total current assets | [removed: 1,583,265] [added: 1,664,776] | | | | [removed: 1,408,461] [added: 1,583,265] | |
| Property and equipment, [removed: less accumulated depreciation] [added: net] | [removed: 763,889] [added: 818,889] | | | | [removed: 654,850] [added: 763,889] | |
| Other assets, net | [removed: 11,948] [added: 48,797] | | | | [removed: 12,473] [added: 11,948] | |
| Total assets | $ | [removed: 2,359,102] [added: 2,532,462] | | | [removed: 2,075,784] [added: 2,359,102] | |
| Accounts payable | [removed: 103,909] [added: 125,973] | | | | [removed: 91,253] [added: 103,909] | |
| Accrued expenses | [removed: 174,002] [added: 185,143] | | | | [removed: 148,579] [added: 174,002] | |
| Income taxes payable | [removed: 7,442] [added: —] | | | | [removed: —] [added: 7,442] | |
| Total current liabilities | [removed: 375,353] [added: 373,166] | | | | [removed: 239,832] [added: 375,353] | |
| Deferred income tax liabilities | [removed: 68,532] [added: 55,057] | | | | [removed: 63,255] [added: 68,532] | |
| Commitments and contingencies [removed: (notes 5, 9,] [added: (Notes 4, 8,] and [removed: 10)] [added: 9)] | | | | | | |
| Common stock, 400,000,000 shares authorized, [removed: 295,867,844] [added: 289,581,682] and [removed: 296,753,544] [added: 295,867,844] shares issued and outstanding, respectively | [removed: 2,959] [added: 2,896] | | | | [removed: 2,968] [added: 2,959] | |
| Additional paid-in capital | [removed: 33,744] [added: 2,024] | | | | [removed: 69,847] [added: 33,744] | |
| Retained earnings | [removed: 1,886,350] [added: 1,842,772] | | | | [removed: 1,688,781] [added: 1,886,350] | |
| Accumulated other comprehensive (loss) income | [removed: (7,836] [added: (46,403] | | ) | | [removed: 11,101] [added: (7,836] | [added: )] |
| Total stockholders’ equity | [removed: 1,915,217] [added: 1,801,289] | | | | [removed: 1,772,697] [added: 1,915,217] | |
| Total liabilities and stockholders’ equity | $ | [removed: 2,359,102] [added: 2,532,462] | | | [removed: 2,075,784] [added: 2,359,102] | |
See accompanying [removed: notes] [added: Notes] to [removed: consolidated financial statements][added: Consolidated Financial Statements.]
| | [removed: 2014] [added: 2015] | | | | [removed: 2013] [added: 2014] | | | [removed: 2012] [added: 2013] | |
| Net sales | $ | [removed: 3,733,507] [added: 3,869,187] | | | [removed: 3,326,106] [added: 3,733,507] | | | [removed: 3,133,577] [added: 3,326,106] | |
| Cost of sales | [removed: 1,836,105] [added: 1,920,253] | | | | [removed: 1,606,661] [added: 1,836,105] | | | [removed: 1,519,053] [added: 1,606,661] | |
| Gross profit | [removed: 1,897,402] [added: 1,948,934] | | | | [removed: 1,719,445] [added: 1,897,402] | | | [removed: 1,614,524] [added: 1,719,445] | |
| Operating and administrative expenses | [removed: 1,110,776] [added: 1,121,590] | | | | [removed: 1,007,431] [added: 1,110,776] | | | [removed: 941,236] [added: 1,007,431] | |
| Gain on sale of property and equipment | [removed: (964] [added: (1,411] | | ) | | [removed: (643] [added: (964] | ) | | [removed: (403] [added: (643] | ) |
| Operating income | [removed: 787,590] [added: 828,755] | | | | [removed: 712,657] [added: 787,590] | | | [removed: 673,691] [added: 712,657] | |
| Interest income | [removed: 759] [added: 373] | | | | [removed: 924] [added: 759] | | | [removed: 464] [added: 924] | |
| Interest expense | [removed: (915] [added: (3,108] | | ) | | [removed: (113] [added: (915] | ) | | [removed: —] [added: (113] | [added: )] |
| Earnings before income taxes | [removed: 787,434] [added: 826,020] | | | | [removed: 713,468] [added: 787,434] | | | [removed: 674,155] [added: 713,468] | |
| Income tax expense | [removed: 293,284] [added: 309,659] | | | | [removed: 264,832] [added: 293,284] | | | [removed: 253,619] [added: 264,832] | |
February 5, 2016
| | 2015 | | | | 2014 | |
| Cash and cash equivalents | $ | 129,019 | | | 114,496 | |
| Current portion of debt | $ | 62,050 | | | 90,000 | |
| Long-term debt | 302,950 | | | | — | |
See accompanying Notes to Consolidated Financial Statements.
| Net earnings | $ | 516,361 | | | 494,150 | | | 448,636 | |
See accompanying Notes to Consolidated Financial Statements.
| Purchases of common stock | (7,100 | ) | | (71 | | ) | | (60,042 | ) | | (232,838 | ) | | — | | | (292,951 | ) |
| Stock options exercised | 814 | | | 8 | | | | 19,091 | | | — | | | — | | | 19,099 | |
| Net earnings | — | | | — | | | | — | | | 516,361 | | | — | | | 516,361 | |
| Balance as of December 31, 2015 | 289,582 | | | $ | 2,896 | | | 2,024 | | | 1,842,772 | | | (46,403 | ) | | 1,801,289 | |
See accompanying Notes to Consolidated Financial Statements.
| | 2015 | | | | 2014 | | | 2013 | |
| Net earnings | $ | 516,361 | | | 494,150 | | | 448,636 | |
| Gain on sale of property and equipment | (1,411 | | ) | | (964 | ) | | (643 | ) |
| Other | (11,907 | | ) | | (2 | ) | | (145 | ) |
See accompanying Notes to Consolidated Financial Statements.
| | | | | 1,324,923 | | | | 1,193,734 | |
| | 2015 | | | | 2014 | |
| Accrued expenses | $ | 185,143 | | | 174,002 | |
Subsequent to December 31, 2015, we have purchased 1,600,000 shares of our common stock at an average price of approximately $37.15 per share.
| April 21, 2015 | 893,220 | | | $ | 42.00 | | | $ | 41.26 | | | 817,990 | | | — | |
| Total | 9,948,220 | | | | | | | | | | | 4,530,982 | | | 1,792,242 | |
| April 21, 2015 | 1.3 | % | | 5.00 | | 2.7 | % | | 26.84 | % | | $ | 7.35 | |
| Outstanding as of January 1, 2015 | 4,712,330 | | | $ | 38.52 | | | 4.59 |
| Granted | 893,220 | | | $ | 42.00 | | | 8.41 |
| Exercised | (813,838 | ) | | $ | 23.47 | | | |
| Cancelled/forfeited | (260,730 | ) | | $ | 45.84 | | | |
| Outstanding as of December 31, 2015 | 4,530,982 | | | $ | 41.49 | | | 4.89 |
| Exercisable as of December 31, 2015 | 1,792,242 | | | $ | 31.00 | | | 2.15 |
| | Options Outstanding | | | Exercise Price(1) | | | | Remaining Life(2) |
Any future change in estimated forfeitures will impact this amount.
| | 2015 | | | | 2014 | | | 2013 | |
| Federal | $ | 256,748 | | | 7,362 | | | 264,110 | |
| State | 31,297 | | | | 227 | | | 31,524 | |
| Foreign | 13,677 | | | | 348 | | | 14,025 | |
| | $ | 301,722 | | | 7,937 | | | 309,659 | |
| | 2015 | | | | 2014 | | | 2013 | |
| | 2015 | | | | 2014 | |
February 5, 2015
| Line of credit | $ | 90,000 | | | — | |
| Balance as of December 31, 2011 | 295,258 | | | $ | 2,953 | | | 16,856 | | | 1,424,371 | | | 14,796 | | | 1,458,976 | |
| Stock options exercised | 1,306 | | | 13 | | | | 29,631 | | | — | | | — | | | 29,644 | |
| Net earnings | — | | | — | | | | — | | | 420,536 | | | — | | | 420,536 | |
| Net decrease (increase) in marketable securities | 451 | | | | (97 | ) | | 26,811 | |
| Net increase in other assets | (2 | | ) | | (145 | ) | | (133 | ) |
| Cash and cash equivalents at beginning of year | 58,506 | | | | 79,611 | | | 117,676 | |
Financial Instruments and Marketable Securities
Marketable securities as of December 31, 2013 consisted of common stock.
We classified our marketable securities as available-for-sale.
We value these assets utilizing a fair value hierarchy that prioritizes the inputs to valuation techniques used to measure fair value.
The hierarchy gives the highest priority to unadjusted quoted prices in active markets for identical assets and liabilities (Level 1) and the lowest priority to measurements involving significant unobservable inputs (Level 3).
The three levels of the fair value hierarchy and how they are determined are defined earlier in Note 1.
| | | | | 1,193,734 | | | | 1,019,902 | |
| | $ | 174,002 | | | 148,579 | |
The 2012 amount included a fourth quarter supplemental dividend of $0.50.
On January 14, 2015, our board of directors increased the maximum number of shares of our common stock that may yet be purchased to 2,000,000 shares.
| Total | 9,055,000 | | | | | | | | | | | 4,712,330 | | | 1,972,330 | |
| Outstanding as of January 1, 2013 | 4,835,792 | | | $ | 32.51 | | | 5.40 |
| Granted | 205,000 | | | $ | 54.00 | | | 8.41 |
| Exercised | (389,162 | ) | | $ | 23.91 | | | |
| Cancelled/forfeited | (295,000 | ) | | $ | 35.89 | | | |
| Outstanding as of December 31, 2013 | 4,356,630 | | | $ | 34.06 | | | 4.66 |
| Exercisable as of December 31, 2013 | 1,442,380 | | | $ | 23.61 | | | 2.74 |
| | |
| --- | --- |
| Federal | $ | 202,095 | | | 14,742 | | | 216,837 | |
| State | 27,586 | | | | 981 | | | 28,567 | |
| Foreign | 8,476 | | | | (261 | ) | | 8,215 | |
| | $ | 238,157 | | | 15,462 | | | 253,619 | |
| Settlements | — | | | | (1,449 | ) |
Most store locations have initial lease terms of 36 to 48 months.
Leasehold improvements, with a net book value of $1,732 at December 31, 2014, on operating leases are amortized over a 36\-month period.
The semi-tractor leases typically have a lease term of 48 to 60 months.
The pick-up leases typically have a non-cancelable lease term of approximately one year, with renewal options for up to 72\-months.
Our average lease term for pick-ups is typically for 28 to 36 months.
| 2015 | $ | 92,333 | | | 23,991 | | | 116,324 | |
| 2016 | 66,083 | | | | 15,336 | | | 81,419 | |
| 2017 | 40,357 | | | | 6,682 | | | 47,039 | |
An excerpt. Shown here: 40 of 242 rewritten, 40 of 119 added and 40 of 73 removed. The counts are complete. For every sentence, read Item 8. FINANCIAL STATEMENTS AND SUPPLEMENTARY DATA in the FY2015 filing and the FY2014 filing.
Item 9A. CONTROLS AND PROCEDURES
4 rewritten, 3 added, 3 removed, 27 unchanged
Under the supervision of our principal executive officer and our principal financial officer, we conducted an evaluation of the effectiveness of our internal control over financial reporting based on the framework in Internal Control – Integrated Framework [removed: (1992)] [added: (2013)] issued by the Committee of Sponsoring Organizations of the Treadway Commission.
Based on our assessment and those criteria, management believes that the Company maintained effective internal control over financial reporting as of December 31, [removed: 2014.][added: 2015.]
| President and Chief Executive Officer | | [removed: Executive Vice-President and] [added: Interim] Chief Financial [added: Officer, Controller, and Chief Accounting] Officer |
| Winona, [removed: MN] [added: Minnesota] | | |
| /s/ Daniel L. Florness | | /s/ Sheryl A. Lisowski |
| Daniel L. Florness | | Sheryl A. Lisowski |
| February 5, 2016 | | |
| /s/ Leland J. Hein | | /s/ Daniel L. Florness |
| Leland J. Hein | | Daniel L. Florness |
| February 5, 2015 | | |
Item 12. SECURITY OWNERSHIP OF CERTAIN BENEFICIAL OWNERS AND MANAGEMENT AND RELATED STOCKHOLDER MATTERS
0 rewritten, 2 added, 2 removed, 10 unchanged
| Equity compensation plans approved by security holders | 4,530,982 | | $41.49 | | 6,120,700 |
| Total | 4,530,982 | | | | 6,120,700 |
| Equity compensation plans approved by security holders | 4,712,330 | | $38.52 | | 6,739,190 |
| Total | 4,712,330 | | | | 6,739,190 |
Item 15. EXHIBITS AND FINANCIAL STATEMENT SCHEDULES
29 rewritten, 9 added, 10 removed, 85 unchanged
Consolidated Balance Sheets as of December 31, [removed: 2014] [added: 2015] and [removed: 2013][added: 2014]
Consolidated Statements of Earnings for the years ended December 31, [added: 2015,] 2014, [removed: 2013,] and [removed: 2012][added: 2013]
Consolidated Statements of Comprehensive Income for the years ended December 31, [added: 2015,] 2014, [removed: 2013,] and [removed: 2012][added: 2013]
Consolidated Statements of Stockholders’ Equity for the years ended December 31, [added: 2015,] 2014, [removed: 2013,] and [removed: 2012][added: 2013]
Consolidated Statements of Cash Flows for the years ended December 31, [added: 2015,] 2014, [removed: 2013,] and [removed: 2012][added: 2013]
| 3.2 | Restated By-Laws of Fastenal Company (incorporated by reference to Exhibit 3.2 to Fastenal Company’s Form 8-K dated as of October 15, [removed: 2010)] [added: 2010 (file no. 000-16125))] |
| 10.4 | Credit Agreement dated as of [removed: December 13, 2012] [added: May 1, 2015] among Fastenal Company, the Lenders from time to time party thereto, and Wells Fargo Bank, National Association, as Administrative Agent, Swingline Lender and Issuing Lender (incorporated by reference to Exhibit 10.1 to Fastenal Company's Form 8-K dated [removed: December 19, 2012),] [added: May 5, 2015),] as amended by the First Amendment to Credit Agreement dated as of [removed: April 15, 2014 (incorporated by reference to Exhibit 10.1 to Fastenal Company's Form 10-Q dated April 16, 2014), the Second Amendment to Credit Agreement dated as of August 19, 2014] [added: November 23, 2015] (incorporated by reference to Exhibit 10.1 to Fastenal Company's Form 8-K dated [removed: August 22, 2014), and the Third Amendment to Credit Agreement dated as of December 16, 2014 (incorporated by reference to Fastenal Company's Form 8-K dated December 19, 2014)] [added: November 25, 2015)] |
| 13 | Portions of [removed: 2014] [added: 2015] Annual Report to Shareholders not included in this Form 10-K (only those sections specifically incorporated by reference in this Form 10-K shall be deemed filed with the SEC) |
| 101 | The following materials formatted in XBRL (Extensible Business Reporting Language): (i) the Consolidated Balance Sheets, (ii) the Consolidated Statements of Earnings, (iii) the Consolidated Statements of Comprehensive Income, (iv) the Consolidated Statements of Stockholders’ Equity, (v) the Consolidated Statements of Cash Flows, and (vi) the Notes to Consolidated Financial [removed: Statements.] [added: Statements] |
Years ended December 31, [added: 2015,] 2014, [removed: 2013,] and [removed: 2012][added: 2013]
| Insurance reserves | $ | 30,880 | | | 52,858 | | [removed: 1] [added: (1)] | — | | | 52,601 | | [removed: 2] [added: (2)] | 31,137 | |
| Insurance reserves | $ | 25,188 | | | 52,658 | | [removed: 1] [added: (1)] | — | | | 46,966 | | [removed: 2] [added: (2)] | 30,880 | |
| Year ended December 31, [removed: 2012] [added: 2015] | | | | | | | | | | | | | | | |
[removed: | 1 |] [added: (1)] Includes costs and expenses incurred for premiums and claims related to health and general insurance. [removed: |]
[removed: | 2 |] [added: (2)] Includes costs and expenses paid for premiums and claims related to health and general insurance. [removed: |]
| Date: | | February 5, [removed: 2015] [added: 2016] |
| [removed: By | |] /s/ Leland J. Hein | [added: | | /s/ Reyne K. Wisecup |]
| | | [removed: Leland J. Hein,] [added: Daniel L. Florness,] President and Chief Executive Officer |
| [removed: /s/ Leland J. Hein |] [added: By] | | /s/ Daniel L. Florness |
| [added: Daniel L. Florness, President and Chief Executive Officer] (Principal Executive Officer), and Director | | | [added: Sheryl A. Lisowski, Interim Chief] Financial [added: Officer, Controller, and Chief Accounting] Officer (Principal Financial Officer and [added: Principal Accounting Officer)] |
| Willard D. Oberton, Director (Chairman) | | | [removed: Michael M. Gostomski,] [added: Rita J. Heise,] Director |
| Michael J. Dolan, Director | | | [removed: Reyne K. Wisecup,] [added: Hugh L. Miller,] Director |
| /s/ [removed: Hugh L. Miller] [added: Michael J. Dolan] | | | /s/ [removed: Michael J. Ancius] [added: Hugh L. Miller] |
| [removed: Hugh L. Miller,] [added: Michael J. Ancius,] Director | | | [removed: Michael J. Ancius,] [added: Darren R. Jackson,] Director |
| [removed: Scott A. Satterlee,] [added: Stephen L. Eastman,] Director | | | [removed: Rita J. Heise,] [added: Scott A. Satterlee,] Director |
| /s/ [removed: Darren R. Jackson] [added: Michael J. Ancius] | | | [added: /s/ Darren R. Jackson] |
| 10.2 | Fastenal Company Stock Option Plan as amended and restated effective as of December 12, 2014 [removed: (incorporated by reference to Exhibit 10.1 to Fastenal Company’s Form 8-K dated December 17, 2014)] | Incorporated by Reference |
| 10.4 | Credit Agreement dated as of [removed: December 13, 2012] [added: May 1, 2015] among Fastenal Company, the Lenders from time to time party thereto, and Wells Fargo Bank, National Association, as Administrative Agent, Swingline Lender and Issuing [removed: Lender (incorporated by reference to Exhibit 10.1 to Fastenal Company's Form 8-K dated December 19, 2012),] [added: Lender,] as amended by the First Amendment to Credit Agreement dated as of [removed: April 15, 2014 (incorporated by reference to Exhibit 10.1 to Fastenal Company's Form 10-Q dated April 16, 2014), the Second Amendment to Credit Agreement dated as of August 19, 2014 (incorporated by reference to Exhibit 10.1 to Fastenal Company's Form 8-K dated August 22, 2014), and the Third Amendment to Credit Agreement dated as of December 16, 2014 (incorporated by reference to Fastenal Company's Form 8-K dated December 19, 2014)] [added: November 23, 2015] | Incorporated by Reference |
| 13 | Portions of [removed: 2014] [added: 2015] Annual Report to Shareholders not included in this Form 10-K (only those sections specifically incorporated by reference in this Form 10-K shall be deemed filed with the SEC) | Electronically Filed |
| Allowance for doubtful accounts | $ | 12,619 | | | 8,769 | | | — | | | 9,659 | | | 11,729 | |
| Insurance reserves | $ | 31,137 | | | 54,341 | | (1) | — | | | 53,657 | | (2) | 31,821 | |
| Date: | | February 5, 2016 |
| /s/ Daniel L. Florness | | | /s/ Sheryl A. Lisowski |
| /s/ Willard D. Oberton | | | /s/ Rita J. Heise |
| /s/ Stephen L. Eastman | | | /s/ Scott A. Satterlee |
| | | | |
| Leland J. Hein, Director | | | Reyne K. Wisecup, Director |
| | | | |
| | |
| --- | --- |
| Allowance for doubtful accounts | $ | 5,647 | | | 9,726 | | | — | | | 8,645 | | | 6,728 | |
| Insurance reserves | $ | 30,548 | | | 43,024 | | 1 | — | | | 48,384 | | 2 | 25,188 | |
| Leland J. Hein, President and Chief Executive Officer | | | Daniel L. Florness, Executive Vice President and Chief |
| | | | Principal Accounting Officer) |
| /s/ Willard D. Oberton | | | /s/ Michael M. Gostomski |
| /s/ Michael J. Dolan | | | /s/ Reyne K. Wisecup |
| /s/ Scott A. Satterlee | | | /s/ Rita J. Heise |
| Darren R. Jackson, Director | | | |