 filings.tools
Fastenal (FAST) 10-K risk factor changes: FY2017 vs FY2016
The 2017-12-31 10-K against the 2016-12-31 one, compared heading by heading and sentence by sentence. One of these filings carries no fiscal year tag, so its year is the calendar year of the period end.
Item 1A47 rewritten51 added20 removed133 unchanged
All filing items598 rewritten701 added738 removed1,074 unchanged
Summary
counted, not written
- Item 1A headings could not be compared: only 0 carried over between the two years, which usually means one filing was read wrongly, so none is reported as new or removed.
- Sentence by sentence, 701 added, 738 removed, 598 rewritten and 1,074 unchanged across 15 items that differ.
Sentences by item
22 items, with every count and a link to each item that changed
Underlined words on a shaded ground are new in FY2017; struck-through words were in FY2016. Sentences that are wholly new or wholly gone are labelled rather than marked.
Item 1A. RISK FACTORS
47 rewritten, 51 added, 20 removed, 133 unchanged
Historically, the most effective way to attract new customers has been opening new [removed: stores.][added: branches.]
In recent years, however, we have devoted increased resources to other growth drivers, including our industrial vending [removed: business (which is discussed in more detail below),] [added: business,] our Onsite business, and our national accounts team.
Failure to achieve any of our goals regarding industrial vending, Onsite locations, national accounts signings, [removed: our CSP 16 (Customer Service Project 2016) initiative,] or other growth drivers could negatively impact our long-term sales growth.
Our competitive advantage in our industrial vending business could be eliminated and the loss of key suppliers of equipment and services for that business could be [removed: disruptive.][added: disruptive and could result in failure to deploy devices.]
We believe we have a competitive advantage in industrial vending due to our vending hardware and software, our local [removed: store] [added: branch] presence (allowing us to service [removed: machines] [added: devices] more rapidly), our 'vendible' [added: product depth, and in North America, our distribution strength.]
In addition, we currently rely on a limited number of suppliers for the vending [removed: machines] [added: devices] used in, and certain software and services needed to operate, our industrial vending business.
Our success depends in part on our ability to develop product expertise at the [removed: store] [added: selling location] level and identify future products and product lines that complement existing products and product lines and that respond to our customers' needs.
In addition, our ability to integrate new products and product lines into our [removed: stores] [added: branches] and distribution network could impact sales and profit margins.
Our success depends in part on our ability to attract, motivate, and retain a sufficient number of qualified employees, including [removed: store managers, outside sales personnel,] [added: inside] and [removed: other store] [added: outside branch] associates, [added: Onsite managers, and national account sales representatives,] who understand and appreciate our culture and are able to adequately represent this culture to our customers.
An inability to recruit and retain a sufficient number of qualified individuals in the future may also delay the planned openings of new [removed: stores] [added: branches] and planned expansion of our other selling channels.
Our inability to [added: attract or] transition key executive officers may divert the attention of other members of our senior [removed: management from] [added: leadership and adversely impact] our existing operations.
Our success depends on the efforts and abilities of our [removed: senior management and we have had some transition in our] [added: key] executive officers [removed: over the last few years.][added: and senior leadership.]
[removed: Difficulties] [added: In addition, difficulties] in smoothly implementing [removed: that transition, or] [added: any transition to new members] of [added: our executive team, or] recruiting suitable [removed: replacements in the event of unsuccessful transitions,] [added: replacements,] could divert the attention of other members of our senior [removed: management] [added: leadership] team from our existing operations.
We may not be able to compete effectively against [removed: our] [added: traditional or non-traditional] competitors, which could cause us to lose market share or erode our operating income.
The industrial, construction, and maintenance supply industry, although [added: slowly] consolidating, still remains a large, [removed: fragmented industry that is] [added: fragmented, and] highly [removed: competitive.][added: competitive industry.]
Our current or future competitors may include companies with similar or greater market presence, name recognition, and financial, marketing, [added: technological,] and other resources, and we believe they will continue to challenge us with their product selection, financial resources, [added: technological advancements,] and services.
Increased competition from brick and mortar retailers in markets in which we have [removed: stores] [added: in-market locations] or from on-line retailers (particularly those major internet providers who can offer a wide range of products and rapid delivery), and the adoption by competitors of aggressive pricing strategies and sales methods, could cause us to lose market share or reduce our prices or increase our spending, thus eroding our operating income.
The nature of our business requires us to receive, retain, and transmit certain personally identifying information that our customers provide [removed: to purchase products or services, register on our websites, or otherwise communicate and interact with us.]
While we also seek to obtain assurances that third parties we interact with will protect confidential information, there is a risk the confidentiality of [added: data held or accessed by third parties may be compromised.]
A downturn in either the national or local economy where [removed: our stores] [added: we] operate, or in the principal markets served by us, or changes in any of the other factors described above, could negatively impact sales at our [removed: stores,] [added: in-market locations,] sales through our other selling channels, and the level of profitability of those [removed: stores] [added: in-market locations] and other selling channels.
[removed: These variables resulted in our manufacturing] [added: When this happens, these] customers [removed: making less money, and when that happens they] tend to cut back on spending which yields a slowdown in our business [removed: to those] [added: with these] customers.
Our suppliers could discontinue selling products manufactured in foreign countries at any time for reasons that may or may not be in our control or our suppliers' control, including foreign government [added: regulations, domestic government regulations, political unrest, war, disruption or delays in shipments, changes in local economic conditions, or trade issues.]
This sourcing is both direct (through our wholly-owned, Asia-based subsidiary, FASTCO Trading Co., Ltd.) and indirect (from [removed: vendors] [added: suppliers] that themselves procure product from international sources).
Considerable political uncertainty [removed: has arisen] in the United States [removed: that] may result in changes [removed: in the] [added: to] trade policies that [removed: companies, such as Fastenal, have built their] [added: may affect our] sourcing [removed: operations around.][added: operations.]
Should this occur, it may be difficult in light [removed: of: (1)] [added: of] the significant structural investments made over [removed: time,] [added: time] and [removed: (2)] the absence of significant domestic fastener production for us to adjust our capabilities to [removed: the] [added: any] new policies in the short term, which could increase the difficulty and/or cost of sourcing [removed: foreign] products.
The fuel costs of our distribution and [removed: store] [added: branch] operations have fluctuated as well.
While increases in the cost of fuel or raw materials could be damaging to us, decreases in those costs, particularly if severe, could also adversely impact us by creating deflation in selling prices, which could cause our gross profit [removed: to deteriorate, or by negatively impacting customers in certain industries, which could cause our sales to those customers to decline.]
Our ability to provide efficient distribution of core business products to our [removed: store] [added: branch] network is an integral component of our overall business strategy.
Our current estimates of [added: total market potential as well as] the market potential of our business strategies could be incorrect.
We [added: believe the potential market opportunity for industrial vending is approximately 1.7 million devices and we] have [removed: also] identified over 15,000 customer locations with the potential to implement our Onsite service model.
In addition, the market potential of a particular business strategy may vary from expectations [removed: because of] [added: due to] a change in the marketplace (such as changes in customer concentration or needs), a change in the nature of that business strategy, or weaker than anticipated acceptance by customers of that business strategy.
We cannot guarantee that our market potential estimates are accurate or that we will [added: ultimately] decide to [removed: open stores or] expand our industrial vending or Onsite service models to reach the full market opportunity.
Fluctuations in the relative strength of foreign economies and their related currencies could adversely [removed: impact our ability to procure products overseas at competitive prices and our foreign sales.]
Tight credit markets could impact our ability to obtain financing on reasonable terms or increase the cost of existing or future [removed: financing.][added: financing and interest rate fluctuations could adversely impact our results.]
As of December 31, [removed: 2016,] [added: 2017,] we had [removed: $390 million] [added: $415.0] of outstanding debt obligations, including loans outstanding under our revolving credit facility (the 'Credit Facility') of [removed: $305 million] [added: $280.0] and senior unsecured promissory notes issued under our master note agreement (the 'Master Note Agreement') in the aggregate principal amount of [removed: $75 million.][added: $135.0.]
Loans under the Credit Facility bear interest at a rate per annum based on the London Interbank Offered Rate ('LIBOR') and mature on March [removed: 1, 2018.][added: 10, 2020.]
The notes issued under our Master Note Agreement consist of [removed: two] [added: three] series.
The first is in an aggregate principal amount of [removed: $40 million,] [added: $40.0,] bears interest at a fixed rate of 2.00% per annum, and is due and payable on July 20, 2021.
The second is in an aggregate principal amount of [removed: $35 million,] [added: $35.0,] bears interest at a fixed rate of 2.45% per annum, and is due and payable on July 20, 2022.
Our aggregate borrowing capacity under the Credit Facility is [removed: $700 million.][added: $700.0.]
Further, failure to identify appropriate customer sites for our Onsite businesses or failure to find suitable locations for our Onsite businesses once appropriate customer sites are identified may adversely impact our goals regarding the number of new Onsite locations we are able to open.
Similarly, in recent years, revenues from national accounts customers, which typically have lower gross profit margins by virtue of their scale and available business, have tended to grow faster than revenues from smaller customers.
This factor has become more significant as revenues from Onsite locations has grown in the mix.
Customer and product mix have contributed to the decline in our gross profit percentage over time, including in 2017 and 2016, and will likely continue to affect our gross profit percentage in 2018 and beyond.
However, whether this adverse mix impact will result in a decline of our gross profit percentage in any given year will depend on the extent to which they are, or are not, offset by positive impacts to gross profit margin during such year.
Our operating and administrative expenses could grow more rapidly than net sales which could result in failure to achieve our goals related to leveraging revenue growth into higher net earnings.
Over time, we have generally experienced an increase in our operating and administrative expenses, including costs related to payroll, occupancy, freight, and information technology, among others, as our net sales have grown.
However, historically, a portion of these expenses has not increased at the same rates as net sales, allowing us to leverage our growth and sustain or expand our operating profit margins.
There are various scenarios where we may not be able to continue to achieve this leverage as we have been able to do in the past.
For instance, it is typical that when demand declines, most commonly from cyclical factors (though it could be due to customer losses or some other company-specific event), our operating and administrative expenses do not fall as quickly as net sales.
It is also possible that in the future we will elect to make investments in operating and administrative expenses that would result in costs growing faster than net sales.
In addition, market variables, such as labor rates, energy costs, and legal costs, could move in such a way as to cause us to not be able to manage our operating and administrative expenses in a way that would enable us to leverage our revenue growth into higher net earnings.
Should any of these scenarios, or a combination of them, occur in the future, it is possible that our operating and pre-tax profit margins could decline even if we are able to grow revenue.
While these devices, software, and services can be obtained from other sources, loss of our current suppliers could be disruptive and could result in us failing to meet our goals related to the number of devices we are able to deploy in the next twelve to eighteen months.
In the event of voluntary or involuntary vacancies in our executive team in the future, the extent to which there is disruption in the oversight and/or leadership of our business will depend on our ability to either transition internal, talented individuals or recruit suitable replacements to serve in these roles.
to purchase products or services, register on our websites, or otherwise communicate and interact with us.
If we experience a loss related to our information systems or are unable to maintain or upgrade our information systems, or convert to alternate systems, in a timely and efficient manner, our operations may be disrupted or become less efficient.
We depend on information systems for many aspects of our business and we could be adversely affected if we experience a disruption or data loss relating to our information systems and are unable to recover in a timely manner.
We could also be adversely impacted if we are unable to improve, upgrade, maintain, and expand our information systems.
Difficulties resulting from the transition of our industrial vending hosting services could also be disruptive to the success of our efforts to grow our industrial vending presence.
The success of our growth drivers is dependent in varying degrees on the timely delivery and the functionality of information technology systems to support them.
Extended delays or unexpected expenses in securing, developing, and otherwise implementing technology solutions to support our growth drivers could delay the achievement of our goals regarding these growth drivers.
In particular, our future effective tax rates could be affected by legislative tax reform, changes in statutory rates, or changes in tax laws or the interpretation thereof.
In addition, notwithstanding the reduction in the corporate income tax rate included in the recently enacted comprehensive tax legislation commonly referred to as the Tax Cuts and Jobs Act (the 'Tax Act'), the overall impact of the Tax Act on our future financial results is subject to uncertainties and our financial results could be adversely impacted by certain other aspects of the Tax Act, including one-time taxes on accumulated offshore earnings, requiring a current inclusion in U.S. federal income of certain earnings of controlled foreign corporations, allowing a domestic corporation an immediate deduction in U.S. taxable income for a portion of its foreign-derived intangible income, and the base erosion anti-abuse tax.
These factors could result in our 2018 provisional income tax expense booking rate to differ from our expectations.
These variables resulted in some of our customers exhibiting a reduced level of business activity and confidence.
In 2017, these conditions mostly reversed.
Certain commodity prices recovered and corporate investment improved, leading to better capital spending trends among our customers.
This improvement in customer spending helped to improve our net sales and sales growth.
to deteriorate, or by negatively impacting customers in certain industries, which could cause our sales to those customers to decline.
New trade policies could have an adverse impact on industries we sell into, negatively affecting our net sales and profits.
Considerable political uncertainty in the United States may result in changes to trade policies that could create disruption in geographic demand trends.
To the extent that the United States government enacts tariffs or taxes that penalize imports to benefit domestic manufacturing, we may improve our domestic sales which may have an overall positive impact on us given that 88% of our total revenue is derived from the United States.
However, any such action may adversely impact our foreign sales, which may, in turn, adversely impact our ability to expand our overseas branches in the future.
In addition, should a foreign government engage in its own trade protection, independent of or in response to another nation's action, it could have a negative direct or, more likely, indirect effect on our net sales and profits by reducing demand for exports by United States companies.
It is difficult to know in advance what the net effect of such actions will be on companies such as ours, but it is possible that such changes could adversely affect our financial results.
In August and September 2017, we experienced temporary disruptions in our distribution network in our Gulf Coast, Florida, Georgia, and Puerto Rico regions due to hurricanes Harvey, Irma, and Maria.
These storms adversely impacted our product demand and revenues, as well as our gross and operating profit percentages, due to an increase in demand for storm-related products which have a lower gross profit margin, and inefficiencies in delivery services in the immediate aftermath of the storms.
We believe we have a significant opportunity for growth based on our belief that North American market demand for the products we sell is estimated to exceed $140 billion.
This figure is not derived from an independent organization or data source that aggregates and publishes widely agreed-upon demand and market share statistics.
Also, as noted below, our strategy of growing our pre-tax profit margin by increasing our average annual sales per store has contributed to a drop in our gross profit percentage due to resulting changes in our customer mix.
During 2016 and 2015, our gross profit continued to be adversely impacted by changes in customer and product mix.
The decrease in 2015 was amplified by a reduction in our customers' discretionary spending in the fourth quarter.
Our 'pathway-to-profit' strategy, the goal of which is to improve our pre-tax profit margins by growing the average annual sales of our stores, may prove unsuccessful on a long-term basis.
In April 2007, we introduced our 'pathway-to-profit' strategy.
That strategy involved slowing our annual new store openings and investing the funds saved by opening fewer stores in additional sales and sales leadership personnel.
Under the 'pathway-to-profit' strategy, our goal is to increase our average annual sales per store, which would allow us to capture earnings leverage (by spreading operating and administrative expenses over higher sales) and grow our pre-tax profit margin.
Our gross profit margin generally decreases as our average per store sales increase, as larger stores sell to larger customers whose more focused buying patterns merit more competitive pricing.
However, our operating and administrative expenses, expressed as a percentage of net sales, typically improve as average per store sales grow.
In most years the net effect is an increase in our pre-tax profit margin, as the relative improvement in operating and administrative expenses offsets the decrease in gross profit margin.
A downturn in the economy or in the principle markets served by us or difficulty in attracting and retaining qualified sales and sales leadership personnel could adversely impact our ability to continue to grow our average per store sales.
In addition, greater than expected decreases in our gross profit margin resulting from changes in customer mix or other factors noted above, or the failure to control operating and administrative expenses to the degree necessary to offset expected decreases in our gross profit margin, could adversely impact our pre-tax profit margin even as average per store sales increase.
product depth, and in North America, our distribution strength.
While these machines, software, and services can be obtained from other sources, loss of our current suppliers or difficulties transitioning our industrial vending hosting services could be disruptive.
data held or accessed by third parties may be compromised.
regulations, domestic government regulations, political unrest, war, disruption or delays in shipments, changes in local economic conditions, or trade issues.
Our strategies to grow our business include the opening of stores in new and existing markets and the expansion of our industrial vending business and Onsite locations.
We currently estimate there is potential market opportunity in North America to support approximately 3,500 stores and that the potential market opportunity for industrial vending is approximately 1.7 million machines.
In particular, while we estimate we have the potential in North America for approximately
1,000 more stores than we have today, we have slowed our store openings in recent years and have focused instead on other growth drivers of our business.
An excerpt. Shown here: 40 of 47 rewritten, 40 of 51 added and all 20 removed. The counts are complete. For every sentence, read Item 1A. RISK FACTORS in the FY2017 filing and the FY2016 filing.
Item 7. MANAGEMENT'S DISCUSSION AND ANALYSIS OF FINANCIAL CONDITION AND RESULTS OF OPERATIONS
165 rewritten, 210 added, 408 removed, 172 unchanged
The following is management's discussion and analysis of certain significant factors [removed: that] [added: which] have affected our financial position and operating results during the periods included in the accompanying consolidated financial statements.
We distribute these supplies through a network of approximately [removed: 2,500 company owned stores.][added: 3,000 in-market locations.]
Geographically, our [removed: stores] [added: branches] and customers are primarily located in North America.
The table below summarizes our [removed: store] [added: in-market location] employee count and our total employee count at the end of the periods [removed: presented.][added: presented, and changes in that count from the end of the prior periods to the end of the most recent period.]
The final [removed: three] [added: four] items below summarize our [added: cumulative] investments in [removed: industrial vending machines,] [added: branch locations,] Onsite locations, [added: total in-market locations,] and [removed: store locations.][added: industrial vending devices.]
| | Q4 [removed: 2015] [added: 2017] | | | Q4 2016 | | | Twelve-month % Change | |
| End of period total [removed: store] [added: in-market locations (1) -] employee count | [removed: 13,961] [added: 13,424] | | | 12,966 | | | [removed: \-7.1] [added: 3.5] | % |
| End of period total employee count | [removed: 20,746] [added: 20,565] | | | 19,624 | | | [removed: \-5.4] [added: 4.8] | % |
| Industrial vending [removed: machines] [added: devices] (installed [removed: device] count) [added: (2)] | [removed: 55,510] [added: 71,421] | | | 62,822 | | [removed: (1)] | [removed: 13.2] [added: 13.7] | % |
| Number of active Onsite locations | [removed: 264] [added: 605] | | | 401 | | | [removed: 51.9] [added: 50.9] | % |
[removed: (1)] During the last twelve months, we [removed: have reduced] [added: increased] our headcount by [removed: 995] [added: 458] people in our [removed: stores] [added: in-market locations] and [removed: 1,122] [added: 941] people in total.
Our [removed: store] [added: branch] network forms the foundation of our business strategy, and we will continue to open [removed: stores in 2017] [added: or close branches] as is deemed necessary to sustain and improve our network and support our growth drivers.
[removed: (4)] We [removed: continue to see a very strong pace of] [added: signed 168 new] national account [removed: signings] [added: contracts] (defined as new customer accounts with a multi-site contract).
| | [removed: 2016] | [removed: | | 2015] [added: 2017] | | | 2016 | | | 2015 | |
| | [removed: |] Q1 | | [added: |] Q2 | | [added: |] Q3 | | [added: |] Q4 | | [added: |] Annual | |
[removed: We believe in efficient markets – to] [added: To] us, this means we can grow our market share if we provide the greatest value to our [removed: customers.][added: customer.]
We believe our ability to grow is amplified if we can [removed: service] [added: serve] our customers at the closest economic point of contact.
[removed: For us, this 'closest economic point of contact' is the local store or the customer's facility; therefore,] [added: Therefore,] our focus centers on understanding our customers' day, their opportunities, and their obstacles.
The concept of growth is [removed: simple,] [added: simple:] find more customers every day and increase our activity with them.
Third, we have a great team behind [removed: the store] [added: our customer-facing resources] to operate efficiently and to help identify new business solutions.
[removed: Finally,] [added: Fourth,] we strive to generate strong [removed: profits; these profits] [added: profits, which] produce the cash flow necessary to fund our growth and to support the needs of our customers.
| | [removed: 2016 |] [added: 2017] | | | [removed: 2015] [added: 2016] | | | [removed: 2014] [added: 2015] | |
| Percentage change | [removed: 2.4 |] [added: 10.8] | % | | [removed: 3.6] [added: 2.4] | % | | [removed: 12.2] [added: 3.6] | % |
| Business days | [removed: 255 |] [added: 254] | | | [removed: 254] [added: 255] | | | [removed: 253] [added: 254] | |
| Percentage change | [removed: 2.0 |] [added: 11.3] | % | | [removed: 3.2] [added: 2.0] | % | | [removed: 12.7] [added: 3.2] | % |
| Impact of currency fluctuations [removed: (primarily Canada)] | [removed: \-0.4 |] [added: 0.1] | % | | [removed: \-1.2] [added: \-0.4] | % | | [removed: \-0.5] [added: \-1.2] | % |
| [removed: Impact] [added: Daily sales impact] of acquisitions | [removed: 0.6 |] [added: 1.0] | % | | [removed: 0.2] [added: 0.6] | % | | 0.2 | % |
The [removed: increase] [added: increases] in net sales in [added: the periods noted above for 2017,] 2016, [removed: 2015,] and [removed: 2014 came] [added: 2015 were driven] primarily [removed: from] [added: by] higher unit sales.
Net sales [added: in 2016 and 2015] were also impacted by slight inflationary price changes in our non-fastener products and some price deflation in our fastener products, with the net impact being a slight drag on growth.
| | [removed: 2016] [added: 2017] | | [removed: 2015] [added: 2016] | | [removed: 2014] [added: 2015] |
[removed: Over time, this] has led to faster growth in the non-fastener product lines, a trend amplified by the growth of our industrial vending program through which we sell primarily non-fastener products.
We believe this factor [added: impacted each year shown and] will continue to promote a lower mix of fasteners in our total sales over time.
Second, a weak industrial production environment, [removed: such as was experienced in 2015 and 2016,] has a disproportionately negative effect on fastener sales relative to non-fastener sales (which relates more to plant operations than production).
This weakness is more [added: of a] cyclical [added: factor] than [removed: secular,] [added: a structural one,] and [removed: it is possible that] [added: as such was relevant in 2015 and 2016, but not in 2017 when] a better economic environment [removed: could] at least partially [removed: mitigate] [added: mitigated] the first factor discussed.
[removed: MONTHLY SALES CHANGES, SEQUENTIAL TRENDS, AND END MARKET PERFORMANCE][added: Annual Sales Changes, Sequential Trends, and End Market Performance]
This section focuses on three distinct views of our business – [removed: monthly] [added: annual] sales [removed: changes,] [added: changes by month,] sequential trends, and end market performance.
The first discussion regarding [removed: monthly] sales changes [added: by month] provides a good mechanical view of our [removed: business based on the age of our stores.][added: business.]
[removed: Monthly] [added: Annual] Sales [removed: Changes:][added: Changes, by Month]
[removed: All company sales –] During the months noted below, all of our selling locations, when combined, had daily sales growth rates of (compared to the same month in the preceding year):
During 2015, our business [removed: weakened.][added: weakened compared to 2014.]
It is helpful to appreciate several aspects of our marketplace: (1) It's big, the North American marketplace for industrial supplies is estimated to be in excess of $140 billion per year (and we have expanded beyond North America) and no company has a significant portion of this market.
(2) Many of the products we sell are individually inexpensive, but the cost and time to manage, procure, and transport these products can be quite meaningful.
(3) Purchasing professionals often expend disproportionate effort managing the high SKU count of low-volume, low value MRO supplies which is better allocated to their higher volume, higher value OEM supplies.
(4) Many customers prefer to reduce their number of suppliers to simplify their business, while also utilizing various technologies and models (including our local branches when they need something quickly or unexpectedly) to improve availability and reduce waste.
(5) We believe the markets are efficient.
Our approach to addressing these aspects of our marketplace is captured in our motto Growth through Customer Service.
Lastly, we identify drivers that allow us to get closer to our customers and gain market share.
At one point, the closest economic point of contact was the local branch.
Today, in some cases, we have moved the branch inside the customer's facility.
We also are frequently positioned right at the point of consumption within customers' facilities through our industrial vending or FMI capabilities.
By doing these things every day, Fastenal remains a growth-centric organization.
Executive Overview
Net sales increased $428.5, or 10.8%, in 2017 relative to 2016.
Our gross profit as a percentage of net sales declined to 49.3% in 2017 from 49.6% in 2016.
Our operating income as a percentage of net sales in 2017 was comparable to 2016 at 20.1% in both years.
We recorded a provisional income tax expense of $294.5 in 2017, or 33.7% of earnings before income taxes.
This amount reflects an estimated reduction in our deferred income tax liabilities of $30.8 as a result of the income tax rate decrease included in the Tax Act, offset by an estimated increase in income tax payable in the amount of $6.5 as a result of the transition tax on cash and cash equivalent balances related to accumulated earnings associated with our international operations, also included in the Tax Act.
Absent the impact of the Tax Act, our income tax expense for 2017 would have been approximately $318.8, or 36.5% of earnings before income taxes.
Income tax expense was $290.3 in 2016, or 36.8% of earnings before income taxes.
Our net earnings in 2017 were $578.6, an increase of 15.8% when compared to 2016.
Our diluted net earnings per share were $2.01 in 2017 compared to $1.73 in 2016.
If we excluded the discrete items that benefited our income tax rate in the fourth quarter of 2017 (primarily related to the impact of the Tax Act), our net earnings in the period would have been approximately $554.2, an increase of 11.0% when compared to 2016, and our diluted net earnings per share would have been $1.92.
Additionally, we signed 270 new Onsite customer locations (defined as dedicated sales and service provided from within, or in close proximity to, the customer's facility) and 19,355 new industrial vending devices.
| Number of public branch locations | 2,383 | | | 2,503 | | | \-4.8 | % |
| Number of in-market locations (1) | 2,988 | | | 2,904 | | | 2.9 | % |
| Ratio of industrial vending devices to in-market locations | 24:1 | | | 22:1 | | | | |
(1) 'In-market locations' is defined as the sum of the total number of public branch locations and the total number of active Onsite locations.
(2) This number represents devices which principally dispense product and produce product revenues, and excludes approximately 15,000 devices which are principally used for the check-in/check-out of equipment.
Our total headcount at the end of 2017 includes 127 people related to our Mansco acquisition.
The remaining increase is mostly a function of additions we have made to support customer growth in the field as well as investments in our growth drivers.
We opened 18 branches and closed 130 branches in 2017.
Additionally, eight branches were converted from public branches to non-public locations.
Results of Operations
Net Sales
The table below sets forth net sales and daily sales for the periods ended December 31, and changes in such sales from the prior period to the more recent period:
| Net sales | 4,390.5 | | | 3,962.0 | | | 3,869.2 | |
| Daily sales | 17.3 | | | 15.5 | | | 15.2 | |
Price was not a material factor in the periods presented.
The higher unit sales in 2017 resulted primarily from two sources.
The first is improvement in underlying market demand.
(Dollar amounts are in thousands except for per share amounts and where otherwise noted.)
BUSINESS DISCUSSION
We are a growth-centric organization focused on identifying 'drivers' that will allow us to get closer to our customers and gain market share in what we believe remains a fragmented industrial distribution market.
Our current growth drivers will be discussed throughout this report.
Our growth drivers have evolved, and can be expected to continue to evolve, over time.
However, what has always been true, and what we expect to remain true, is the key to the success of any of our growth drivers is our employees and the services they provide to our customers in the field.
Later in this document we discuss the average full-time equivalent ('FTE') headcount to help explain the expense trends in more detail.
| | | | | | | | | |
| --- | --- | --- | --- | --- | --- | --- | --- | --- |
| Change in total store employee count | | | | (995 | ) | | | |
| Change in total employee count | | | | (1,122 | ) | | | |
| Number of store locations | 2,622 | | | 2,503 | | | \-4.5 | % |
(1) In February 2016, we signed an agreement to lease a significant number of industrial vending lockers to one of our customers.
As of December 31, 2016, we have deployed approximately 15,000 devices under this agreement.
These devices do not generate product revenue and are excluded from the count noted above.
Several items worth noting with respect to our results:
These reductions can be primarily attributed to natural attrition rather than an active headcount reduction program.
We continue to add headcount where necessary to support our growth initiatives, notably our Onsite business (defined as dedicated sales and service provided from within the customer's facility).
However, the continued softness of the North American industrial economy has caused us to more intensively scrutinize our full- and part-time staffing levels outside of these initiatives.
Indeed, after increasing our total headcount every quarter during 2015, it has declined during every quarter of 2016.
Our current staffing levels approximate those at the end of 2014.
(2) We opened 40 and 41 stores in 2016 and 2015, respectively.
(3) We closed or consolidated 144 stores in 2016; about 90% of these stores were in close proximity to another Fastenal store, and about 85% had leases expiring within 18 months.
We closed or consolidated 50 stores in 2015; about 80% of these stores were in close proximity to another Fastenal store, and about 90% had leases expiring within 18 months.
The store closings did not have a meaningful impact on sales in either period.
We intend to continue evaluating markets for closures and consolidations in 2017 as part of our ongoing efforts to optimize our store network.
In 2016 and 2015, we signed 190 and 167 new contracts, respectively.
Beyond signings (or growth activities), we look at the health of our large customer market, and by extension our overall market, by watching the trends of our top 100 customers (which represented approximately 26% of our sales in 2016).
For several years beginning in 2011, the typical ratio of growth versus contraction in the sales of our top 100 customers was 3:1 (75 grew and 25 contracted).
That performance has weakened in recent periods, more typically approximating 1:1 since the fourth quarter of 2015, including the fourth quarter of 2016 when 51 customers grew (33 with growth of 10% or more) and 49 customers contracted (31 with contraction of 10% or more).
(5) We have continued to expand our Onsite business.
Our goal was to sign 200 Onsite customer locations in 2016, and we signed 176; 130 were operational as of December 31, 2016.
All of the 80 Onsite customer locations we signed in 2015 were operational by the end of the second quarter of 2016.
(6) We have converted most of our United States stores, approximately 2,000, to the CSP 16 (Customer Service Project 2016) format as of December 31, 2016.
This merchandising footprint involves expanded inventory placement at our store locations to enhance same-day capabilities.
At the end of the fourth quarter of 2016, our inventory of CSP 16 items at our stores was $42 million higher than the level at the end of the fourth quarter of 2015 (including inventory at our distribution centers, this value was $46 million higher).
From the end of the third quarter of 2015, before we began this initiative, to the end of the fourth quarter of 2016, our inventory of CSP 16 items at our stores increased by $50 million (or $54 million when including inventory at our distribution centers).
The following sections contain an overview of the following:
| | |
| --- | --- |
An excerpt. Shown here: 40 of 165 rewritten, 40 of 210 added and 40 of 408 removed. The counts are complete. For every sentence, read Item 7. MANAGEMENT'S DISCUSSION AND ANALYSIS OF FINANCIAL CONDITION AND RESULTS OF OPERATIONS in the FY2017 filing and the FY2016 filing.
Item 7A. QUANTITATIVE AND QUALITATIVE DISCLOSURES ABOUT MARKET RISKS
4 rewritten, 1 added, 0 removed, 15 unchanged
During the first half of 2016, we experienced some deflation in steel [removed: prices.][added: pricing.]
In [removed: 2015 and 2014,] [added: 2015,] we noted some overall deflation in steel pricing.
A [removed: 1%] [added: one percentage point] increase in LIBOR in [removed: 2016] [added: 2017] would have resulted in approximately [removed: $3.9 million] [added: $2.8] of additional interest expense.
A description of our Credit Facility is contained in Note [removed: 9] [added: 10] of the Notes to Consolidated Financial Statements.
During 2017, we experienced some inflation in overall steel pricing.
Item 1. BUSINESS
76 rewritten, 157 added, 88 removed, 67 unchanged
The year end is December 31, [removed: 2016] [added: 2017] unless additional years are included or noted.
Fastenal Company (together with our subsidiaries, hereinafter referred to as 'Fastenal' or the [removed: 'Company'] [added: company] or by terms such as we, our, or us) began as a partnership in 1967, and was incorporated under the laws of Minnesota in 1968.
We opened our first [removed: store] [added: branch] in 1967 in Winona, Minnesota, a city with a population today of approximately 27,000.
The large majority of our transactions are business-to-business, though we also have some [removed: 'walk-in'] [added: walk-in] retail business.
At the end of [removed: 2016,] [added: 2017,] we had [removed: 2,503 store] [added: 2,988 in-market] locations [added: (defined] in [removed: 21] [added: the table below) in 24] countries supported by 14 distribution centers in North America [removed: (eleven] [added: (11] in the United States, two in Canada, and one in Mexico), and we employed [removed: 19,624] [added: 20,565] people.
We believe our success can be attributed to our ability to offer [removed: our] customers a full line of [removed: products and services from] [added: quality products, our] convenient [removed: locations, as well as to] [added: locations and diverse methods of providing those products, and] the [removed: high quality] [added: superior service orientation and expertise] of our employees.
The following table shows our consolidated net sales for each fiscal year [removed: during the last ten years and] [added: as well as] the number of [removed: our store] [added: public branches, Onsite locations, and total in-market] locations at the end of each of the last ten years:
| | [added: 2017 | | |] 2016 | | 2015 | | 2014 | | 2013 | | 2012 | | 2011 | | 2010 | | 2009 | | 2008 | | [removed: 2007 |]
| Net sales [removed: (in millions)] | [removed: $3,962.0] [added: $] | [added: 4,390.5] | [added: | 3,962.0 | |] 3,869.2 | | 3,733.5 | | 3,326.1 | | 3,133.6 | | 2,766.9 | | 2,269.5 | | 1,930.3 | | 2,340.4 | | [removed: 2,061.8 |]
| [removed: Number of stores] [added: Public branches] | [added: 2,383 | | |] 2,503 | | 2,622 | | 2,637 | | 2,687 | | 2,652 | | 2,585 | | 2,490 | | 2,369 | | 2,311 | | [removed: 2,160 |]
The following table provides a summary of the [removed: store] [added: traditional, overseas, and strategic account branch] locations we operated at the end of each year, as well as the [removed: store] openings, closings, and conversions during each year:
| Closed [removed: stores] [added: branches] | (140 | ) | (3 | ) | — | | — | | (143 | ) | | (1 | ) | — | | — | | — | | — | | (144 | ) |
(4) The Netherlands, Hungary, United Kingdom, Germany, Czech Republic, Italy, Romania, Poland, [added: Sweden, Ireland,] and [removed: Sweden][added: Switzerland]
(6) Converted [removed: stores] [added: locations] are sites converted from [removed: stores] [added: traditional branches] to [removed: non-store selling] [added: Onsite locations or non-in-market] locations, net of sites converted from [removed: non-store selling] [added: non-in-market] locations [added: or Onsite locations] to [removed: stores.][added: traditional branches.]
[removed: Our stores represent the foundation of] [added: In] our [removed: service approach, putting us close] [added: view, this has proved] to [removed: the customer and providing] [added: be] an efficient means of providing [removed: them] [added: customers] with a broad range of products and services on a timely basis.
[removed: We select these new] [added: Branch] locations [added: are selected primarily] based on their proximity to our distribution network, population statistics, and employment data for manufacturing and non-residential [removed: construction.][added: construction companies.]
We stock all new [removed: stores] [added: branches] with inventory drawn from all of our product lines, and over time, [added: where appropriate,] our district and [removed: store] [added: branch] personnel may tailor the inventory offering to the needs of the local customer base.
[removed: Because traditional,] [added: Traditional,] overseas, and strategic account [removed: stores] [added: branches] sell to multiple customers, [removed: they are included in] [added: and together comprise] our total [removed: store] [added: branch] count.
[removed: We have long] maintained that marketplace demographics could support a North American network of 3,500 [removed: stores.][added: traditional branches.]
[removed: We] [added: As a result, we] have [removed: also] identified over 15,000 customer locations with potential to implement the Onsite service model.
We remain committed to a large, robust [removed: store network;] [added: service network, including traditional branches;] it remains the indispensable foundation of our business.
[removed: The selling] [added: Selling] locations outside of the United States [added: and Canada] contributed approximately [removed: 12%] [added: 7%] of our consolidated net sales in [removed: 2016,] [added: 2017,] with approximately [removed: 49%] [added: 4%] and [removed: 30%] [added: 3%] of this amount attributable to our [removed: Canadian and] Mexican [added: and 'rest-of-world'] operations, respectively.
It has been our experience that our profitability is affected by the [removed: age of our store base.][added: average revenue produced by each branch.]
We introduced [removed: our] industrial vending [removed: offering] in 2008.
[removed: However, we] [added: We] believe [removed: it] [added: vending] has proven its effectiveness in strengthening our relationships with customers and helped to streamline the supply chain where it has been utilized.
We also believe there remains considerable room [removed: between] [added: to grow] our current installed base [removed: and] [added: before it begins to approach] the [removed: potential installed base] [added: number] of [added: units we believe] the [removed: market.][added: market can support.]
We operate [removed: eleven] [added: 11] regional distribution centers in the United States – Minnesota, Indiana, Ohio, Pennsylvania, Texas, Georgia, Washington, California, Utah, North Carolina, and [removed: Kansas,] [added: Kansas –] and three outside the United States – Ontario, Canada; Alberta, Canada; and Nuevo Leon, Mexico.
These distribution centers are located so as to permit deliveries of two to five times per week to our [removed: stores] [added: in-market locations] using our trucks and overnight delivery by surface common [removed: carrier.][added: carrier, with approximately 83% of our North American in-market locations receiving service four to five times per week.]
The distribution [removed: centers] [added: center] in Indiana [removed: and California] also [removed: serve] [added: serves] as a 'master' [removed: hub] [added: hub, with those in California, North Carolina, and Kansas serving as 'secondary' hubs] to support the needs of the [removed: stores] [added: in-market locations] in their geographic [removed: region] [added: regions] as well as provide a broader selection of products for the [removed: stores] [added: in-market locations] serviced by the other distribution centers.
We currently operate our Minnesota, Indiana, Ohio, Pennsylvania, Texas, Georgia, California, North Carolina, and Ontario, Canada distribution centers with automated storage and retrieval systems [removed: or 'ASRS'.][added: (ASRS).]
We conduct business under various trademarks and service marks, and we utilize a variety of designs and tag lines in connection with each of these marks, including [removed: First In Fasteners®.][added: Growth Through Customer Service®.]
This [removed: product line, which we refer to as the fastener product line, consists of two broad categories:] [added: includes] threaded fasteners, [removed: such as] [added: which represent approximately 85% of total fastener sales and includes] bolts, nuts, screws, studs, and related [removed: washers; and] [added: washers, as well as] miscellaneous supplies and hardware, such as [removed: various pins and] [added: pins,] machinery keys, concrete anchors, metal framing systems, wire rope, strut, rivets, and related accessories.
[removed: Threaded] [added: Of this, threaded] fasteners [removed: accounted for approximately 90% of the fastener product line sales in 2016, 2015, and 2014 and] [added: represented] approximately [added: 30%,] 33%, [removed: 34%,] and [removed: 36%] [added: 34%] of our consolidated [added: net] sales in [added: 2017,] 2016, [removed: 2015,] and [removed: 2014,] [added: 2015,] respectively.
The most significant [added: category] of [removed: these] [added: non-fastener products] is our safety supplies product line, which accounted for [removed: approximately 15%, 14%,] [added: 15.2%, 14.9%,] and [removed: 13%] [added: 13.9%] of our [added: consolidated] sales in [added: 2017,] 2016, [removed: 2015,] and [removed: 2014,] [added: 2015,] respectively.
Detailed information about our sales by product line is provided in Note [removed: 10] [added: 12] of the Notes to Consolidated Financial Statements included later in this Form 10-K.
[removed: During] [added: Also, in] the last several [removed: years,] [added: years] we [removed: have] added 'private label' brands [removed: (we often refer] [added: (often referred] to [removed: these] as 'Fastenal brands') to our [removed: offering.][added: offering, and these represented approximately 12% of our consolidated net sales in 2017, 2016, and 2015.]
We plan to continue to add other [removed: products] [added: product lines] in the future.
Our inventory stocking levels are determined using our computer systems, [added: by] our sales personnel at [removed: the store, district,] [added: in-market locations, by our district] and [removed: region levels,] [added: regional leadership,] and [added: by] our product managers.
It is also derived from [removed: vendor] [added: supplier] information and from customer demographic information.
[removed: The computer system monitors the inventory] level for all stock items and triggers replenishment, or prompts a buyer to purchase, as necessary, based on an established minimum-maximum level.
| | | | | | | | | | | | | | | | | | | | | | |
| --- | --- | --- | --- | --- | --- | --- | --- | --- | --- | --- | --- | --- | --- | --- | --- | --- | --- | --- | --- | --- | --- |
| | | | | | | | | | | | | | | | | | | | | | |
| Onsite locations(1) | 605 | | | 401 | | 264 | | 214 | | | | | | | | | | | | | |
| Total in-market locations(2) | 2,988 | | | 2,904 | | 2,886 | | 2,851 | | 2,687 | | 2,652 | | 2,585 | | 2,490 | | 2,369 | | 2,311 | |
(1) Onsite location information prior to 2014 is intentionally omitted.
While such locations have existed since 1992, we did not specifically track their number until we identified our Onsite program as a growth driver in 2014.
(2) 'In-market locations' is defined as the sum of the total number of public branches and the total number of Onsite locations.
One of Fastenal's guiding principles since inception is that we can improve our service by getting closer to the customer.
Through much of our history, this was achieved by opening branches, and today we believe there are few companies that offer our North American branch coverage.
These branches have represented, and continue to represent, the foundation of our service approach.
However, we are constantly evaluating the efficacy of our branch network, and in recent years, we have developed additional models that get us still closer to the customer, including vending, bin stocks, and Onsite locations.
We currently have several versions of selling locations: (1) a 'traditional (or public) branch' services a wide variety of customers and stocks a wide selection of products we offer, (2) an 'overseas branch' focuses on manufacturing customers and our fastener product line and is the format we typically deploy outside the United States and Canada, (3) a 'strategic account branch' is a unique location that sells to multiple large accounts in a market, (4) a 'strategic account site' is similar to a strategic account branch, but typically operates out of an existing branch rather than from a unique location, and (5) an 'Onsite location' (defined as dedicated sales and service provided from within, or in close proximity to the customer's facility).
Our strategic account sites are considered an extension of the branch from which it operates, and are not included separately in our total branch counts.
Onsite locations, which serve a single customer, are similarly not included in our total branch counts.
However, outside of the fact that they serve a single customer, we believe the function and operation of an Onsite location is similar to that of a branch.
This model is also beginning to represent a meaningful portion of the company's total revenue, and we expect that share to grow materially over time.
As a result, we have begun to refer to our network in terms of in-market locations, which includes our total branches and Onsite locations, and we began to refer to strategic account sites as non-in-market locations.
Since Fastenal's founding and through 2013, branch openings were a primary growth driver for the company, and we experienced net openings each year over that time span.
We have long
However, since establishing this figure, new growth drivers and business models (Onsite, vending, e-commerce) have emerged and diminished the direct role of traditional branch openings in our growth.
It is now unlikely that we will operate the total traditional branch locations we previously believed would be the potential of North America.
We will continue to open traditional branches as the company sees fit.
However, in each year since 2013, the company has experienced a net decline in its total branch count including net declines of 15 branches in 2015, 119 branches in 2016, and 120 branches in 2017.
There is one branch subset, overseas, that we anticipate expanding in the future.
| Opened branches | 27 | | 3 | | 5 | | — | | 35 | | | — | | — | | — | | 4 | | 1 | | 40 | |
| Converted branches(6) | (13 | ) | (2 | ) | — | | — | | (15 | ) | | — | | — | | — | | — | | — | | (15 | ) |
| Opened branches | 5 | | 3 | | 2 | | — | | 10 | | | 1 | | — | | — | | 7 | | — | | 18 | |
| Closed branches | (118 | ) | (6 | ) | (1 | ) | — | | (125 | ) | | (2 | ) | (2 | ) | — | | (1 | ) | — | | (130 | ) |
| Converted branches(6) | (5 | ) | — | | — | | — | | (5 | ) | | (1 | ) | (1 | ) | — | | (1 | ) | — | | (8 | ) |
| Total as of December 31, 2017 | 2,076 | | 195 | | 53 | | 8 | | 2,332 | | | 6 | | 7 | | 7 | | 29 | | 2 | | 2,383 | |
(2) China
Onsite locations may influence the trend in total branch count over time.
In this model, the company services a customer from a location that is physically within the customer's facility (or, in some cases, at a strategically placed off-site location), with inventory that is specific to the customer's needs.
The model is best suited to larger companies, though we believe we can provide a higher degree of service at a lower level of revenue than most of our competitors.
In most cases, we are shifting revenue with the customer from an existing branch.
It has been our experience, however, that while gross profit margins at Onsite locations tend to be lower than at branches, we gain significant revenue with the customer and our cost to serve is materially lower.
The Onsite concept is not new, in that we entered into the first such arrangement in 1992.
However, the company identified it as a growth driver in 2014 and made substantial investments toward accelerating its traction in the marketplace beginning in 2015.
These customers include those where we have a national account relationship today, as well as new customers we know of due to our local market presence.
| | | | | | | | | | | | | | | | | | | | |
| --- | --- | --- | --- | --- | --- | --- | --- | --- | --- | --- | --- | --- | --- | --- | --- | --- | --- | --- | --- |
| Total as of December 31, 2014 | 2,336 | | 202 | | 44 | | 8 | | 2,590 | | | 9 | | 10 | | 7 | | 20 | | 1 | | 2,637 | |
| Opened stores | 32 | | 4 | | 3 | | — | | 39 | | | 1 | | 1 | | — | | — | | — | | 41 | |
| Closed stores | (44 | ) | (4 | ) | — | | — | | (48 | ) | | (1 | ) | (1 | ) | — | | — | | — | | (50 | ) |
| Converted stores(6) | (4 | ) | (2 | ) | — | | — | | (6 | ) | | — | | — | | — | | — | | — | | (6 | ) |
| Opened stores | 27 | | 3 | | 5 | | — | | 35 | | | — | | — | | — | | 4 | | 1 | | 40 | |
| Converted stores(6) | (13 | ) | (2 | ) | — | | — | | (15 | ) | | — | | — | | — | | — | | — | | (15 | ) |
(2) China and India
We believe there are few companies that offer our store coverage on a national basis.
We are constantly evaluating the efficacy of our store network.
There are times when this leads us to open new locations.
In both 2016 and 2015, we opened new stores at a rate of approximately 2%.
Our store network evaluations also reveal locations that are candidates for closure, consolidation, or conversion, as was the case in 2016 and 2015.
This resulted in a net decrease in store locations in each of the last two years.
We currently have several versions of selling locations.
(1) A 'traditional store' services a wide variety of customers and stocks a wide selection of the products we offer.
(2) An 'overseas store' focuses on manufacturing customers and our fastener product line and is the format we typically deploy outside the United States and Canada.
(3) A 'strategic account store' is a unique location that sells to multiple large accounts in a market.
(4) A 'strategic account site' is similar to a strategic account store, but typically operates out of an existing store rather than from a unique location.
(5) An 'Onsite location' is a selling unit located in or near a customer's facility that sells product solely to that customer.
Neither strategic account sites nor Onsite locations are included in our total store count because strategic account sites operate from an existing store location and Onsite locations represent a customer subset of an existing store location.
We continue to believe this, but since establishing this figure our strategy has changed.
Store openings, at least in their historical sense (the 'traditional store'), are no longer our primary growth driver.
At this point, the emergence of, and increased investment in, new growth drivers and business models make it unlikely that we will approach the total store potential of North America.
These new growth drivers include industrial vending, Onsite locations, and end market growth investments (CSP 16, for example), as well as the investment in sales personnel (both store and non-store) to support them.
These represent alternative means to address the requirements of certain customer groups.
They also get us even closer to our customers than the traditional store, which has always been core to Fastenal’s strategy and an effective means of providing differentiated and 'sticky' service that is very difficult for large and small competitors to replicate.
These growth drivers appear to have substantial market opportunities of their own.
For instance, we believe the market could support approximately 1.7 million industrial vending machines.
Still, our store count peaked in 2013 and has declined in each of the three years since, and more often than not going forward, it will likely be difficult to know if our total store count will increase or decrease in any given year.
In contrast, we expect to grow our installed base of industrial vending machines and increase our Onsite locations meaningfully over time.
We plan to open additional selling locations outside of the United States in the future.
New stores tend to be less profitable due to start-up costs and the time necessary to generate a customer base.
A new store generates most of its sales from direct sales calls, a slow process involving repeated contacts.
As a result of this process, sales volume builds slowly and it typically requires at least ten to twelve months for a new store to achieve its first profitable month.
To illustrate, of the 17 stores opened in the first quarter of 2016, nine were profitable in the fourth quarter of 2016.
It has also been our experience that when these new stores mature and increase their sales base, their profitability similarly increases.
The data in the following table shows the change in the average sales of our stores from 2015 to 2016 based on the age of each store.
The stores opened in 2016 contributed approximately $14,900 (or approximately 0.4%) of our consolidated net sales in 2016, with the remainder coming from stores opened prior to 2016 or from our non-store business.
An excerpt. Shown here: 40 of 76 rewritten, 40 of 157 added and 40 of 88 removed. The counts are complete. For every sentence, read Item 1. BUSINESS in the FY2017 filing and the FY2016 filing.
Item 3. LEGAL PROCEEDINGS
1 rewritten, 0 added, 0 removed, 2 unchanged
A description of our legal proceedings, if any, is contained in Note [removed: 9] [added: 11] of the Notes to Consolidated Financial Statements.
Cover and table of contents
33 rewritten, 8 added, 7 removed, 77 unchanged
| | For the fiscal year ended December 31, [removed: 2016,] [added: 2017] |
Indicate by check mark whether the registrant is a large accelerated filer, an accelerated filer, a non-accelerated filer, [removed: or] a smaller reporting [added: company, or an emerging growth] company.
See definition of [removed: “large] [added: "large] accelerated [removed: filer”, “accelerated filer”, and “smaller] [added: filer", "accelerated filer", "smaller] reporting [removed: company”] [added: company", and "emerging growth company"] in Rule 12b-2 of the Exchange Act.
The aggregate market value of the Common Stock held by non-affiliates of the registrant as of June 30, [removed: 2016,] [added: 2017,] the last business day of the registrant's most recently completed second fiscal quarter, was [removed: $12,778,423,898,] [added: $12,488,792,738,] based on the closing sale price of the Common Stock on that date.
For purposes of determining this number, all executive officers and directors of the registrant as of June 30, [removed: 2016] [added: 2017] are considered to be affiliates of the registrant.
As of January [removed: 20, 2017,] [added: 19, 2018,] the registrant had [removed: 289,247,424] [added: 287,603,912] shares of Common Stock issued and outstanding.
| Item 1. | | [removed: [Business](#s727A4515E3534508A5A0B42FEC0F2855)] [added: [Business](#s5726133DA9984B3664D91A8B513C4B5D)] | [removed: [3](#s727A4515E3534508A5A0B42FEC0F2855)] [added: [3](#s5726133DA9984B3664D91A8B513C4B5D)] |
| Item 1A. | | [Risk [removed: Factors](#sB98F886998EE35CD6ACCB42FEC5DC512)] [added: Factors](#s251FFD2EE50E466A65E21A8B51E83FD7)] | [removed: [9](#sB98F886998EE35CD6ACCB42FEC5DC512)] [added: [11](#s251FFD2EE50E466A65E21A8B51E83FD7)] |
| Item 1B. | | [Unresolved Staff [removed: Comments](#sA23C3FB3A91355666518B42FEC60B00B)] [added: Comments](#s8C5428F6898F8715CEA61A8B51E982C6)] | [removed: [14](#sA23C3FB3A91355666518B42FEC60B00B)] [added: [16](#s8C5428F6898F8715CEA61A8B51E982C6)] |
| Item 2. | | [removed: [Properties](#s9032E6752B09D65B6066B42FEC74336F)] [added: [Properties](#s07C42033B57E5F5A42FF1A8B51F03A57)] | [removed: [14](#s9032E6752B09D65B6066B42FEC74336F)] [added: [17](#s07C42033B57E5F5A42FF1A8B51F03A57)] |
| Item 3. | | [Legal [removed: Proceedings](#s0E3319FC6939F562B37FB42FECA6034B)] [added: Proceedings](#sCE93D0F9EFFBE4A655291A8B520E9AA0)] | [removed: [15](#s0E3319FC6939F562B37FB42FECA6034B)] [added: [18](#sCE93D0F9EFFBE4A655291A8B520E9AA0)] |
| Item 4. | | [Mine Safety [removed: Disclosures](#sB1D1E21603FD996F7DAFB42FECC7DC68)] [added: Disclosures](#sFA57A4D0C3AA16888CD91A8B52139289)] | [removed: [15](#sB1D1E21603FD996F7DAFB42FECC7DC68)] [added: [18](#sFA57A4D0C3AA16888CD91A8B52139289)] |
| Item 5. | | [Market for Registrant's Common Equity, Related Stockholder Matters, and Issuer Purchases of Equity [removed: Securities](#s59DA0C0DC077D0AE2F9FB42FCB883475)] [added: Securities](#s84E0A107A7E73C13E5861A8B498C2253)] | [removed: [16](#s59DA0C0DC077D0AE2F9FB42FCB883475)] [added: [19](#s84E0A107A7E73C13E5861A8B498C2253)] |
| Item 6. | | [Selected Financial [removed: Data](#s033176A95CEF98AD3A65B42FED76F2FA)] [added: Data](#sBA8FAEA72D472459C2A71A8B5289524C)] | [removed: [17](#s033176A95CEF98AD3A65B42FED76F2FA)] [added: [20](#sBA8FAEA72D472459C2A71A8B5289524C)] |
| Item 7. | | [Management's Discussion and Analysis of Financial Condition and Results of [removed: Operations](#s1BF4E6C2C6122B80FBE7B42FEDA01B73)] [added: Operations](#s41276F05A43684A5CCBA1A8B52AAD9CB)] | [removed: [18](#s1BF4E6C2C6122B80FBE7B42FEDA01B73)] [added: [21](#s41276F05A43684A5CCBA1A8B52AAD9CB)] |
| Item 7A. | | [Quantitative and Qualitative Disclosures About Market [removed: Risks](#sC884DAD7AFF389BCFBC0B42FEF3F5FCF)] [added: Risks](#s1E173806AC64043D0AE11A8B54D1095B)] | [removed: [38](#sC884DAD7AFF389BCFBC0B42FEF3F5FCF)] [added: [34](#s1E173806AC64043D0AE11A8B54D1095B)] |
| Item 8. | | [Financial Statements and Supplementary [removed: Data](#sC2890F670F208A6B450BB42FCB8860BA)] [added: Data](#s81CCB359570DF7210A491A8B498C2B11)] | [removed: [39](#sC2890F670F208A6B450BB42FCB8860BA)] [added: [35](#s81CCB359570DF7210A491A8B498C2B11)] |
| Item 9. | | [Changes in and Disagreements with Accountants on Accounting and Financial [removed: Disclosure](#sD350D7C7E68E26E9A1F6B42FF3922423)] [added: Disclosure](#sE4195182D81D4940583C1A8B593CD420)] | [removed: [57](#sD350D7C7E68E26E9A1F6B42FF3922423)] [added: [56](#sE4195182D81D4940583C1A8B593CD420)] |
| Item 9A. | | [Controls and [removed: Procedures](#sF585309E82356D720936B42FF39C0E79)] [added: Procedures](#sCCA9AE9415A91FBEC9FA1A8B595F1AA2)] | [removed: [57](#sF585309E82356D720936B42FF39C0E79)] [added: [56](#sCCA9AE9415A91FBEC9FA1A8B595F1AA2)] |
| Item 9B. | | [Other [removed: Information](#sB4FB3805F95D9976F80FB42FF3CFA3AC)] [added: Information](#s5426E46B207A29D94CDC1A8B5980E357)] | [removed: [58](#sB4FB3805F95D9976F80FB42FF3CFA3AC)] [added: [57](#s5426E46B207A29D94CDC1A8B5980E357)] |
| | | [PART [removed: III](#s4E93368FBC3C262DEEADB42FF3F90770)] [added: III](#s83C9D0D2C2B5825181EE1A8B59DE1764)] | |
| Item 10. | | [Directors, Executive Officers, and Corporate [removed: Governance](#s9AE8D7718A32C2DB336BB42FF4212C34)] [added: Governance](#s4B48ACF31C1BB07FA6801A8B59E1BE99)] | [removed: [59](#s9AE8D7718A32C2DB336BB42FF4212C34)] [added: [58](#s4B48ACF31C1BB07FA6801A8B59E1BE99)] |
| Item 11. | | [Executive [removed: Compensation](#sC1E155A6C82861C0651BB42FF44B55D1)] [added: Compensation](#s2E215993B7D37BCA7FE51A8B5A13DF9A)] | [removed: [61](#sC1E155A6C82861C0651BB42FF44B55D1)] [added: [60](#s2E215993B7D37BCA7FE51A8B5A13DF9A)] |
| Item 12. | | [Security Ownership of Certain Beneficial Owners and Management and Related Stockholder [removed: Matters](#s3D899D09CF542B2CB78EB42FF499C4F3)] [added: Matters](#sAEBCEE57708783B4ED2C1A8B5A2871BE)] | [removed: [61](#s3D899D09CF542B2CB78EB42FF499C4F3)] [added: [60](#sAEBCEE57708783B4ED2C1A8B5A2871BE)] |
| Item 13. | | [Certain Relationships and Related Transactions, and Director [removed: Independence](#sF52734BE853082502545B42FF4AA672B)] [added: Independence](#sABADCAC6DDD803BEFBD81A8B5A833C43)] | [removed: [61](#sF52734BE853082502545B42FF4AA672B)] [added: [60](#sABADCAC6DDD803BEFBD81A8B5A833C43)] |
| Item 14. | | [Principal Accountant Fees and [removed: Services](#s56F9ECC82D511DD73B58B42FF4C92B23)] [added: Services](#s39E4728F443ACF2939341A8B5A872A9B)] | [removed: [61](#s56F9ECC82D511DD73B58B42FF4C92B23)] [added: [60](#s39E4728F443ACF2939341A8B5A872A9B)] |
| Item 15. | | [Exhibits and Financial Statement [removed: Schedules](#sEA10E38C65F20E78CE0AB42FCEBBE136)] [added: Schedules](#sE62475C597E7B1AB8E1F1A8B4B65F975)] | [removed: [62](#sEA10E38C65F20E78CE0AB42FCEBBE136)] [added: [61](#sE62475C597E7B1AB8E1F1A8B4B65F975)] |
| Item 16. | | [Form 10-K [removed: Summary](#s7616d4d9ac07481cb74e82479d9a0c26)] [added: Summary](#s5148ECABDDFDFAA839811A8B5B01A091)] | [removed: [63](#s7616d4d9ac07481cb74e82479d9a0c26)] [added: [62](#s5148ECABDDFDFAA839811A8B5B01A091)] |
Portions of our Proxy Statement for the annual meeting of shareholders to be held Tuesday, April [removed: 25, 2017] [added: 24, 2018] ('Proxy Statement') are incorporated by reference in Part III.
Portions of our [removed: 2016] [added: 2017] Annual Report to Shareholders are incorporated by reference in Part II.
Our forward-looking statements generally relate to our expectations regarding the business environment in which we operate, our projections of future performance, our perceived marketplace opportunities, [removed: and] our strategies, goals, [removed: mission,] [added: mission] and [removed: vision.][added: vision, and our expectations related to the impact of tax reform.]
Factors that could cause our actual results to differ from those discussed in the forward-looking statements include, but are not limited to, economic downturns, weakness in the manufacturing or commercial construction industries, competitive pressure on selling prices, changes in our current mix of products, customers, or geographic locations, changes in our average [removed: store] [added: branch] size, changes in our purchasing patterns, changes in customer needs, changes in fuel or commodity prices, inclement weather, changes in foreign currency exchange rates, difficulty in adapting our business model to different foreign business environments, failure to accurately predict the market potential of our business strategies, the introduction or expansion of new business strategies, weak acceptance or adoption of our vending or Onsite business models, increased competition in industrial vending or Onsite, difficulty in maintaining installation quality as our industrial vending business expands, the leasing to customers of a significant number of additional industrial vending [removed: machines,] [added: devices,] the failure to meet our goals and expectations regarding [removed: store] [added: branch] openings, [removed: store] [added: branch] closings, or expansion of our industrial vending or Onsite operations, changes in the implementation objectives of our business strategies, difficulty in hiring, relocating, training, or retaining qualified personnel, difficulty in controlling operating expenses, difficulty in collecting receivables or accurately predicting future inventory needs, dramatic changes in sales trends, changes in supplier production lead times, changes in our cash position or our need to make capital expenditures, credit market volatility, changes in tax [removed: law,] [added: law or the impact of any such] changes [added: on future tax rates, changes] in the availability or price of commercial real estate, changes in the nature, price, or availability of distribution, supply chain, or other technology (including software licensed from third parties) and services related to that technology, cyber-security incidents, potential liability and reputational damage that can arise if our products are defective, and other risks and uncertainties detailed in this Form 10-K under the heading 'Item 1A.
All dollar amounts in this Form 10-K are presented in [removed: thousands,] [added: millions,] except for share and per share [removed: information] [added: amounts] or [removed: unless] [added: where] otherwise noted.
10-K 1 fast1231201710-k.htm 10-K
| | | Emerging Growth Company | o |
If an emerging growth company, indicate by check mark if the registrant has elected not to use the extended transition period for complying with any new or revised financial accounting standards provided pursuant to Section 13(a) of the Exchange Act.
| | | [PART I](#s5C433A2B3398CCAB1AF21A8B511F23E5) | |
| | | [PART II](#s79BCBCE8DA162DB324BC1A8B52368572) | |
| | | [PART IV](#s0148EFB858663F76587B1A8B5AADC6B0) | |
| | | [Signatures](#sF20DFDE1529DFC48FC491A8B5B602F5B) | [64](#sF20DFDE1529DFC48FC491A8B5B602F5B) |
Throughout this document, percentage and dollar change calculations, which are based on non-rounded dollar values, may not be able to be recalculated using the dollar values in this document due to the rounding of those dollar values.
10-K 1 fast1231201610-k.htm 10-K
| | | | |
| | | [PART I](#s9EEC082452EB95A54246B42FEBCED286) | |
| | | [PART II](#s5A21F66862417EABE33BB42FED1A323C) | |
| | | [PART IV](#s2FDDC6A096803E208449B42FF4E90005) | |
| | | [Signatures](#sE1443DB06144F0567427B42FF57EF922) | [65](#sE1443DB06144F0567427B42FF57EF922) |
| | | [Index to Exhibits](#sB22D5471C2C8C9113CFBB42FF5924C1E) | [66](#sB22D5471C2C8C9113CFBB42FF5924C1E) |
Item 2. PROPERTIES
15 rewritten, 4 added, 0 removed, 42 unchanged
Note – Information in this section is as of December 31, [removed: 2016,] [added: 2017,] unless otherwise noted.
| Winona [removed: store] [added: branch] | | | | | 15,000 | |
| Supplemental warehouse, office, and potential [removed: store space, which is subject to a pre-existing retail lease] [added: branch space] | | | | | 100,000 | |
| Distribution center | [removed: Dallas,] [added: Denton,] Texas | 41,000 | | (3) | 176,000 | |
| Distribution center | Kansas City, Kansas | [added: —] | | [added: (4)] | 300,000 | |
(2) This property contains an ASRS with capacity of 52,000 pallet locations, in addition to the 561,000 tote locations for small parts noted above; 105,000 of these small part tote locations are located in the industrial vending automated replenishment [removed: facility ('T-Hub'),] [added: facility,] which is also located on this property.
In addition, we own 179 buildings that house our [removed: store] [added: in-market] locations in various cities throughout North America.
Leased [removed: stores] [added: branches] range from approximately 3,000 to 10,000 square feet, with lease terms of up to 60 months (most initial lease terms are for 36 to 48 months).
In addition to our leased [removed: store] [added: branch] locations, we also lease the following facilities:
| Distribution center | Seattle, Washington [added: (1)] | | 100,000 | | | April [removed: 2017] [added: 2022] | | [removed: Two] [added: None] |
| Distribution center | Salt Lake City, Utah | | 74,000 | | | July [removed: 2017] [added: 2019] | | One |
| Distribution center and packaging facility | Salt Lake City, Utah | | 26,000 | | | July [removed: 2017] [added: 2019] | | One |
If economic conditions are suitable in the future, we will consider purchasing [removed: store] [added: branch] locations to house our older [removed: stores.][added: branches.]
It is anticipated the majority of new [removed: store] [added: branch] locations will continue to be leased.
It is our policy to negotiate relatively short lease terms to facilitate relocation of particular [removed: store] [added: branch] operations, when desirable.
(4) Construction of an ASRS began in 2017 at our Kansas distribution center, and we expect this project to be completed in the first quarter of 2018.
This facility will contain approximately 170,000 tote locations.
(1) We currently own land in the Seattle, Washington area for the construction of a new distribution center, which is scheduled to begin in 2018, and when completed, will replace the current leased facility.
We currently own land for future distribution center expansion and development.
Item 5. MARKET FOR REGISTRANT'S COMMON EQUITY, RELATED STOCKHOLDER MATTERS, AND ISSUER PURCHASES OF EQUITY SECURITIES
24 rewritten, 5 added, 5 removed, 27 unchanged
As of January [removed: 20, 2017,] [added: 19, 2018,] there were approximately 1,100 record holders of our common stock, which includes nominees or broker dealers holding stock on behalf of an estimated [removed: 205,000] [added: 220,000] beneficial owners.
The following table sets forth, by quarter, the high and low closing sale price(1) of our shares on The [removed: NASDAQ] [added: Nasdaq] Stock Market for [removed: 2016] [added: 2017] and [removed: 2015.][added: 2016.]
| [removed: 2016] [added: 2017] | High | | | | Low | | | | [removed: 2015] [added: 2016] | | High | | | | Low | | |
| First quarter | $ | [removed: 49.87] [added: 52.22] | | | $ | [removed: 36.53] [added: 46.17] | | | First quarter | | $ | [removed: 47.40] [added: 49.87] | | | $ | [removed: 39.82] [added: 36.53] | |
| Second quarter | [removed: 48.93] [added: 51.76] | | | | [removed: 42.70] [added: 42.10] | | | | Second quarter | | [removed: 43.41] [added: 48.93] | | | | [removed: 40.01] [added: 42.70] | | |
| Third quarter | [removed: 45.36] [added: 45.73] | | | | [removed: 39.92] [added: 39.97] | | | | Third quarter | | [removed: 42.82] [added: 45.36] | | | | [removed: 36.13] [added: 39.92] | | |
| Fourth quarter | [removed: 49.17] [added: 55.14] | | | | [removed: 38.16] [added: 44.51] | | | | Fourth quarter | | [removed: 41.64] [added: 49.17] | | | | [removed: 35.50] [added: 38.16] | | |
| First quarter | $ | [removed: 0.30] [added: 0.32] | | | $ | [removed: 0.28] [added: 0.30] | |
| Second quarter | [removed: 0.30] [added: 0.32] | | | | [removed: 0.28] [added: 0.30] | | |
| Third quarter | [removed: 0.30] [added: 0.32] | | | | [removed: 0.28] [added: 0.30] | | |
| Fourth quarter | [removed: 0.30] [added: 0.32] | | | | [removed: 0.28] [added: 0.30] | | |
| Total | $ | [removed: 1.20] [added: 1.28] | | | $ | [removed: 1.12] [added: 1.20] | |
On January [removed: 17, 2017,] [added: 16, 2018,] we announced a quarterly dividend of [removed: $0.32] [added: $0.37] per share to be paid on February [removed: 28, 2017] [added: 27, 2018] to shareholders of record at the close of business on [removed: February 1, 2017.][added: January 31, 2018.]
The table below sets forth information regarding purchases of our common stock during each of the last three months of [removed: 2016:][added: 2017:]
| October 1-31, [removed: 2016] [added: 2017] | 0 | | $0.00 | | | 0 | | [removed: 1,300,000] [added: 4,400,000] |
| November 1-30, [removed: 2016] [added: 2017] | 0 | | $0.00 | | | 0 | | [removed: 1,300,000] [added: 4,400,000] |
| December 1-31, [removed: 2016] [added: 2017] | 0 | | $0.00 | | | 0 | | [removed: 1,300,000] [added: 4,400,000] |
| Total | 0 | | $0.00 | | | 0 | | [removed: 1,300,000] [added: 4,400,000] |
As of December 31, [removed: 2016,] [added: 2017,] we had remaining authority to [removed: purchase 1,300,000] [added: repurchase 4,400,000] shares under this authorization.
Purchases of shares of our common stock throughout [removed: 2016] [added: 2017] are described later in this Form 10-K under the heading 'Item 7.
Set forth below is a graph comparing, for the five years ended December 31, [removed: 2016,] [added: 2017,] the yearly cumulative total shareholder return on our common stock with the yearly cumulative total shareholder return of the S&P 500 Index and the Dow Jones US Industrial Suppliers Index.
The comparison of total shareholder returns in the performance graph assumes that $100 was invested on December 31, [removed: 2011] [added: 2012] in Fastenal Company, the S&P 500 Index, and the Dow Jones US Industrial Suppliers Index, and that dividends were reinvested when and as paid.
[removed: ][added: 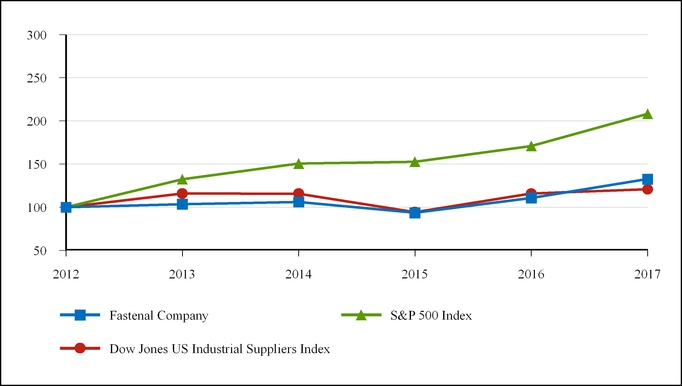]
| | | [removed: 2011 | |] 2012 | | 2013 | | 2014 | | 2015 | | 2016 | [added: | 2017 |]
| | 2017 | | | | 2016 | | |
(1) On July 11, 2017, our board of directors established a new authorization for us to repurchase up to 5,000,000 shares of our common stock.
| Fastenal Company | $ | 100.00 | | 103.56 | | 106.00 | | 93.47 | | 110.78 | | 132.57 |
| S&P 500 Index | | 100.00 | | 132.39 | | 150.51 | | 152.59 | | 170.84 | | 208.14 |
| Dow Jones US Industrial Suppliers Index | | 100.00 | | 115.76 | | 115.70 | | 94.31 | | 115.86 | | 120.80 |
| | 2016 | | | | 2015 | | |
(1) On May 1, 2015, our board of directors authorized the purchase by us of 4,000,000 shares of our common stock.
| Fastenal Company | $ | 100.00 | | 110.07 | | 113.98 | | 116.67 | | 102.88 | | 121.93 |
| S&P 500 Index | | 100.00 | | 116.00 | | 153.57 | | 174.60 | | 177.01 | | 198.18 |
| Dow Jones US Industrial Suppliers Index | | 100.00 | | 109.05 | | 126.24 | | 126.17 | | 102.85 | | 126.35 |
Item 6. SELECTED FINANCIAL DATA
1 rewritten, 0 added, 0 removed, 3 unchanged
Incorporated herein by reference is Ten-Year Selected Financial Data on pages 4 and 5 of Fastenal's [removed: 2016] [added: 2017] Annual Report to Shareholders of which this Form 10-K forms a part, a portion of which is filed as Exhibit 13 to this annual report on
Item 8. FINANCIAL STATEMENTS AND SUPPLEMENTARY DATA
178 rewritten, 226 added, 170 removed, 348 unchanged
[removed: The Board of Directors] [added: To the shareholders] and [removed: Stockholders] [added: board] of [removed: Fastenal Company:][added: directors of]
We have audited the accompanying consolidated balance sheets of Fastenal Company and subsidiaries [added: (the 'Company')] as of December 31, [removed: 2016 and 2015,] [added: 2017] and [added: 2016,] the related consolidated statements of earnings, comprehensive income, [removed: stockholders'] [added: stockholders’] equity, and cash flows for each of the years in the three-year period ended December 31, [removed: 2016.][added: 2017, and the related notes and financial statement schedule listed in the table of contents at Item 15 (collectively, the 'consolidated financial statements').]
We also have audited the Company's internal control over financial reporting as of December 31, [removed: 2016,] [added: 2017,] based on criteria established in Internal Control [removed: –] [added: -] Integrated Framework (2013) issued by the Committee of Sponsoring Organizations of the Treadway [removed: Commission (COSO).][added: Commission.]
[removed: Fastenal] [added: The] Company's management is responsible for these consolidated financial [removed: statements and the financial statement schedule,] [added: statements,] for maintaining effective internal control over financial reporting, and for its assessment of the effectiveness of internal control over financial reporting, included in the accompanying Management's Report on Internal Control Over Financial Reporting.
Our responsibility is to express an opinion on [removed: these] [added: the Company's] consolidated financial statements and [removed: the financial statement schedule and] an opinion on the Company's internal control over financial reporting based on our audits.
We conducted our audits in accordance with the standards of the [removed: Public Company Accounting Oversight Board (United States).][added: PCAOB.]
Those standards require that we plan and perform the audits to obtain reasonable assurance about whether the [added: consolidated] financial statements are free of material [removed: misstatement] [added: misstatement, whether due to error or fraud,] and whether effective internal control over financial reporting was maintained in all material respects.
Our audits [removed: of the consolidated financial statements] [added: also] included [removed: examining, on a test basis, evidence supporting the amounts and disclosures in the financial statements, assessing] [added: evaluating] the accounting principles used and significant estimates made by management, [removed: and] [added: as well as] evaluating the overall [added: presentation of the consolidated] financial [removed: statement presentation.][added: statements.]
In our opinion, the consolidated financial statements referred to above present fairly, in all material respects, the financial position of [removed: Fastenal] [added: the] Company [removed: and subsidiaries] as of December 31, [removed: 2016] [added: 2017] and [removed: 2015,] [added: 2016,] and the results of [removed: their] [added: its] operations and [removed: their] [added: its] cash flows for each of the years in the three-year period ended December 31, [removed: 2016,] [added: 2017,] in conformity with U.S. generally accepted accounting principles.
Also in our opinion, [removed: Fastenal] [added: the] Company [removed: and subsidiaries] maintained, in all material respects, effective internal control over financial reporting as of December 31, [removed: 2016,] [added: 2017,] based on criteria established in Internal Control [removed: –] [added: -] Integrated Framework (2013) issued by [removed: COSO.][added: the Committee of Sponsoring Organizations of the Treadway Commission.]
(Amounts in [removed: thousands] [added: millions] except share information)
| | [removed: 2016] [added: 2017] | | | | [added: 2016 | | |] 2015 | |
| Trade accounts receivable, net of allowance for doubtful accounts of [removed: $11,249] [added: $11.9] and [removed: $11,729,] [added: $11.2,] respectively | [removed: 499,716] [added: 607.8] | | | | [removed: 468,375] [added: 499.7] | |
| Prepaid income taxes | [removed: 12,907] [added: —] | | | | [removed: 22,558] [added: 12.9] | |
| Property and equipment, net | [removed: 899,697] [added: 893.6] | | | | [removed: 818,889] [added: 899.7] | |
| Current portion of debt | $ | [removed: 10,482] [added: 3.0] | | | [removed: 62,050] [added: 10.5] | |
| Deferred income tax liabilities | [removed: 80,628] [added: 50.6] | | | | [removed: 55,057] [added: 80.6] | |
| Commitments and contingencies (Notes [removed: 4, 8,] [added: 5, 9, 10,] and [removed: 9)] [added: 11)] | | | | | | |
| Preferred [removed: stock,] [added: stock:] $0.01 par value, 5,000,000 shares [removed: authorized;] [added: authorized,] no shares issued or outstanding | — | | | | — | |
| Common [removed: stock,] [added: stock:] $0.01 par value, 400,000,000 shares [removed: authorized; 289,161,924] [added: authorized, 287,591,536] and [removed: 289,581,682] [added: 289,161,924] shares issued and outstanding, respectively | [removed: 2,892] [added: 2.9] | | | | [removed: 2,896] [added: 2.9] | |
| Additional paid-in capital | [removed: 37,363] [added: 8.5] | | | | [removed: 2,024] [added: 37.4] | |
| [removed: Accumulated other] [added: Other] comprehensive income (loss) | [removed: (47,304] [added: —] | | [added: | — | | | | — | | | — | | | (38.6 |] ) | | [removed: (46,403] [added: (38.6] | ) |
| Total liabilities and stockholders’ equity | $ | [removed: 2,668,884] [added: 2,910.5] | | | [removed: 2,532,462] [added: 2,668.9] | |
(Amounts in [removed: thousands] [added: millions] except earnings per share)
| | [removed: 2016] [added: 2017] | | | | [removed: 2015] [added: 2016] | | | [removed: 2014] [added: 2015] | |
| Gain on sale of property and equipment | [removed: (532] [added: (1.0] | | ) | | [removed: (1,411] [added: (0.5] | ) | | [removed: (964] [added: (1.4] | ) |
| Basic net earnings per share | $ | [removed: 1.73] [added: 2.01] | | | [removed: 1.77] [added: 1.73] | | | [removed: 1.67] [added: 1.77] | |
| Diluted net earnings per share | $ | [removed: 1.73] [added: 2.01] | | | [removed: 1.77] [added: 1.73] | | | [removed: 1.66] [added: 1.77] | |
| Basic weighted average shares outstanding | [removed: 288,950 |] [added: 288,208,435] | | | [removed: 291,453] [added: 288,949,525] | | | [removed: 296,490] [added: 291,453,107] | |
| Diluted weighted average shares outstanding | [removed: 289,158 |] [added: 288,342,733] | | | [removed: 292,045] [added: 289,157,523] | | | [removed: 297,313] [added: 292,045,442] | |
| Foreign currency translation adjustments (net of tax of [removed: $0] [added: $0.0] in [added: 2017,] 2016, [removed: 2015,] and [removed: 2014)] [added: 2015)] | [removed: (901] [added: 22.2] | | [removed: )] | | [removed: (38,567] [added: (0.9] | ) | | [removed: (18,683] [added: (38.6] | ) |
| Dividends paid in cash | — | | | — | | | | — | | | [removed: (296,581] [added: (327.1] | ) | | — | | | [removed: (296,581] [added: (327.1] | ) |
| Stock-based compensation | — | | | — | | | | [removed: 7,039] [added: 5.8] | | | — | | | — | | | [removed: 7,039] [added: 5.8] | |
| Excess tax benefits from stock-based compensation | — | | | — | | | | [removed: 2,094] [added: 3.4] | | | — | | | — | | | [removed: 2,094] [added: 3.4] | |
| Net earnings | — | | | — | | | | — | | | [removed: 494,150] [added: 516.4] | | | — | | | [removed: 494,150] [added: 516.4] | |
| Other comprehensive income (loss) | — | | | — | | | | — | | | — | | | [removed: (18,937] [added: (0.9] | ) | | [removed: (18,937] [added: (0.9] | ) |
| Dividends paid in cash | — | | | — | | | | — | | | [removed: (327,101] [added: (346.6] | ) | | — | | | [removed: (327,101] [added: (346.6] | ) |
| Stock-based compensation | — | | | — | | | | [removed: 5,841] [added: 4.1] | | | — | | | — | | | [removed: 5,841] [added: 4.1] | |
| Excess tax benefits from stock-based compensation | — | | | — | | | | [removed: 3,390] [added: 5.9] | | | — | | | — | | | [removed: 3,390] [added: 5.9] | |
| Net earnings | — | | | — | | | | — | | | [removed: 516,361] [added: 499.4] | | | — | | | [removed: 516,361] [added: 499.4] | |
Fastenal Company:
Opinions on the Consolidated Financial Statements and Internal Control Over Financial Reporting
Fastenal Company acquired certain assets and assumed certain liabilities of Manufacturers Supply Company (‘Mansco’) on March 31, 2017, and management excluded from their assessment of the effectiveness of internal control over financial reporting as of December 31, 2017, Mansco's internal control over financial reporting associated with assets of approximately one percent of Fastenal Company's total assets and revenues of approximately one percent of Fastenal Company's total revenues included in the consolidated financial statements of Fastenal Company and subsidiaries as of and for the year ended December 31, 2017.
Our audit of internal control over financial reporting of Fastenal Company also excluded an evaluation of the internal control over financial reporting of Mansco.
Basis for Opinion
We are a public accounting firm registered with the Public Company Accounting Oversight Board (United States) ('PCAOB') and are required to be independent with respect to the Company in accordance with the U.S. federal securities laws and the applicable rules and regulations of the Securities and Exchange Commission and the PCAOB.
Our audits of the consolidated financial statements included performing procedures to assess the risks of material misstatement of the consolidated financial statements, whether due to error or fraud, and performing procedures that respond to those risks.
Such procedures included examining, on a test basis, evidence regarding the amounts and disclosures in the consolidated financial statements.
Definition and Limitations of Internal Control Over Financial Reporting
We have served as the Company’s auditor since 1987.
February 5, 2018
| | 2017 | | | | 2016 | |
| Cash and cash equivalents | $ | 116.9 | | | 112.7 | |
| Inventories | 1,092.9 | | | | 993.0 | |
| Other current assets | 118.1 | | | | 102.5 | |
| Total current assets | 1,935.7 | | | | 1,720.8 | |
| Other assets | 81.2 | | | | 48.4 | |
| Total assets | $ | 2,910.5 | | | 2,668.9 | |
| Accounts payable | 147.5 | | | | 108.8 | |
| Accrued expenses | 194.0 | | | | 156.4 | |
| Income taxes payable | 6.5 | | | | — | |
| Total current liabilities | 351.0 | | | | 275.7 | |
| Long-term debt | 412.0 | | | | 379.5 | |
| Retained earnings | 2,110.6 | | | | 1,940.1 | |
| Accumulated other comprehensive loss | (25.1 | | ) | | (47.3 | ) |
| Total stockholders’ equity | 2,096.9 | | | | 1,933.1 | |
| Net sales | $ | 4,390.5 | | | 3,962.0 | | | 3,869.2 | |
| Cost of sales | 2,226.9 | | | | 1,997.2 | | | 1,920.3 | |
| Gross profit | 2,163.6 | | | | 1,964.8 | | | 1,948.9 | |
| Operating and administrative expenses | 1,282.8 | | | | 1,169.5 | | | 1,121.5 | |
| Operating income | 881.8 | | | | 795.8 | | | 828.8 | |
| Interest income | 0.4 | | | | 0.4 | | | 0.4 | |
| Interest expense | (9.1 | | ) | | (6.5 | ) | | (3.1 | ) |
| Earnings before income taxes | 873.1 | | | | 789.7 | | | 826.1 | |
| Income tax expense | 294.5 | | | | 290.3 | | | 309.7 | |
| Net earnings | $ | 578.6 | | | 499.4 | | | 516.4 | |
| Basic weighted average shares outstanding | 288.2 | | | | 288.9 | | | 291.5 | |
| Diluted weighted average shares outstanding | 288.3 | | | | 289.2 | | | 292.0 | |
(Amounts in millions)
| Net earnings | $ | 578.6 | | | 499.4 | | | 516.4 | |
In connection with our audits of the consolidated financial statements, we also have audited the financial statement schedule listed in the table of contents at Item 15.
Also, in our opinion, the related financial statement schedule, when considered in relation to the basic consolidated financial statements taken as a whole, presents fairly, in all material respects, the information set forth therein.
February 6, 2017
| Cash and cash equivalents | $ | 112,735 | | | 129,019 | |
| Inventories | 992,989 | | | | 913,263 | |
| Other current assets | 102,423 | | | | 131,561 | |
| Total current assets | 1,720,770 | | | | 1,664,776 | |
| Other assets, net | 48,417 | | | | 48,797 | |
| Total assets | $ | 2,668,884 | | | 2,532,462 | |
| Accounts payable | 108,740 | | | | 125,973 | |
| Accrued expenses | 156,422 | | | | 185,143 | |
| Total current liabilities | 275,644 | | | | 373,166 | |
| Long-term debt | 379,518 | | | | 302,950 | |
| Retained earnings | 1,940,143 | | | | 1,842,772 | |
| Total stockholders’ equity | 1,933,094 | | | | 1,801,289 | |
| Net sales | $ | 3,962,036 | | | 3,869,187 | | | 3,733,507 | |
| Cost of sales | 1,997,259 | | | | 1,920,253 | | | 1,836,105 | |
| Gross profit | 1,964,777 | | | | 1,948,934 | | | 1,897,402 | |
| Operating and administrative expenses | 1,169,470 | | | | 1,121,590 | | | 1,110,776 | |
| Operating income | 795,839 | | | | 828,755 | | | 787,590 | |
| Interest income | 394 | | | | 373 | | | 759 | |
| Interest expense | (6,504 | | ) | | (3,108 | ) | | (915 | ) |
| Earnings before income taxes | 789,729 | | | | 826,020 | | | 787,434 | |
| Income tax expense | 290,251 | | | | 309,659 | | | 293,284 | |
| Net earnings | $ | 499,478 | | | 516,361 | | | 494,150 | |
(Amounts in thousands)
| Change in marketable securities (net of tax of $0 in 2016, 2015, and 2014) | — | | | | — | | | (254 | ) |
| Comprehensive income | $ | 498,577 | | | 477,794 | | | 475,213 | |
| | | | | | | | | | | | | | | | | | | |
| --- | --- | --- | --- | --- | --- | --- | --- | --- | --- | --- | --- | --- | --- | --- | --- | --- | --- | --- |
| Balance as of December 31, 2013 | 296,753 | | | $ | 2,968 | | | 69,847 | | | 1,688,781 | | | 11,101 | | | 1,772,697 | |
| Purchases of common stock | (1,200 | ) | | (12 | | ) | | (52,930 | ) | | — | | | — | | | (52,942 | ) |
| Stock options exercised | 315 | | | 3 | | | | 7,694 | | | — | | | — | | | 7,697 | |
| Balance as of December 31, 2014 | 295,868 | | | $ | 2,959 | | | 33,744 | | | 1,886,350 | | | (7,836 | ) | | 1,915,217 | |
| Purchases of common stock | (7,100 | ) | | (71 | | ) | | (60,042 | ) | | (232,838 | ) | | — | | | (292,951 | ) |
| Stock options exercised | 814 | | | 8 | | | | 19,091 | | | — | | | — | | | 19,099 | |
| Balance as of December 31, 2015 | 289,582 | | | $ | 2,896 | | | 2,024 | | | 1,842,772 | | | (46,403 | ) | | 1,801,289 | |
| Purchases of common stock | (1,600 | ) | | (16 | | ) | | (3,905 | ) | | (55,519 | ) | | — | | | (59,440 | ) |
| Stock options exercised | 1,180 | | | 12 | | | | 29,260 | | | — | | | — | | | 29,272 | |
| Excess tax benefits from stock-based compensation | — | | | — | | | | 5,884 | | | — | | | — | | | 5,884 | |
An excerpt. Shown here: 40 of 178 rewritten, 40 of 226 added and 40 of 170 removed. The counts are complete. For every sentence, read Item 8. FINANCIAL STATEMENTS AND SUPPLEMENTARY DATA in the FY2017 filing and the FY2016 filing.
Item 9A. CONTROLS AND PROCEDURES
1 rewritten, 4 added, 1 removed, 32 unchanged
Based on our assessment and those criteria, management believes that the [removed: Company] [added: company] maintained effective internal control over financial reporting as of December 31, [removed: 2016.][added: 2017.]
We have excluded Mansco from our assessment of the effectiveness of our internal control over financial reporting as of December 31, 2017, which represented 0.8% of total assets and 0.9% of net sales included in our consolidated financial statements as of and for the year ended December 31, 2017.
As discussed in Note 2 of the Notes to Consolidated Financial Statements, on March 31, 2017, we acquired certain assets and assumed certain liabilities of Manufacturers Supply Company (‘Mansco’).
We have excluded Mansco from our assessment of the effectiveness of our internal control over financial reporting as of December 31, 2017, which represented 0.8% of total assets and 0.9% of net sales included in our consolidated financial statements as of and for the year ended December 31, 2017.
| February 5, 2018 | | |
| February 6, 2017 | | |
Item 10. DIRECTORS, EXECUTIVE OFFICERS, AND CORPORATE GOVERNANCE
31 rewritten, 1 added, 0 removed, 60 unchanged
| Daniel L. Florness | 1996 | | [removed: 53] [added: 54] | | President, Chief Executive Officer, and Director |
| William J. Drazkowski | 1995 | | [removed: 45] [added: 46] | | Executive Vice President – National Accounts Sales |
| Leland J. Hein | 1985 | | [removed: 56] [added: 57] | | Senior Executive Vice President – Sales |
| James C. Jansen | 1992 | | [removed: 46] [added: 47] | | Executive Vice President – Manufacturing |
| Holden Lewis | 2016 | | [removed: 47] [added: 48] | | Executive Vice President and Chief Financial Officer |
| Sheryl A. Lisowski | 1994 | | [removed: 49] [added: 50] | | Controller, Chief Accounting Officer, and Treasurer |
| Nicholas J. Lundquist | 1979 | | [removed: 59] [added: 60] | | Senior Executive Vice President – Operations |
| Charles S. Miller | 1999 | | [removed: 42] [added: 43] | | Executive Vice President – Sales |
| Terry M. Owen | 1999 | | [removed: 48] [added: 49] | | Senior Executive Vice President – Sales Operations |
| Gary A. Polipnick | 1983 | | [removed: 54] [added: 55] | | Executive Vice President – FAST Solutions® |
| John L. Soderberg | 1993 | | [removed: 45] [added: 46] | | Executive Vice President – Information Technology |
| Jeffery M. Watts | 1996 | | [removed: 45] [added: 46] | | Executive Vice President – International Sales |
| Reyne K. Wisecup | 1988 | | [removed: 53] [added: 54] | | Senior Executive Vice President – Human Resources and Director |
During his time as chief financial officer, Mr. Florness' responsibilities expanded beyond finance, including leadership of [added: a portion of our manufacturing division, our] product development and [removed: procurement] [added: procurement,] and the company's national accounts business.
Mr. Drazkowski has been our executive vice president [removed: -] [added: –] national accounts sales since December 2016.
From October 2014 to December 2016, Mr. Drazkowski was our vice president [removed: -] [added: –] national accounts sales.
Mr. Hein's responsibilities include sales and operational oversight of our [removed: western] [added: Western] United States [removed: business.][added: business, which spans from Ohio to the West Coast.]
Mr. Jansen's responsibilities include oversight of our [added: industrial services, quality assurance, aerospace, and] manufacturing operations.
Mr. Lundquist has been our senior executive vice president [removed: -] [added: –] operations since December 2016.
From July 2012 to December 2016, Mr. Lundquist was our executive vice president [removed: -] [added: –] operations.
From November 2007 to July 2012, he was one of our executive vice presidents [removed: -] [added: –] sales, and from December 2002 to November 2007, he was our executive vice president and chief operating officer.
Mr. Miller has been our executive vice president [removed: -] [added: –] sales since November 2015.
Mr. Miller's responsibilities include sales and operational oversight of our [removed: eastern] [added: business which spans the East Coast of, and Southern and Southwestern areas of, the] United [removed: States business.][added: States.]
Mr. Polipnick's responsibilities include our FAST Solutions® programs and [removed: store] [added: branch] inventory modeling and merchandising programs.
From May 2014 to May 2016, Mr. Soderberg served as our executive vice president [removed: -] [added: –] sales operations and support.
From April 2005 to April 2010, Mr. Soderberg served as regional vice president of our [added: Seattle,] Washington based region.
Prior to April 2005, Mr. Soderberg served in various sales leadership roles [removed: at] [added: in the mid-Atlantic area of] our [removed: Company.][added: company.]
Mr. Watts has been our executive vice president [removed: -] [added: –] international sales since December 2016.
From March 2015 to December 2016, Mr. Watts was our vice president [removed: -] [added: –] international sales.
Ms. Wisecup has been our senior executive vice president [removed: -] [added: –] human resources since December 2016.
From November 2007 to December 2016, Ms. Wisecup was our executive vice president [removed: -] [added: –] human resources.
After 34 years with Fastenal, Mr. Polipnick has indicated his intention to retire effective March 31, 2018.
Item 12. SECURITY OWNERSHIP OF CERTAIN BENEFICIAL OWNERS AND MANAGEMENT AND RELATED STOCKHOLDER MATTERS
2 rewritten, 10 added, 5 removed, 4 unchanged
| Plan Category | Number of Securities to be Issued Upon Exercise of Outstanding Options, Warrants, and Rights | | [added: |] Weighted-Average Exercise Price of Outstanding Options, Warrants, and Rights | | [added: | |] Number of Securities Remaining Available for Future Issuance Under Equity Compensation Plans (Excluding Securities Reflected in Column (a)) | [added: |]
| Equity compensation plans not approved by security holders [added: (2)] | [removed: —] [added: 21,185] | | [removed: —] | [added: 55.00] | [removed: —] | [added: | | 2,478,815 | |]
| | | | | | | | | | |
| --- | --- | --- | --- | --- | --- | --- | --- | --- | --- |
| | | | | | | | | | |
| | (a) | | | (b) | | | | (c) | |
| Equity compensation plans approved by security holders (1) | 3,948,908 | | | $ | 48.28 | | | 5,169,233 | |
| Total | 3,970,093 | | | | | | | 7,648,048 | |
(1) Reflects securities to be issued under our Fastenal Company Stock Option Plan.
| (2) | Reflects stock option awards issued and issuable in the future under the Fastenal Company Non-Employee Director Stock Option Plan, which was approved by our board of directors on October 10, 2017 but has not yet been approved by our shareholders. Our shareholders are being asked to approve this plan at our April 2018 annual meeting, and the exercisability and continued existence of the plan and all option awards currently outstanding thereunder is expressly conditioned on shareholder approval of that plan at the annual meeting. A description of the material terms of the plan and a summary of option awards currently outstanding thereunder will be provided in the Proxy Statement. |
| | |
| --- | --- |
| | | | | | |
| --- | --- | --- | --- | --- | --- |
| | (a) | | (b) | | (c) |
| Equity compensation plans approved by security holders | 3,757,947 | | $46.81 | | 5,695,743 |
| Total | 3,757,947 | | | | 5,695,743 |
Item 15. EXHIBITS AND FINANCIAL STATEMENT SCHEDULES
17 rewritten, 16 added, 4 removed, 17 unchanged
Consolidated Balance Sheets as of December 31, [removed: 2016] [added: 2017] and [removed: 2015][added: 2016]
Consolidated Statements of Earnings for the years ended December 31, [added: 2017,] 2016, [removed: 2015,] and [removed: 2014][added: 2015]
Consolidated Statements of Comprehensive Income for the years ended December 31, [added: 2017,] 2016, [removed: 2015,] and [removed: 2014][added: 2015]
Consolidated Statements of Stockholders' Equity for the years ended December 31, [added: 2017,] 2016, [removed: 2015,] and [removed: 2014][added: 2015]
Consolidated Statements of Cash Flows for the years ended December 31, [added: 2017,] 2016, [removed: 2015,] and [removed: 2014][added: 2015]
| 3.1 | [removed: Restated] [added: [Restated] Articles of Incorporation of Fastenal Company, as amended (incorporated by reference to Exhibit 3.1 to Fastenal Company's Form 10-Q for the quarter ended March 31, [removed: 2012)] [added: 2012 (file no. 000-016125))](http://www.sec.gov/Archives/edgar/data/815556/000119312512172121/d310097dex31.htm)] |
| 3.2 | [removed: Restated] [added: [Restated] By-Laws of Fastenal Company (incorporated by reference to Exhibit 3.2 to Fastenal Company's Form 8-K dated as of October 15, 2010 (file no. [removed: 000-16125))] [added: 000-16125))](http://www.sec.gov/Archives/edgar/data/815556/000119312510229904/dex32.htm)] |
| 4.1 | [removed: Form] [added: [Form] of Senior Notes due July 20, 2021 (incorporated by reference to Exhibit 4.1 to Fastenal Company’s Form 8‑K dated as of July 20, [removed: 2016)] [added: 2016)](http://www.sec.gov/Archives/edgar/data/815556/000081555616000115/exhibit41.htm)] |
| 4.2 | [removed: Form] [added: [Form] of Senior Notes due July 20, 2022 (incorporated by reference to Exhibit 4.2 to Fastenal Company’s Form 8‑K dated as of July 20, [removed: 2016)] [added: 2016)](http://www.sec.gov/Archives/edgar/data/815556/000081555616000115/exhibit42.htm)] |
| 10.2 | [removed: Fastenal] [added: [Fastenal] Company Stock Option Plan as amended and restated effective as of December 12, 2014 (incorporated by reference to Exhibit 10.1 to Fastenal Company's Form 8-K dated December 17, [removed: 2014)*] [added: 2014)*](http://www.sec.gov/Archives/edgar/data/815556/000081555614000073/exhibit101stockoptionplana.htm)] |
| 10.3 | [removed: Fastenal] [added: [Fastenal] Company Incentive Plan (incorporated by reference to Appendix A to Fastenal Company's Proxy Statement dated February 23, [removed: 2012)*] [added: 2012)*](http://www.sec.gov/Archives/edgar/data/815556/000119312512074269/d296107ddef14a.htm)] |
| 10.4 | [removed: Credit] [added: [Credit] Agreement dated as of May 1, 2015 among Fastenal Company, the Lenders from time to time party thereto, and Wells Fargo Bank, National Association, as Administrative Agent, Swingline Lender and Issuing Lender (incorporated by reference to Exhibit 10.1 to Fastenal Company's Form 8-K dated May 5, 2015), as amended by the First Amendment to Credit Agreement dated as of November 23, 2015 (incorporated by reference to Exhibit 10.1 to Fastenal Company's Form 8-K dated November 25, [removed: 2015)] [added: 2015), and as amended by the Second Amendment to Credit Agreement dated as of March 10, 2017 (incorporated by reference to Exhibit 10.1 to Fastenal Company's Form 8-K dated March 14, 2017)](http://www.sec.gov/Archives/edgar/data/815556/000081555615000036/exhibit10105012015creditag.htm)] |
| [removed: 10.5] [added: 10.6] | [removed: Master] [added: [Master] Note Agreement dated as of July 20, 2016 by and among (i) Fastenal Company, (ii) Metropolitan Life Insurance Company, NYL Investors LLC and PGIM, Inc. (formerly known as Prudential Investment Management, Inc.), as investor group representatives (each, an 'Investor Group Representative'), and (iii) Metropolitan Life Insurance Company (in its capacity as a purchaser of notes under such Master Note Agreement) and/or affiliates of any Investor Group Representative who become purchasers of notes under such Master Note Agreement (incorporated by reference to Exhibit 10.1 to Fastenal Company’s Form 8‑K dated as of July 20, [removed: 2016)] [added: 2016)](http://www.sec.gov/Archives/edgar/data/815556/000081555616000115/exhibit101agreement07202016.htm)] |
| 13 | [removed: Portions] [added: [Portions] of [removed: 2016] [added: 2017] Annual Report to Shareholders not included in this Form 10-K (only those sections specifically incorporated by reference in this Form 10-K shall be deemed filed with the [removed: SEC)] [added: SEC)](https://www.sec.gov/Archives/edgar/data/815556/000081555618000010/final2017annualreportweb.htm)] |
| 23 | [removed: Consent] [added: [Consent] of Independent Registered Public Accounting [removed: Firm] [added: Firm](https://www.sec.gov/Archives/edgar/data/815556/000081555618000010/fast1231201710-kexhibit23.htm)] |
| 31 | [removed: Certifications] [added: [Certifications] under Section 302 of the Sarbanes-Oxley Act of [removed: 2002] [added: 2002](https://www.sec.gov/Archives/edgar/data/815556/000081555618000010/fast1231201710-kexhibit31.htm)] |
| 32 | [removed: Certification] [added: [Certification] under Section 906 of the Sarbanes-Oxley Act of [removed: 2002] [added: 2002](https://www.sec.gov/Archives/edgar/data/815556/000081555618000010/fast1231201710-kexhibit32.htm)] |
INDEX TO EXHIBITS
| Exhibit Number | Description of Document |
| 4.3 | [Form of Senior Notes due March 1, 2024 (incorporated by reference to Exhibit 4.1 to Fastenal Company's Form 10-Q for the quarter ended March 31, 2017 (file no. 000-016125))](http://www.sec.gov/Archives/edgar/data/815556/000081555617000021/fast33117ex_41.htm) |
| 10.1 | [Bonus Program for Executive Officers*](https://www.sec.gov/Archives/edgar/data/815556/000081555618000010/fast1231201710-kexhibit101.htm) |
| 10.5 | [Second Amendment to Credit Agreement dated as of March 10, 2017 by and among Fastenal Company, the lenders party thereto and Wells Fargo Bank, National Association, as Administrative Agent (incorporated by reference to Exhibit 10.1 to Fastenal Company's Form 8-K dated as of March 14, 2017 (file no. 000-016125))](http://www.sec.gov/Archives/edgar/data/815556/000081555617000015/exhibit101creditfacilityse.htm) |
| 21 | [List of Subsidiaries](https://www.sec.gov/Archives/edgar/data/815556/000081555618000010/fast1231201710-kexhibit21.htm) |
| | |
| Exhibit Number | Description of Document |
| 101.INS | XBRL Instance Document |
| 101.SCH | XBRL Taxonomy Extension Schema Document |
| 101.CAL | XBRL Taxonomy Calculation Linkbase Document |
| 101.DEF | XBRL Taxonomy Definition Linkbase Document |
| 101.LAB | XBRL Taxonomy Label Linkbase Document |
| 101.PRE | XBRL Taxonomy Presentation Linkbase Document |
| | |
| --- | --- |
| 10.1 | Description of Bonus Arrangements for Executive Officers (incorporated by reference to the information appearing under the heading 'Executive Compensation – Compensation Discussion and Analysis' in the Proxy Statement)* |
| 21 | List of Subsidiaries |
| 101 | The following financial statements from Fastenal Company's Annual Report on Form 10-K for the year ended December 31, 2016, filed on February 6, 2017, formatted in XBRL (Extensible Business Reporting Language): (i) the Consolidated Balance Sheets, (ii) the Consolidated Statements of Earnings, (iii) the Consolidated Statements of Comprehensive Income, (iv) the Consolidated Statements of Stockholders' Equity, (v) the Consolidated Statements of Cash Flows, and (vi) the Notes to Consolidated Financial Statements |
We will furnish copies of these Exhibits upon request and payment of our reasonable expenses in furnishing the Exhibits.
Item 16. FORM 10-K SUMMARY
3 rewritten, 8 added, 30 removed, 51 unchanged
Years ended December 31, [added: 2017,] 2016, [removed: 2015,] and [removed: 2014][added: 2015]
| Year ended December 31, [removed: 2014] [added: 2017] | | | | | | | | | | | | | | | |
| Date: | | February [removed: 6, 2017] [added: 5, 2018] |
(Amounts in millions)
| Allowance for doubtful accounts | $ | 11.2 | | | 8.2 | | | — | | | 7.5 | | | 11.9 | |
| Insurance reserves | $ | 34.6 | | | 68.2 | | (1) | — | | | 63.8 | | (2) | 39.0 | |
| Allowance for doubtful accounts | $ | 11.7 | | | 8.5 | | | — | | | 9.0 | | | 11.2 | |
| Insurance reserves | $ | 31.8 | | | 62.3 | | (1) | — | | | 59.5 | | (2) | 34.6 | |
| Allowance for doubtful accounts | $ | 12.6 | | | 8.8 | | | — | | | 9.7 | | | 11.7 | |
| Insurance reserves | $ | 31.1 | | | 54.3 | | (1) | — | | | 53.6 | | (2) | 31.8 | |
| Date: | | February 5, 2018 |
(Amounts in thousands)
| Allowance for doubtful accounts | $ | 11,729 | | | 8,550 | | | — | | | 9,030 | | | 11,249 | |
| Insurance reserves | $ | 31,821 | | | 62,313 | | (1) | — | | | 59,494 | | (2) | 34,640 | |
| Allowance for doubtful accounts | $ | 12,619 | | | 8,769 | | | — | | | 9,659 | | | 11,729 | |
| Insurance reserves | $ | 31,137 | | | 54,341 | | (1) | — | | | 53,657 | | (2) | 31,821 | |
| Allowance for doubtful accounts | $ | 9,248 | | | 11,480 | | | — | | | 8,109 | | | 12,619 | |
| Insurance reserves | $ | 30,880 | | | 52,858 | | (1) | — | | | 52,601 | | (2) | 31,137 | |
| | | |
| --- | --- | --- |
INDEX TO EXHIBITS
| 3.1 | Restated Articles of Incorporation of Fastenal Company, as amended | Incorporated by Reference |
| 3.2 | Restated By-Laws of Fastenal Company | Incorporated by Reference |
| 4.1 | Form of Senior Notes due July 20, 2021 | Incorporated by Reference |
| 4.2 | Form of Senior Notes due July 20, 2022 | Incorporated by Reference |
| 10.1 | Description of Bonus Arrangements for Executive Officers | Incorporated by Reference |
| 10.2 | Fastenal Company Stock Option Plan as amended and restated effective as of December 12, 2014 | Incorporated by Reference |
| 10.3 | Fastenal Company Incentive Plan | Incorporated by Reference |
| 10.4 | Credit Agreement dated as of May 1, 2015 among Fastenal Company, the Lenders from time to time party thereto, and Wells Fargo Bank, National Association, as Administrative Agent, Swingline Lender and Issuing Lender, as amended by the First Amendment to Credit Agreement dated as of November 23, 2015 | Incorporated by Reference |
| 10.5 | Master Note Agreement dated as of July 20, 2016 by and among (i) Fastenal Company, (ii) Metropolitan Life Insurance Company, NYL Investors LLC and PGIM, Inc. (formerly known as Prudential Investment Management, Inc.), as investor group representatives (each, an 'Investor Group Representative'), and (iii) Metropolitan Life Insurance Company (in its capacity as a purchaser of notes under such Master Note Agreement) and/or affiliates of any Investor Group Representative who become purchasers of notes under such Master Note Agreement | Incorporated by Reference |
| 13 | Portions of 2016 Annual Report to Shareholders not included in this Form 10-K (only those sections specifically incorporated by reference in this Form 10-K shall be deemed filed with the SEC) | Electronically Filed |
| 21 | List of Subsidiaries | Electronically Filed |
| 23 | Consent of Independent Registered Public Accounting Firm | Electronically Filed |
| 31 | Certifications under Section 302 of the Sarbanes-Oxley Act of 2002 | Electronically Filed |
| 32 | Certification under Section 906 of the Sarbanes-Oxley Act of 2002 | Electronically Filed |
| EX 101.INS | XBRL Instance Document | Electronically Filed |
| EX 101.SCH | XBRL Taxonomy Extension Schema Document | Electronically Filed |
| EX 101.CAL | XBRL Taxonomy Calculation Linkbase Document | Electronically Filed |
| EX 101.DEF | XBRL Taxonomy Definition Linkbase Document | Electronically Filed |
| EX 101.LAB | XBRL Taxonomy Label Linkbase Document | Electronically Filed |
| EX 101.PRE | XBRL Taxonomy Presentation Linkbase Document | Electronically Filed |